Abstract
The present study aimed to elucidate how Atlantic salmon adipocytes pre-enriched with palmitic (16:0, PA), oleic (18:1n−9, OA), or eicosapentaenoic (20:5n−3, EPA) acid respond to a fasting condition mimicked by nutrient deprivation and glucagon. All experimental groups were supplemented with radiolabeled PA to trace secreted lipids and distribution of radioactivity in different lipid classes. There was a higher content of intracellular lipid droplets in adipocytes pre-enriched with OA than in adipocytes pre-enriched with PA or EPA. In the EPA group, the radiolabeled PA was mainly esterified in phospholipids and triacylglycerols, whereas in the OA and PA groups, the radioactivity was mainly recovered in phospholipids and cholesterol-ester. By subjecting the experimental groups to nutrient-deprived media supplemented with glucagon, lipolysis occurred in all groups, although to a lower extent in the OA group. The lipids were mainly secreted as esterified lipids in triacylglycerols and phospholipids, indicating mobilization in lipoproteins. A significant proportion was secreted as free fatty acids and glycerol. Leptin secretion was reduced in all experimental groups in response to fasting, while the mitochondria area responded to changes in the energy supply and demand by increasing after 3 h of fasting. Overall, different lipid classes in adipocytes influenced their mobilization during fasting.
1. Introduction
Adipocytes are dynamically engaged in the regulation of whole-body energy homeostasis. In energy balance, lipolysis and re-esterification of free fatty acids (FA) are opposing processes taking place at the same time at similar rates in a futile cycle [1]. This allows adipocytes to quickly react and adjust to alterations in the state of energy balance by promoting the storage or mobilization of energy in case of a positive or negative energy balance, respectively. In fish, as in mammals, these processes are highly regulated by hormones, cytokines, and nutritional factors [2,3,4,5].
Lipolysis refers to the process by which triglycerides (TAG) are hydrolyzed to FAs and glycerol. These hydrolyzed FAs are primarily transported to other organs where they will be β-oxidized for energy production. A small part, however, can remain in the adipocyte where they can be either β-oxidized for energy purposes or re-esterified for further storage. The lipid oxidation capacity of Atlantic salmon (Salmo salar) adipose tissue is regulated by different FAs in vivo [6] and in vitro [5], being n-3 highly unsaturated fatty acids (HUFAs) able to promote FA oxidation rather than deposition. Several stimuli have been shown to elicit the lipolytic cascade in fish adipocytes. Thus, an increase in lipolysis was observed in adipocytes from rainbow trout (Oncorhynchus mykiss) [2] and gilthead seabream (Sparus aurata) [7] that fasted for three weeks or eleven days, respectively. An induction in lipolysis was also observed in adipocytes from gilthead seabream fed experimental diets containing plant protein [7] or vegetable oils [8]. Lipolysis is also under hormonal control in these species, where glucagon and growth hormone increase the lipolytic rate, whereas insulin decreases it [2,7].
Adipocytes have an important function as endocrine organs, being able to produce and secrete different hormones that can act both locally or peripherally [9,10]. In this sense, leptin is one of the most notable hormones due to its implication in regulating appetite, energy metabolism, growth, stress, and immune function across vertebrate groups [11]. In mammals, leptin is predominantly produced by adipocytes [12,13], and it is secreted in proportion to body adiposity [14], signaling the nutritional status. In fish, the plasma leptin source has not been determined yet. However, the liver has been suggested as the main producer due to its high lep expression [15,16,17]. Nevertheless, leptin has been reported to play an important role in regulating energy stores and their mobilization in rainbow trout [18].
In the present study, we evaluated adipocyte responses to three different FA: palmitic acid (16:0; PA), oleic acid (18:1n−9; OA), and eicosapentaenoic acid (20:5n−3; EPA). These FA were selected based on their relevance on current feeding practices. While the content of OA has increased in Atlantic salmon diets, that of PA and EPA has decreased [19,20]. Changes in dietary FA composition are reflected in the tissues and organs of the fish [21]. Even though these changes might not impact fish growth performance, they affect the nutritional quality of the fish by reducing the levels of the healthy FA, EPA, and DHA in their fillets [21]. Atlantic salmon has been ranked as the most efficient aquaculture production system [22,23], being an important source of protein, omega-3 FA, vitamins, and minerals for human consumption. Atlantic salmon are fed high-lipid diets in commercial production [19]. As in mammals, excess of energy is translated into increased abdominal fat deposition. The functions and development of Atlantic salmon white adipose tissue has many similarities with those from terrestrial vertebrates [5,6,24], which makes it a suitable and valuable experimental model. In this study, changes in adipocyte lipid dynamics were evaluated in terms of lipid droplet formation, cellular FA composition, and lipid classes composition. Additionally, we investigated the associations between these FA and adipocyte responses to an early stage of fasting. Adipocyte lipolysis, leptin production and secretion, and changes in mitochondrial area were measured.
2. Results
2.1. The Influence of OA, PA, and EPA on Lipid Droplets Formation, Total FA Content, and FA Composition
Differentiated adipocytes cultivated in media supplemented with 100 µM of OA, PA, or EPA for 72 h had, when observed by microscopy, different amounts of intracellular lipid droplets. The group supplemented with OA accumulated the highest number of large intracellular lipid droplets (Figure 1A,D), whereas cells supplemented with EPA contained less and smaller lipid droplets (Figure 1C,F), and few lipid droplets were observed in the cells supplemented with PA (Figure 1B,E). The microscopic observations agreed with the quantification of total FA by GC analyses, showing that the OA group contained a higher level of total cellular fatty acids than the EPA and PA groups (ANOVA; p = 0.0548) (Figure 1G).
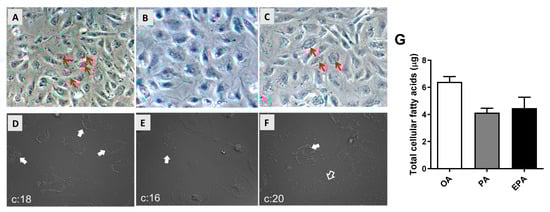
Figure 1.
Microscopic observation of lipid droplets (A–F) and total fatty acid content quantified by gas chromatography (G) in mature Atlantic salmon adipocytes. Differentiated cells at day 9 were incubated with oleic, palmitic, or eicosapentaenoic acid for 72 h. Images were taken with a 20× magnification. All arrows, regardless of color, point to areas with a high presence of lipid droplets. Data are shown as mean + SEM (n = 3) and analyzed by one-way ANOVA (p = 0.0548). OA = oleic acid, PA = palmitic acid, and EPA = eicosapentaenoic acid.
The FA composition of the adipocytes was significantly affected by the FA supplementation to the culture media (Table 1). Thus, cells supplemented with OA for 72 h had a significantly higher content of OA (47%) than cells incubated with PA or EPA (16% and 18%, respectively; p = 0.002). Cells supplemented with PA for 72 h had a significantly higher content of PA (36%) than cells supplemented with OA and EPA (10% and 19%, respectively; p = 0.005). In a similar fashion, cells supplemented with EPA for 72 h had a significantly higher content of EPA (19%) than cells supplemented with PA (3%), whereas this FA was not detected in cells incubated with OA (p = 0.001).

Table 1.
Fatty acid composition (% of total) in mature Atlantic salmon adipocytes. Differentiated cells at day 9 were incubated with oleic (OA), palmitic (PA), or eicosapentaenoic acid (EPA) for 72 h (mean ± SEM; n = 3).
2.2. The Influence of OA, PA, and EPA on Lipogenesis
In order to estimate the cellular lipogenic activity, the delta 9 desaturation capacity was analyzed by measuring the production of radiolabeled MUFA from radiolabeled PA. Despite of lack of significance, cells containing a high endogenous level of PA (PA group) presented a lower numerical ∆9 desaturation capacity than cells containing a lower level of this FA (OA and EPA groups) (ANOVA; p = 0.2197) (Figure 2A). Additionally, a significant reduction in the transcript abundance of the gene encoding the ∆9-desaturase enzyme (scd) was observed in the PA group (Figure 2B; p < 0.0001). Adipocytes from the EPA group, on the other hand, presented significantly higher scd mRNA levels than the other two groups (p < 0.0001).
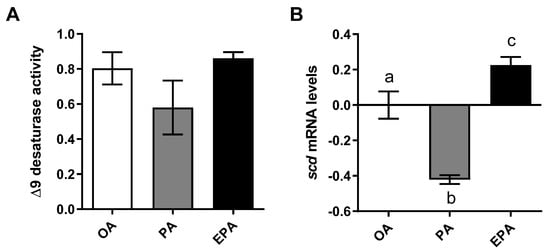
Figure 2.
Delta 9 desaturase activity (A) and relative changes in transcript levels (B) in mature Atlantic salmon adipocytes incubated with oleic, palmitic, or eicosapentaenoic acid for 72 h. Data are shown as mean ± SEM (n = 3 for Δ9 desaturase activity, and n = 4 for the relative changes in transcript levels) and analyzed by one-way ANOVA followed by Tukey’s honestly significant difference test (p = 0.2197 and p < 0.0001, respectively). Different letters indicate significant differences between treatments. The activity was calculated based on the 16:0 and 16:1+18:1 produced from [1-14C] PA. OA = oleic acid, PA = palmitic acid, and EPA = eicosapentaenoic acid. Relative changes in transcript levels were analyzed with real-time qPCR; data are presented as −ΔΔCt ± SEM, and the OA group was set to zero.
2.3. The Influence of Endogenous FA Composition on Incorporation of Radiolabelled PA in Different Cellular Lipid Classes
To examine the effect of endogenous FA composition on the metabolism of [1-14C] PA, the relative incorporation of radiolabeled [1-14C] PA in the different intracellular lipid classes, such as phospholipids (PL), free fatty acids (FFA), triglycerides (TAG), diacylglycerols (DAG), and cholesteryl ester (CE), was analyzed by HPTLC (Table 2). In adipocytes enriched with PA or OA, nearly 50% of the radioactivity was found in PL, while more than 80% was recovered in PL in adipocytes enriched with EPA. Significantly more [1-14C] PA was found in FFA in the PA group (12%) than in the OA (2.6%) and EPA (3.4%) groups. Significant higher proportions of radiolabeled TAG were found in the EPA group (11.9%) than in the OA group (5.84%), whereas the PA group had intermediate values (11.3%). No difference was found in the proportions of [1-14C] PA recovered in DAG between the three treatments. More than 40% of the radioactivity recovered in cellular lipids was found in cholesteryl esters (CE) in the OA group, which was significantly higher than that in the PA group (27.6%) and in the EPA group (not detectable amounts). Overall, the total amount of nmols recovered in the cellular lipid fraction was 3.8 and 3.3 times higher in the EPA and OA group, respectively, than in the PA group.
Table 2.
Relative distribution of radioactivity from [1-14C PA] recovered in different cellular lipid classes in Atlantic salmon differentiated adipocytes incubated with oleic (OA), palmitic (PA), or eicosapentaenoic acid (EPA) for 72 h.
2.4. Cellular Response to Nutrient Deprivation and Glucagon
2.4.1. Leptin
The type of FA supplemented to the adipocytes contributed to leptin regulation at both transcript and protein levels, but the effect differed across the nutritional/physiological status of the cell. Leptin transcript levels were not significantly modified by the different FA tested (OA, PA, or EPA; p = 0.0873) (Figure 3A). However, serum deprivation together with glucagon supplementation for 18 h significantly reduced the transcript levels of leptin in all the experimental groups (p = 0.0004; Figure 3A). Measurements of the intracellular levels of leptin showed a significant interaction between the FA and culturing condition (p = 0.0065) in which leptin protein levels were reduced already after 3 h of serum deprivation and glucagon supplementation in adipocytes enriched with OA and maintained at low levels thereafter (Figure 3B). On the other hand, cells enriched with PA or EPA maintained their intracellular leptin levels across culture conditions. Under standard growth conditions (Control), adipocytes incubated with OA presented a significantly higher intracellular concentration of leptin than adipocytes incubated with EPA, whereas adipocytes incubated with PA had intermediate levels (Figure 3B).
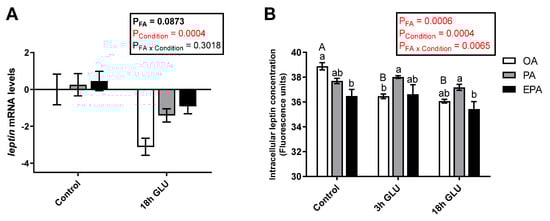
Figure 3.
(A) Relative changes in transcript levels of leptin in mature Atlantic salmon adipocytes incubated with oleic, palmitic, or eicosapentaenoic acid for 72 h (Control) and serum-deprived in the presence of glucagon thereafter for 18 h (18h GLU). Data are shown as mean ± SEM (n = 4). Results are compared by two-way ANOVA using the fatty acid tested (OA, PA, and EPA) and the experimental condition (Control and 18h GLU) as factors. (B) Changes in intracellular leptin concentrations in mature Atlantic salmon adipocytes incubated with oleic, palmitic, or eicosapentaenoic acid for 72 h (Control) and serum-deprived in the presence of glucagon thereafter for 3 (3h GLU) and 18 h (18h GLU). Data are shown as mean ± SEM (n = 3). Results are compared by two-way ANOVA using the fatty acid tested (OA, PA, and EPA) and the experimental condition (Control, 3h GLU, and 18h GLU) as factors. Lowercase letters indicate significant differences between fatty acids, and capital letters indicate significant differences between conditions (p < 0.05; Tukey’s post hoc test). Relative changes in leptin transcript levels were analyzed with real-time qPCR; data are presented as −ΔΔCt ± SEM, and the OA group from the Control condition was set to zero. OA = oleic acid, PA = palmitic acid, and EPA = eicosapentaenoic acid.
Leptin secretion to the media was significantly affected by both the FA supplemented (p < 0.0001) and the culturing condition (p < 0.0001) (Figure 4). However, a significant interaction between these two factors was observed (p < 0.0001) in which the type of FA supplemented to the cells only influenced basal leptin secretion under standard growth conditions (Control). Thus, adipocytes incubated with PA secreted a significantly higher amount of leptin to the media, followed by adipocytes incubated with OA, whereas EPA incubation promoted a significantly lower leptin secretion (Figure 4). Serum withdrawn and an addition of glucagon for 3 h significantly reduced leptin secretion in all three experimental groups, being these levels maintained after 18 h (Figure 4).
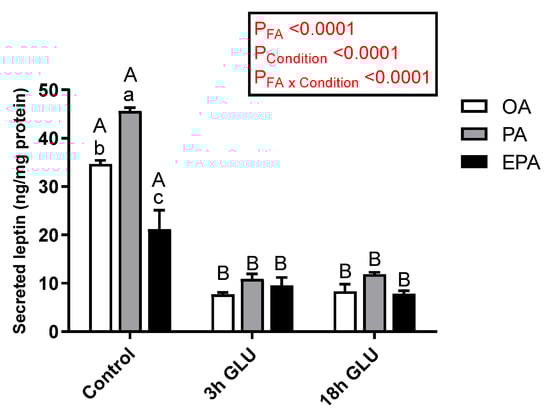
Figure 4.
Changes in leptin secretion in the medium from mature Atlantic salmon adipocytes incubated with oleic, palmitic, or eicosapentaenoic acid for 72 h (Control) and serum-deprived in the presence of glucagon thereafter for 3 (3 h GLU) and 18 h (18 h GLU). Data are shown as mean ± SEM (n = 3). Results are compared by two-way ANOVA using the fatty acid tested (OA, PA, and EPA) and the experimental condition (Control, 3 h GLU, and 18 h GLU) as factors. Lowercase letters indicate significant differences between fatty acids, and capital letters indicate significant differences between conditions (p < 0.05; Tukey’s post hoc test). OA = oleic acid, PA = palmitic acid, and EPA = eicosapentaenoic acid.
2.4.2. Transcriptional Responses to Serum Deprivation and Glucagon Supplementation
To evaluate the role of the different FA used and how they might influence the adipocyte response to a stimulus emulating a fasting condition, the transcript levels of key adipogenic and lipolytic markers were assessed. In this study, serum deprivation together with glucagon supplementation for 18 h triggered a tendency to increase the mRNA levels of hormone-sensitive lipase (lipe; p = 0.0629) (Figure 5A). Additionally, there was a significant main effect of the FA the adipocytes were supplemented with (p <0.0001), such that lipe mRNA levels were significantly lower in cells enriched with PA than in cells enriched with OA or EPA. The same was true for lipoprotein lipase (lpl) mRNA levels, though these differences provoked by the FA tested were restricted to standard culture conditions (p = 0.0017; Figure 5B). The overall tendency to increased mRNA levels of lipe and lpl in all three experimental groups indicates an increase in lipolysis when the cells are mimicking a fasted condition.
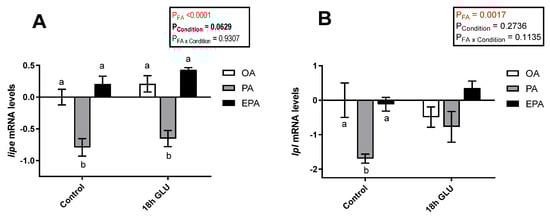
Figure 5.
Relative changes in transcript levels of hormone-sensitive lipase (lipe) (A) and lipoprotein lipase (lpl) (B) in matured Atlantic salmon adipocytes incubated with oleic, palmitic, or eicosapentaenoic acid for 72 h (Control) and serum-deprived in the presence of glucagon thereafter for 18 h (18 h GLU). Samples (n = 4) were analyzed with real-time qPCR; data are presented as −ΔΔCt ± SEM, and the OA group from the Control condition was set to zero. Results are compared by two-way ANOVA using the fatty acid tested (OA, PA, and EPA) and the experimental condition (Control and 18 h GLU) as factors. Lowercase letters indicate significant differences between fatty acids (p < 0.05; Tukey’s post hoc test). OA = oleic acid, PA = palmitic acid, and EPA = eicosapentaenoic acid.
2.4.3. Lipolysis
Cellular lipid release was evaluated by measuring radiolabeled-secreted lipid products from [1-14C] PA and total non-radiolabeled non-esterified free fatty acids (NEFA) and glycerol in the culture media after 3 and 18 h of serum deprivation and glucagon addition (Figure 6). Analysis evaluating the secretion of total glycerol (Figure 6A) and NEFA (Figure 6B) showed no significant changes with increasing the time of adipocyte exposure to serum deprivation and glucagon supplementation (p = 0.5637 and 0.1608, respectively). Nevertheless, there was a significant main effect of the FA used during standard culture conditions on the amount of NEFA secreted (p = 0.0424). Thus, adipocytes incubated with EPA secreted a higher amount of NEFA than adipocytes incubated with OA, whereas adipocytes incubated with PA had intermediate levels. No significant effect of the FA used during standard culture conditions on the amount of glycerol secreted was observed (p = 0.4685). However, longer exposure to serum deprivation together with glucagon supplementation significantly increased the secretion of radiolabeled lipids to the media (p < 0.0001; Figure 6C). The type of FA added to the adipocytes during standard culture conditions had no effect on the total amount of radiolabeled secreted lipids secreted after 3 h of serum deprivation and glucagon addition. However, there was a significant interaction between the FA used and cell culture conditions (p = 0.0112; Figure 6C) in which, after 18 h of serum deprivation and glucagon addition, adipocytes pre-enriched with PA or EPA secreted a significantly higher amount of lipids to the media than those pre-enriched with OA. Most of the radiolabeled lipids secreted were esterified in DAG+TAG and PL, with relatively little recovered in the form of FFA (Figure 7A–C). Adipocytes pre-enriched with PA or EPA also released small amounts in the form of CE/wax esters (WE), whereas not detectable amounts were observed in adipocytes pre-enriched with OA (Figure 7D).
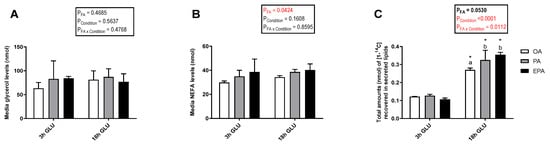
Figure 6.
Total glycerol (A), non-esterified free fatty acids (NEFA) (B), and [1-14C] from radiolabelled PA recovered in secreted lipids (C) in the media from mature Atlantic salmon adipocytes incubated with oleic, palmitic, or eicosapentaenoic acid for 72 h and serum-deprived in the presence of glucagon thereafter for 3 (3 h GLU) and 18 h (18 h GLU). Data are shown as mean ± SEM (n = 4 for glycerol and NEFA data, and n = 3 for radiolabeled lipids secreted data). Results are compared by two-way ANOVA using the fatty acid tested (OA, PA, and EPA) and the experimental condition (3 h GLU and 18 h GLU) as factors. Lowercase letters indicate significant differences between fatty acids (p < 0.05; Tukey’s post hoc test). Asterisks (*) indicate significant differences between conditions (p < 0.05; Sidak’s test). OA = oleic acid, PA = palmitic acid, and EPA = eicosapentaenoic acid.
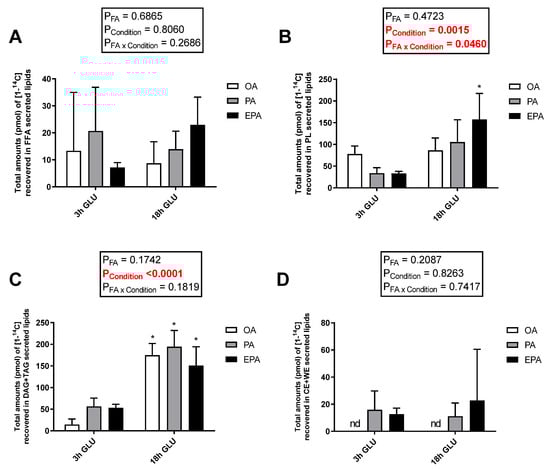
Figure 7.
Distribution between free fatty acids (FFA) (A), phospholipids (PL) (B), mono and diacylglycerol (MDG) and triglycerides (TAG) (C), and cholesteryl esters and wax esters (CE + WE) (D) produced from [1-14C] PA in the media from mature Atlantic salmon adipocytes incubated with oleic, palmitic, or eicosapentaenoic acid for 72 h and serum-deprived in the presence of glucagon thereafter for 3 (3 h GLU) and 18 h (18 h GLU). Data are shown as mean ± SEM (n = 3). Results are compared by two-way ANOVA using the fatty acid tested (OA, PA, and EPA) and the experimental condition (3 h GLU and 18 h GLU) as factors. Asterisks (*) indicate significant differences between conditions (p < 0.05; Sidak’s test). OA = oleic acid, PA = palmitic acid, and EPA = eicosapentaenoic acid.
2.4.4. Mitochondria
The mitochondria area was significantly affected by the FA the adipocytes were supplemented with (p = 0.0001) and by the culture conditions (p <0.0001) (Figure 8A). After 3 h of serum deprivation and glucagon addition, the mitochondria area was increased. However, after 18 h of serum deprivation and glucagon addition, these values were similar to those found in adipocytes growth under standard conditions (Control). Regarding the effect of the FA used, the mitochondria area was higher in adipocytes incubated with OA or EPA than in adipocytes incubated with PA.
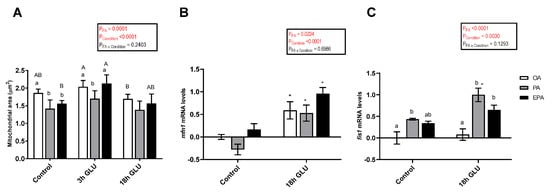
Figure 8.
(A) Mitochondria area from immunostaining images in mature Atlantic salmon adipocytes incubated with oleic, palmitic, or eicosapentaenoic acid for 72 h (Control) and serum-deprived in the presence of glucagon thereafter for 3 (3 h GLU) and 18 h (18h GLU). Data are shown as mean ± SEM (n = 4–6). Results are compared by two-way ANOVA using the fatty acid tested (OA, PA, and EPA) and the experimental condition (Control, 3 h GLU, and 18 h GLU) as factors. Lowercase letters indicate significant differences between fatty acids and capital letters indicate significant differences between conditions (p < 0.05; Tukey’s post hoc test). (B) Relative changes in transcript levels of mfn1 and fis1 (C) in mature Atlantic salmon adipocytes incubated with oleic, palmitic, or eicosapentaenoic acid for 72 h (Control) and serum-deprived in the presence of glucagon thereafter for 18 h (18 h GLU). Samples (n = 4) were analyzed with real-time qPCR; data are presented as −ΔΔCt ± SEM, and the OA group from the Control condition was set to zero. Results are compared by two-way ANOVA using the fatty acid tested (OA, PA, and EPA) and the experimental condition (Control and 18 h GLU) as factors. Lowercase letters indicate significant differences between fatty acids (p < 0.05; Tukey’s post hoc test). Asterisks (*) indicate significant differences between conditions (p < 0.05; Sidak’s test). OA = oleic acid, PA = palmitic acid, and EPA = eicosapentaenoic acid.
The changes in mRNA levels of mitofusin 1 (mfn1) and mitochondrial fission 1 (fis1), two genes encoding for proteins responsible for mediating mitochondrial fusion and fission, respectively, were assessed. The mRNA levels of mfn1 were significantly affected by the FA used and the culture condition (p = 0.0224 and <0.0001, respectively; Figure 8B). Thus, serum deprivation and glucagon addition for 18 h significantly increased the mRNA levels of mfn1, being this increase more pronounced in cells incubated with EPA than in cells incubated with PA. In a similar fashion, the mRNA levels of fis1 were a significantly affected by the FA used and the culture condition (p <0.0001 and 0.0030, respectively; Figure 8C). In this case, serum deprivation and glucagon addition for 18 h only increased the mRNA levels of fis1 in adipocytes incubated with PA or EPA. Overall, PA had a higher capacity to increase the mRNA levels of this gene.
3. Discussion
3.1. Adipocyte Response to OA, PA, and EPA Supplementation during a Fed Status
The supplementation of OA to mature Atlantic salmon adipocytes lead to a higher production of intracellular lipid droplets and higher level of cellular FA than supplementation of EPA and PA. This is consistent with a previous in vitro study done in Atlantic salmon adipocytes, where OA lead to a higher degree of lipid filling and fat cell differentiation than EPA [5]. Additionally, an in vivo study carried out by the same authors showed that increased dietary levels of n−3 HUFAs resulted in lower fat percentage in white adipose tissue [6]. In mammals, the lipid-lowering effects of EPA are mediated by an induction of mitochondrial β-oxidation, both in hepatocytes [25,26] and in adipocytes [27]. All these results suggest that OA has the capacity to promote Atlantic salmon adiposity to a higher degree than EPA and PA.
The lower number of lipid droplets and total lipids in the PA group, and also the reduced uptake of the [1-14C] PA than in the EPA and OA groups, might be a result of a strict control of the intracellular content of saturated fatty acids (SFA) in order to prevent potentially toxic effects of an excessive accumulation of intracellular SFA. In human adipocytes, the coordinated upregulation of the elongation of FA and their desaturation by the Δ−9 desaturase enzyme (SCD) protects against SFA cell injury [28]. In the present study, most of the [1-14C] PA incorporated into the adipocytes in the three experimental groups was converted to the MUFA 16:1 and 18:1, presumably by SCD activity. The mRNA transcript abundance of scd measured in the three experimental groups correlated with the amount of [1-14C] PA incorporated into the cells. Thus, scd transcripts were significantly lower in adipocytes from the PA group than in the EPA and OA groups.
The present study showed that EPA enrichment of cells totally inhibited the formation of [1-14C] PA-cholesterol ester compared to cells enriched with OA and PA, where approximately 40% and 30% of [1-14C] PA, respectively, was esterified with cholesterol. However, EPA did not reduce the esterification into PL. This is in agreement with mammalian studies, showing that EPA decreases cholesterol esterification in rat hepatocytes by interfering with the transfer of activated fatty acids to cholesterol by acyl-CoA:cholesterol acyltransferase [29]. In another study, it was shown that the inhibition rates of cholesterol esterification in lipoproteins were highest by EPA, next by linoleic acid and PA, and lowest by OA [30]. Furthermore, polyunsaturated FA (PUFA) suppressed lecithin:cholesterol acyltransferase (LCAT) activities much stronger than SFA at physiological concentrations [30]. Our study therefore indicates that EPA has a similar inhibitory effect on cholesterol esterification in Atlantic salmon, as previously shown in mammals. However, whether this is due to effects on LCAT activity in Atlantic salmon remains to be elucidated. A recent study revealed that PA esterification in CE, but not in PL, was directly correlated with body fat storage [31]. The higher incorporation of [1-14C] PA in the CE fraction observed in the OA group in our study also coincided with the highest total cellular lipid content.
3.2. Adipocyte Response to Mimicking a Fasting Condition: Lipid Mobilization
Scarce information is available regarding the mechanisms governing lipolysis in fish adipocytes. In the present study, Atlantic salmon adipocytes responded to an emulated fasting condition by secreting glycerol and NEFA to the media already after only 3 h of stimulation. This is in agreement with previous reports from other fish species [2,7]. However, the levels of these products in the media were maintained after 18 h of fasting stimulation. While the levels of glycerol released to the media were similar in all the experimental conditions, those of NEFA were affected by the FA adipocytes were enriched with, being adipocytes cultivated with EPA the ones secreting a higher amount of NEFA. A similar response has been previously reported in rat adipocytes, where SFA reduced lipolytic activities when compared to PUFA [32,33]. Interestingly, there was a marked increase in secreted radiolabeled lipids in response to extending fasting from 3 to 18 h, being the secretion higher in the EPA and PA groups than in the OA group. This was probably due to the fact that, in the OA group, [1-14C] PA was primarily esterified in CE and PL and very little in TAG, while more [1-14C] PA was esterified in TAG in the EPA and PA groups. This is in agreement with studies showing that, during lipolysis, FA stored as TAG in adipocytes from different mammalian models are selectively mobilized according to molecular structure regardless of their content [34,35]. In our study, both the secretion of FA and radiolabeled products were higher in the groups with the lower level of intracellular lipid droplets but with the highest level of intracellular [1-14C] PA-TAG. Conversely, the lowest secretion of these products was observed in the OA group, which presented the highest level of [1-14C] PA esterified in CE. These results are in agreement with a study from mammals showing that EPA membrane incorporation reduces the cholesteryl ester mobilization from lipid droplets [36].
Interestingly, most of the secreted lipids were esterified in TAG and PL, with relatively little recovered in the form of FFA in all experimental groups. This mobilization of lipids, where lipolysis does not seem to be governed by secretion of glycerol and NEFA, might indicate that fish adipocytes are able to secrete proteins that play a key role mediating lipid transport. In this sense, apolipoprotein E is highly expressed in adipocytes, both in mammals [37] and in Atlantic salmon [24]. A mouse study showed that, in addition to apolipoprotein A1, apolipoprotein E may promote de novo biogenesis of HDL [38]. Further mechanistic studies are needed in order to better understand fish lipolysis and transport pathways, as well as the possible role that secreted lipids might have as signaling molecules.
Fasting did not modify the mRNA levels of lipe nor lpl, two enzymes controlling the turnover of FA in adipose tissue. Nevertheless, a lack of correlation between cellular mRNA levels and activities of these lipases has been described and associated with extensive posttranscriptional and posttranslational regulation processes [39,40].
3.3. Leptin Regulation in Adipocytes Enriched with OA, PA, or EPA during a Fed and a Fasting Status
Despite of a lack of regulation observed at a transcriptional level, the three FA tested in the present study triggered different adipocyte responses in terms of intracellular and secreted leptin. Thus, adipocytes enriched with EPA presented the lowest intracellular and secreted levels of leptin, whereas cells enriched with PA had high intracellular levels of leptin and the greatest leptin secretion capacity. In mammals, leptin levels reflect body lipid content acting as a negative feedback adipostatic signal to control energy homeostasis [41,42]. Interestingly, in the present study, adipocytes enriched with PA secreted higher amounts of leptin regardless of not presenting the highest lipid content. Recent studies in rainbow trout point to the contribution of visceral adipocytes to plasma leptin levels [18,43]. Additionally, it has been suggested that leptin secretion in salmonids is not correlated to the size of the secreting tissue [18], being rather differentially regulated depending on the environmental and physiological conditions. The present results indicate that individual fatty acids have the capacity to differentially regulate leptin production and secretion. This observation is in line with research done in humans, where plasma leptin concentrations were influenced by the dietary type of fat [44]. In this sense, dietary n−3 PUFA has been reported to reduce human leptin transcript abundance both in vivo and in vitro and to negatively correlate with plasma leptin concentrations [45].
When a fasting state was mimicked, the transcript abundance of leptin was decreased, and the intracellular protein leptin levels were significantly reduced in adipocytes pre-enriched with OA. Additionally, a consistent and significant decrease in leptin secretion in response to fasting was observed in all experimental groups. This response agrees with that from most mammalian species [42,46,47,48], where fasting acutely reduces serum leptin. Several studies evaluating the effects of fasting or feed restriction in teleost fishes have reported increases in leptin synthesis and secretion (reviewed by [11]). However, leptin responses induced by fasting are diverse, even within the same fish species. While some studies have reported an increase of plasma leptin levels in rainbow trout [49] and Atlantic salmon [50] subjected to fasting or to a restricted diet, others have reported no effect in these two species [15,18]. All these discrepancies might be related to differences in experimental settings (laboratory conditions vs. ambient conditions), protocols (duration of the imposed fasting), differences in sample size, differences in fish life stages, and gender differences, among others. Additionally, due to genome duplication events, Atlantic salmon possess two leptin paralog-pairs (LepA1/LepA2 and LepB1/LepB2) [15,51] and two paralog receptors (LepRA1/LepRA2) [52]. The existence of leptin paralogs with possible functional diversification in a species or in a tissue dependent manner further complicates the picture.
3.4. Mitochondrial Responses in Adipocytes Enriched with OA, PA, or EPA during a Fed and a Fasting Status
Mitochondria are highly dynamic organelles that change morphology depending on the cellular context by means of coordinated fusion and fission events [53,54,55]. In the present study, the mitochondrial area was increased after 3 h of nutrient deprivation and glucagon stimulation, being this increase particularly noticeable in adipocytes pre-enriched with OA or EPA. These results are consistent with previously reported observations relating changes in mitochondrial architecture with the balance between energy supply and demand [56]. Fasting is known to induce a metabolic response by which energy production from mitochondria is elevated in order to ensure energy supply. However, this elevates the risk of mitochondrial oxidative damage [57]. In general, mitochondria in cells exposed to a fasting condition tend to elongate and interconnect shortly after nutrient depletion [57,58,59,60]. It has been reported that mitochondrial fusion protects metabolically challenged mitochondria by reducing reactive oxygen species upon fasting [57]. Interestingly, after 18 h of mimicking a fasting status in the present study, the mitochondrial area was similar to that present in the control cells (“fed cells”). The observed arrest in fusion and increase in mitochondria fragmentation might indicate the first steps towards nutrient-induced apoptosis. However, further studies are needed in order to unravel the physiological role of mitochondrial dynamics in fish adipocytes.
The fact that the extent of mitochondrial fusion differed between adipocytes pre-enriched with different FA indicates that this process can be modulated according to single metabolites. This has been shown to be the case in humans, where ingestion of the FA stearic acid (18:0) caused mitochondrial fusion within 3 h after ingestion, whereas this response was not observed after PA ingestion [61]. Our results showed that OA and EPA had a greater capacity than PA to promote mitochondrial dynamics in Atlantic salmon adipocytes. In this sense, hepatocytes from Atlantic salmon-fed diets containing high levels of EPA [62], as well as salmon hepatocytes with high levels of exogenously added EPA [63], presented an increased mitochondrial area. However, a significantly smaller mitochondrial area was observed in hepatocytes from Atlantic salmon fed a rapeseed oil diet rich in OA when compared to those fed the EPA diet [62]. This might indicate that these responses do not only depend on the specific FA but also on the cell type.
4. Materials and Methods
4.1. Isolation of Preadipocytes
Atlantic salmon with a mean body weight of 3.46 (SEM 0.58) kg and a mean body length of 617 (SEM 3) cm were obtained from Nofima Research station at Averøy, Norway. Fifteen fish were randomly selected and transported from sea cages to land tanks with recirculating water. One at the time, the fish were anaesthetized with metacain (MS-222; 0.08 g/L) and killed by a sharp blow to the head. The arch bows of the gills were cut, and after bleeding for a few minutes, the abdomen was cut open to expose the visible white adipose tissue surrounding the intestinal tract. The experiment was conducted according to the National Guidelines for Animal Care and Welfare of the Norwegian Ministry of Research (FOR-2015-06-18-761) and classified as not requiring a specific license (§2-f, corresponding to Directive 2010/63/EU Article 1, section 5f), since the experimental treatments were not expected to cause any distress or discomfort for the fish, being that the fish was dead prior to adipose tissue dissection. Visceral adipose tissue was excised, and Atlantic salmon preadipocytes were isolated and cultured as described by Todorčević et al. [5]. Briefly, the dissected adipose tissue from 15 fish was washed with Leibowitz-15 (L-15) and then minced into small pieces. After washed twice with L-15, the tissue was digested in 0.2% collagenase in L-15 (1 g tissue / 5 mL L-15) at 13 °C for 1 h under shaking and then filtered through 250 and 100 μm nylon filters to remove large particulate materials. The resulting suspension was then centrifuged at 500× g for 10 min at 10 °C. The buoyant lipid layer with mature adipocytes and the digestion medium was removed immediately by aspiration. After washing twice, the sedimented cells were resuspended in a growth medium containing L-15; 10% fetal bovine serum (FBS); 2mM L-glutamine; 10mM HEPES; and 1% antibiotics (a mixture of penicillin, streptomycin, and amphotericin B) and seeded onto laminin-coated 6- and 24-well plates at a density of approximately 10 g tissue/25 cm2. The cells were incubated at 13 °C, and most cells were attached the next day. The medium was changed every 3 days until the cells reached confluence after approximately 1 week. Confluent cells were cultivated for 48 h in differentiation-inducing medium containing growth medium supplemented with 0.5 μM dexamethasone, 5 nM triiodothyronine, 12 μM isobutylmethylxanthine, and 10 μg/mL insulin.
4.2. Incubation of Adipocytes with Radiolabelled Palmitic Acid
After being incubated in differentiation medium for 2 days, the cells were divided into 3 treatment groups and incubated with radiolabeled palmitic acid (PA) and one of the three different non-radiolabeled fatty acids (FA) tested. Thus, the cells were incubated with either 10µM [1-14C] PA (0.5 µCi/mL) + 100 µM PA (PA group), 10 µM [1-14C] PA + 100 µM OA (OA group), or 10 µM [1-14C] PA + 100 µM EPA (EPA group) in growth medium containing 2% FBS. Each incubation was conducted in six independent parallel experiments (n = 6), each representing adipocytes coming from a pool of adipose tissue from an average of 5 fish. The radiolabeled and non-radiolabeled FA were added to the medium in the form of their potassium salts bound to FA free bovine serum albumin (BSA) (the molar ratio of FA to BSA was 2.7:1). The radiolabeled PA was obtained from American Radiolabeled Chemicals, Inc. (St. Louis, MO, USA), and the non-radiolabeled FAs were all supplied from Sigma-Aldrich (St. Louis, MO, USA). The doses were selected based on previous in vitro studies performed on adipocytes [64,65] and based on extensive experience in our laboratory from previous studies.
Prior to incubation, aliquots of 10, 20, 30, 40, and 50 µL of the incubation medium with [1-14C] PA were transferred into vials containing 5 mL of liquid scintillation fluid (InstaGel II Plus; Packard Instrument, Downers Grove, IL, USA), and the total radioactivity was measured in a Tri-Carb 1900TR Liquid Scintillation Analyzer (Packard Instrument Company, Meriden, CT, USA). The specific radioactivity (cpm/nmol FA) was subsequently calculated for PA substrate.
The cells were incubated with radiolabeled PA and non-radiolabeled FA for 72 h at 13 °C. After incubation, the culture medium was used for determination of total radioactivity. Three replicates from each treatment group, each representing adipocytes coming from a pool of adipose tissue from an average of 5 fish, were washed twice in PBS that contained 1% albumin, washed once more with regular PBS, and harvested in 500 µL of PBS and stored at −40 °C prior to the analysis of radiolabeled lipid classes. The other 3 replicates from each treatment group were washed twice in PBS that contained 1% fatty acid free albumin, washed once more with regular PBS, and incubated with serum-free growth medium containing glucagon (5 µg/mL) for 3 and 18 h. After the 3 h incubation, 1 mL medium from each cell well was collected and stored at −40 °C before the secreted radiolabeled lipid classes, leptin, non-esterified free fatty acids (NEFA), and glycerol were analyzed (3 h GLU). The cells went on the treatment until 18 h (18h GLU), and then, the cells were harvested and the medium was collected for the same analyses described above.
4.3. Incubation of Adipocytes with Non-Radiolabelled Fatty Acids
Differentiated adipocytes were washed with serum-free growth medium and treated with incubation medium, which consisted of growth medium with 2% FBS and one of the three treatments consisting of: 10 µM PA+100 µM PA (PA group), 10 µM PA+100 µM OA (OA group), or 10 µM PA +100 µM EPA (EPA group). The incubation continued for 72 h at 13 °C, where each group contained 8 replicates, each representing adipocytes coming from a pool of adipose tissue from an average of 5 fish. After the incubation time, 4 replicates from each treatment group were washed twice in PBS that contained 1% albumin, washed once more with regular PBS, harvested in RLT buffer containing β-mercaptorthanol, and stored at −80 °C prior to RNA extraction. This time point is referred to as the Control. The other 4 replicates from each treatment group were washed 3 times in PBS that contained 1% albumin, washed once more with regular PBS, and incubated with serum-free medium containing glucagon (5 µg/mL) for 18h. After incubation, the cells were washed and harvested for gene expression analysis, as described above. This time point is referred to as 18 h GLU.
4.4. Leptin, NEFA, and Glycerol Secretion Measurements
Leptin secretion to the culture medium at the different time points was determined by a commercial kit (Cusabio Ltd., Wuhan, China) specific for Atlantic salmon. The method was based on a competitive inhibition enzyme immunoassay technique. A competitive inhibition reaction is started between leptin (standards or samples) and HRP-conjugated leptin with the pre-coated antibody specific for Atlantic salmon leptin. The measurements were conducted according to the protocol supplied by the kit.
NEFA concentration in the medium at the different time points was determined by an enzymatic colorimetric method using a commercial kit (Randox Laboratories Ltd., Co. Antrim, UK). The principle for the test involves acylation of coenzyme A by FA in the sample in the presence of acyl-CoA synthetase and production of hydrogen peroxide in the presence of acyl-CoA oxidase. Color was measured at 550 nm in a Wallac 1420 VICTOR3TM Multilabel counter spectrophotometer (PerkinElmer, Wellesley, MA, USA).
Glycerol concentration in the medium was examined by a glycerol cell-based assay kit (Cayman Chemical Company, Ann Arbor, Michigan, USA). Glycerol present in the sample is phosphorylated by adenosine triphosphate (ATP), forming glycerol-1-phosphate (G-1-P), and adenosine-5′-diphosphate (ADP) in the reaction catalyzed by glycerol kinase. G-1-P is then oxidized by glycerol phosphate oxidase to dihydroxyacetone phosphate (DAP) and hydrogen peroxide (H2O2). A quinoneimine dye is produced by the peroxidase-catalyzed coupling of 4-aminoantipyrine (4-AAP) and sodium N-ethytl-N-(3-sulfopropyl)m-anisidine (ESPA) with H2O2, which shows an absorbance maximum at 540nm. The increase in absorbance at 540nm, measured in a Wallac 1420 VICTOR3TM multilabel counter spectrophotometer, is directly proportional to the glycerol concentration in the sample.
4.5. Lipid Extraction and Radiolabelled Lipid Class Analysis
Total lipids from adipocytes incubated with the different FA (PA, OA, or EPA) were extracted as described by Folch et al. [66]. The chloroform phase (300 µL) with butylated hydroxytoluene (BHT) (final concentration 0.7 mg/L) was divided into two parts. One part (150 µL) was dried under nitrogen gas, and the residual lipid extract was redissolved in 20 µL of chloroform. Phospholipid (PL), free fatty acids (FFA), diacylglycerol (DAG), triglycerol (TAG), and cholesterol ester (CE) were separated by thin-layer chromatography (TLC) using a mixture of petroleum ether, diethyl ether, and acetic acid (131:20:1, v/v/v) as the mobile phase. The chloroform phase was applied onto the TLC-plate (Merk HPTLC Silica gel 60 F254, 10 × 20 cm) using a Linomat 5 (Camag, Switzerland) and dried. The plates were kept in a chamber with a saturated atmosphere of the mobile phase until the liquid reached 2 cm from the upper edge of the plates. The spots corresponding to FFAs, PLs, DAGs, TAGs, and CEs were identified by comparison with known standards by a Bioscan AR-2000 Radio-TLC & Imaging Scanner and quantified with the WinScan Application Version 3.12 (Bioscan Inc., Washington, DC, USA).
The rest of the chloroform phase (150 µL) was used to evaluate the degrees of unsaturation and elongation by silver-ion TLC as described by Nikolova-Damyanova [67]. The chloroform phase was dried under nitrogen gas, and the residual lipid extract was transmethylated overnight with, 2 mL benzene, 2 mL methanolic HCl, and 200 µL 2’,2’-dimethoxypropane at room temperature. Two milliliters of hexane was added, and the samples were neutralized with NaHCO3. The benzene/hexane phase, which contained methylated lipids, was collected, dried at 60 °C under nitrogen gas, and redissolved in 10 µL chloroform. The lipids were separated on silica gel plates impregnated with silver nitrate (2 g silver nitrate in 20 mL acetonitrile) in toluene/hexane (40:60, v/v), and specific FAs were identified by comparison with known standards by a Bioscan AR-2000 Radio-TLC & Imaging Scanner (Bioscan Inc., Washington, DC, USA). The peaks corresponding to 16:0; 16:1, n−7; and 18:1, n−9 were scraped off into vials and dissolved with 5 mL of scintillation fluid and measured in a TRI-CARB 1900 TR scintillation counter.
4.6. Immunofluorescence Staining
Cells seeded in 24-well plates with a type 1.5 cover slip glass bottom were used for investigating the cellular localizations of leptin and mitochondria in (I) differentiated adipocytes incubated with non-radiolabeled FA for 72 h (Control), (II) differentiated adipocytes incubated with non-radiolabeled FA for 72 h followed by a 3-h incubation with glucagon (5 µg/mL), and (III) differentiated adipocytes incubated with non-radiolabeled FA for 72 h followed by an 18-h incubation with glucagon (5 µg/mL), as described in Section 2.3. After the different incubation conditions, cells were washed twice with PBS containing 1% albumin and fixed with 1% paraformaldehyde in PBS for 10 min at room temperature. Visualization of mitochondria was achieved with MitoTracker Red CMXRos (Life Technologies). Immunofluorescence was carried out on saponin permeabilized cells (0.2% saponin in 1 × PBS). Immunofluorescence analysis of adipocyte leptin (1:100) (PMID:21775646, R&D Systems, Inc., Minneapolis, MN, USA) was carried out for all treatments and incubation times (Control, 3h GLU, and 18h GLU). Images were captured and analyzed using Zeiss Axiovision Z1 and Zeiss Axiovision software, respectively (Carl Zeiss Microimaging GmbH, Göttingen, Germany). Additionally, the adipocytes were imaged using contrast microscopy (DIC) to visualize the lipid droplet number and spatial distribution within the cells.
4.7. RNA Extraction, cDNA Synthesis, and Quantitative Real-Time RT-PCR
Total RNA was extracted by using an RNeasy® mini kit, according to the manufacture′s instructions. RNA was treated with RNAase-free DNase I to remove any contaminating DNA. Approximately 350 ng of total RNA was reverse-transcribed into cDNA using a TaqMan® Gold RT-PCR Kit (Applied Biosystems, Foster City, CA, USA) in a 20 µL reaction system according to the manufacturer′s protocol. The PCR primers (Table 3) were designed using the Vector NTI (Invitrogen, Carlsbad, CA, USA) and synthesized by Invitrogen. Efficiency was checked from two-fold serial dilutions of cDNA for each primer pair. Real-time PCR was performed in duplicates in 96-well optical plates on a Light Cycler 480 Instrument (Roche Diagnostics, Mannheim, Germany) with gene-specific primers. Three commonly used reference genes (β-actin, elongation factor 1A, and eukaryotic translation initiation factor 3) were tested for stability using GeNorm and NormFinder. Finally, β-actin met the criteria of stability in the analyzed material. PCR master mixes consisted of l μL forward and reverse primers (final concentrations of 0.5 μM), 4 μL 1:10 dilution of cDNA, and 5 μL Light Cycler 480 SYBR Green I Master (Roche Applied Science, Mannheim Germany). The specificity of PCR amplification was confirmed by a melting curve analysis. Relative quantification of the abundance of transcripts was calculated using the ΔΔCT method and formula −ΔΔCT = − [(Cttarget gene −Ctβ-actin)treatment − (Cttarget gene − Ctβ-actin)control] [68].
Table 3.
Atlantic salmon primer sequences used for real-time PCR.
4.8. Protein Measurements
Protein concentrations were assayed using a total protein kit (Sigma, St. Louis, MO, USA) based on the method of Lowry [69] and modified by Peterson [70]. Standards were prepared by diluting 400 μg/mL of BSA in water. Sodium chloride (final concentration of 0.1 M) was added in order to reduce ampholyte interference. Proteins were precipitated by adding 0.1% trichloroacetic acid in the presence of 0.15% deoxycholate. Color was measured at 500 nm in a Wallac 1420 VICTOR3TM Multilabel counter spectrophotometer (PerkinElmer, Wellesley, MA, USA).
4.9. Presentation of Data and Statistics
Wells were used as experimental units. The normality of the data was tested using the Shapiro-Wilk test. All data from adipocytes cultivated under standard conditions were analyzed by one-way analysis of variance (ANOVA) followed by the Tukey’s honest significant difference post hoc test to detect differences within cells incubated with different FA. All other data where adipocytes were exposed not only to different FA but also to different culture conditions were analyzed by a two-way ANOVA using the FAs and culture conditions as the effects. Differences were considered statistically significant at p < 0.05. Values are shown as means ± standard error of the means (SEM). All statistical analyses were conducted using the software JMP® version 13.1.0 (SAS Institute Inc., Cary, NC, 1989-2007) and GraphPad Prism 6 (La Jolla, USA, www.graphpad.com).
5. Conclusions
The oil fraction of today’s commercial diets for Atlantic salmon is based on 70% rapeseed oil and 30% fish oil, compared to traditional diets where the oil fraction was purely based on fish oil [19]. This has resulted in a major reduction in EPA, DHA, and PA and an increase in OA in adipose tissue. However, it is not well-known how this change in FA composition affects adipocyte physiology. Our results, however, show that the EPA, OA, and PA exhibit very different and often opposing effects on central adipocyte functions. The type of dietary FA affects Atlantic salmon adipose tissue metabolism and physiology by modulating the transcript level of relevant genes, modifying the lipolytic activity, and modulating several metabolic processes, such as lipid droplet formation, the leptin system, and mitochondrial dynamics. While EPA reduced the degree of lipid droplet formation in the adipocyte and was a potent inhibitor of the formation of cholesterol esters in the cell, OA resulted in higher accumulation of lipid droplets in the cells, and the formation of cholesterol ester was increased in cells enriched with PA. On the other hand, a cellular enrichment in both PA and EPA increased lipid secretion from the adipocyte when a fasting condition was mimicked. Adipocytes responded to a fasting status by decreasing leptin secretion, following the already described model for most mammalian species. However, when adipocytes were not nutrient-deprived, cells rich in EPA had lower intracellular leptin levels than cells rich in PA. Additionally, the mitochondria reacted to changes in the energy supply and demand. An increase in mitochondrial area was observed after 3 h of mimicking a fasting condition, particularly in cells enriched in OA or EPA. Overall, this in vitro study highlights the role of FA as potential modulators of Atlantic salmon adiposity and demonstrates that single FA possess different metabolic signaling capacities in Atlantic salmon adipocytes. Further studies are required in order to fully understand how changes in the lipid composition of adipocytes affects fish physiology and health, particularly in moments where the fish stop eating, such as during spawning or during an outbreak of certain diseases. In these situations, the capacity to recruit lipids from adipocytes would be essential for reproduction success and health recovery after disease.
Author Contributions
Conceptualization, M.T., T.-K.K.Ø., and B.R.; methodology, X.W., M.T., and J.T.; formal analysis, M.B.; investigation, X.W., M.T., and J.T.; writing—original draft preparation, M.B.; writing—review and editing, M.B., T.-K.K.Ø., and B.R.; visualization, M.B.; supervision, B.R.; project administration, B.R.; and funding acquisition, M.B. and B.R. All authors have read and agreed to the published version of the manuscript.
Funding
This research was funded by the Norwegian Research Council, grant number 267952, and Nofima. The APC was funded by Nofima.
Acknowledgments
We thank Inger Ø. Kristiansen and Målfrid T. Bjerke (Nofima) for their skillful technical assistance.
Conflicts of Interest
The authors declare no conflicts of interest.
Abbreviations
| OA | Oleic acid |
| PA | Palmitic acid |
| EPA | Eicosapentaenoic acid |
| FA | Fatty acids |
| FFA | Free fatty acids |
| TAG | Triglycerides |
| PL | Phospholipids |
| CE | Cholesteryl ester |
References
- Braun, K.; Oeckl, J.; Westermeier, J.; Li, Y.; Klingenspor, M. Non-adrenergic control of lipolysis and thermogenesis in adipose tissues. J. Exp. Biol. 2018, 221 (Suppl. 1), jeb165381. [Google Scholar] [CrossRef]
- Albalat, A.; Gutiérrez, J.; Navarro, I. Regulation of lipolysis in isolated adipocytes of rainbow trout (Oncorhynchus mykiss): The role of insulin and glucagon. Comp. Biochem. Physiol. Part A Mol. Integr. Physiol. 2005, 142, 347–354. [Google Scholar] [CrossRef] [PubMed]
- Albalat, A.; Sánchez-Gurmaches, J.; Gutiérrez, J.; Navarro, I. Regulation of lipoprotein lipase activity in rainbow trout (Oncorhynchus mykiss) tissues. Gen. Comp. Endocrinol. 2006, 146, 226–235. [Google Scholar] [CrossRef] [PubMed]
- Cruz-Garcia, L.; Saera-Vila, A.; Navarro, I.; Calduch-Giner, J.; Pérez-Sánchez, J. Targets for TNFα-induced lipolysis in gilthead sea bream (Sparus aurata L.) adipocytes isolated from lean and fat juvenile fish. J. Exp. Biol. 2009, 212, 2254–2260. [Google Scholar] [CrossRef]
- Todorčević, M.; Vegusdal, A.; Gjoen, T.; Sundvold, H.; Torstensen, B.E.; Kjaer, M.A.; Ruyter, B. Changes in fatty acids metabolism during differentiation of Atlantic salmon preadipocytes; effects of n-3 and n-9 fatty acids. Biochim. Biophys. ActaMol. Cell Biol. Lipids 2008, 1781, 326–335. [Google Scholar] [CrossRef] [PubMed]
- Todorčević, M.; Kjær, M.A.; Djaković, N.; Vegusdal, A.; Torstensen, B.E.; Ruyter, B. N-3 HUFAs affect fat deposition, susceptibility to oxidative stress, and apoptosis in Atlantic salmon visceral adipose tissue. Comp. Biochem. Physiol. Part B Biochem. Mol. Biol. 2009, 152, 135–143. [Google Scholar] [CrossRef]
- Albalat, A.; Gomez-Requeni, P.; Rojas, P.; Medale, F.; Kaushik, S.; Vianen, G.J.; Van den Thillart, G.; Gutierrez, J.; Perez-Sanchez, J.; Navarro, I. Nutritional and hormonal control of lipolysis in isolated gilthead seabream (Sparus aurata) adipocytes. Am. J. Physiol. Regul. Integr. Comp. Physiol. 2005, 289, R259–R265. [Google Scholar] [CrossRef] [PubMed]
- Cruz-Garcia, L.; Sanchez-Gurmaches, J.; Bouraoui, L.; Saera-Vila, A.; Perez-Sanchez, J.; Gutierrez, J.; Navarro, I. Changes in adipocyte cell size, gene expression of lipid metabolism markers, and lipolytic responses induced by dietary fish oil replacement in gilthead sea bream (Sparus aurata L.). Comp. Biochem. Physiol. Part A Mol. Integr. Physiol. 2011, 158, 391–399. [Google Scholar] [CrossRef]
- Blüher, M.; Mantzoros, C.S. From leptin to other adipokines in health and disease: Facts and expectations at the beginning of the 21st century. Metabolism 2015, 64, 131–145. [Google Scholar] [CrossRef]
- Schoettl, T.; Fischer, I.P.; Ussar, S. Heterogeneity of adipose tissue in development and metabolic function. J. Exp. Biol. 2018, 221 (Suppl. 1), jeb162958. [Google Scholar] [CrossRef]
- Deck, C.A.; Honeycutt, J.L.; Cheung, E.; Reynolds, H.M.; Borski, R.J. Assessing the functional role of leptin in energy homeostasis and the stress response in vertebrates. Front. Endocrinol. 2017, 8, 63. [Google Scholar] [CrossRef]
- Klein, S.; Coppack, S.W.; Mohamed-Ali, V.; Landt, M. Adipose tissue leptin production and plasma leptin kinetics in humans. Diabetes 1996, 45, 984–987. [Google Scholar] [CrossRef] [PubMed]
- Zhang, Y.; Proenca, R.; Maffei, M.; Barone, M.; Leopold, L.; Friedman, J.M. Positional cloning of the mouse obese gene and its human homologue. Nature 1994, 372, 425. [Google Scholar] [CrossRef] [PubMed]
- Maffei, M.; Halaas, J.; Ravussin, E.; Pratley, R.; Lee, G.; Zhang, Y.; Fei, H.; Kim, S.; Lallone, R.; Ranganathan, S. Leptin levels in human and rodent: Measurement of plasma leptin and ob RNA in obese and weight-reduced subjects. Nat. Med. 1995, 1, 1155. [Google Scholar] [CrossRef] [PubMed]
- Rønnestad, I.; Nilsen, T.O.; Murashita, K.; Angotzi, A.R.; Moen, A.-G.G.; Stefansson, S.O.; Kling, P.; Björnsson, B.T.; Kurokawa, T. Leptin and leptin receptor genes in Atlantic salmon: Cloning, phylogeny, tissue distribution and expression correlated to long-term feeding status. Gen. Comp. Endocrinol. 2010, 168, 55–70. [Google Scholar] [CrossRef] [PubMed]
- Kurokawa, T.; Uji, S.; Suzuki, T. Identification of cDNA coding for a homologue to mammalian leptin from pufferfish, Takifugu rubripes. Peptides 2005, 26, 745–750. [Google Scholar] [CrossRef]
- Murashita, K.; Uji, S.; Yamamoto, T.; Rønnestad, I.; Kurokawa, T. Production of recombinant leptin and its effects on food intake in rainbow trout (Oncorhynchus mykiss). Comp. Biochem. Physiol. Part B Biochem. Mol. Biol. 2008, 150, 377–384. [Google Scholar] [CrossRef]
- Johansson, M.; Morgenroth, D.; Einarsdottir, I.E.; Gong, N.; Björnsson, B.T. Energy stores, lipid mobilization and leptin endocrinology of rainbow trout. J. Comp. Physiol. B 2016, 186, 759–773. [Google Scholar] [CrossRef]
- Aas, T.S.; Ytrestøyl, T.; Åsgård, T. Utilization of feed resources in the production of Atlantic salmon (Salmo salar) in Norway: An update for 2016. Aquac. Rep. 2019, 15, 100216. [Google Scholar] [CrossRef]
- Colombo, S.M.; Foroutani, M.B.; Parrish, C.C. Fats and Oils in Aquafeed Formulations. In Bailey’s Industrial Oil and Fat Products; Shahidi, F., Ed.; Wiley Online Library: Hoboken, NJ, USA, 2020; pp. 1–28. [Google Scholar]
- Bou, M.; Berge, G.M.; Baeverfjord, G.; Sigholt, T.; Østbye, T.-K.; Romarheim, O.H.; Hatlen, B.; Leeuwis, R.; Venegas, C.; Ruyter, B. Requirements of n-3 very long-chain PUFA in Atlantic salmon (Salmo salar L.): Effects of different dietary levels of EPA and DHA on fish performance and tissue composition and integrity. Br. J. Nutr. 2017, 117, 30–47. [Google Scholar] [CrossRef]
- Fry, J.P.; Mailloux, N.A.; Love, D.C.; Milli, M.C.; Cao, L. Corrigendum: Feed conversion efficiency in aquaculture: Do we measure it correctly? (2018 Environ. Res. Lett. 13 024017). Environ. Res. Lett. 2018, 13, 079502. [Google Scholar] [CrossRef]
- Fry, J.P.; Mailloux, N.A.; Love, D.C.; Milli, M.C.; Cao, L. Feed conversion efficiency in aquaculture: Do we measure it correctly? Environ. Res. Lett. 2018, 13, 024017. [Google Scholar] [CrossRef]
- Todorcevic, M.; Skugor, S.; Krasnov, A.; Ruyter, B. Gene expression profiles in Atlantic salmon adipose-derived stromo-vascular fraction during differentiation into adipocytes. BMC Genom. 2010, 11, 39. [Google Scholar] [CrossRef] [PubMed]
- Berge, R.K.; Madsen, L.; Vaagenes, H.; Tronstad, K.J.; Gottlicher, M.; Rustan, A.C. In contrast with docosahexaenoic acid, eicosapentaenoic acid and hypolipidaemic derivatives decrease hepatic synthesis and secretion of triacylglycerol by decreased diacylglycerol acyltransferase activity and stimulation of fatty acid oxidation. Biochem. J. 1999, 343 Pt 1, 191–197. [Google Scholar] [CrossRef]
- Froyland, L.; Madsen, L.; Vaagenes, H.; Totland, G.K.; Auwerx, J.; Kryvi, H.; Staels, B.; Berge, R.K. Mitochondrion is the principal target for nutritional and pharmacological control of triglyceride metabolism. J. Lipid Res. 1997, 38, 1851–1858. [Google Scholar]
- Guo, W.; Xie, W.; Lei, T.; Hamilton, J.A. Eicosapentaenoic acid, but not oleic acid, stimulates β-oxidation in adipocytes. Lipids 2005, 40, 815–821. [Google Scholar] [CrossRef]
- Collins, J.M.; Neville, M.J.; Hoppa, M.B.; Frayn, K.N. De novo lipogenesis and stearoyl-CoA desaturase are coordinately regulated in the human adipocyte and protect against palmitate-induced cell injury. J. Biol. Chem. 2010, 285, 6044–6052. [Google Scholar] [CrossRef] [PubMed]
- Rustan, A.C.; Nossen, J.O.; Osmundsen, H.; Drevon, C.A. Eicosapentaenoic acid inhibits cholesterol esterification in cultured parenchymal cells and isolated microsomes from rat liver. J. Biol. Chem. 1988, 263, 8126–8132. [Google Scholar]
- Homma, Y. Comparison in inhibitory effects of lipolysis products on cholesterol esterification. Artery 1989, 16, 233–247. [Google Scholar]
- Rosqvist, F.; Bjermo, H.; Kullberg, J.; Johansson, L.; Michaëlsson, K.; Ahlström, H.; Lind, L.; Risérus, U. Fatty acid composition in serum cholesterol esters and phospholipids is linked to visceral and subcutaneous adipose tissue content in elderly individuals: A cross-sectional study. Lipids Health Dis. 2017, 16, 68. [Google Scholar] [CrossRef]
- Awad, A.B.; Chattopadhyay, J.P. Effect of dietary saturated fatty acids on hormone-sensitive lipolysis in rat adipocytes. J. Nutr. 1986, 116, 1088–1094. [Google Scholar] [CrossRef] [PubMed]
- Matsuo, T.; Sumida, H.; Suzuki, M. Beef tallow diet decreases beta-adrenergic receptor binding and lipolytic activities in different adipose tissues of rat. Metabolism 1995, 44, 1271–1277. [Google Scholar] [CrossRef]
- Fernandez-Quintela, A.; Churruca, I.; Portillo, M.P. The role of dietary fat in adipose tissue metabolism. Public Health Nutr. 2007, 10, 1126–1131. [Google Scholar] [CrossRef] [PubMed]
- Raclot, T.; Mioskowski, E.; Bach, A.C.; Groscolas, R. Selectivity of fatty acid mobilization: A general metabolic feature of adipose tissue. Am. J. Physiol. 1995, 269 Pt 2, R1060–R1067. [Google Scholar] [CrossRef]
- Fournier, N.; Sayet, G.; Vedie, B.; Nowak, M.; Allaoui, F.; Solgadi, A.; Caudron, E.; Chaminade, P.; Benoist, J.F.; Paul, J.L. Eicosapentaenoic acid membrane incorporation impairs cholesterol efflux from cholesterol-loaded human macrophages by reducing the cholesteryl ester mobilization from lipid droplets. Biochim Biophys Acta Mol Cell Biol Lipids 2017, 1862 Pt A, 1079–1091. [Google Scholar] [CrossRef]
- Li, Y.-h.; Liu, L. Apolipoprotein E synthesized by adipocyte and apolipoprotein E carried on lipoproteins modulate adipocyte triglyceride content. Lipids Health Dis. 2014, 13, 136. [Google Scholar] [CrossRef] [PubMed]
- Kypreos, K.E.; Zannis, V.I. Pathway of biogenesis of apolipoprotein E-containing HDL in vivo with the participation of ABCA1 and LCAT. Biochem. J. 2007, 403, 359–367. [Google Scholar] [CrossRef]
- Semenkovich, C.F.; Wims, M.; Noe, L.; Etienne, J.; Chan, L. Insulin regulation of lipoprotein lipase activity in 3T3-L1 adipocytes is mediated at posttranscriptional and posttranslational levels. J. Biol. Chem. 1989, 264, 9030–9038. [Google Scholar]
- Zechner, R.; Zimmermann, R.; Eichmann, T.O.; Kohlwein, S.D.; Haemmerle, G.; Lass, A.; Madeo, F. FAT SIGNALS--lipases and lipolysis in lipid metabolism and signaling. Cell Metab. 2012, 15, 279–291. [Google Scholar] [CrossRef]
- Frederich, R.C.; Hamann, A.; Anderson, S.; Lollmann, B.; Lowell, B.B.; Flier, J.S. Leptin levels reflect body lipid content in mice: Evidence for diet-induced resistance to leptin action. Nat. Med. 1995, 1, 1311–1314. [Google Scholar] [CrossRef]
- Ahima, R.S.; Prabakaran, D.; Mantzoros, C.; Qu, D.; Lowell, B.; Maratos-Flier, E.; Flier, J.S. Role of leptin in the neuroendocrine response to fasting. Nature 1996, 382, 250–252. [Google Scholar] [CrossRef] [PubMed]
- Salmeron, C.; Johansson, M.; Angotzi, A.R.; Ronnestad, I.; Jonsson, E.; Bjornsson, B.T.; Gutierrez, J.; Navarro, I.; Capilla, E. Effects of nutritional status on plasma leptin levels and in vitro regulation of adipocyte leptin expression and secretion in rainbow trout. Gen. Comp. Endocrinol 2015, 210, 114–123. [Google Scholar] [CrossRef] [PubMed]
- Rojo-Martinez, G.; Soriguer, F.; Gonzalez-Romero, S.; Tinahones, F.; Moreno, F.; de Adana, S.R.; Garriga, M.; Esteva, I.; Garcia-Arnes, J.; Gomez-Zumaquero, J. Serum leptin and habitual fatty acid dietary intake in patients with type 1 diabetes mellitus. Eur. J. Endocrinol. 2000, 142, 263–268. [Google Scholar] [CrossRef] [PubMed]
- Reseland, J.E.; Haugen, F.; Hollung, K.; Solvoll, K.; Halvorsen, B.; Brude, I.R.; Nenseter, M.S.; Christiansen, E.N.; Drevon, C.A. Reduction of leptin gene expression by dietary polyunsaturated fatty acids. J. Lipid Res. 2001, 42, 743–750. [Google Scholar] [PubMed]
- Kolaczynski, J.W.; Considine, R.V.; Ohannesian, J.; Marco, C.; Opentanova, I.; Nyce, M.R.; Myint, M.; Caro, J.F. Responses of leptin to short-term fasting and refeeding in humans: A link with ketogenesis but not ketones themselves. Diabetes 1996, 45, 1511–1515. [Google Scholar] [CrossRef] [PubMed]
- Saladin, R.; De Vos, P.; Guerre-Millot, M.; Leturque, A.; Girard, J.; Staels, B.; Auwerx, J. Transient increase in obese gene expression after food intake or insulin administration. Nature 1995, 377, 527–528. [Google Scholar] [CrossRef]
- Lee, M.J.; Yang, R.Z.; Gong, D.W.; Fried, S.K. Feeding and insulin increase leptin translation. Importance of the leptin mRNA untranslated regions. J. Biol. Chem. 2007, 282, 72–80. [Google Scholar] [CrossRef]
- Kling, P.; Ronnestad, I.; Stefansson, S.O.; Murashita, K.; Kurokawa, T.; Bjornsson, B.T. A homologous salmonid leptin radioimmunoassay indicates elevated plasma leptin levels during fasting of rainbow trout. Gen. Comp. Endocrinol. 2009, 162, 307–312. [Google Scholar] [CrossRef]
- Trombley, S.; Maugars, G.; Kling, P.; Bjornsson, B.T.; Schmitz, M. Effects of long-term restricted feeding on plasma leptin, hepatic leptin expression and leptin receptor expression in juvenile Atlantic salmon (Salmo salar L.). Gen. Comp. Endocrinol. 2012, 175, 92–99. [Google Scholar] [CrossRef]
- Angotzi, A.R.; Stefansson, S.O.; Nilsen, T.O.; Rathore, R.M.; Ronnestad, I. Molecular cloning and genomic characterization of novel leptin-like genes in salmonids provide new insight into the evolution of the Leptin gene family. Gen. Comp. Endocrinol. 2013, 187, 48–59. [Google Scholar] [CrossRef]
- Angotzi, A.R.; Stefansson, S.O.; Nilsen, T.O.; Ovrebo, J.I.; Andersson, E.; Taranger, G.L.; Ronnestad, I. Identification of a novel leptin receptor duplicate in Atlantic salmon: Expression analyses in different life stages and in response to feeding status. Gen. Comp. Endocrinol. 2016, 235, 108–119. [Google Scholar] [CrossRef] [PubMed]
- Bereiter-Hahn, J. Behavior of mitochondria in the living cell. Int. Rev. Cytol. 1990, 122, 1–63. [Google Scholar] [PubMed]
- Bereiter-Hahn, J.; Voth, M. Dynamics of mitochondria in living cells: Shape changes, dislocations, fusion, and fission of mitochondria. Microsc. Res. Tech. 1994, 27, 198–219. [Google Scholar] [CrossRef]
- Van der Bliek, A.M.; Shen, Q.; Kawajiri, S. Mechanisms of mitochondrial fission and fusion. Cold Spring Harb. Perspect. Biol. 2013, 5, a011072. [Google Scholar] [CrossRef] [PubMed]
- Liesa, M.; Shirihai, O.S. Mitochondrial Dynamics in the Regulation of Nutrient Utilization and Energy Expenditure. Cell Metab. 2013, 17, 491–506. [Google Scholar] [CrossRef]
- Lee, J.-Y.; Kapur, M.; Li, M.; Choi, M.-C.; Choi, S.; Kim, H.-J.; Kim, I.; Lee, E.; Taylor, J.P.; Yao, T.-P. MFN1 deacetylation activates adaptive mitochondrial fusion and protects metabolically challenged mitochondria. J. Cell Sci. 2014, 127, 4954–4963. [Google Scholar] [CrossRef]
- Rambold, A.S.; Kostelecky, B.; Elia, N.; Lippincott-Schwartz, J. Tubular network formation protects mitochondria from autophagosomal degradation during nutrient starvation. Proc. Natl. Acad. Sci. USA 2011, 108, 10190–10195. [Google Scholar] [CrossRef]
- Gomes, L.C.; Di Benedetto, G.; Scorrano, L. During autophagy mitochondria elongate, are spared from degradation and sustain cell viability. Nat. Cell Biol. 2011, 13, 589–598. [Google Scholar] [CrossRef]
- Molina, A.J.; Wikstrom, J.D.; Stiles, L.; Las, G.; Mohamed, H.; Elorza, A.; Walzer, G.; Twig, G.; Katz, S.; Corkey, B.E. Mitochondrial networking protects β-cells from nutrient-induced apoptosis. Diabetes 2009, 58, 2303–2315. [Google Scholar] [CrossRef]
- Senyilmaz-Tiebe, D.; Pfaff, D.H.; Virtue, S.; Schwarz, K.V.; Fleming, T.; Altamura, S.; Muckenthaler, M.U.; Okun, J.G.; Vidal-Puig, A.; Nawroth, P.; et al. Dietary stearic acid regulates mitochondria in vivo in humans. Nat. Commun. 2018, 9, 3129. [Google Scholar] [CrossRef]
- Kjaer, M.; Vegusdal, A.; Gjøen, T.; Rustan, A.; Todorčević, M.; Ruyter, B. Effect of rapeseed oil and dietary n-3 fatty acids on triacylglycerol synthesis and secretion in Atlantic salmon hepatocytes. Biochim. Biophys. Acta 2008, 1781, 112–122. [Google Scholar] [CrossRef] [PubMed]
- Vegusdal, A.; Gjoen, T.; Berge, R.K.; Thomassen, M.S.; Ruyter, B. Effect of 18:1n-9, 20:5n-3, and 22:6n-3 on lipid accumulation and secretion by Atlantic salmon hepatocytes. Lipids 2005, 40, 477–486. [Google Scholar] [CrossRef] [PubMed]
- Todorčević, M.; Hodson, L. The Effect of Marine Derived n-3 Fatty Acids on Adipose Tissue Metabolism and Function. J. Clin. Med. 2015, 5, 3. [Google Scholar] [CrossRef] [PubMed]
- Riera-Heredia, N.; Lutfi, E.; Sanchez-Moya, A.; Gutierrez, J.; Capilla, E.; Navarro, I. Short-Term Responses to Fatty Acids on Lipid Metabolism and Adipogenesis in Rainbow Trout (Oncorhynchus mykiss). Int. J. Mol. Sci. 2020, 21, 1623. [Google Scholar] [CrossRef] [PubMed]
- Folch, J.; Lees, M.; Sloane Stanley, G.H. A simple method for the isolation and purification of total lipides from animal tissues. J. Biol. Chem. 1957, 226, 497–509. [Google Scholar] [PubMed]
- Nikolova-Damyanova, B. Silver ion chromatography and lipids. In Adv. Lipid Methodol. One; Chrostie, W.W., Ed.; The Oily Press: Ayr, Scotland, 1992; pp. 181–237. [Google Scholar]
- Livak, K.J.; Schmittgen, T.D. Analysis of relative gene expression data using real-time quantitative PCR and the 2(-Delta Delta C(T)) Method. Methods (San DiegoCalif.) 2001, 25, 402–408. [Google Scholar] [CrossRef]
- Lowry, O.H.; Rosebrough, N.J.; Farr, A.L.; Randall, R.J. Protein measurement with the Folin phenol reagent. J. Biol. Chem. 1951, 193, 265–275. [Google Scholar]
- Peterson, G.L. A simplification of the protein assay method of Lowry et al. which is more generally applicable. Anal. Biochem. 1977, 83, 346–356. [Google Scholar] [CrossRef]


© 2020 by the authors. Licensee MDPI, Basel, Switzerland. This article is an open access article distributed under the terms and conditions of the Creative Commons Attribution (CC BY) license (http://creativecommons.org/licenses/by/4.0/).