Detection of Rare Objects by Flow Cytometry: Imaging, Cell Sorting, and Deep Learning Approaches

 , , ,
, , ,  ,
, 
Abstract
1. Introduction
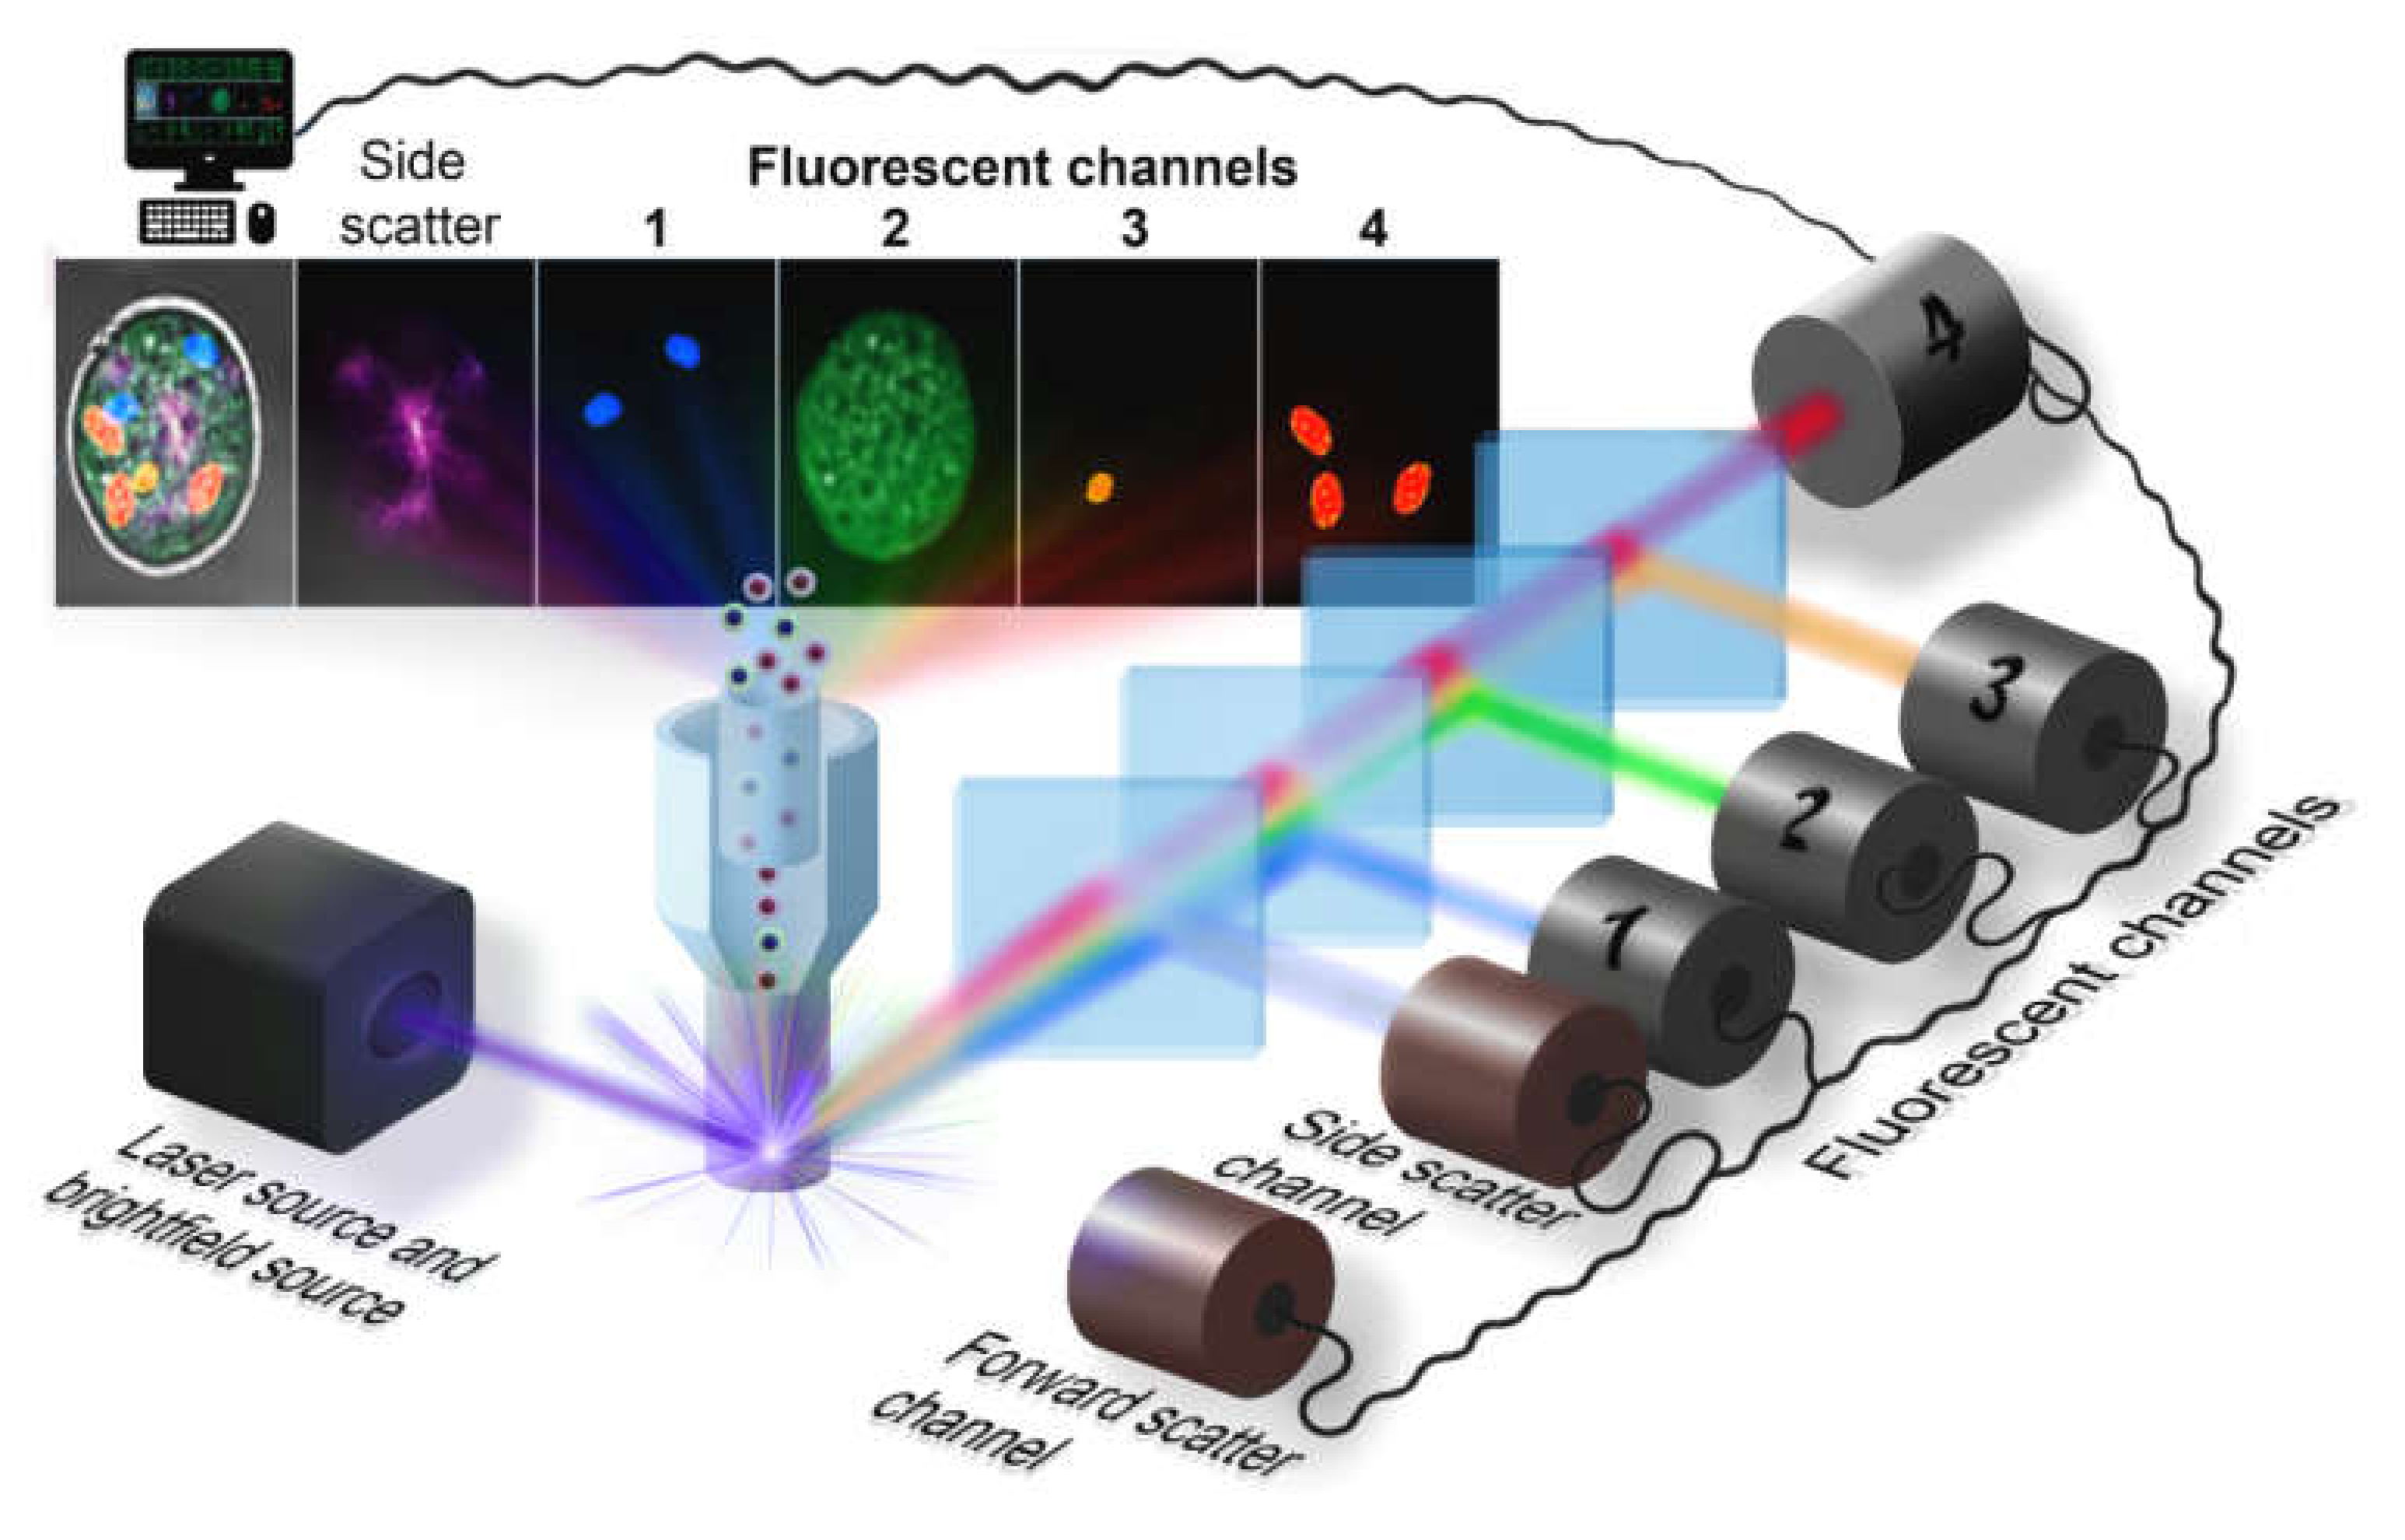
2. Flow Cytometry Hardware
2.1. Illumination Subsystem
2.1.1. Laser Separation
2.1.2. Laser Type
2.1.3. Beam Shape and Quality
2.1.4. Laser Delivery
2.1.5. Laser Coherence
2.2. Optical Arrangement
2.3. Camera
3. Cell Labeling
3.1. Fluorescent Labeling
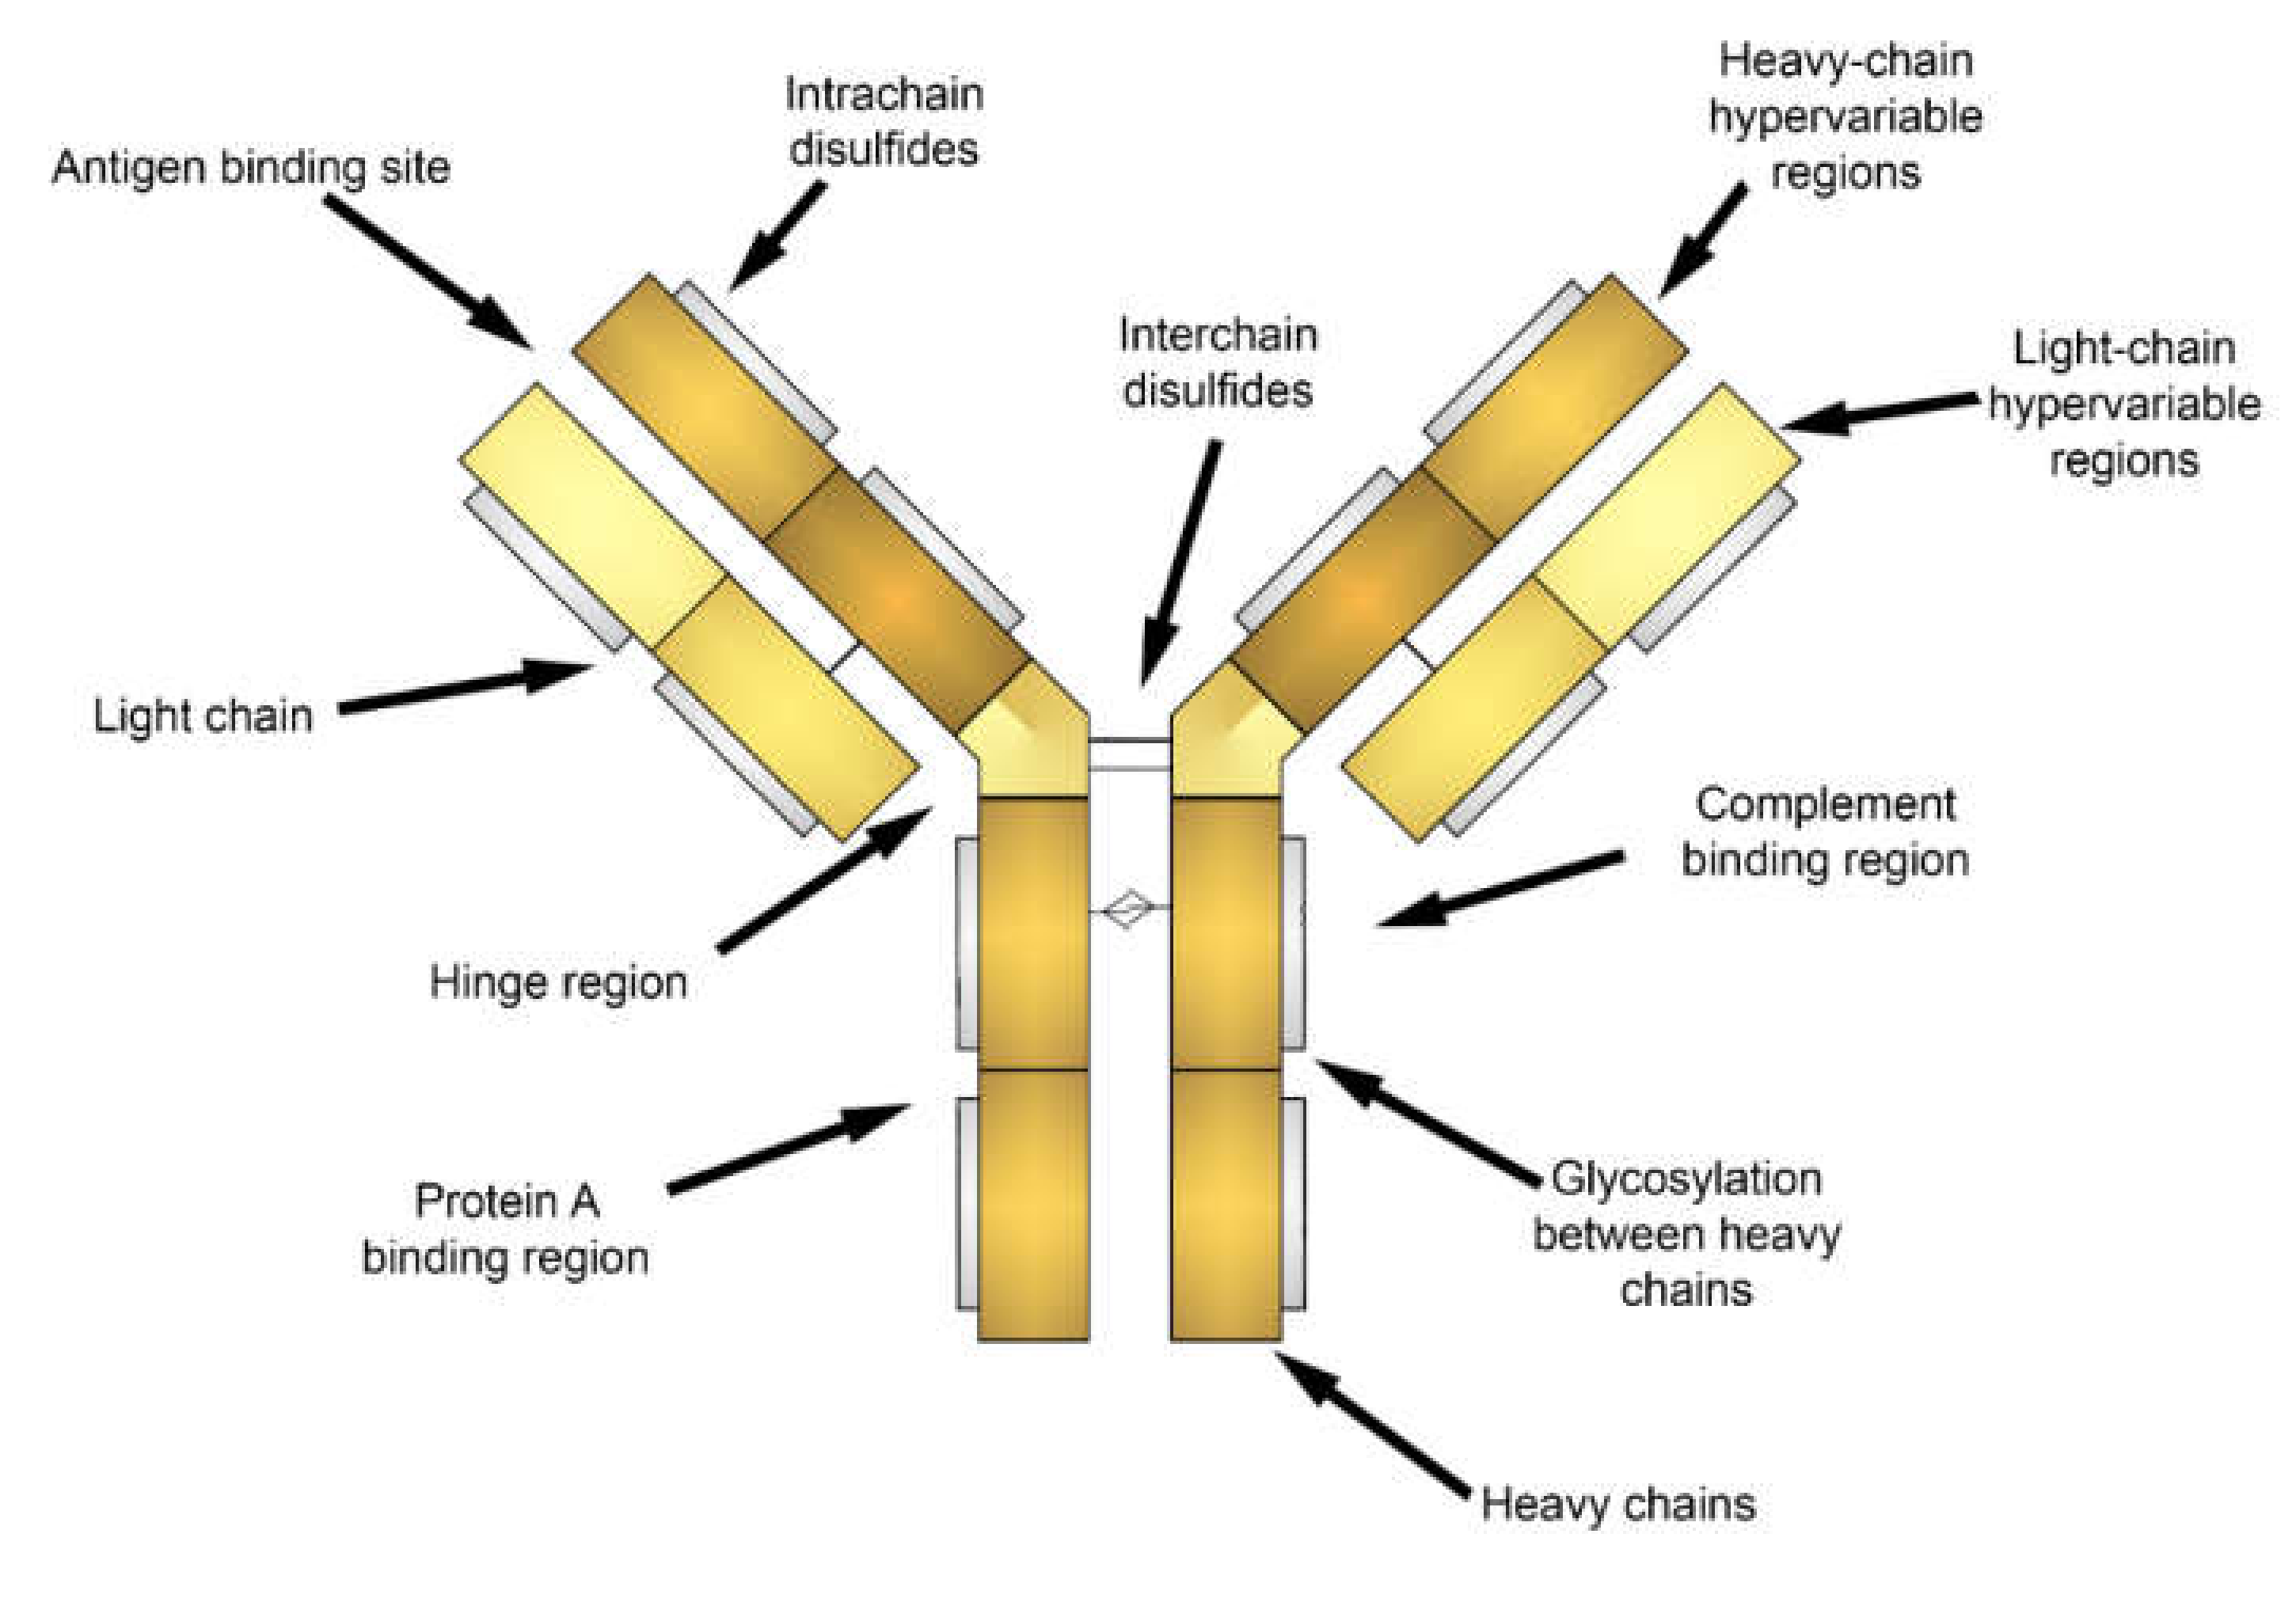
3.1.1. Fluorescent Label Conjugated Antibodies
3.1.2. Cell Tracking Dyes
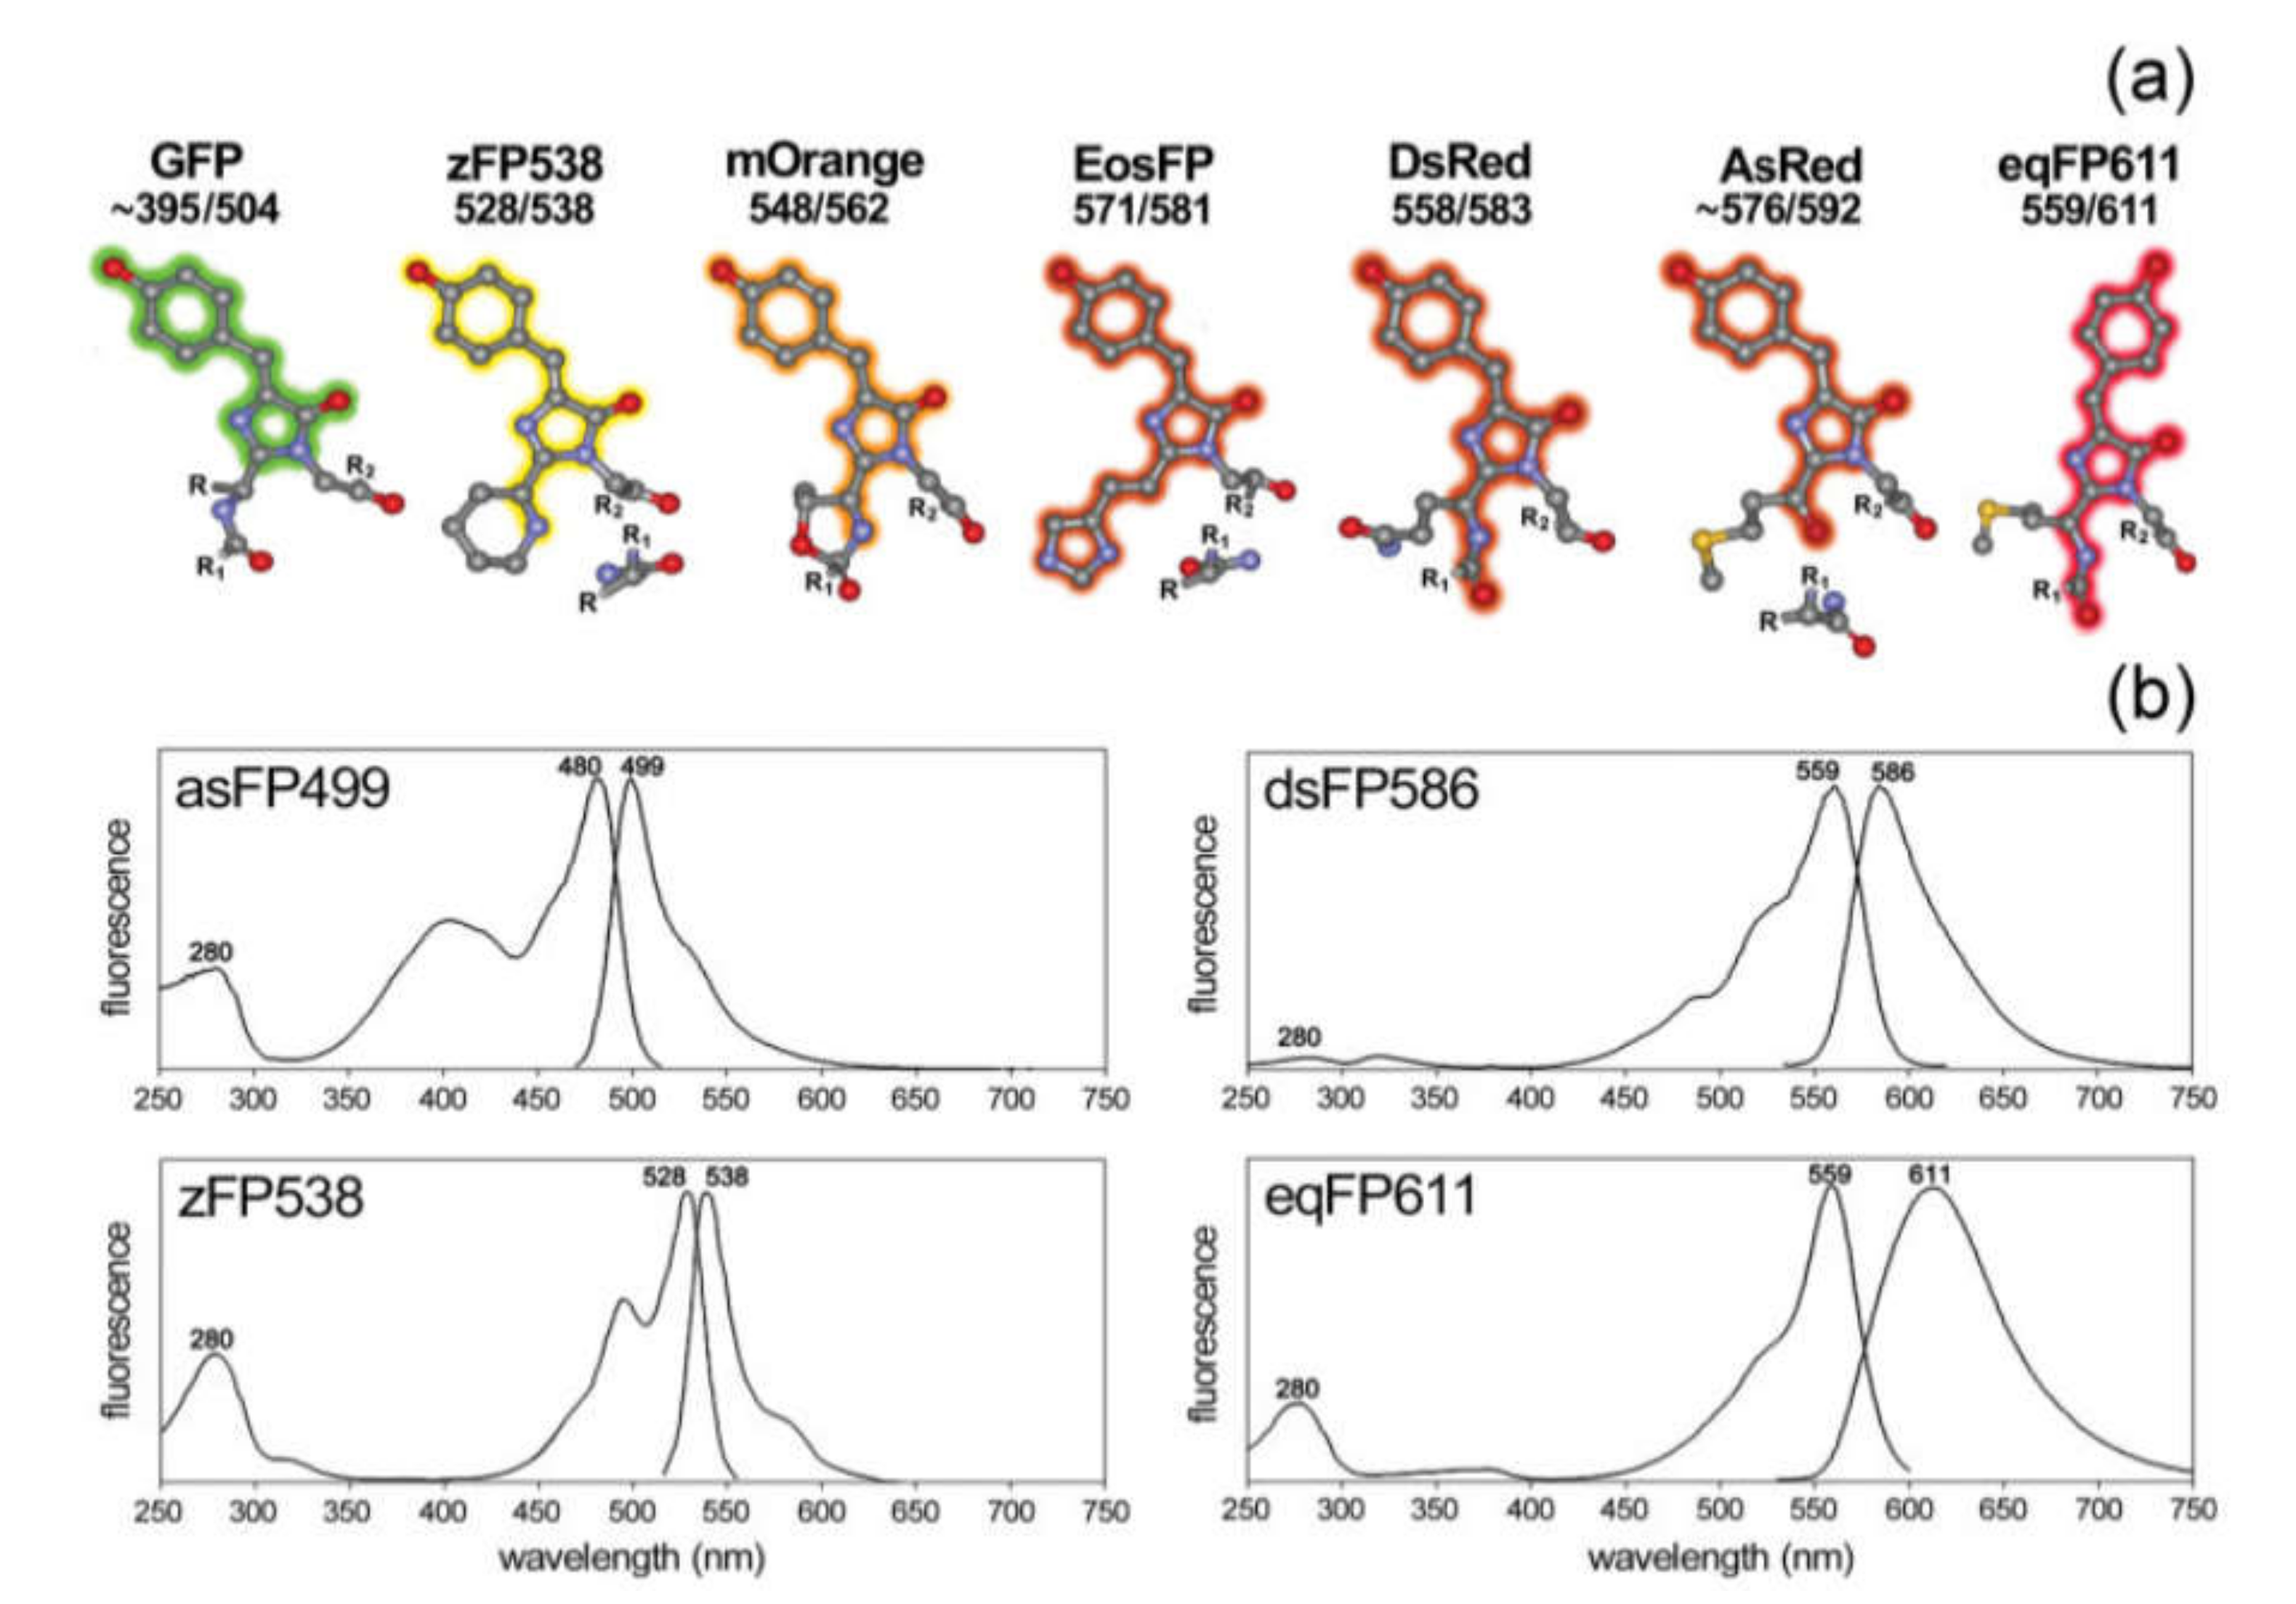
3.1.3. Fluorescent Proteins
3.2. Labeling by Magnetic Beads
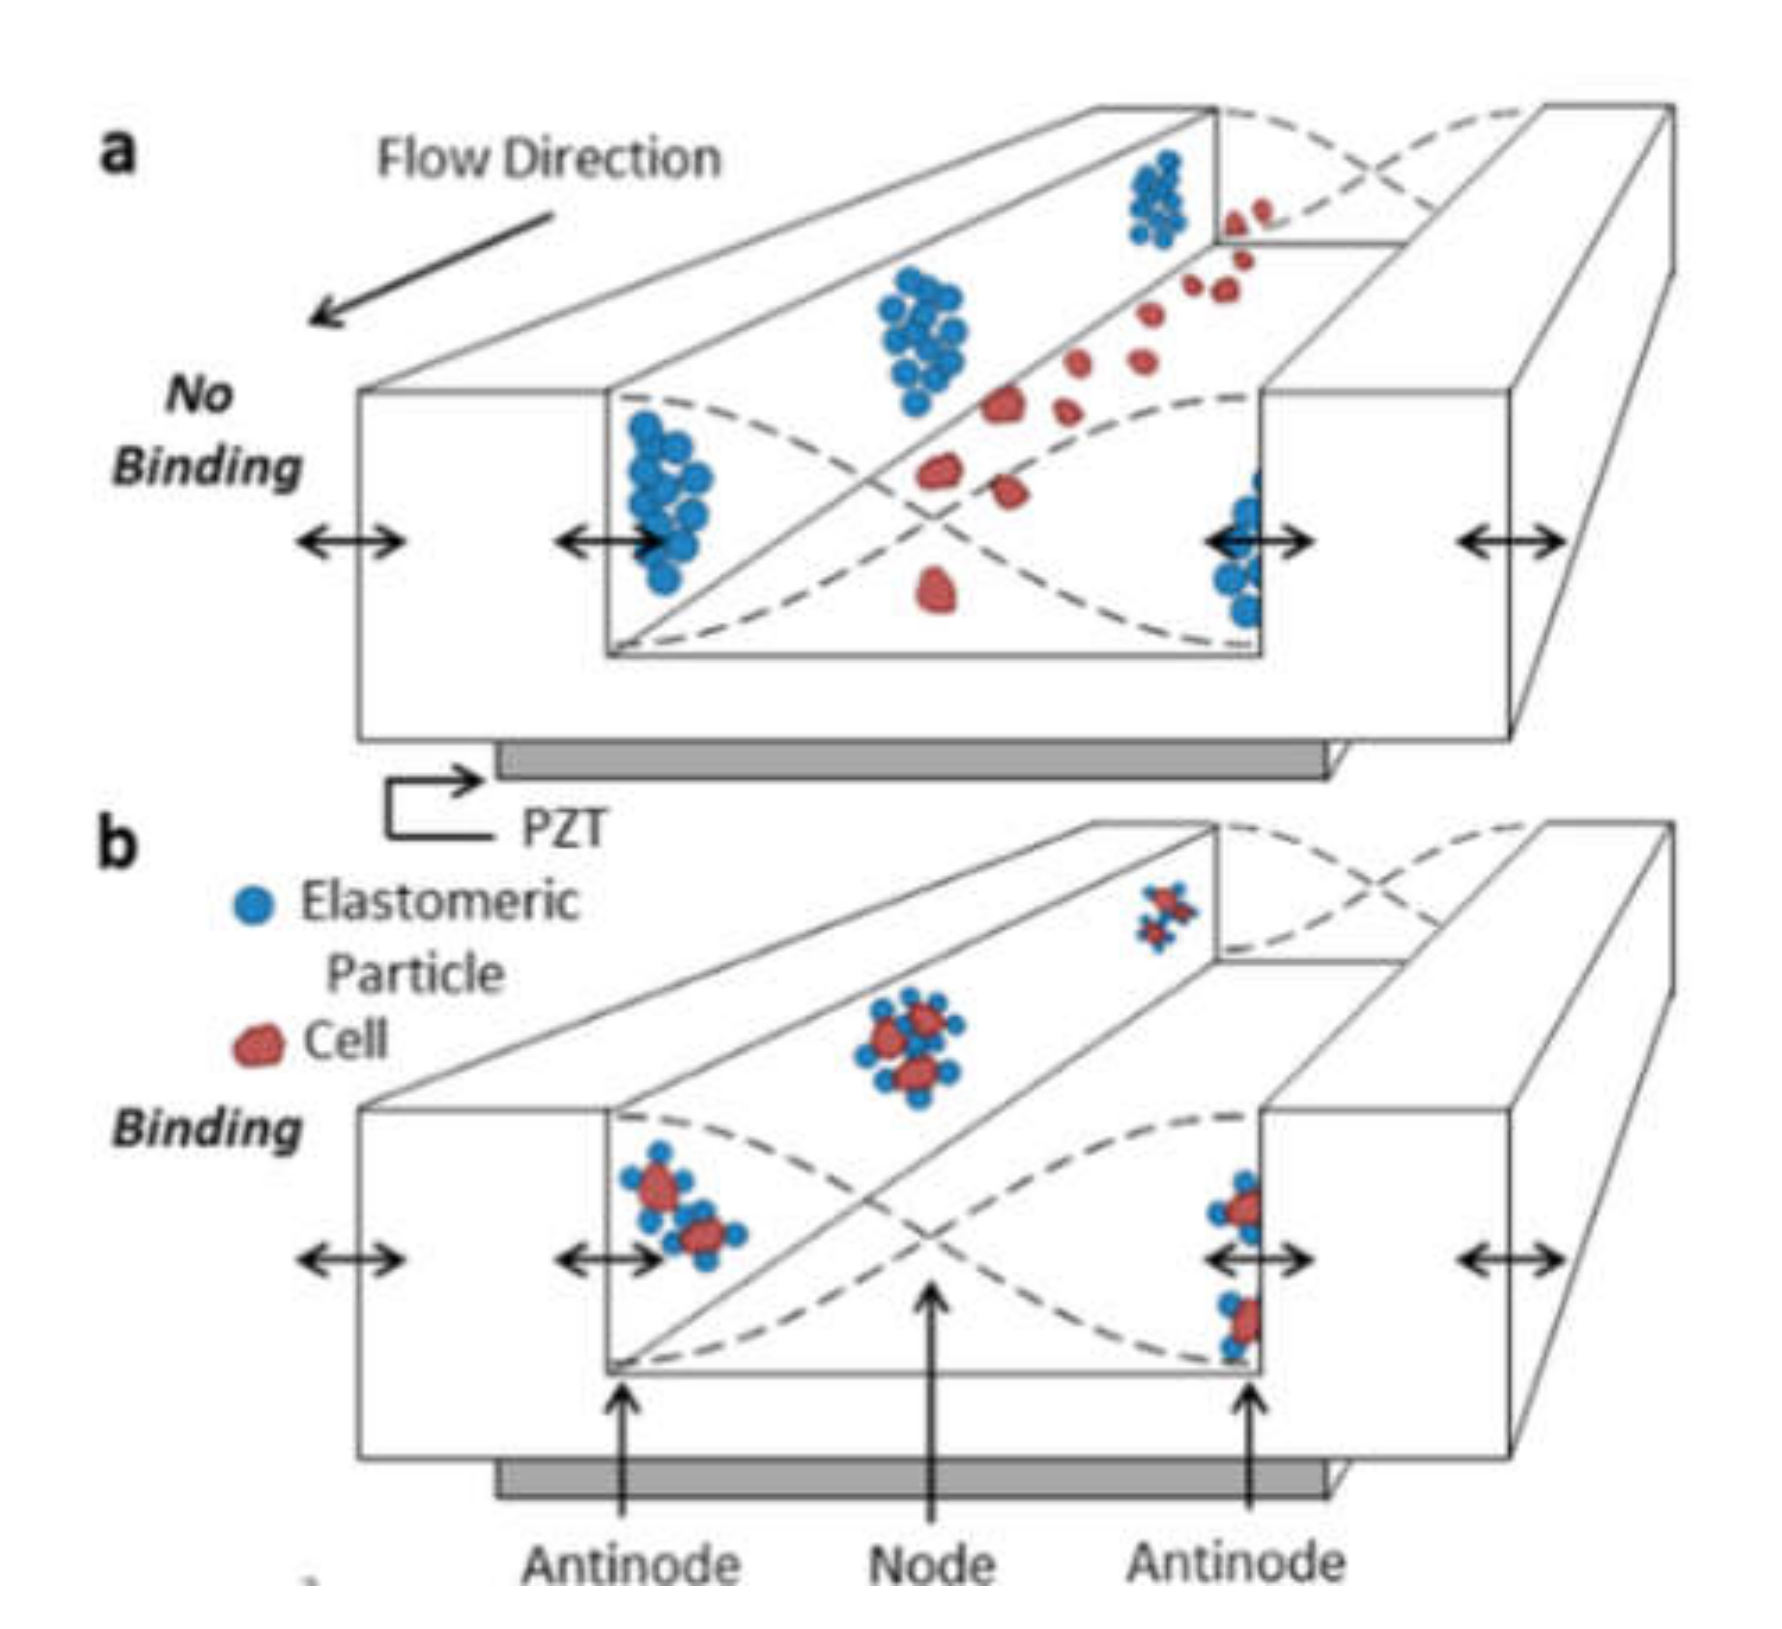
3.3. Labeling by Negative Acoustic Contrast Particles
4. The Fluidic System for Sample Preparation, Flow Cytometry Measurement, and Cell Sorting
4.1. Sample Enrichment by Target Cells
4.1.1. Red Blood Cell Lysis
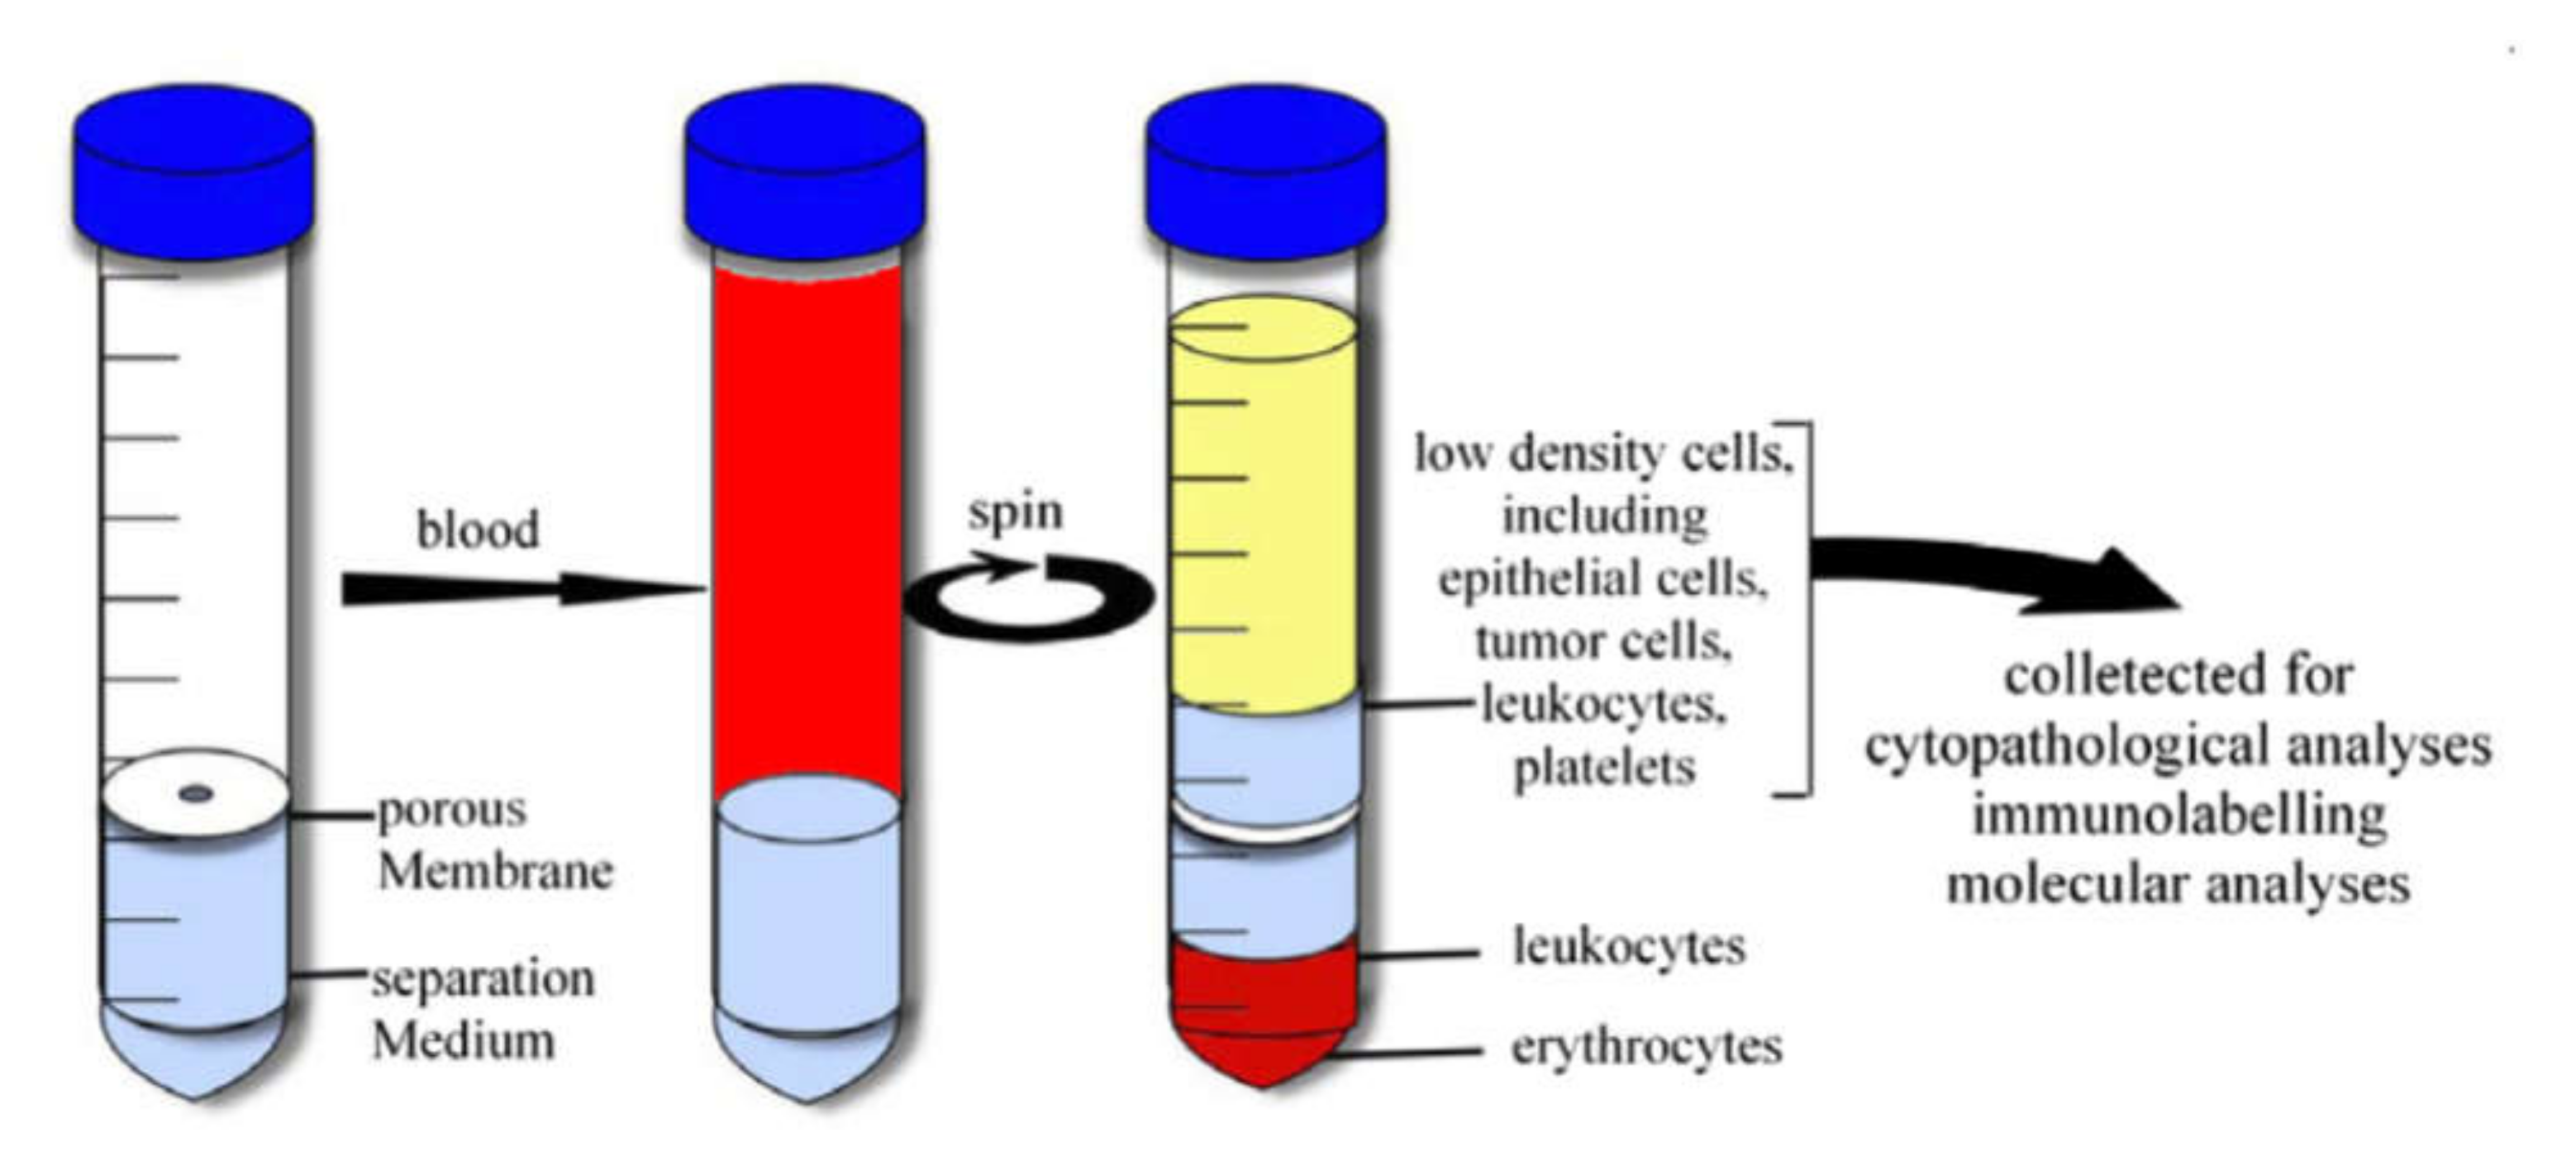
4.1.2. Density Gradient Centrifugation
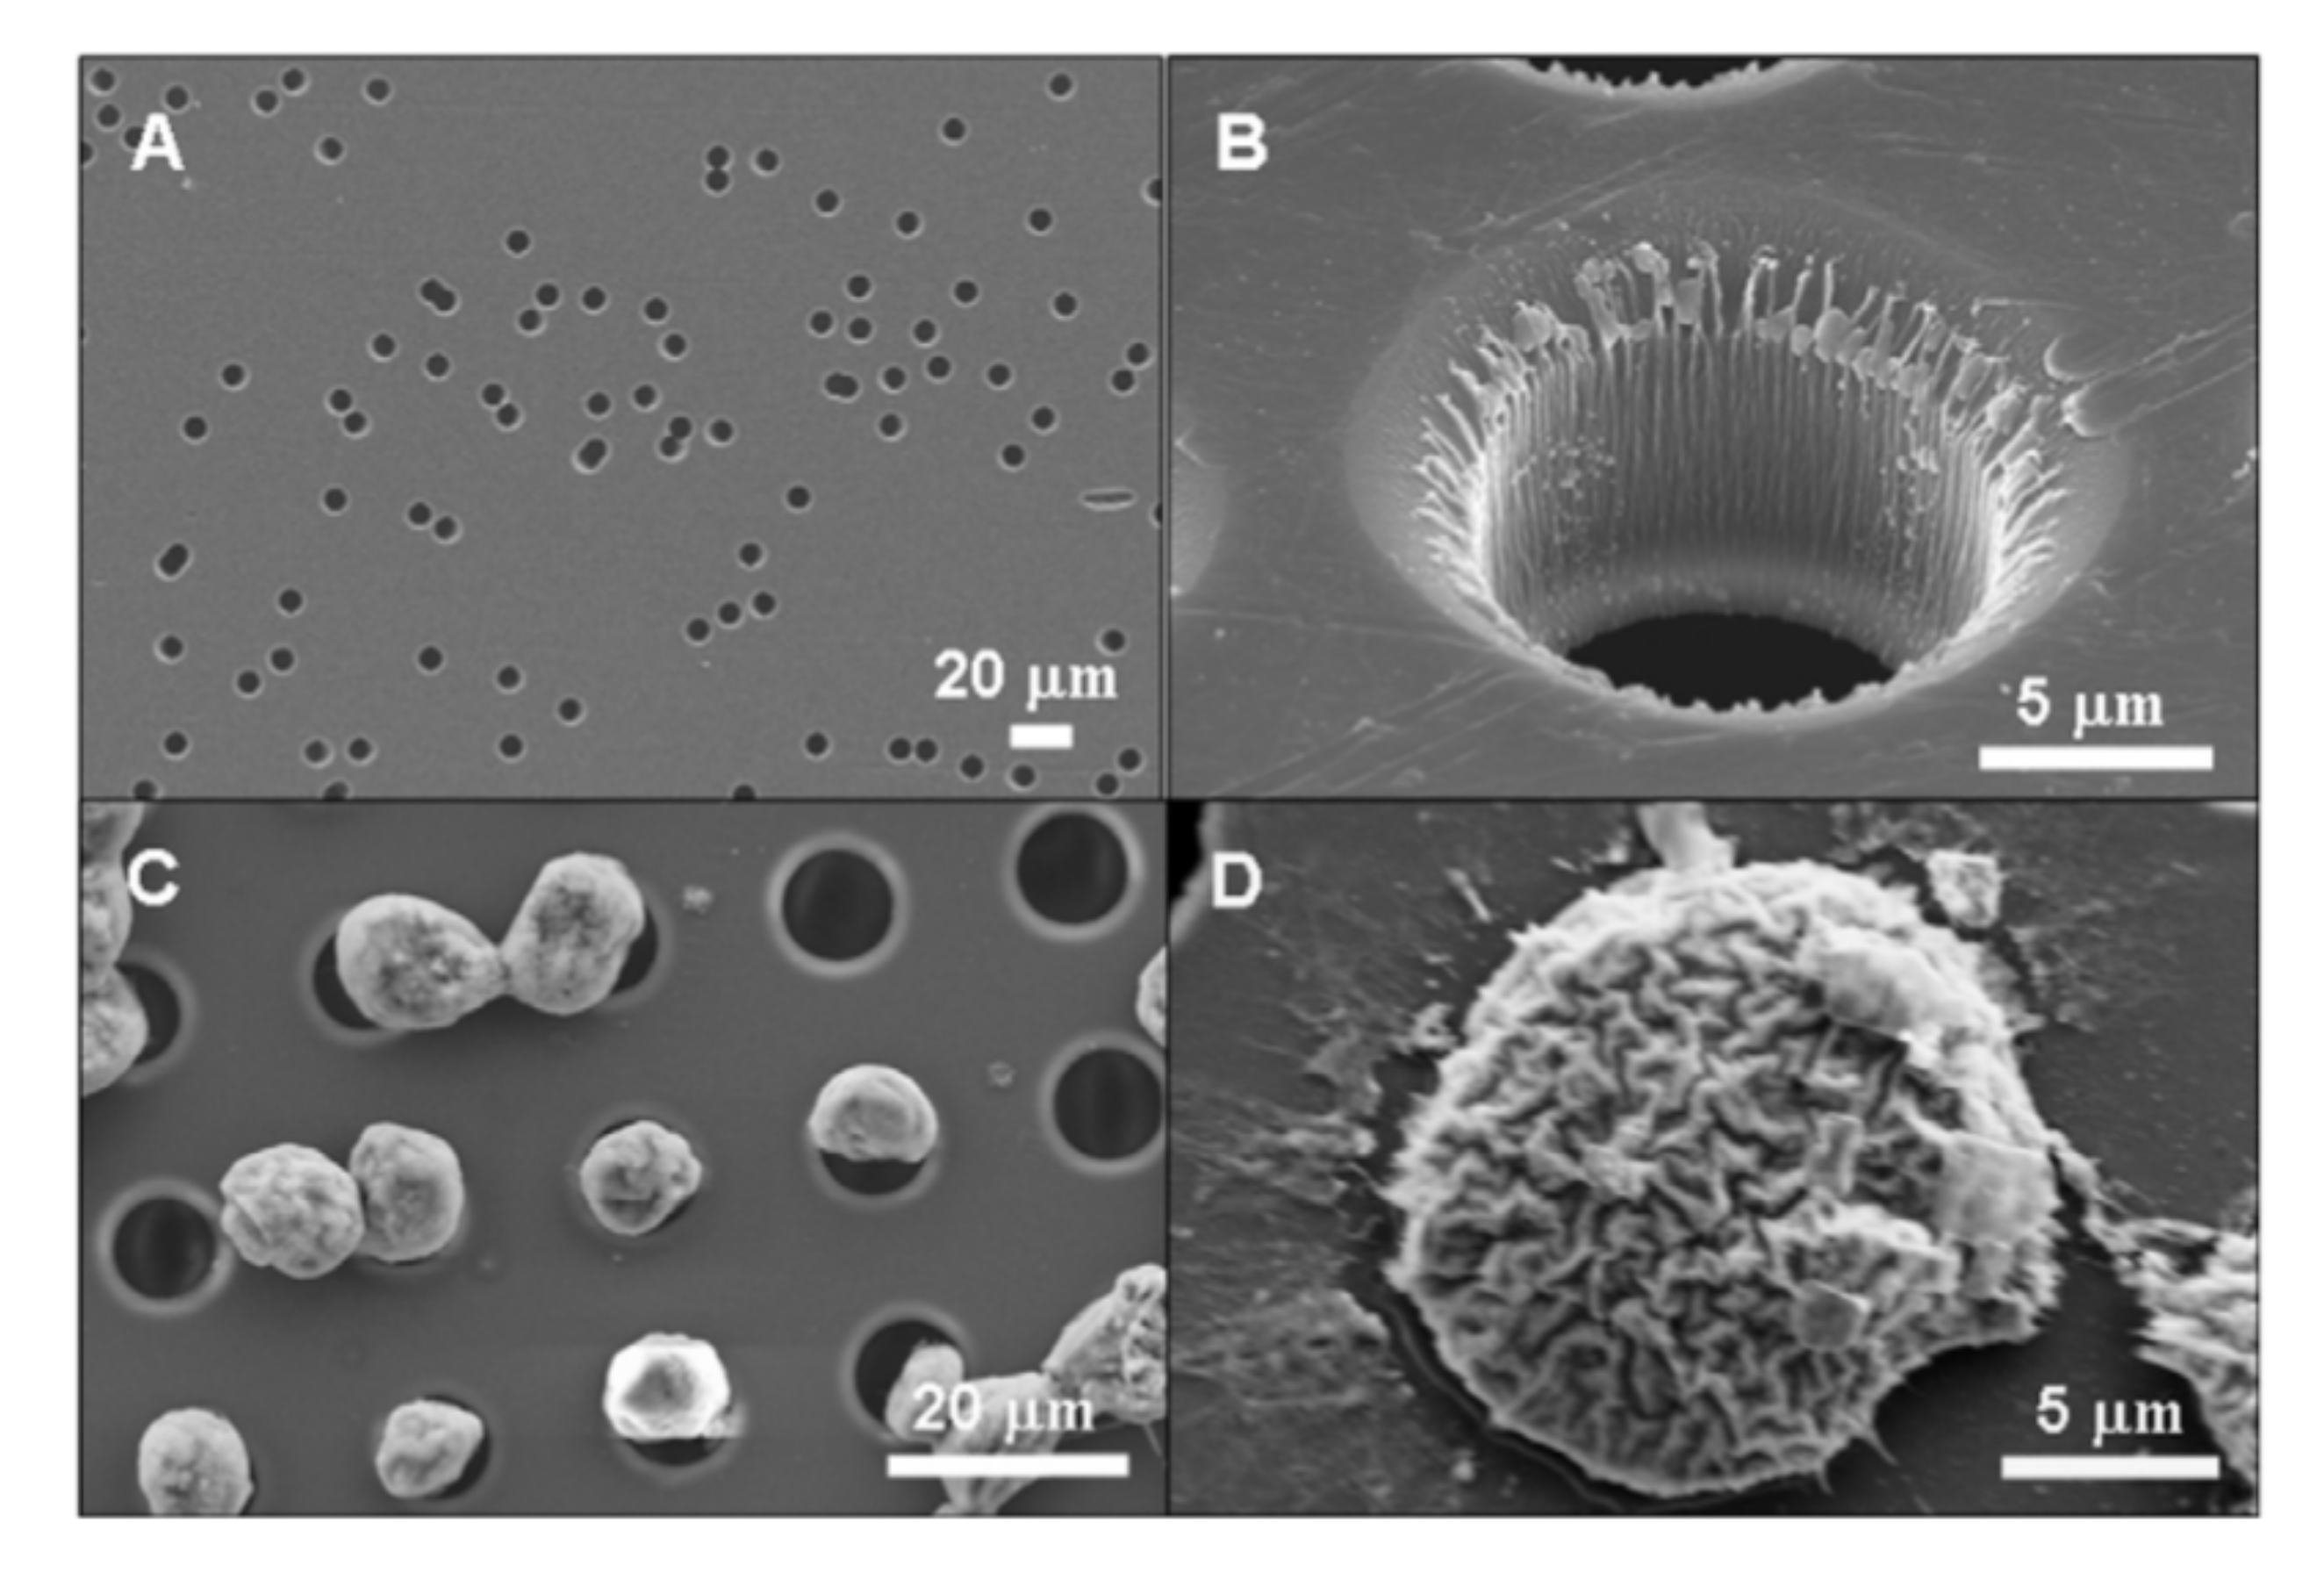
4.1.3. Cell Filtration
4.2. Sample Focusing
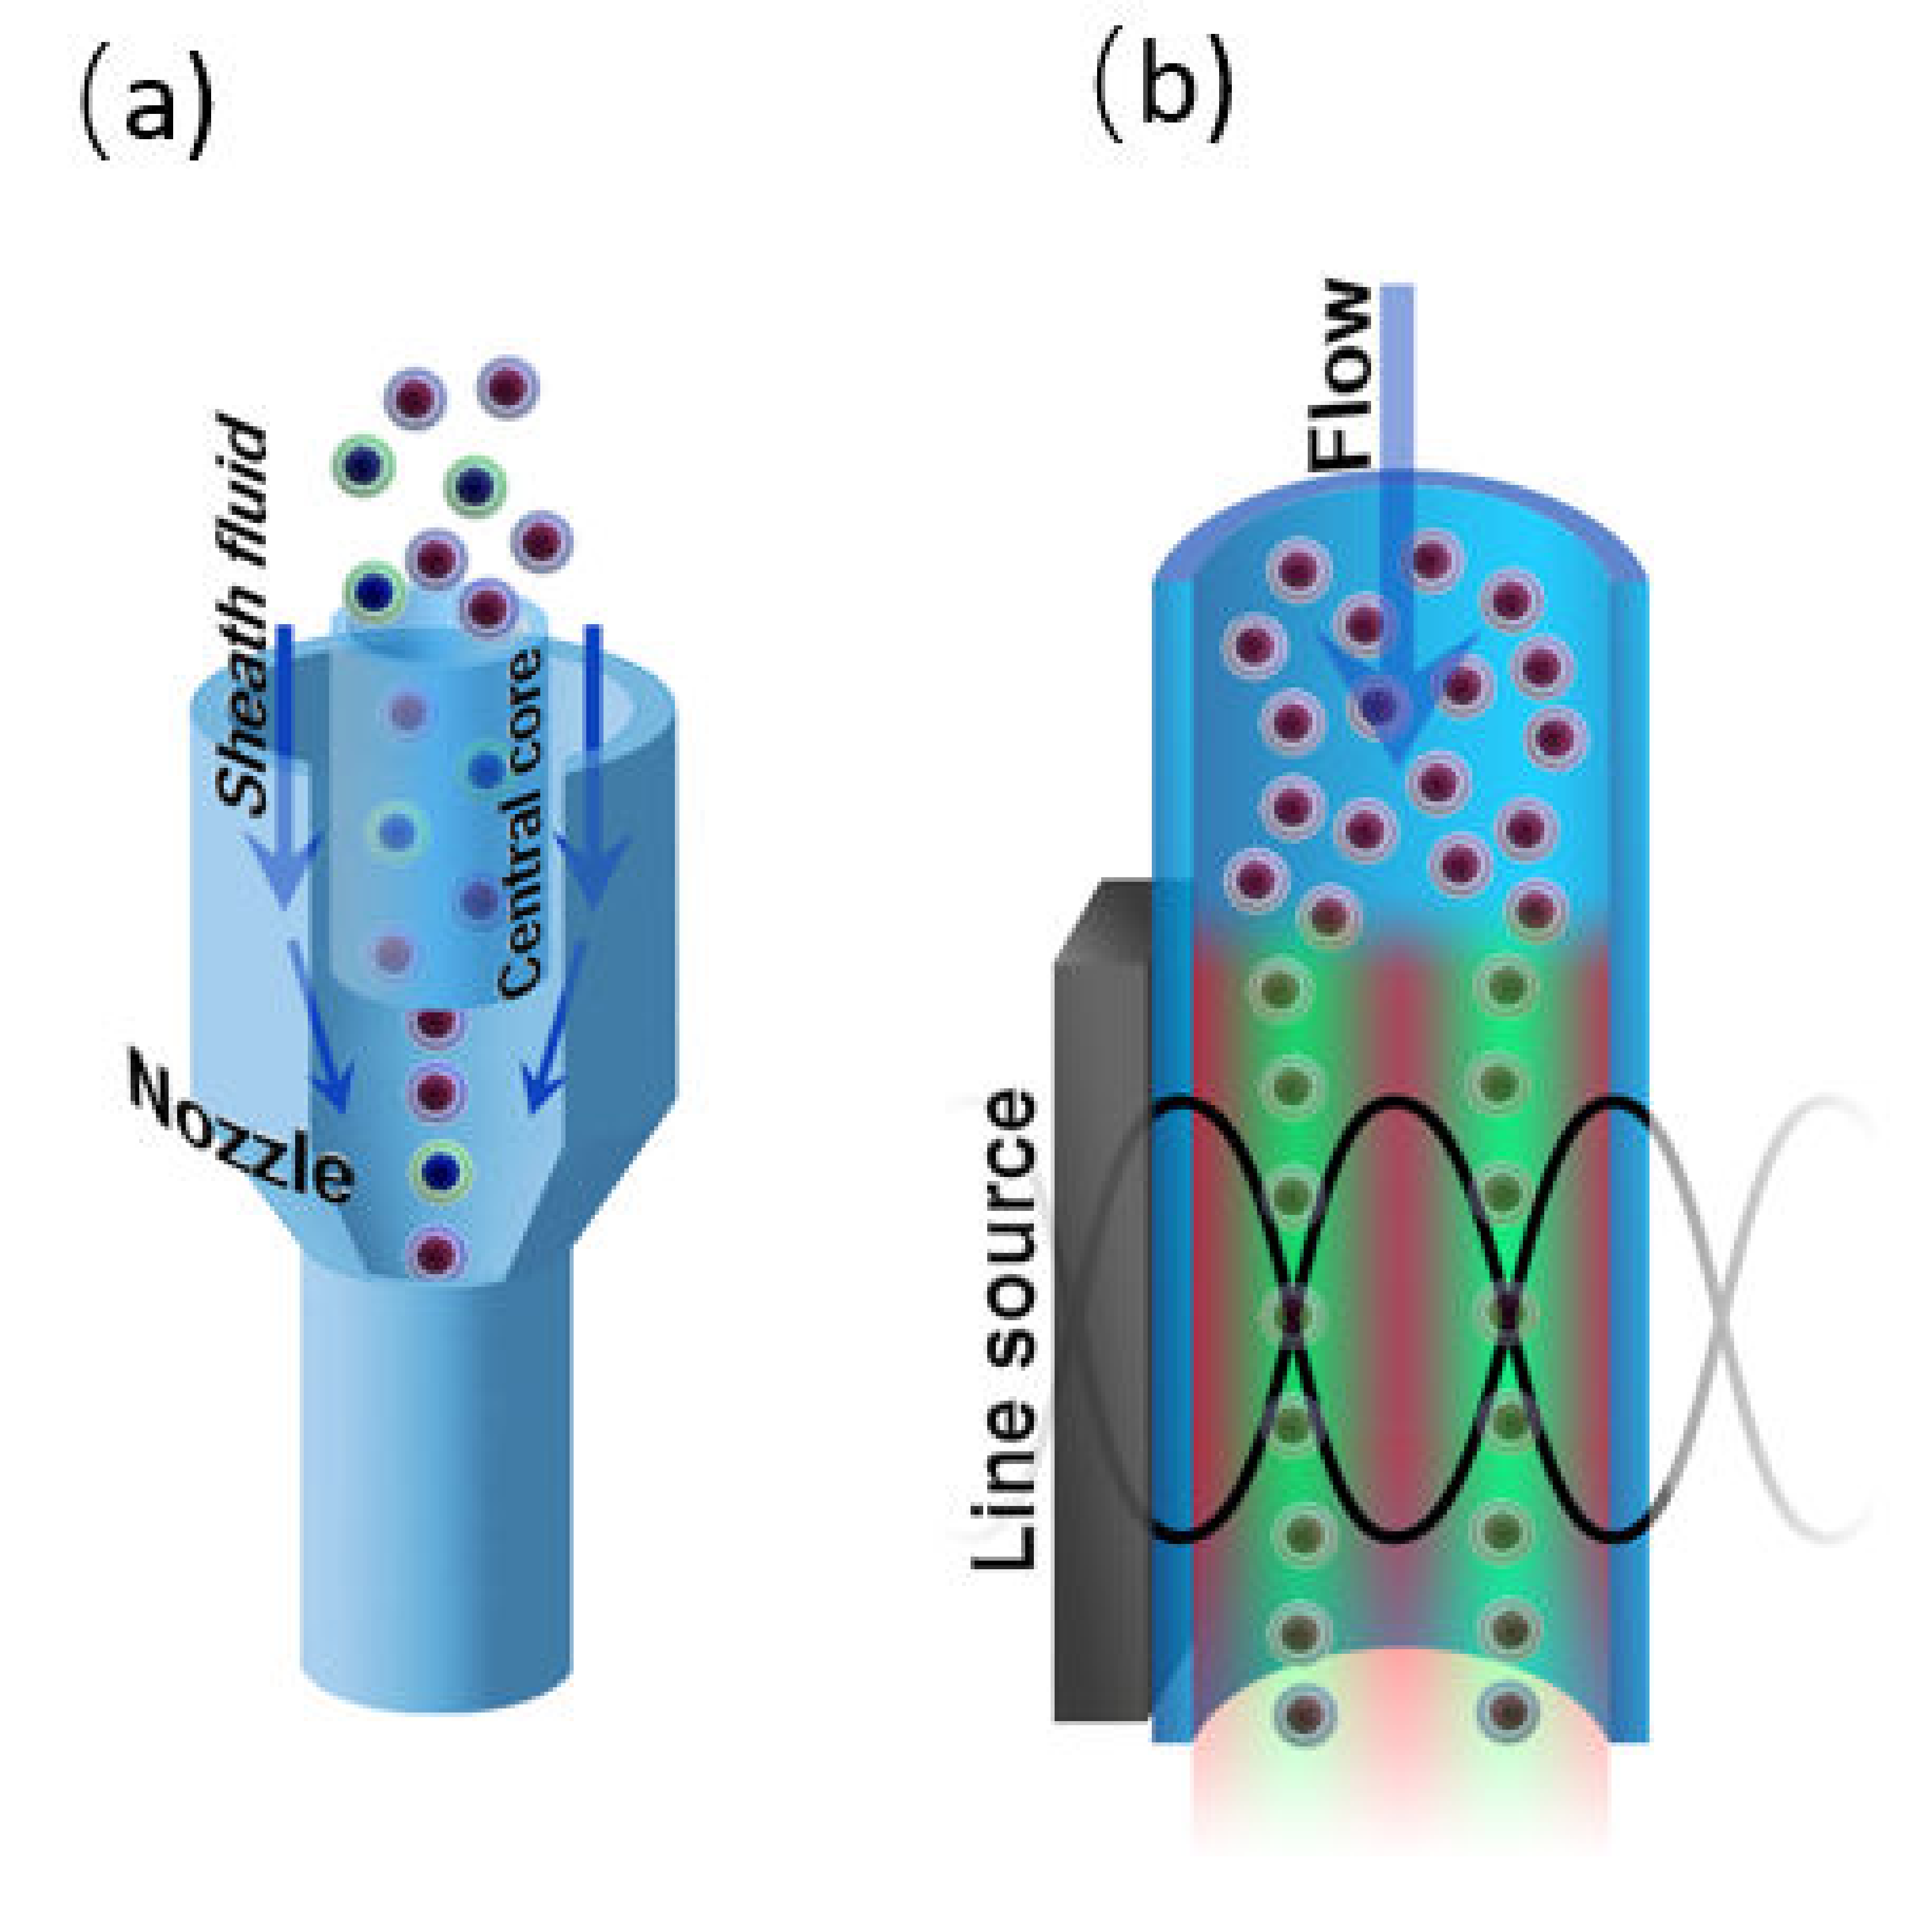
4.2.1. Hydrodynamic Focusing
4.2.2. Acoustic Focusing
4.3. Sorting
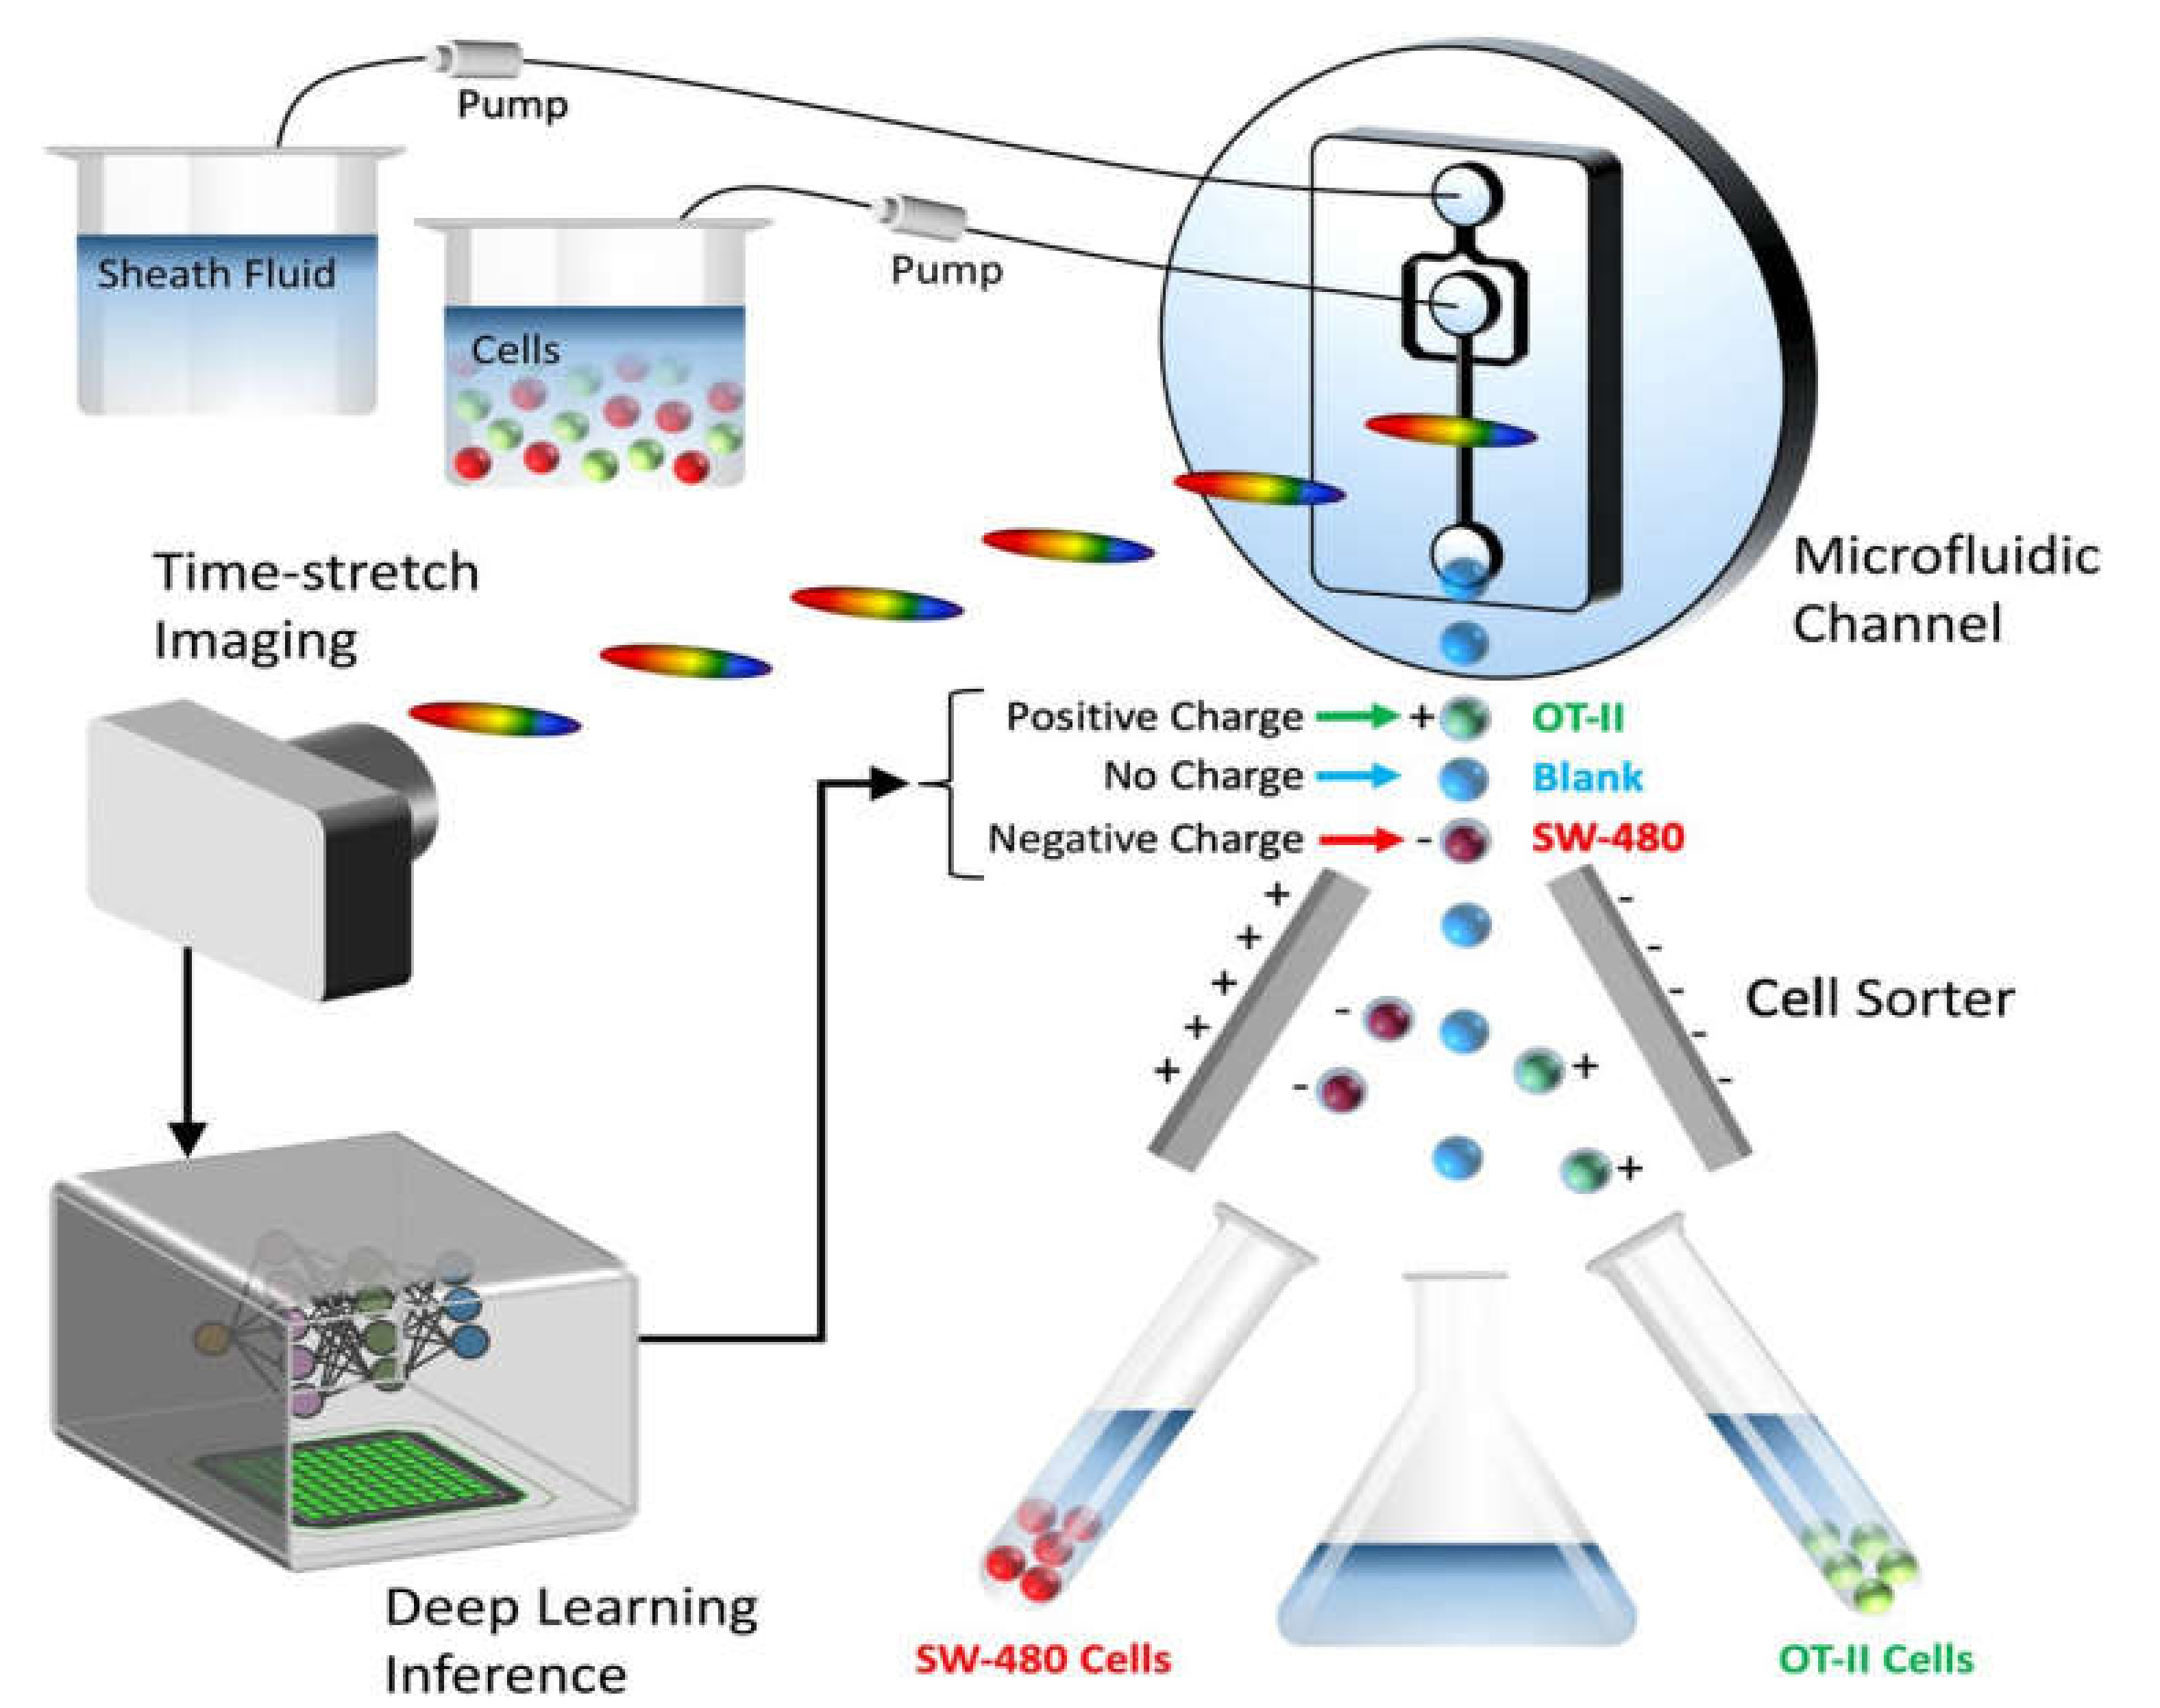
4.3.1. Active Separation Methods
Electrokinetic Cell Separation
Magnetic Cell Separation
Acoustic Separation of Cells
4.3.2. Passive Cell Separation Methods
Inertial Focusing in Microfluidic Channels
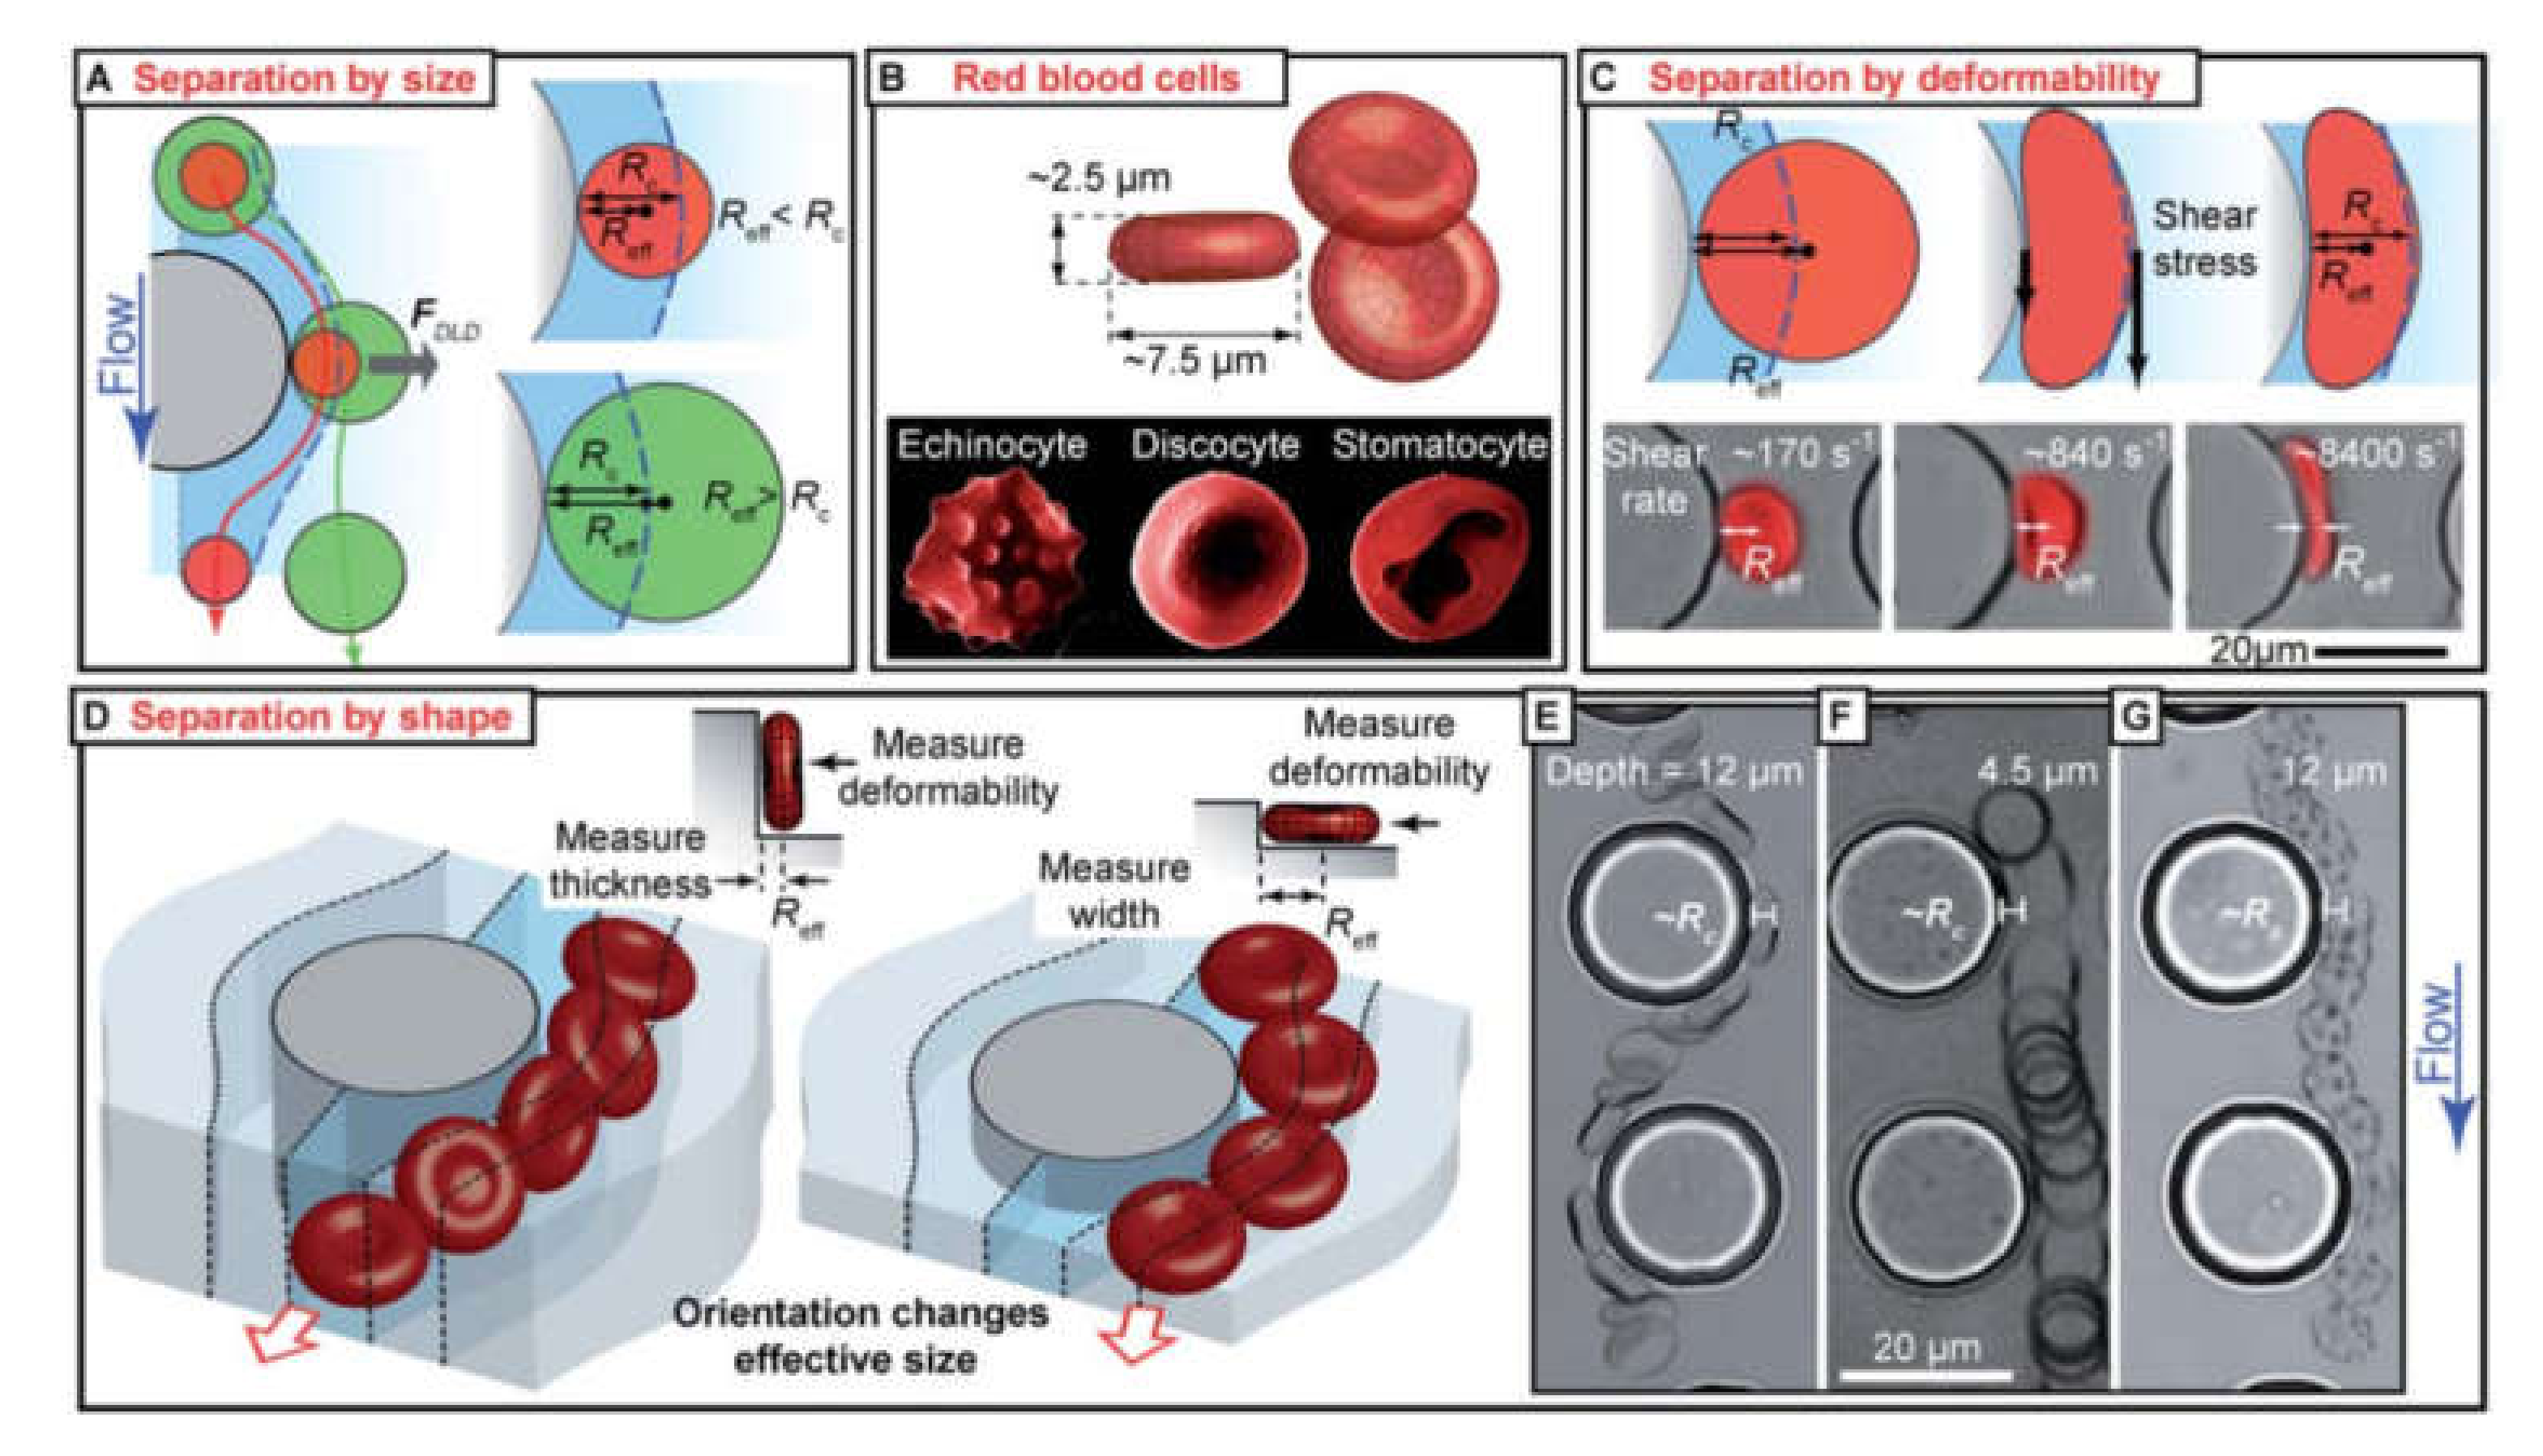
Deterministic Lateral Displacement
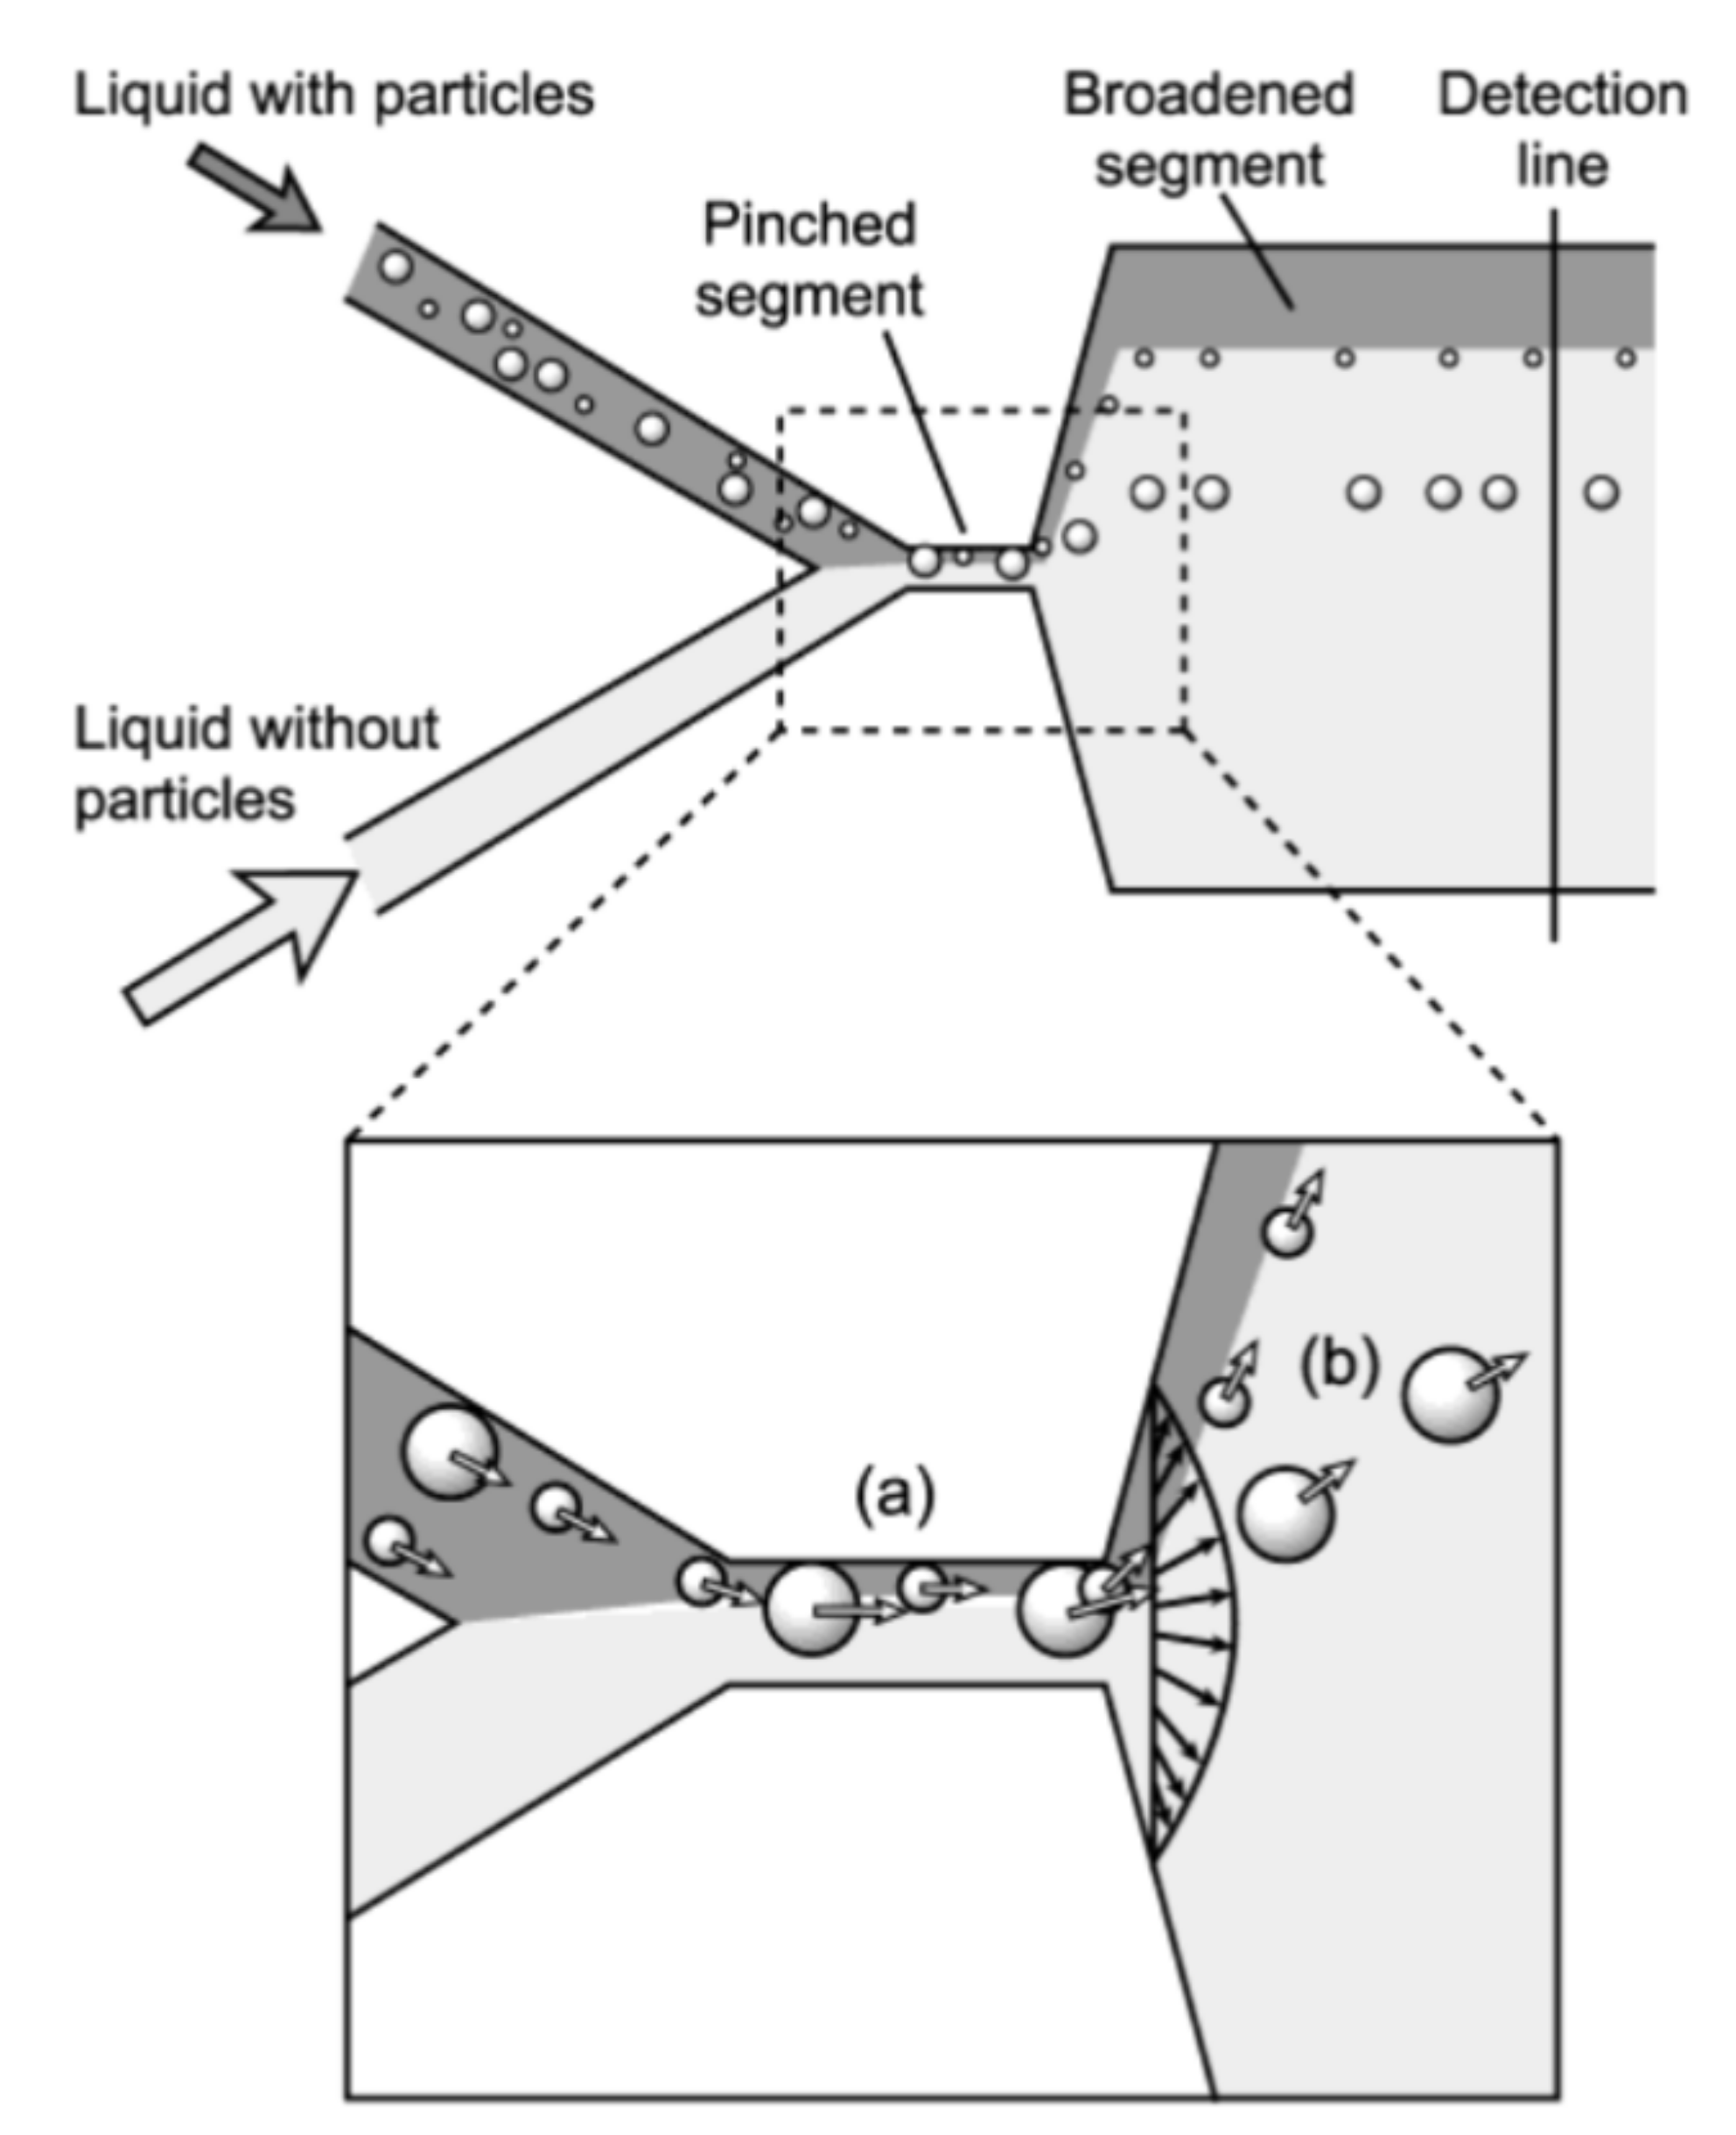
Pinched Flow Fractionation
5. Automatic Processing of Cytometry Data
6. Advantages and Limitations of Modern Flow Cytometry
7. Conclusions and Outlook
Author Contributions
Funding
Conflicts of Interest
References
- Galanzha, E.I.; Menyaev, Y.A.; Yadem, A.C.; Sarimollaoglu, M.; Juratli, M.A.; Nedosekin, D.A.; Foster, S.R.; Jamshidi-Parsian, A.; Siegel, E.R.; Makhoul, I.; et al. In vivo liquid biopsy using Cytophone platform for photoacoustic detection of circulating tumor cells in patients with melanoma. Sci. Transl. Med. 2019, 11, eaat5857. [Google Scholar] [CrossRef]
- Nolan, J.; Nedosekin, D.A.; Galanzha, E.I.; Zharov, V.P. Detection of Apoptotic Circulating Tumor Cells Using in vivo Fluorescence Flow Cytometry. Cytom. A 2019, 95, 664–671. [Google Scholar] [CrossRef]
- Harrington, W.N.; Nolan, J.; Nedosekin, D.A.; Smeltzer, M.S.; Zharov, V.P. Real-Time Monitoring of Bacteria Clearance From Blood in a Murine Model. Cytom. A 2019. [Google Scholar] [CrossRef]
- Menyaev, Y.A.; Carey, K.A.; Nedosekin, D.A.; Sarimollaoglu, M.; Galanzha, E.I.; Stumhofer, J.S.; Zharov, V.P. Preclinical photoacoustic models: Application for ultrasensitive single cell malaria diagnosis in large vein and artery. Biomed. Opt. Express 2016, 7, 3643–3658. [Google Scholar] [CrossRef]
- Cai, C.; Carey, K.A.; Nedosekin, D.A.; Menyaev, Y.A.; Sarimollaoglu, M.; Galanzha, E.I.; Stumhofer, J.S.; Zharov, V.P. In vivo photoacoustic flow cytometry for early malaria diagnosis. Cytom. A 2016, 89, 531–542. [Google Scholar] [CrossRef]
- Global Health Estimates 2016: Disease burden by Cause, Age, Sex, by Country and by Region, 2000-2016; World Health Organization: Geneva, Switzerland, 2018.
- World Health Statistics 2018: Monitoring health for the SDGs; World Health Organozation: Geneva, Switzerland, 2018.
- Galanzha, E.I.; Shashkov, E.V.; Spring, P.M.; Suen, J.Y.; Zharov, V.P. In vivo, Noninvasive, Label-Free Detection and Eradication of Circulating Metastatic Melanoma Cells Using Two-Color Photoacoustic Flow Cytometry with a Diode Laser. Cancer Res. 2009, 69, 7926–7934. [Google Scholar] [CrossRef]
- Eifler, R.L.; Lind, J.; Falkenhagen, D.; Weber, V.; Fischer, M.B.; Zeillinger, R. Enrichment of circulating tumor cells from a large blood volume using leukapheresis and elutriation: Proof of concept. Cytometry B: Clin. Cytom. 2011, 80B, 100–111. [Google Scholar] [CrossRef]
- Cristofanilli, M.; Budd, G.T.; Ellis, M.J.; Stopeck, A.; Matera, J.; Miller, M.C.; Reuben, J.M.; Doyle, G.V.; Allard, W.J.; Terstappen, L.W.M.M.; et al. Circulating Tumor Cells, Disease Progression, and Survival in Metastatic Breast Cancer. N. Engl. J. Med. 2004, 351, 781–791. [Google Scholar] [CrossRef]
- De Bono, J.S.; Scher, H.I.; Montgomery, R.B.; Parker, C.; Miller, M.C.; Tissing, H.; Doyle, G.V.; Terstappen, L.W.W.M.; Pienta, K.J.; Raghavan, D. Circulating Tumor Cells Predict Survival Benefit from Treatment in Metastatic Castration-Resistant Prostate Cancer. Clin. Cancer Res. 2008, 14, 6302–6309. [Google Scholar] [CrossRef]
- Khoja, L.; Lorigan, P.; Zhou, C.; Lancashire, M.; Booth, J.; Cummings, J.; Califano, R.; Clack, G.; Hughes, A.; Dive, C. Biomarker Utility of Circulating Tumor Cells in Metastatic Cutaneous Melanoma. J. Invest. Dermatol. 2013, 133, 1582–1590. [Google Scholar] [CrossRef]
- Su, P.-J.; Wu, M.-H.; Wang, H.-M.; Lee, C.-L.; Huang, W.-K.; Wu, C.-E.; Chang, H.-K.; Chao, Y.-K.; Tseng, C.-K.; Chiu, T.-K.; et al. Circulating Tumour Cells as an Independent Prognostic Factor in Patients with Advanced Oesophageal Squamous Cell Carcinoma Undergoing Chemoradiotherapy. Sci. Rep. 2016, 6, 31423. [Google Scholar] [CrossRef]
- Takeuchi, H.; Kitagawa, Y. Circulating tumor cells in gastrointestinal cancer. J. Hepatobiliary Pancreat. Sci. 2010, 17, 577–582. [Google Scholar] [CrossRef]
- Zhang, J.; Wang, H.-T.; Li, B.-G. Prognostic Significance of Circulating Tumor Cells in Small-Cell Lung Cancer Patients: A Meta-analysis. Asian Pac. J. Cancer Prev. 2014, 15, 8429–8433. [Google Scholar] [CrossRef]
- Zhang, Y.; Li, J.; Cao, L.; Xu, W.; Yin, Z. Circulating Tumor Cells in Hepatocellular Carcinoma: Detection Techniques, Clinical Implications, and Future Perspectives. Semin. Oncol. 2012, 39, 449–460. [Google Scholar] [CrossRef]
- Ord, R.L.; Lobo, C.A. Human Babesiosis: Pathogens, Prevalence, Diagnosis, and Treatment. Curr. Clin. Microbiol. Rep. 2015, 2, 173–181. [Google Scholar] [CrossRef]
- Balouz, V.; Agüero, F.; Buscaglia, C.A. Chapter One—Chagas Disease Diagnostic Applications: Present Knowledge and Future Steps. In Advances in Parasitology; Rollinson, D., Stothard, J.R., Eds.; Academic Press: Cambridge, MA, USA, 2017. [Google Scholar] [CrossRef]
- Tangpukdee, N.; Duangdee, C.; Wilairatana, P.; Krudsood, S. Malaria Diagnosis: A Brief Review. Korean J. Parasitol. 2009, 47, 93–102. [Google Scholar] [CrossRef]
- Mitashi, P.; Hasker, E.; Lejon, V.; Kande, V.; Muyembe, J.-J.; Lutumba, P.; Boelaert, M. Human African Trypanosomiasis Diagnosis in First-Line Health Services of Endemic Countries, a Systematic Review. PLoS Negl. Trop. Dis. 2012, 6, e1919. [Google Scholar] [CrossRef]
- Laupland, K.B. Incidence of bloodstream infection: A review of population-based studies. Clin. Microbiol. Infect. 2013, 19, 492–500. [Google Scholar] [CrossRef]
- Opota, O.; Croxatto, A.; Prod’hom, G.; Greub, G. Blood culture-based diagnosis of bacteraemia: State of the art. Clin. Microbiol. Infect. 2015, 21, 313–322. [Google Scholar] [CrossRef]
- Rothberg, D.; Makarewich, C. Fat Embolism and Fat Embolism Syndrome. J. Am. Acad. Orthop. Surg. 2019, 27, e346–e355. [Google Scholar] [CrossRef]
- Galanzha, E.I.; Sarimollaoglu, M.; Nedosekin, D.A.; Keyrouz, S.G.; Mehta, J.L.; Zharov, V.P. In vivo flow cytometry of circulating clots using negative photothermal and photoacoustic contrasts. Cytom. A 2011, 79A, 814–824. [Google Scholar] [CrossRef]
- Hu, P.; Zhang, W.; Xin, H.; Deng, G. Single Cell Isolation and Analysis. Front. Cell. Dev. Biol. 2016, 4. [Google Scholar] [CrossRef] [PubMed]
- Bonner, W.A.; Hulett, H.R.; Sweet, R.G.; Herzenberg, L.A. Fluorescence Activated Cell Sorting. Rev. Sci. Instrum. 1972, 43, 404–409. [Google Scholar] [CrossRef] [PubMed]
- Herzenberg, L.A.; Parks, D.; Sahaf, B.; Perez, O.; Roederer, M.; Herzenberg, L.A. The History and Future of the Fluorescence Activated Cell Sorter and Flow Cytometry: A View from Stanford. Clin. Chem. 2002, 48, 1819–1827. [Google Scholar] [CrossRef]
- Shapiro, H.M. How Flow Cytometers Work. In Practical Flow Cytometry, 4th ed.; John Wiley & Sons: New York, NY, USA, 2003; pp. 101–223. [Google Scholar] [CrossRef]
- Haugland, R.P. Fluorescent Labels. In Biosensors with Fiberoptics; Wise, D.L., Wingard, L.B., Eds.; Humana Press: Totowa, NJ, USA, 1991; pp. 85–110. [Google Scholar] [CrossRef]
- Telford, W.G. Chapter 15—Lasers in Flow Cytometry. In Methods Cell Biology; Darzynkiewicz, Z., Holden, E., Orfao, A., Telford, W., Wlodkowic, D., Eds.; Academic Press: Cambridge, MA, USA, 2011. [Google Scholar] [CrossRef]
- Picot, J.; Guerin, C.L.; Le Van Kim, C.; Boulanger, C.M. Flow cytometry: retrospective, fundamentals and recent instrumentation. Cytotechnology 2012, 64, 109–130. [Google Scholar] [CrossRef]
- Basiji, D.A. Principles of Amnis Imaging Flow Cytometry. In Imaging Flow Cytometry. Methods and Protocols; Barteneva, N.S., Vorobjev, I.A., Eds.; Humana Press: Totowa, NJ, USA, 2016; pp. 13–21. [Google Scholar] [CrossRef]
- Holzner, G.; Mateescu, B.; van Leeuwen, D.; Cereghetti, G.; Dechant, R.; deMello, A.; Stavrakis, S. Ultra High-Throughput Multiparametric Imaging Flow Cytometry: Towards Diffraction-Limited Sub-Cellular Detection. bioRxiv 2019, 695361. [Google Scholar] [CrossRef]
- Gualda, E.J.; Pereira, H.; Vale, T.; Estrada, M.F.; Brito, C.; Moreno, N. SPIM-fluid: open source light-sheet based platform for high-throughput imaging. Biomed. Opt. Express 2015, 6, 4447–4456. [Google Scholar] [CrossRef]
- Gualda, E.J.; Vale, T.; Almada, P.; Feijó, J.A.; Martins, G.G.; Moreno, N. OpenSpinMicroscopy: An open-source integrated microscopy platform. Nat. Methods 2013, 10, 599–600. [Google Scholar] [CrossRef]
- Gualda, E.J.; Simão, D.; Pinto, C.; Alves, P.M.; Brito, C. Imaging of human differentiated 3D neural aggregates using light sheet fluorescence microscopy. Front. Cell. Neurosci. 2014, 8. [Google Scholar] [CrossRef]
- Magnan, P. Detection of visible photons in CCD and CMOS: A comparative view. Nucl. Instrum. Methods Phys. Res. A 2003, 504, 199–212. [Google Scholar] [CrossRef]
- Stavrakis, S.; Holzner, G.; Choo, J.; deMello, A. High-throughput microfluidic imaging flow cytometry. Curr. Opin. Biotechnol. 2019, 55, 36–43. [Google Scholar] [CrossRef] [PubMed]
- Basiji, D.A.; Ortyn, W.E.; Liang, L.; Venkatachalam, V.; Morrissey, P. Cellular Image Analysis and Imaging by Flow Cytometry. Clin. Lab. Med. 2007, 27, 653–670. [Google Scholar] [CrossRef]
- Gary, S.E. Moving Pictures: Imaging Flow Cytometry for Drug Development. Comb. Chem. High Throughput Screening 2009, 12, 849–859. [Google Scholar] [CrossRef]
- Stuurman, N.; Vale, R.D. Impact of New Camera Technologies on Discoveries in Cell Biology. Biol. Bull. 2016, 231, 5–13. [Google Scholar] [CrossRef] [PubMed][Green Version]
- Gualda, E.J.; Pereira, H.; Martins, G.G.; Gardner, R.; Moreno, N. Three-dimensional imaging flow cytometry through light-sheet fluorescence microscopy. Cytom. A 2017, 91, 144–151. [Google Scholar] [CrossRef]
- Elisa, Z.; Toon, B.; De Smedt, S.C.; Katrien, R.; Kristiaan, N.; Kevin, B. Technical implementations of light sheet microscopy. Microsc. Res. Tech. 2018, 81, 941–958. [Google Scholar] [CrossRef]
- Baumgart, E.; Kubitscheck, U. Scanned light sheet microscopy with confocal slit detection. Opt. Express 2012, 20, 21805–21814. [Google Scholar] [CrossRef]
- Greger, K.; Swoger, J.; Stelzer, E.H.K. Basic building units and properties of a fluorescence single plane illumination microscope. Rev. Sci. Instrum. 2007, 78, 023705. [Google Scholar] [CrossRef]
- Girkin, J.M.; Carvalho, M.T. The light-sheet microscopy revolution. J. Opt. 2018, 20, 053002. [Google Scholar] [CrossRef]
- Wu, J.; Chan, R.K.Y. A fast fluorescence imaging flow cytometer for phytoplankton analysis. Opt. Express 2013, 21, 23921–23926. [Google Scholar] [CrossRef]
- Wu, J.; Li, J.; Chan, R.K.Y. A light sheet based high throughput 3D-imaging flow cytometer for phytoplankton analysis. Opt. Express 2013, 21, 14474–14480. [Google Scholar] [CrossRef] [PubMed]
- Brown, C.M. Fluorescence microscopy - avoiding the pitfalls. J. Cell Sci. 2007, 120, 1703–1705. [Google Scholar] [CrossRef] [PubMed]
- Cole, R.W.; Jinadasa, T.; Brown, C.M. Measuring and interpreting point spread functions to determine confocal microscope resolution and ensure quality control. Nat. Protoc. 2011, 6, 1929–1941. [Google Scholar] [CrossRef]
- Jonkman, J.; Brown, C.M. Any Way You Slice It-A Comparison of Confocal Microscopy Techniques. J. Biomol. Tech. 2015, 26, 54–65. [Google Scholar] [CrossRef] [PubMed]
- Schonbrun, E.; Gorthi, S.S.; Schaak, D. Microfabricated multiple field of view imaging flow cytometry. Lab Chip 2012, 12, 268–273. [Google Scholar] [CrossRef] [PubMed]
- McKenna, B.K.; Evans, J.G.; Cheung, M.C.; Ehrlich, D.J. A parallel microfluidic flow cytometer for high-content screening. Nat. Methods 2011, 8, 401–403. [Google Scholar] [CrossRef]
- Goda, K.; Ayazi, A.; Gossett, D.R.; Sadasivam, J.; Lonappan, C.K.; Sollier, E.; Fard, A.M.; Hur, S.C.; Adam, J.; Murray, C.; et al. High-throughput single-microparticle imaging flow analyzer. Proc. Natl. Acad. Sci. USA 2012, 109, 11630–11635. [Google Scholar] [CrossRef] [PubMed]
- Salvail, J.Z.; Agnew, M.; Johnson, A.S.; Bolduc, E.; Leach, J.; Boyd, R.W. Full characterization of polarization states of light via direct measurement. Nature Photonics 2013, 7, 316–321. [Google Scholar] [CrossRef]
- Heng, X.; Hsiung, F.; Sadri, A.; Patt, P. Serial Line Scan Encoding Imaging Cytometer for Both Adherent and Suspended Cells. Anal. Chem. 2011, 83, 1587–1593. [Google Scholar] [CrossRef]
- Schroeder, H.W., Jr.; Cavacini, L. Structure and function of immunoglobulins. J. Allergy Clin. Immunol. 2010, 125, S41–S52. [Google Scholar] [CrossRef]
- Beale, D.; Feinstein, A. Structure and function of the constant regions of immunoglobulins. Q. Rev. Biophys. 2009, 9, 135–180. [Google Scholar] [CrossRef] [PubMed]
- Koshland, M.E. Structure and Function of the J Chain. In Advances in Immunology; Dixon, F.J., Kunkel, H.G., Eds.; Academic Press: Cambridge, MA, USA, 1975. [Google Scholar] [CrossRef]
- Geysen, H.; Tainer, J.; Rodda, S.; Mason, T.; Alexander, H.; Getzoff, E.; Lerner, R. Chemistry of antibody binding to a protein. Science 1987, 235, 1184–1190. [Google Scholar] [CrossRef] [PubMed]
- Webster, D.M.; Henry, A.H.; Rees, A.R. Antibody-antigen interactions. Curr. Opin. Struct. Biol. 1994, 4, 123–129. [Google Scholar] [CrossRef]
- Koshland, D.E., Jr. The Key–Lock Theory and the Induced Fit Theory. Angew. Chem. Int. Ed. 1995, 33, 2375–2378. [Google Scholar] [CrossRef]
- Shen, J.; Xie, B.; Dong, A.; Swaim, M.; Hackett, S.F.; Campochiaro, P.A. In Vivo Immunostaining Demonstrates Macrophages Associate with Growing and Regressing Vessels. Invest. Ophthalmol. Vis. Sci. 2007, 48, 4335–4341. [Google Scholar] [CrossRef] [PubMed][Green Version]
- Novak, J.; Georgakoudi, I.; Wei, X.; Prossin, A.; Lin, C.P. In vivo flow cytometer for real-time detection and quantification of circulating cells. Opt. Lett. 2004, 29, 77–79. [Google Scholar] [CrossRef]
- Pitsillides, C.M.; Runnels, J.M.; Spencer, J.A.; Zhi, L.; Wu, M.X.; Lin, C.P. Cell labeling approaches for fluorescence-based in vivo flow cytometry. Cytom. A 2011, 79A, 758–765. [Google Scholar] [CrossRef]
- Morosanu, A.C.; Dimitriu, D.G.; Dorohoi, D.O. Excited state dipole moment of the fluorescein molecule estimated from electronic absorption spectra. J. Mol. Struct. 2019, 1180, 723–732. [Google Scholar] [CrossRef]
- McQueen, P.D.; Sagoo, S.; Yao, H.; Jockusch, R.A. On the Intrinsic Photophysics of Fluorescein. Angew. Chem. 2010, 122, 9379–9382. [Google Scholar] [CrossRef]
- Naderi, F.; Farajtabar, A. Solvatochromism of fluorescein in aqueous aprotic solvents. J. Mol. Liq. 2016, 221, 102–107. [Google Scholar] [CrossRef]
- Hermanson, G.T. Chapter 10—Fluorescent Probes. In Bioconjugate Techniques (Third Edition); Hermanson, G.T., Ed.; Academic Press: Boston, MA, USA, 2013; pp. 395–463. [Google Scholar] [CrossRef]
- Chaganti, L.K.; Venkatakrishnan, N.; Bose, K. An efficient method for FITC labelling of proteins using tandem affinity purification. Biosci. Rep. 2018, 38, 8. [Google Scholar] [CrossRef]
- Melkoumov, A.; St-Jean, I.; Banquy, X.; Leclair, G.; Chain, J.L. GM1-Binding Conjugates To Improve Intestinal Permeability. Mol. Pharm. 2019, 16, 60–70. [Google Scholar] [CrossRef] [PubMed]
- Hossein-Nejad-Ariani, H.; Althagafi, E.; Kaur, K. Small Peptide Ligands for Targeting EGFR in Triple Negative Breast Cancer Cells. Sci. Rep. 2019, 9, 10. [Google Scholar] [CrossRef] [PubMed]
- Wang, L.L.; Gaigalas, A.K.; DeRose, P.C. A Model for the Binding of Fluorescently Labeled Anti-Human CD4 Monoclonal Antibodies to CD4 Receptors on Human Lymphocytes. J. Res. Natl. Inst. Stand. Technol. 2018, 123, 23. [Google Scholar] [CrossRef]
- Chen, H.; Yang, Q.; Ding, Y.; Vasylieva, N.; Bever, C.S.; Hua, X.D.; Wang, M.H.; Hammock, B.D. Competitive and noncompetitive immunoassays for the detection of benzothiostrobin using magnetic nanoparticles and fluorescein isothiocyanate-labeled peptides. Anal. Bioanal. Chem. 2019, 411, 527–535. [Google Scholar] [CrossRef] [PubMed]
- Liu, M.R.; Zhu, C.S.; Bai, S.; Li, X.; Fu, K.Q.; Ye, L.; Zheng, K. An In Vivo Method to Study Mouse Blood-Testis Barrier Integrity. J. Vis. Exp. 2018, 7. [Google Scholar] [CrossRef] [PubMed]
- Pedone, A.; Bloino, J.; Monti, S.; Prampolini, G.; Barone, V. Absorption and emission UV-Vis spectra of the TRITC fluorophore molecule in solution: A quantum mechanical study. Phys. Chem. Chem. Phys. 2010, 12, 1000–1006. [Google Scholar] [CrossRef]
- Titus, J.A.; Haugland, R.; Sharrow, S.O.; Segal, D.M. Texas red, a hydrophilic, red-emitting flourophore for use with flourescein in dual parameter flow microfluorometric and fluorescence microscopic studies. J. Immunol. Methods 1982, 50, 193–204. [Google Scholar] [CrossRef]
- Yuan, L.; Lin, W.; Zheng, K.; He, L.; Huang, W. Far-red to near infrared analyte-responsive fluorescent probes based on organic fluorophore platforms for fluorescence imaging. Chem. Soc. Rev. 2013, 42, 622–661. [Google Scholar] [CrossRef]
- Li, Y.; Deng, Y.; Liu, J.; Fu, J.; Sun, Y.; Ouyang, R.; Miao, Y. A near-infrared frequency upconversion probe for nitroreductase detection and hypoxia tumor in vivo imaging. Sens. Actuators B: Chem. 2019, 286, 337–345. [Google Scholar] [CrossRef]
- Ge, L.; Tian, Y. Fluorescence Lifetime Imaging of p-tau Protein in Single Neuron with a Highly Selective Fluorescent Probe. Anal. Chem. 2019, 91, 3294–3301. [Google Scholar] [CrossRef] [PubMed]
- Pietryga, J.M.; Park, Y.S.; Lim, J.H.; Fidler, A.F.; Bae, W.K.; Brovelli, S.; Klimov, V.I. Spectroscopic and Device Aspects of Nanocrystal Quantum Dots. Chem. Rev. 2016, 116, 10513–10622. [Google Scholar] [CrossRef] [PubMed]
- Petryayeva, E.; Algar, W.R.; Medintz, I.L. Quantum Dots in Bioanalysis: A Review of Applications across Various Platforms for Fluorescence Spectroscopy and Imaging. Appl. Spectrosc. 2013, 67, 215–252. [Google Scholar] [CrossRef] [PubMed]
- Wegner, K.D.; Hildebrandt, N. Quantum dots: Bright and versatile in vitro and in vivo fluorescence imaging biosensors. Chem. Soc. Rev. 2015, 44, 4792–4834. [Google Scholar] [CrossRef]
- Smith, B.R.; Gambhir, S.S. Nanomaterials for In Vivo Imaging. Chem. Rev. 2017, 117, 901–986. [Google Scholar] [CrossRef]
- Zhou, J.; Yang, Y.; Zhang, C.-y. Toward Biocompatible Semiconductor Quantum Dots: From Biosynthesis and Bioconjugation to Biomedical Application. Chem. Rev. 2015, 115, 11669–11717. [Google Scholar] [CrossRef]
- Molaei, M.J. A review on nanostructured carbon quantum dots and their applications in biotechnology, sensors, and chemiluminescence. Talanta 2019, 196, 456–478. [Google Scholar] [CrossRef]
- Li, J.C.; Pu, K.Y. Development of organic semiconducting materials for deep-tissue optical imaging, phototherapy and photoactivation. Chem. Soc. Rev. 2019, 48, 38–71. [Google Scholar] [CrossRef]
- Holmes, K.L.; Lantz, L.M. Chapter 9 Protein labeling with fluorescent probes. In Methods Cell Biology; Academic Press: Cambridge, MA, USA, 2001. [Google Scholar] [CrossRef]
- Foubert, A.; Beloglazova, N.V.; Rajkovic, A.; Sas, B.; Madder, A.; Goryacheva, I.Y.; De Saeger, S. Bioconjugation of quantum dots: Review & impact on future application. Trac-Trends Anal. Chem. 2016, 83, 31–48. [Google Scholar] [CrossRef]
- Saito, F.; Noda, H.; Bode, J.W. Critical Evaluation and Rate Constants of Chemoselective Ligation Reactions for Stoichiometric Conjugations in Water. ACS Chem. Biol. 2015, 10, 1026–1033. [Google Scholar] [CrossRef]
- Baumann, A.L.; Hackenberger, C.P.R. Modern Ligation Methods to Access Natural and Modified Proteins. CHIMIA 2018, 72, 802–808. [Google Scholar] [CrossRef] [PubMed]
- Schäfer, R.J.B.; Aronoff, M.R.; Wennemers, H. Recent Advances in Bioorthogonal Reactions. CHIMIA 2019, 73, 308–312. [Google Scholar] [CrossRef] [PubMed]
- Wang, W.T.; Kapur, A.; Ji, X.; Zeng, B.R.; Mishra, D.; Mattoussi, H. Multifunctional and High Affinity Polymer Ligand that Provides Bio-Orthogonal Coating of Quantum Dots. Bioconjug. Chem. 2016, 27, 2024–2036. [Google Scholar] [CrossRef] [PubMed]
- Zhan, N.Q.; Palui, G.; Merkl, J.P.; Mattoussi, H. Bio-orthogonal Coupling as a Means of Quantifying the Ligand Density on Hydrophilic Quantum Dots. J. Am. Chem. Soc. 2016, 138, 3190–3201. [Google Scholar] [CrossRef]
- Delgadillo, R.F.; Mueser, T.C.; Zaleta-Rivera, K.; Carnes, K.A.; Gonzalez-Valdez, J.; Parkhurst, L.J. Detailed characterization of the solution kinetics and thermodynamics of biotin, biocytin and HABA binding to avidin and streptavidin. PLoS One 2019, 14, 32. [Google Scholar] [CrossRef]
- Yuce, M.; Kurt, H. How to make nanobiosensors: surface modification and characterisation of nanomaterials for biosensing applications. RSC Adv. 2017, 7, 49386–49403. [Google Scholar] [CrossRef]
- Yoon, H.R.; Choi, H.; Choi, Y.A.; Kim, J.A.; Jung, J.; Kim, H.M.; Jung, Y. Fabrication of Oligomeric Avidin Scaffolds for Valency-Controlled Surface Display of Functional Ligands. Angew. Chem. Int. Ed. 2018, 57, 12410–12414. [Google Scholar] [CrossRef]
- Aldeek, F.; Safi, M.; Zhan, N.Q.; Palui, G.; Mattoussi, H. Understanding the Self-Assembly of Proteins onto Gold Nanoparticles and Quantum Dots Driven by Metal-Histidine Coordination. ACS Nano 2013, 7, 10197–10210. [Google Scholar] [CrossRef]
- Blanco-Canosa, J.B.; Wu, M.; Susumu, K.; Petryayeva, E.; Jennings, T.L.; Dawson, P.E.; Algar, W.R.; Medintz, I.L. Recent progress in the bioconjugation of quantum dots. Coord. Chem. Rev. 2014, 263, 101–137. [Google Scholar] [CrossRef]
- Qiu, L.; Zhang, C.C.; Gu, T.; Zhu, Z.L.; Wang, J.P.; Liu, L.; Ding, S.M.; Liu, X.Q.; Wang, J.H.; Jiang, P.J. De Novo Design of a Cyclic Polyhistidine Peptide for Binding with Quantum Dots: Self-Assembly Investigation Using Capillary Electrophoresis. Chromatographia 2018, 81, 41–46. [Google Scholar] [CrossRef]
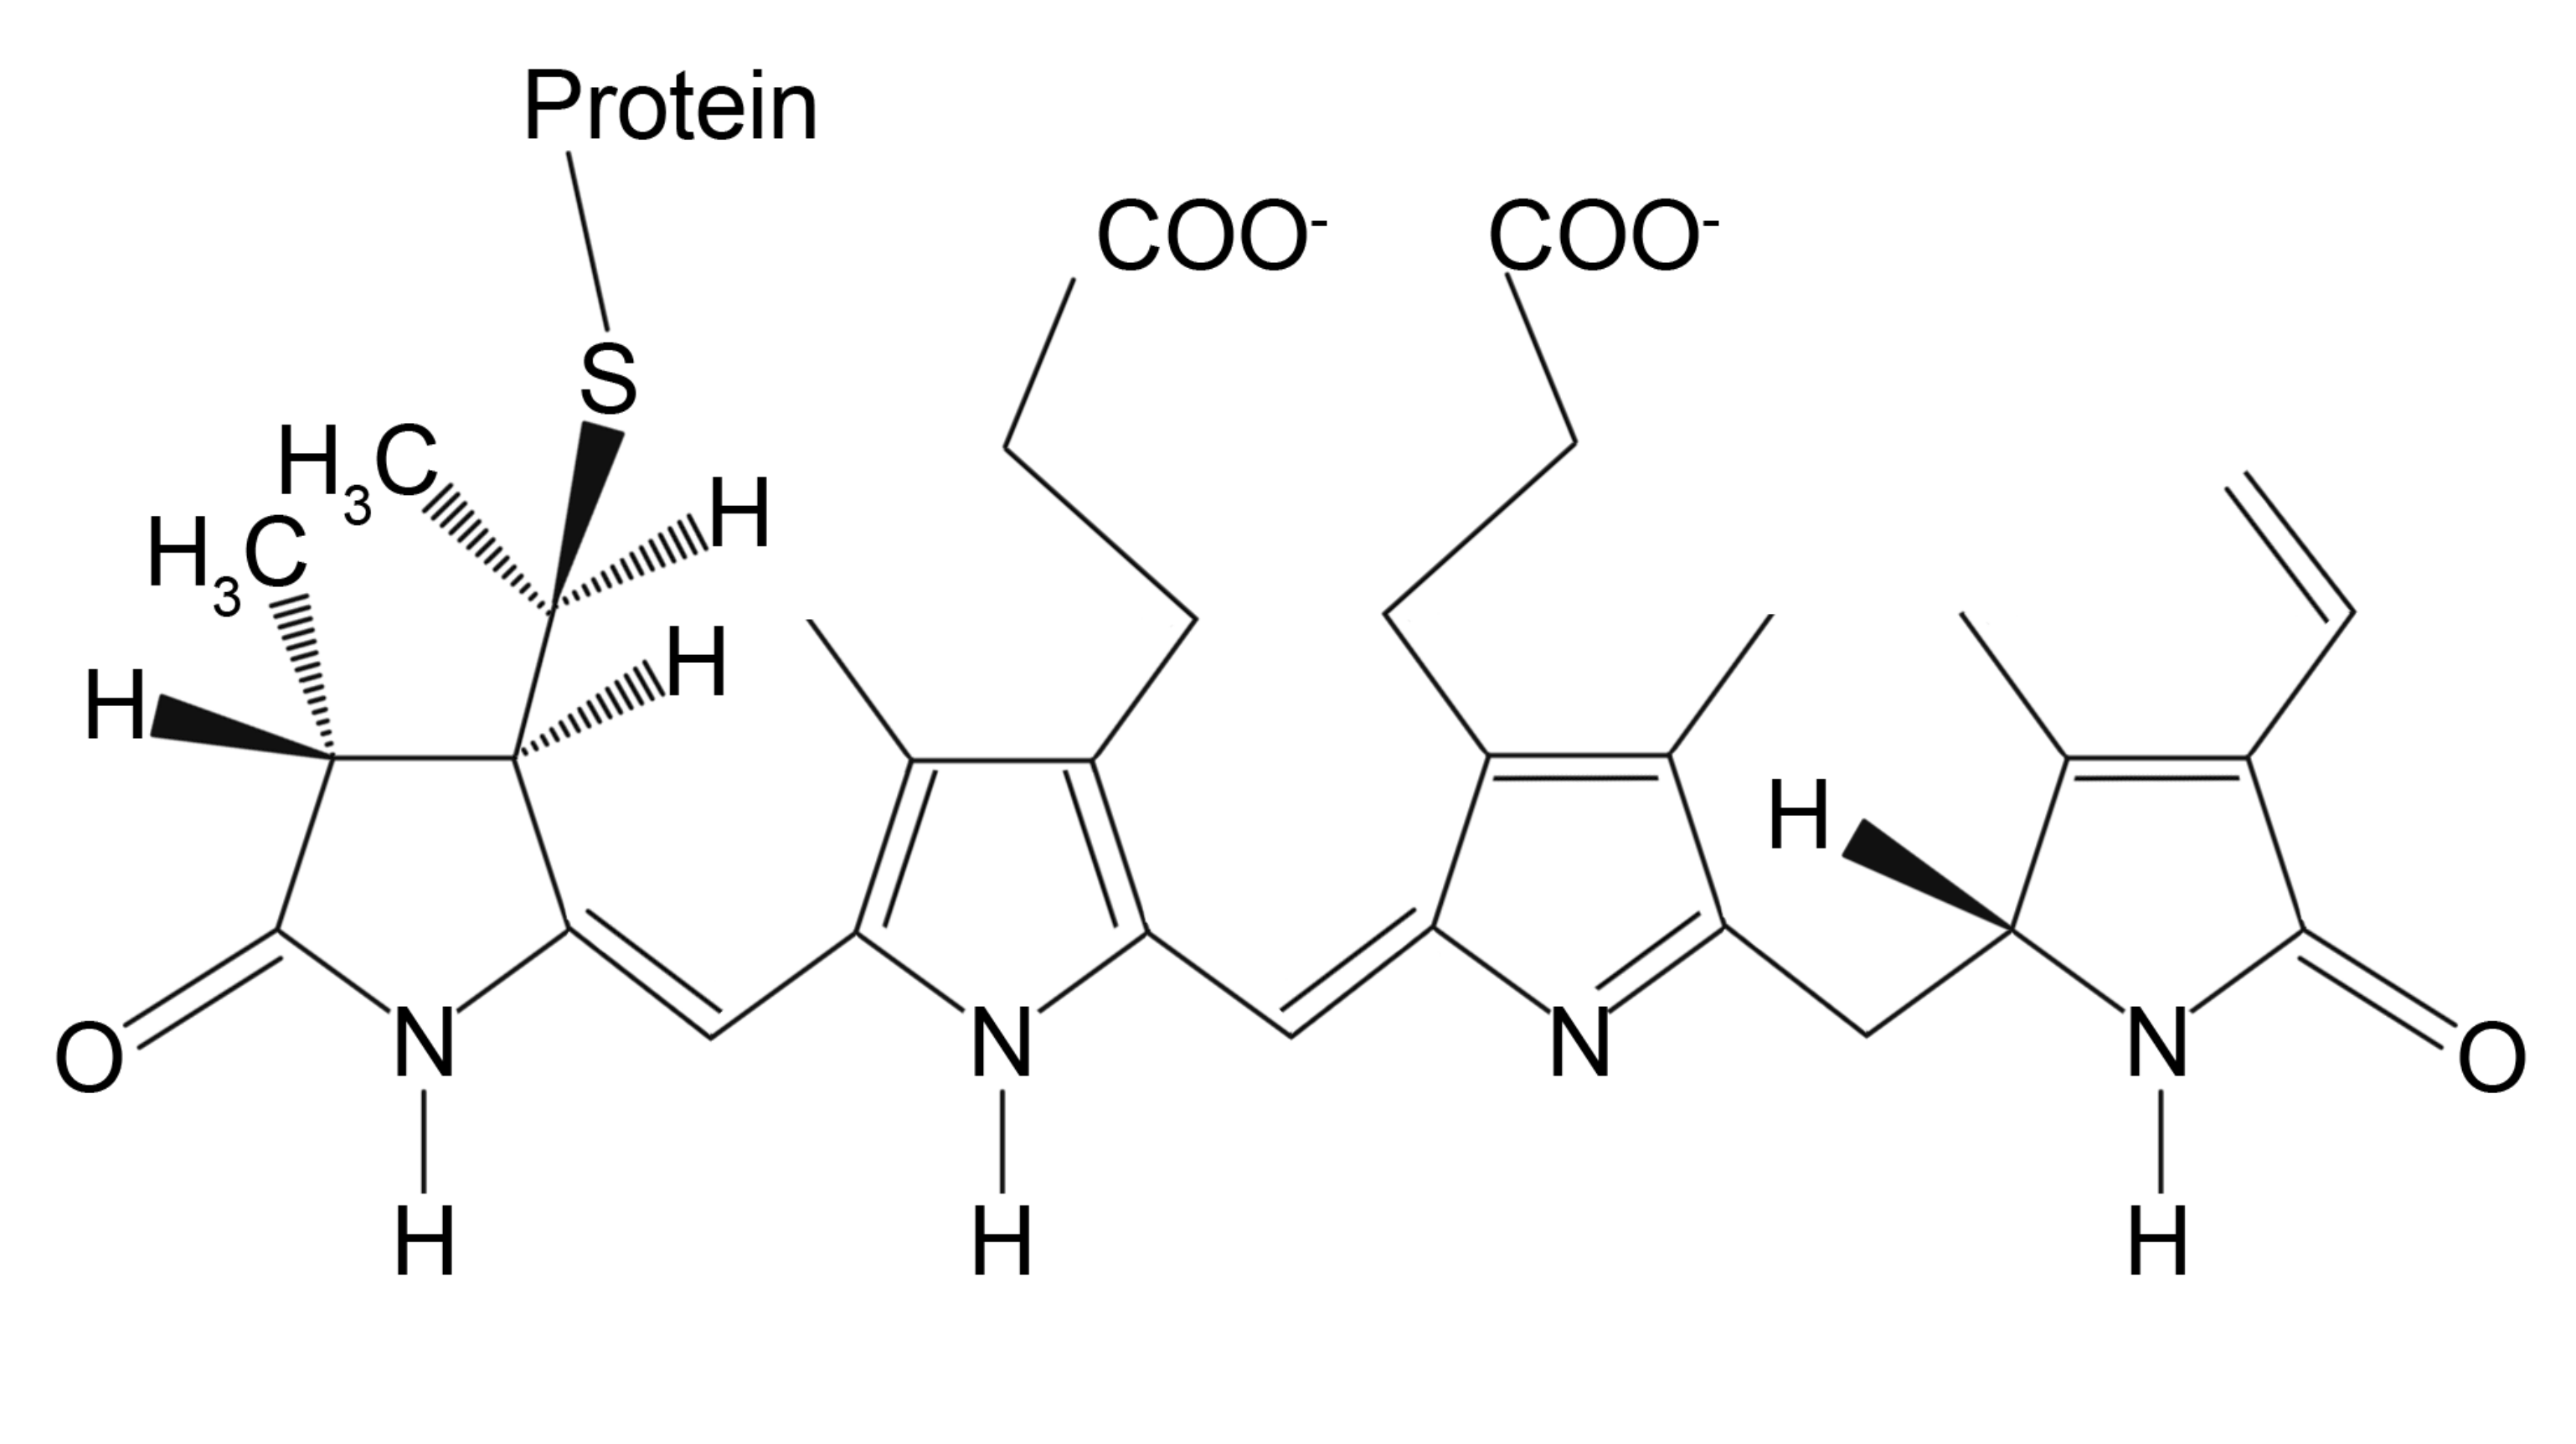
- Kronick, M.N.; Grossman, P.D. Immunoassay techniques with fluorescent phycobiliprotein conjugates. Clin. Chem. 1983, 29, 1582–1586. [Google Scholar] [CrossRef]
- Saini, D.K.; Pabbi, S.; Shukla, P. Cyanobacterial pigments: Perspectives and biotechnological approaches. Food Chem. Toxicol. 2018, 120, 616–624. [Google Scholar] [CrossRef] [PubMed]
- Jang, S.J.; Mennucci, B. Delocalized excitons in natural light-harvesting complexes. Rev. Mod. Phys. 2018, 90, 49. [Google Scholar] [CrossRef]
- Ge, B.S.; Lin, X.J.; Chen, Y.; Wang, X.F.; Chen, H.X.; Jiang, P.; Huang, F. Combinational biosynthesis of dual-functional streptavidin-phycobiliproteins for high-throughput-compatible immunoassay. Process Biochem. 2017, 58, 306–312. [Google Scholar] [CrossRef]
- Wu, J.; Chen, H.X.; Zhao, J.; Jiang, P. Fusion proteins of streptavidin and allophycocyanin alpha subunit for immunofluorescence assay. Biochem. Eng. J. 2017, 125, 97–103. [Google Scholar] [CrossRef]
- Chen, H.X.; Jiang, P. Combinational biosynthesis and characterization of fusion proteins with tandem repeats of allophycocyanin holo-alpha subunits, and their application as bright fluorescent labels for immunofluorescence assay. J. Biosci. Bioeng. 2018, 126, 778–782. [Google Scholar] [CrossRef]
- Chattopadhyay, P.K.; Gaylord, B.; Palmer, A.; Jiang, N.; Raven, M.A.; Lewis, G.; Reuter, M.A.; Nur-ur Rahman, A.K.M.; Price, D.A.; Betts, M.R.; et al. Brilliant violet fluorophores: A new class of ultrabright fluorescent compounds for immunofluorescence experiments. Cytom. A 2012, 81A, 456–466. [Google Scholar] [CrossRef]
- Telford, W.G. Near-ultraviolet laser diodes for brilliant ultraviolet fluorophore excitation. Cytom. A 2015, 87, 1127–1137. [Google Scholar] [CrossRef]
- McKinnon, K.M. Flow Cytometry: An Overview. Curr. Protoc. Immunol. 2018, 120, 5.1.1–5.1.11. [Google Scholar] [CrossRef]
- Darzynkiewicz, Z.; Huang, X. Analysis of Cellular DNA Content by Flow Cytometry. Curr. Protoc. Immunol. 2004, 60, 5–7. [Google Scholar] [CrossRef]
- Yumoto, K.; Berry, J.E.; Taichman, R.S.; Shiozawa, Y. A novel method for monitoring tumor proliferation in vivo using fluorescent dye DiD. Cytom. A 2014, 85, 548–555. [Google Scholar] [CrossRef] [PubMed]
- Bonnier, F.; Keating, M.E.; Wróbel, T.P.; Majzner, K.; Baranska, M.; Garcia-Munoz, A.; Blanco, A.; Byrne, H.J. Cell viability assessment using the Alamar blue assay: A comparison of 2D and 3D cell culture models. Toxicol. In Vitro 2015, 29, 124–131. [Google Scholar] [CrossRef] [PubMed]
- Rink, E.; Kuhl, J.; Aurich, C.; French, H.; Nino-Fong, R.; Watson, E.; Donadeu, F.X. 195 Expression of Mesenchymal Stromal Cell (MSC) Markers in the Equine Endometrium and In Vitro Influence of Steroid Hormones on Endometrial-Derived MSC. Reprod. Fertil. Dev. 2017, 29, 206. [Google Scholar] [CrossRef]
- Crous, A.; Abrahamse, H. Low-Intensity Laser Irradiation at 636 nm Induces Increased Viability and Proliferation in Isolated Lung Cancer Stem Cells. Photomed. Laser Surg. 2016, 34, 525–532. [Google Scholar] [CrossRef]
- Chen, Q.; Ross, A.C. α-Galactosylceramide stimulates splenic lymphocyte proliferation in vitro and increases antibody production in vivo in late neonatal-age mice. Clin. Exp. Immunol. 2015, 179, 188–196. [Google Scholar] [CrossRef]
- Parish, C.R. Fluorescent dyes for lymphocyte migration and proliferation studies. Immunol. Cell Biol. 1999, 77, 499–508. [Google Scholar] [CrossRef]
- Honig, M.G.; Hume, R.I. Fluorescent carbocyanine dyes allow living neurons of identified origin to be studied in long-term cultures. J. Cell Biol. 1986, 103, 171–187. [Google Scholar] [CrossRef]
- Heinrich, L.; Freyria, A.-M.; Melin, M.; Tourneur, Y.; Maksoud, R.; Bernengo, J.-C.; Hartmann, D.J. Confocal laser scanning microscopy using dialkylcarbocyanine dyes for cell tracing in hard and soft biomaterials. J. Biomed. Mater. Res. B Appl. Biomater. 2007, 81B, 153–161. [Google Scholar] [CrossRef]
- Baehler, P.J.; Biondi, R.M.; van Bemmelen, M.; Véron, M.; Reymond, C.D. Random Insertion of Green Fluorescent Protein into the Regulatory Subunit of Cyclic Adenosine Monophosphate-Dependent Protein Kinase. In Green Fluorescent Protein: Applications and Protocols; Hicks, B.W., Ed.; Humana Press: Totowa, NJ, USA, 2002; pp. 57–68. [Google Scholar] [CrossRef]
- Lippincott-Schwartz, J.; Altan-Bonnet, N.; Patterson, G.H. Photobleaching and photoactivation: following protein dynamics in living cells. Nat. Cell Biol. 2003, 5, S7–S14. [Google Scholar] [CrossRef]
- Chudakov, D.M.; Matz, M.V.; Lukyanov, S.; Lukyanov, K.A. Fluorescent Proteins and Their Applications in Imaging Living Cells and Tissues. Physiol. Rev. 2010, 90, 1103–1163. [Google Scholar] [CrossRef]
- Chalfie, M.; Tu, Y.; Euskirchen, G.; Ward, W.W.; Prasher, D.C. Green Fluorescent Protein as a Marker for Gene Expression. Science 1994, 263, 802–805. [Google Scholar] [CrossRef] [PubMed]
- Terskikh, A.; Fradkov, A.; Ermakova, G.; Zaraisky, A.; Tan, P.; Kajava, A.V.; Zhao, X.; Lukyanov, S.; Matz, M.; Kim, S.; et al. “Fluorescent Timer”: Protein That Changes Color with Time. Science 2000, 290, 1585–1588. [Google Scholar] [CrossRef] [PubMed]
- Tyagi, S. Imaging intracellular RNA distribution and dynamics in living cells. Nat. Methods 2009, 6, 331–338. [Google Scholar] [CrossRef]
- Gasser, S.M. Visualizing Chromatin Dynamics in Interphase Nuclei. Science 2002, 296, 1412–1416. [Google Scholar] [CrossRef]
- Lindhout, B.I.; Fransz, P.; Tessadori, F.; Meckel, T.; Hooykaas, P.J.J.; van der Zaal, B.J. Live cell imaging of repetitive DNA sequences via GFP-tagged polydactyl zinc finger proteins. Nucleic Acids Res. 2007, 35, e107. [Google Scholar] [CrossRef] [PubMed]
- Kanda, T.; Sullivan, K.F.; Wahl, G.M. Histone–GFP fusion protein enables sensitive analysis of chromosome dynamics in living mammalian cells. Curr. Biol. 1998, 8, 377–385. [Google Scholar] [CrossRef]
- Henikoff, S.; Ahmad, K.; Platero, J.S.; van Steensel, B. Heterochromatic Deposition of Centromeric Histone H3-Like Proteins. Proc. Natl. Acad. Sci. USA 2000, 97, 716–721. [Google Scholar] [CrossRef]
- Yang, F.; Moss, L.G.; Phillips, G.N. The molecular structure of green fluorescent protein. Nat. Biotechnol. 1996, 14, 1246–1251. [Google Scholar] [CrossRef]
- Sample, V.; Newman, R.H.; Zhang, J. The structure and function of fluorescent proteins. Chem. Soc. Rev. 2009, 38, 2852–2864. [Google Scholar] [CrossRef]
- Tsien, R.Y. THE GREEN FLUORESCENT PROTEIN. Annu. Rev. Biochem. 1998, 67, 509–544. [Google Scholar] [CrossRef]
- Ward, W.W.; Bokman, S.H. Reversible denaturation of Aequorea green-fluorescent protein: physical separation and characterization of the renatured protein. Biochemistry 1982, 21, 4535–4540. [Google Scholar] [CrossRef] [PubMed]
- Heim, R.; Prasher, D.C.; Tsien, R.Y. Wavelength Mutations and Posttranslational Autoxidation of Green Fluorescent Protein. Proc. Natl. Acad. Sci. USA 1994, 91, 12501–12504. [Google Scholar] [CrossRef] [PubMed]
- Zhang, G.; Gurtu, V.; Kain, S.R. An Enhanced Green Fluorescent Protein Allows Sensitive Detection of Gene Transfer in Mammalian Cells. Biochem. Biophys. Res. Commun. 1996, 227, 707–711. [Google Scholar] [CrossRef] [PubMed]
- Pédelacq, J.-D.; Cabantous, S.; Tran, T.; Terwilliger, T.C.; Waldo, G.S. Engineering and characterization of a superfolder green fluorescent protein. Nat. Biotechnol. 2006, 24, 79–88. [Google Scholar] [CrossRef] [PubMed]
- Nagai, T.; Ibata, K.; Park, E.S.; Kubota, M.; Mikoshiba, K.; Miyawaki, A. A variant of yellow fluorescent protein with fast and efficient maturation for cell-biological applications. Nat. Biotechnol. 2002, 20, 87–90. [Google Scholar] [CrossRef]
- Nienhaus, K.; Ulrich Nienhaus, G. Fluorescent proteins for live-cell imaging with super-resolution. Chem. Soc. Rev. 2014, 43, 1088–1106. [Google Scholar] [CrossRef]
- Karasawa, S.; Araki, T.; Yamamoto-Hino, M.; Miyawaki, A. A Green-emitting Fluorescent Protein from Galaxeidae Coral and Its Monomeric Version for Use in Fluorescent Labeling. J. Biol. Chem. 2003, 278, 34167–34171. [Google Scholar] [CrossRef]
- Gurskaya, N.G.; Verkhusha, V.V.; Shcheglov, A.S.; Staroverov, D.B.; Chepurnykh, T.V.; Fradkov, A.F.; Lukyanov, S.; Lukyanov, K.A. Engineering of a monomeric green-to-red photoactivatable fluorescent protein induced by blue light. Nat. Biotechnol. 2006, 24, 461–465. [Google Scholar] [CrossRef]
- Evdokimov, A.G.; Pokross, M.E.; Egorov, N.S.; Zaraisky, A.G.; Yampolsky, I.V.; Merzlyak, E.M.; Shkoporov, A.N.; Sander, I.; Lukyanov, K.A.; Chudakov, D.M. Structural basis for the fast maturation of Arthropoda green fluorescent protein. EMBO reports 2006, 7, 1006–1012. [Google Scholar] [CrossRef]
- Wiedenmann, J.; Oswald, F.; Nienhaus, G.U. Fluorescent proteins for live cell imaging: Opportunities, limitations, and challenges. IUBMB Life 2009, 61, 1029–1042. [Google Scholar] [CrossRef]
- Miyawaki, A.; Shcherbakova, D.M.; Verkhusha, V.V. Red fluorescent proteins: chromophore formation and cellular applications. Curr. Opin. Struct. Biol. 2012, 22, 679–688. [Google Scholar] [CrossRef] [PubMed]
- Yarbrough, D.; Wachter, R.M.; Kallio, K.; Matz, M.V.; Remington, S.J. Refined crystal structure of DsRed, a red fluorescent protein from coral, at 2.0-Å resolution. Proc. Natl. Acad. Sci. USA 2001, 98, 462–467. [Google Scholar] [CrossRef] [PubMed]
- Baird, G.S.; Zacharias, D.A.; Tsien, R.Y. Biochemistry, mutagenesis, and oligomerization of DsRed, a red fluorescent protein from coral. Proc. Natl. Acad. Sci. USA 2000, 97, 11984–11989. [Google Scholar] [CrossRef] [PubMed]
- Nishizawa, K.; Kita, Y.; Kitayama, M.; Ishimoto, M. A red fluorescent protein, DsRed2, as a visual reporter for transient expression and stable transformation in soybean. Plant Cell Rep. 2006, 25, 1355–1361. [Google Scholar] [CrossRef] [PubMed]
- Strack, R.L.; Strongin, D.E.; Bhattacharyya, D.; Tao, W.; Berman, A.; Broxmeyer, H.E.; Keenan, R.J.; Glick, B.S. A noncytotoxic DsRed variant for whole-cell labeling. Nat. Methods 2008, 5, 955–957. [Google Scholar] [CrossRef]
- Shaner, N.C.; Steinbach, P.A.; Tsien, R.Y. A guide to choosing fluorescent proteins. Nat. Methods 2005, 2, 905–909. [Google Scholar] [CrossRef]
- Subach, F.V.; Patterson, G.H.; Manley, S.; Gillette, J.M.; Lippincott-Schwartz, J.; Verkhusha, V.V. Photoactivatable mCherry for high-resolution two-color fluorescence microscopy. Nat. Methods 2009, 6, 153–159. [Google Scholar] [CrossRef]
- Shaner, N.C.; Patterson, G.H.; Davidson, M.W. Advances in fluorescent protein technology. J. Cell Sci. 2007, 120, 4247–4260. [Google Scholar] [CrossRef]
- Day, R.N.; Davidson, M.W. The fluorescent protein palette: tools for cellular imaging. Chem. Soc. Rev. 2009, 38, 2887–2921. [Google Scholar] [CrossRef]
- Andresen, M.; Stiel, A.C.; Trowitzsch, S.; Weber, G.; Eggeling, C.; Wahl, M.C.; Hell, S.W.; Jakobs, S. Structural basis for reversible photoswitching in Dronpa. Proc. Natl. Acad. Sci. USA 2007, 104, 13005–13009. [Google Scholar] [CrossRef]
- Mizuno, H.; Mal, T.K.; Wälchli, M.; Kikuchi, A.; Fukano, T.; Ando, R.; Jeyakanthan, J.; Taka, J.; Shiro, Y.; Ikura, M.; et al. Light-dependent regulation of structural flexibility in a photochromic fluorescent protein. Proc. Natl. Acad. Sci. USA 2008, 105, 9227–9232. [Google Scholar] [CrossRef] [PubMed]
- Ando, R.; Mizuno, H.; Miyawaki, A. Regulated Fast Nucleocytoplasmic Shuttling Observed by Reversible Protein Highlighting. Science 2004, 306, 1370–1373. [Google Scholar] [CrossRef] [PubMed]
- Remington, S.J. Fluorescent proteins: maturation, photochemistry and photophysics. Curr. Opin. Struct. Biol. 2006, 16, 714–721. [Google Scholar] [CrossRef] [PubMed]
- Voronin, D.V.; Sindeeva, O.A.; Kurochkin, M.A.; Mayorova, O.; Fedosov, I.V.; Semyachkina-Glushkovskaya, O.; Gorin, D.A.; Tuchin, V.V.; Sukhorukov, G.B. In Vitro and in Vivo Visualization and Trapping of Fluorescent Magnetic Microcapsules in a Bloodstream. ACS Appl. Mater. Interfaces 2017, 9, 6885–6893. [Google Scholar] [CrossRef] [PubMed]
- Zborowski, M.; Chalmers, J.J.; Lowrie, W.G. Magnetic Cell Manipulation and Sorting. In Microtechnology for Cell Manipulation and Sorting; Lee, W., Tseng, P., Di Carlo, D., Eds.; Springer International Publishing: Cham, Switzerland, 2017; pp. 15–55. [Google Scholar] [CrossRef]
- Brian, D.P.; Shashi, K.M.; Laura, H.L. Fundamentals and application of magnetic particles in cell isolation and enrichment: A review. Rep. Prog. Phys. 2015, 78, 016601. [Google Scholar] [CrossRef]
- Gupta, A.K.; Gupta, M. Synthesis and surface engineering of iron oxide nanoparticles for biomedical applications. Biomaterials 2005, 26, 3995–4021. [Google Scholar] [CrossRef]
- Jeong, U.; Teng, X.; Wang, Y.; Yang, H.; Xia, Y. Superparamagnetic Colloids: Controlled Synthesis and Niche Applications. Adv. Mater. 2007, 19, 33–60. [Google Scholar] [CrossRef]
- Pankhurst, Q.A.; Connolly, J.; Jones, S.K.; Dobson, J. Applications of magnetic nanoparticles in biomedicine. J. Phys. D Appl. Phys. 2003, 36, R167. [Google Scholar] [CrossRef]
- Lu, A.H.; Salabas, E.E.; Schüth, F. Magnetic Nanoparticles: Synthesis, Protection, Functionalization, and Application. Angew. Chem. Int. Ed. 2007, 46, 1222–1244. [Google Scholar] [CrossRef]
- Zhang, Q.; Yin, T.; Xu, R.; Gao, W.; Zhao, H.; Shapter, J.G.; Wang, K.; Shen, Y.; Huang, P.; Gao, G.; et al. Large-scale immuno-magnetic cell sorting of T cells based on a self-designed high-throughput system for potential clinical application. Nanoscale 2017, 9, 13592–13599. [Google Scholar] [CrossRef]
- Shen, F.; Park, J.-K. Toxicity Assessment of Iron Oxide Nanoparticles Based on Cellular Magnetic Loading Using Magnetophoretic Sorting in a Trapezoidal Microchannel. Anal. Chem. 2018, 90, 920–927. [Google Scholar] [CrossRef]
- Myklatun, A.; Cappetta, M.; Winklhofer, M.; Ntziachristos, V.; Westmeyer, G.G. Microfluidic sorting of intrinsically magnetic cells under visual control. Sci. Rep. 2017, 7, 6942. [Google Scholar] [CrossRef]
- Wyatt Shields Iv, C.; Reyes, C.D.; López, G.P. Microfluidic cell sorting: A review of the advances in the separation of cells from debulking to rare cell isolation. Lab Chip 2015, 15, 1230–1249. [Google Scholar] [CrossRef] [PubMed]
- Shields, C.W.; Johnson, L.M.; Gao, L.; López, G.P. Elastomeric Negative Acoustic Contrast Particles for Capture, Acoustophoretic Transport, and Confinement of Cells in Microfluidic Systems. Langmuir 2014, 30, 3923–3927. [Google Scholar] [CrossRef] [PubMed]
- Shields IV, C.W.; Sun, D.; Johnson, K.A.; Duval, K.A.; Rodriguez, A.V.; Gao, L.; Dayton, P.A.; López, G.P. Nucleation and Growth Synthesis of Siloxane Gels to Form Functional, Monodisperse, and Acoustically Programmable Particles. Angew. Chem. Int. Ed. 2014, 53, 8070–8073. [Google Scholar] [CrossRef] [PubMed]
- Cushing, K.W.; Piyasena, M.E.; Carroll, N.J.; Maestas, G.C.; López, B.A.; Edwards, B.S.; Graves, S.W.; López, G.P. Elastomeric Negative Acoustic Contrast Particles for Affinity Capture Assays. Anal. Chem. 2013, 85, 2208–2215. [Google Scholar] [CrossRef][Green Version]
- Faridi, M.A.; Ramachandraiah, H.; Iranmanesh, I.; Grishenkov, D.; Wiklund, M.; Russom, A. MicroBubble activated acoustic cell sorting. Biomed. Microdevices 2017, 19, 23. [Google Scholar] [CrossRef] [PubMed]
- Allard, W.J.; Matera, J.; Miller, M.C.; Repollet, M.; Connelly, M.C.; Rao, C.; Tibbe, A.G.J.; Uhr, J.W.; Terstappen, L.W.M.M. Tumor Cells Circulate in the Peripheral Blood of All Major Carcinomas but not in Healthy Subjects or Patients With Nonmalignant Diseases. Clin. Cancer Res. 2004, 10, 6897–6904. [Google Scholar] [CrossRef] [PubMed]
- Horn, P.; Bork, S.; Diehlmann, A.; Walenda, T.; Eckstein, V.; Ho, A.; Wagner, W. Isolation of human mesenchymal stromal cells is more efficient by red blood cell lysis. Cytotherapy 2008, 10, 676–685. [Google Scholar] [CrossRef]
- Takao, M.; Takeda, K. Enumeration, characterization, and collection of intact circulating tumor cells by cross contamination-free flow cytometry. Cytom. A 2011, 79A, 107–117. [Google Scholar] [CrossRef]
- Barbour, R.; Kling, K.; Anderson, J.P.; Banducci, K.; Cole, T.; Diep, L.; Fox, M.; Goldstein, J.M.; Soriano, F.; Seubert, P.; et al. Red Blood Cells Are the Major Source of Alpha-Synuclein in Blood. Neurodegener. Dis. 2008, 5, 55–59. [Google Scholar] [CrossRef]
- Majekodunmi, S.O. A Review on Centrifugation in the Pharmaceutical Industry. Am. J. Biomed. Eng. 2015, 5, 67–78. [Google Scholar] [CrossRef]
- Noble, P.B.; Cutts, J.H. Separation of blood leukocytes by Ficoll gradient. Can. Vet. J. 1967, 8, 110–111. [Google Scholar] [PubMed]
- Feldman, D.L.; Mogelesky, T.C. Use of Histopaque for isolating mononuclear cells from rabbit blood. J. Immunol. Methods 1987, 102, 243–249. [Google Scholar] [CrossRef]
- Gertler, R.; Rosenberg, R.; Fuehrer, K.; Dahm, M.; Nekarda, H.; Siewert, J.R. Detection of Circulating Tumor Cells in Blood Using an Optimized Density Gradient Centrifugation; Springer: Berlin/Heidelberg, Germany, 2003; pp. 149–155. [Google Scholar] [CrossRef]
- Ulmer, A.J.; Flad, H.D. Discontinuous density gradient separation of human minonuclear leucocytes using percoll® as gradient medium. J. Immunol. Methods 1979, 30, 1–10. [Google Scholar] [CrossRef]
- Bernhardt, M.; Pennell, D.R.; Almer, L.S.; Schell, R.F. Detection of bacteria in blood by centrifugation and filtration. J. Clin. Microbiol. 1991, 29, 422–425. [Google Scholar] [CrossRef] [PubMed]
- Paterlini-Brechot, P.; Benali, N.L. Circulating tumor cells (CTC) detection: Clinical impact and future directions. Cancer Lett. 2007, 253, 180–204. [Google Scholar] [CrossRef]
- Vona, G.; Sabile, A.; Louha, M.; Sitruk, V.; Romana, S.; Schütze, K.; Capron, F.; Franco, D.; Pazzagli, M.; Vekemans, M.; et al. Isolation by Size of Epithelial Tumor Cells: A New Method for the Immunomorphological and Molecular Characterization of Circulating Tumor Cells. Am. J. Pathol. 2000, 156, 57–63. [Google Scholar] [CrossRef]
- Alain, T.; Cyrill, C.; Jean-Claude, B. Filtration cytometry: A new concept for parallel real time analysis of bacteria, cells, and particles. Biol. Cell 1992, 76, 245. [Google Scholar] [CrossRef]
- Tang, Y.; Shi, J.; Li, S.; Wang, L.; Cayre, Y.E.; Chen, Y. Microfluidic device with integrated microfilter of conical-shaped holes for high efficiency and high purity capture of circulating tumor cells. Sci. Rep. 2014, 4, 6052. [Google Scholar] [CrossRef]
- Zheng, S.; Lin, H.; Liu, J.-Q.; Balic, M.; Datar, R.; Cote, R.J.; Tai, Y.-C. Membrane microfilter device for selective capture, electrolysis and genomic analysis of human circulating tumor cells. J. Chromatogr. A 2007, 1162, 154–161. [Google Scholar] [CrossRef] [PubMed]
- Rostagno, P.; Moll, J.L.; Bisconte, J.C.; Caldani, C. Detection of rare circulating breast cancer cells by filtration cytometry and identification by DNA content: sensitivity in an experimental model. Anticancer Res. 1997, 17, 2481–2485. [Google Scholar] [PubMed]
- Golden, J.P.; Justin, G.A.; Nasir, M.; Ligler, F.S. Hydrodynamic focusing—a versatile tool. Anal. Bioanal. Chem. 2012, 402, 325–335. [Google Scholar] [CrossRef] [PubMed]
- Ward, M.; Turner, P.; DeJohn, M.; Kaduchak, G. Fundamentals of Acoustic Cytometry. Curr. Protoc. Cytom. 2009, 49, 1–22. [Google Scholar] [CrossRef]
- Ward, M.D.; Kaduchak, G. Fundamentals of Acoustic Cytometry. Curr. Protoc. Cytom. 2018, 84, e36. [Google Scholar] [CrossRef]
- Piyasena, M.E.; Austin Suthanthiraraj, P.P.; Applegate, R.W.; Goumas, A.M.; Woods, T.A.; López, G.P.; Graves, S.W. Multinode Acoustic Focusing for Parallel Flow Cytometry. Anal. Chem. 2012, 84, 1831–1839. [Google Scholar] [CrossRef]
- Hossan, M.R.; Dutta, D.; Islam, N.; Dutta, P. Review: Electric field driven pumping in microfluidic device. Electrophoresis 2018, 39, 702–731. [Google Scholar] [CrossRef]
- Chan, J.Y.; Kayani, A.B.A.; Ali, M.A.M.; Kok, C.K.; Majlis, B.Y.; Hoe, S.L.L.; Marzuki, M.; Khoo, A.S.-B.; Ostrikov, K.; Rahman, M.A.; et al. Dielectrophoresis-based microfluidic platforms for cancer diagnostics. Biomicrofluidics 2018, 12, 011503. [Google Scholar] [CrossRef]
- Parks, D.R.; Herzenberg, L.A. Fluorescence-activated Cell Sorting—Theory, Experimental Optimization, and Applications in Lymphoid-cell Biology. Methods Enzymol. 1984, 108, 197–241. [Google Scholar]
- Patil, P.; Kumeria, T.; Losic, D.; Kurkuri, M. Isolation of circulating tumour cells by physical means in a microfluidic device: A review. RSC Adv. 2015, 5, 89745–89762. [Google Scholar] [CrossRef]
- Kyung-A, H.; Hyo-Il, J. Microfluidic devices for the isolation of circulating rare cells: A focus on affinity-based, dielectrophoresis, and hydrophoresis. Electrophoresis 2013, 34, 1028–1041. [Google Scholar] [CrossRef]
- Jung, J.; Seo, S.-K.; Joo, Y.-D.; Han, K.-H. Label-free continuous lateral magneto-dielectrophoretic microseparators for highly efficient enrichment of circulating nucleated cells from peripheral blood. Sens. Actuators B Chem. 2011, 157, 314–320. [Google Scholar] [CrossRef]
- Bulfoni, M.; Gerratana, L.; Del Ben, F.; Marzinotto, S.; Sorrentino, M.; Turetta, M.; Scoles, G.; Toffoletto, B.; Isola, M.; Beltrami, C.A.; et al. In patients with metastatic breast cancer the identification of circulating tumor cells in epithelial-to-mesenchymal transition is associated with a poor prognosis. Breast Cancer Res. 2016, 18, 15. [Google Scholar] [CrossRef] [PubMed]
- Kim, S.H.; Fujii, T. Efficient analysis of a small number of cancer cells at the single-cell level using an electroactive double-well array. Lab Chip 2016, 16, 2440–2449. [Google Scholar] [CrossRef]
- Kim, S.H.; Ito, H.; Kozuka, M.; Hirai, M.; Fujii, T. Localization of low-abundant cancer cells in a sharply expanded microfluidic step-channel using dielectrophoresis. Biomicrofluidics 2017, 11, 054114. [Google Scholar] [CrossRef]
- Alazzam, A.; Mathew, B.; Alhammadi, F. Novel microfluidic device for the continuous separation of cancer cells using dielectrophoresis. J. Sep. Sci. 2017, 40, 1193–1200. [Google Scholar] [CrossRef]
- Li, M.; Anand, R.K. High-Throughput Selective Capture of Single Circulating Tumor Cells by Dielectrophoresis at a Wireless Electrode Array. J. Am. Chem. Soc. 2017, 139, 8950–8959. [Google Scholar] [CrossRef]
- Shafiee, H.; Sano, M.B.; Henslee, E.A.; Caldwell, J.L.; Davalos, R.V. Selective isolation of live/dead cells using contactless dielectrophoresis (cDEP). Lab Chip 2010, 10, 438–445. [Google Scholar] [CrossRef]
- Sun, M.R.; Agarwal, P.; Zhao, S.T.; Zhao, Y.; Lu, X.B.; He, X.M. Continuous On-Chip Cell Separation Based on Conductivity-Induced Dielectrophoresis with 3D Self-Assembled Ionic Liquid Electrodes. Anal. Chem. 2016, 88, 8264–8271. [Google Scholar] [CrossRef]
- Yoshioka, J.; Yoshitomi, T.; Yasukawa, T.; Yoshimoto, K. Alternation of Gene Expression Levels in Mesenchymal Stem Cells by Applying Positive Dielectrophoresis. Anal. Sci. 2016, 32, 1213–1216. [Google Scholar] [CrossRef]
- Adams, T.N.G.; Jiang, A.Y.L.; Vyas, P.D.; Flanagan, L.A. Separation of neural stem cells by whole cell membrane capacitance using dielectrophoresis. Methods 2018, 133, 91–103. [Google Scholar] [CrossRef] [PubMed]
- El-Badawy, A.; Amer, M.; Abdelbaset, R.; Sherif, S.N.; Abo-Elela, M.; Ghallab, Y.H.; Abdelhamid, H.; Ismail, Y.; El-Badri, N. Adipose Stem Cells Display Higher Regenerative Capacities and More Adaptable Electro-Kinetic Properties Compared to Bone Marrow-Derived Mesenchymal Stromal Cells. Sci. Rep. 2016, 6, 11. [Google Scholar] [CrossRef] [PubMed]
- Srivastava, S.K.; Gencoglu, A.; Minerick, A.R. DC insulator dielectrophoretic applications in microdevice technology: A review. Anal. Bioanal. Chem. 2011, 399, 301–321. [Google Scholar] [CrossRef] [PubMed]
- Lapizco-Encinas, B.H.; Simmons, B.A.; Cummings, E.B.; Fintschenko, Y. Dielectrophoretic concentration and separation of live and dead bacteria in an array of insulators. Anal. Chem. 2004, 76, 1571–1579. [Google Scholar] [CrossRef] [PubMed]
- Lapizco-Encinas, B.H.; Simmons, B.A.; Cummings, E.B.; Fintschenko, Y. Insulator-based dielectrophoresis for the selective concentration and separation of live bacteria in water. Electrophoresis 2004, 25, 1695–1704. [Google Scholar] [CrossRef] [PubMed]
- Nuttawut, L.; Guolin, X.; Chun, Y. Enhanced cell trapping throughput using DC-biased AC electric field in a dielectrophoresis-based fluidic device with densely packed silica beads. Electrophoresis 2018, 39, 878–886. [Google Scholar] [CrossRef]
- Shafiee, H.; Caldwell, J.L.; Sano, M.B.; Davalos, R.V. Contactless dielectrophoresis: A new technique for cell manipulation. Biomed. Microdevices 2009, 11, 997–1006. [Google Scholar] [CrossRef]
- Henslee, E.A.; Sano, M.B.; Rojas, A.D.; Schmelz, E.M.; Davalos, R.V. Selective concentration of human cancer cells using contactless dielectrophoresis. Electrophoresis 2011, 32, 2523–2529. [Google Scholar] [CrossRef]
- Sano, M.B.; Henslee, E.A.; Schmelz, E.M.; Davalos, R.V. Contactless dielectrophoretic spectroscopy: Examination of the dielectric properties of cells found in blood. Electrophoresis 2011, 32, 3164–3171. [Google Scholar] [CrossRef]
- Hanson, C.; Vargis, E. Alternative cDEP Design to Facilitate Cell Isolation for Identification by Raman Spectroscopy. Sensors 2017, 17, 9. [Google Scholar] [CrossRef]
- Rahmani, A.; Mohammadi, A.; Kalhor, H.R. A continuous flow microfluidic device based on contactless dielectrophoresis for bioparticles enrichment. Electrophoresis 2018, 39, 445–455. [Google Scholar] [CrossRef] [PubMed]
- Lin, W.-Y.; Lin, Y.-H.; Lee, G.-B. Separation of micro-particles utilizing spatial difference of optically induced dielectrophoretic forces. Microfluid. Nanofluid. 2010, 8, 217–229. [Google Scholar] [CrossRef]
- Chiou, P.Y.; Ohta, A.T.; Wu, M.C. Massively parallel manipulation of single cells and microparticles using optical images. Nature 2005, 436, 370. [Google Scholar] [CrossRef] [PubMed]
- Hwang, H.; Lee, D.-H.; Choi, W.; Park, J.-K. Enhanced discrimination of normal oocytes using optically induced pulling-up dielectrophoretic force. Biomicrofluidics 2009, 3, 014103. [Google Scholar] [CrossRef]
- Huang, S.-B.; Wu, M.-H.; Lin, Y.-H.; Hsieh, C.-H.; Yang, C.-L.; Lin, H.-C.; Tseng, C.-P.; Lee, G.-B. High-purity and label-free isolation of circulating tumor cells (CTCs) in a microfluidic platform by using optically-induced-dielectrophoretic (ODEP) force. Lab Chip 2013, 13, 1371–1383. [Google Scholar] [CrossRef]
- Chiu, T.K.; Chou, W.P.; Huang, S.B.; Wang, H.M.; Lin, Y.C.; Hsieh, C.H.; Wu, M.H. Application of optically-induced-dielectrophoresis in microfluidic system for purification of circulating tumour cells for gene expression analysis-Cancer cell line model. Sci. Rep. 2016, 6, 14. [Google Scholar] [CrossRef]
- Chou, W.P.; Wang, H.M.; Chang, J.H.; Chiu, T.K.; Hsieh, C.H.; Liao, C.J.; Wu, M.H. The utilization of optically-induced-dielectrophoresis (ODEP)-based virtual cell filters in a microfluidic system for continuous isolation and purification of circulating tumour cells (CTCs) based on their size characteristics. Sens. Actuator B Chem. 2017, 241, 245–254. [Google Scholar] [CrossRef]
- Chiu, T.-K.; Chao, A.C.; Chou, W.-P.; Liao, C.-J.; Wang, H.-M.; Chang, J.-H.; Chen, P.-H.; Wu, M.-H. Optically-induced-dielectrophoresis (ODEP)-based cell manipulation in a microfluidic system for high-purity isolation of integral circulating tumor cell (CTC) clusters based on their size characteristics. Sens. Actuators B Chem. 2018, 258, 1161–1173. [Google Scholar] [CrossRef]
- Liang, W.; Zhao, Y.; Liu, L.; Wang, Y.; Li, W.J.; Lee, G.-B. Determination of Cell Membrane Capacitance and Conductance via Optically Induced Electrokinetics. Biophys. J. 2017, 113, 1531–1539. [Google Scholar] [CrossRef]
- Zhang, J.; Yuan, D.; Zhao, Q.; Yan, S.; Tang, S.-Y.; Tan, S.H.; Guo, J.; Xia, H.; Nguyen, N.-T.; Li, W. Tunable particle separation in a hybrid dielectrophoresis (DEP)- inertial microfluidic device. Sens. Actuators B Chem. 2018, 267, 14–25. [Google Scholar] [CrossRef]
- Waheed, W.; Alazzam, A.; Mathew, B.; Christoforou, N.; Abu-Nada, E. Lateral fluid flow fractionation using dielectrophoresis (LFFF-DEP) for size-independent, label-free isolation of circulating tumor cells. J. Chromatogr. B 2018, 1087-1088, 133–137. [Google Scholar] [CrossRef] [PubMed]
- Xie, C.; Chen, B.; Yan, B.; Wu, J. A new method for particle manipulation by combination of dielectrophoresis and field-modulated electroosmotic vortex. Appl. Math. Mech. 2018, 39, 409–422. [Google Scholar] [CrossRef]
- Adekanmbi, E.O.; Srivastava, S.K. Dielectrophoretic applications for disease diagnostics using lab-on-a-chip platforms. Lab Chip 2016, 16, 2148–2167. [Google Scholar] [CrossRef] [PubMed]
- Menachery, A.; Kumawat, N.; Qasaimeh, M. Label-free microfluidic stem cell isolation technologies. TrAC Trends Anal. Chem. 2017, 89, 1–12. [Google Scholar] [CrossRef]
- Li, M.; Anand, R.K. Cellular dielectrophoresis coupled with single-cell analysis. Anal. Bioanal. Chem. 2018, 410, 2499–2515. [Google Scholar] [CrossRef] [PubMed]
- Nuchtavorn, N.; Suntornsuk, W.; Lunte, S.M.; Suntornsuk, L. Recent applications of microchip electrophoresis to biomedical analysis. J. Pharm. Biomed. Anal. 2015, 113, 72–96. [Google Scholar] [CrossRef]
- Miltenyi, S.; Müller, W.; Weichel, W.; Radbruch, A. High gradient magnetic cell separation with MACS. Cytometry 1990, 11, 231–238. [Google Scholar] [CrossRef]
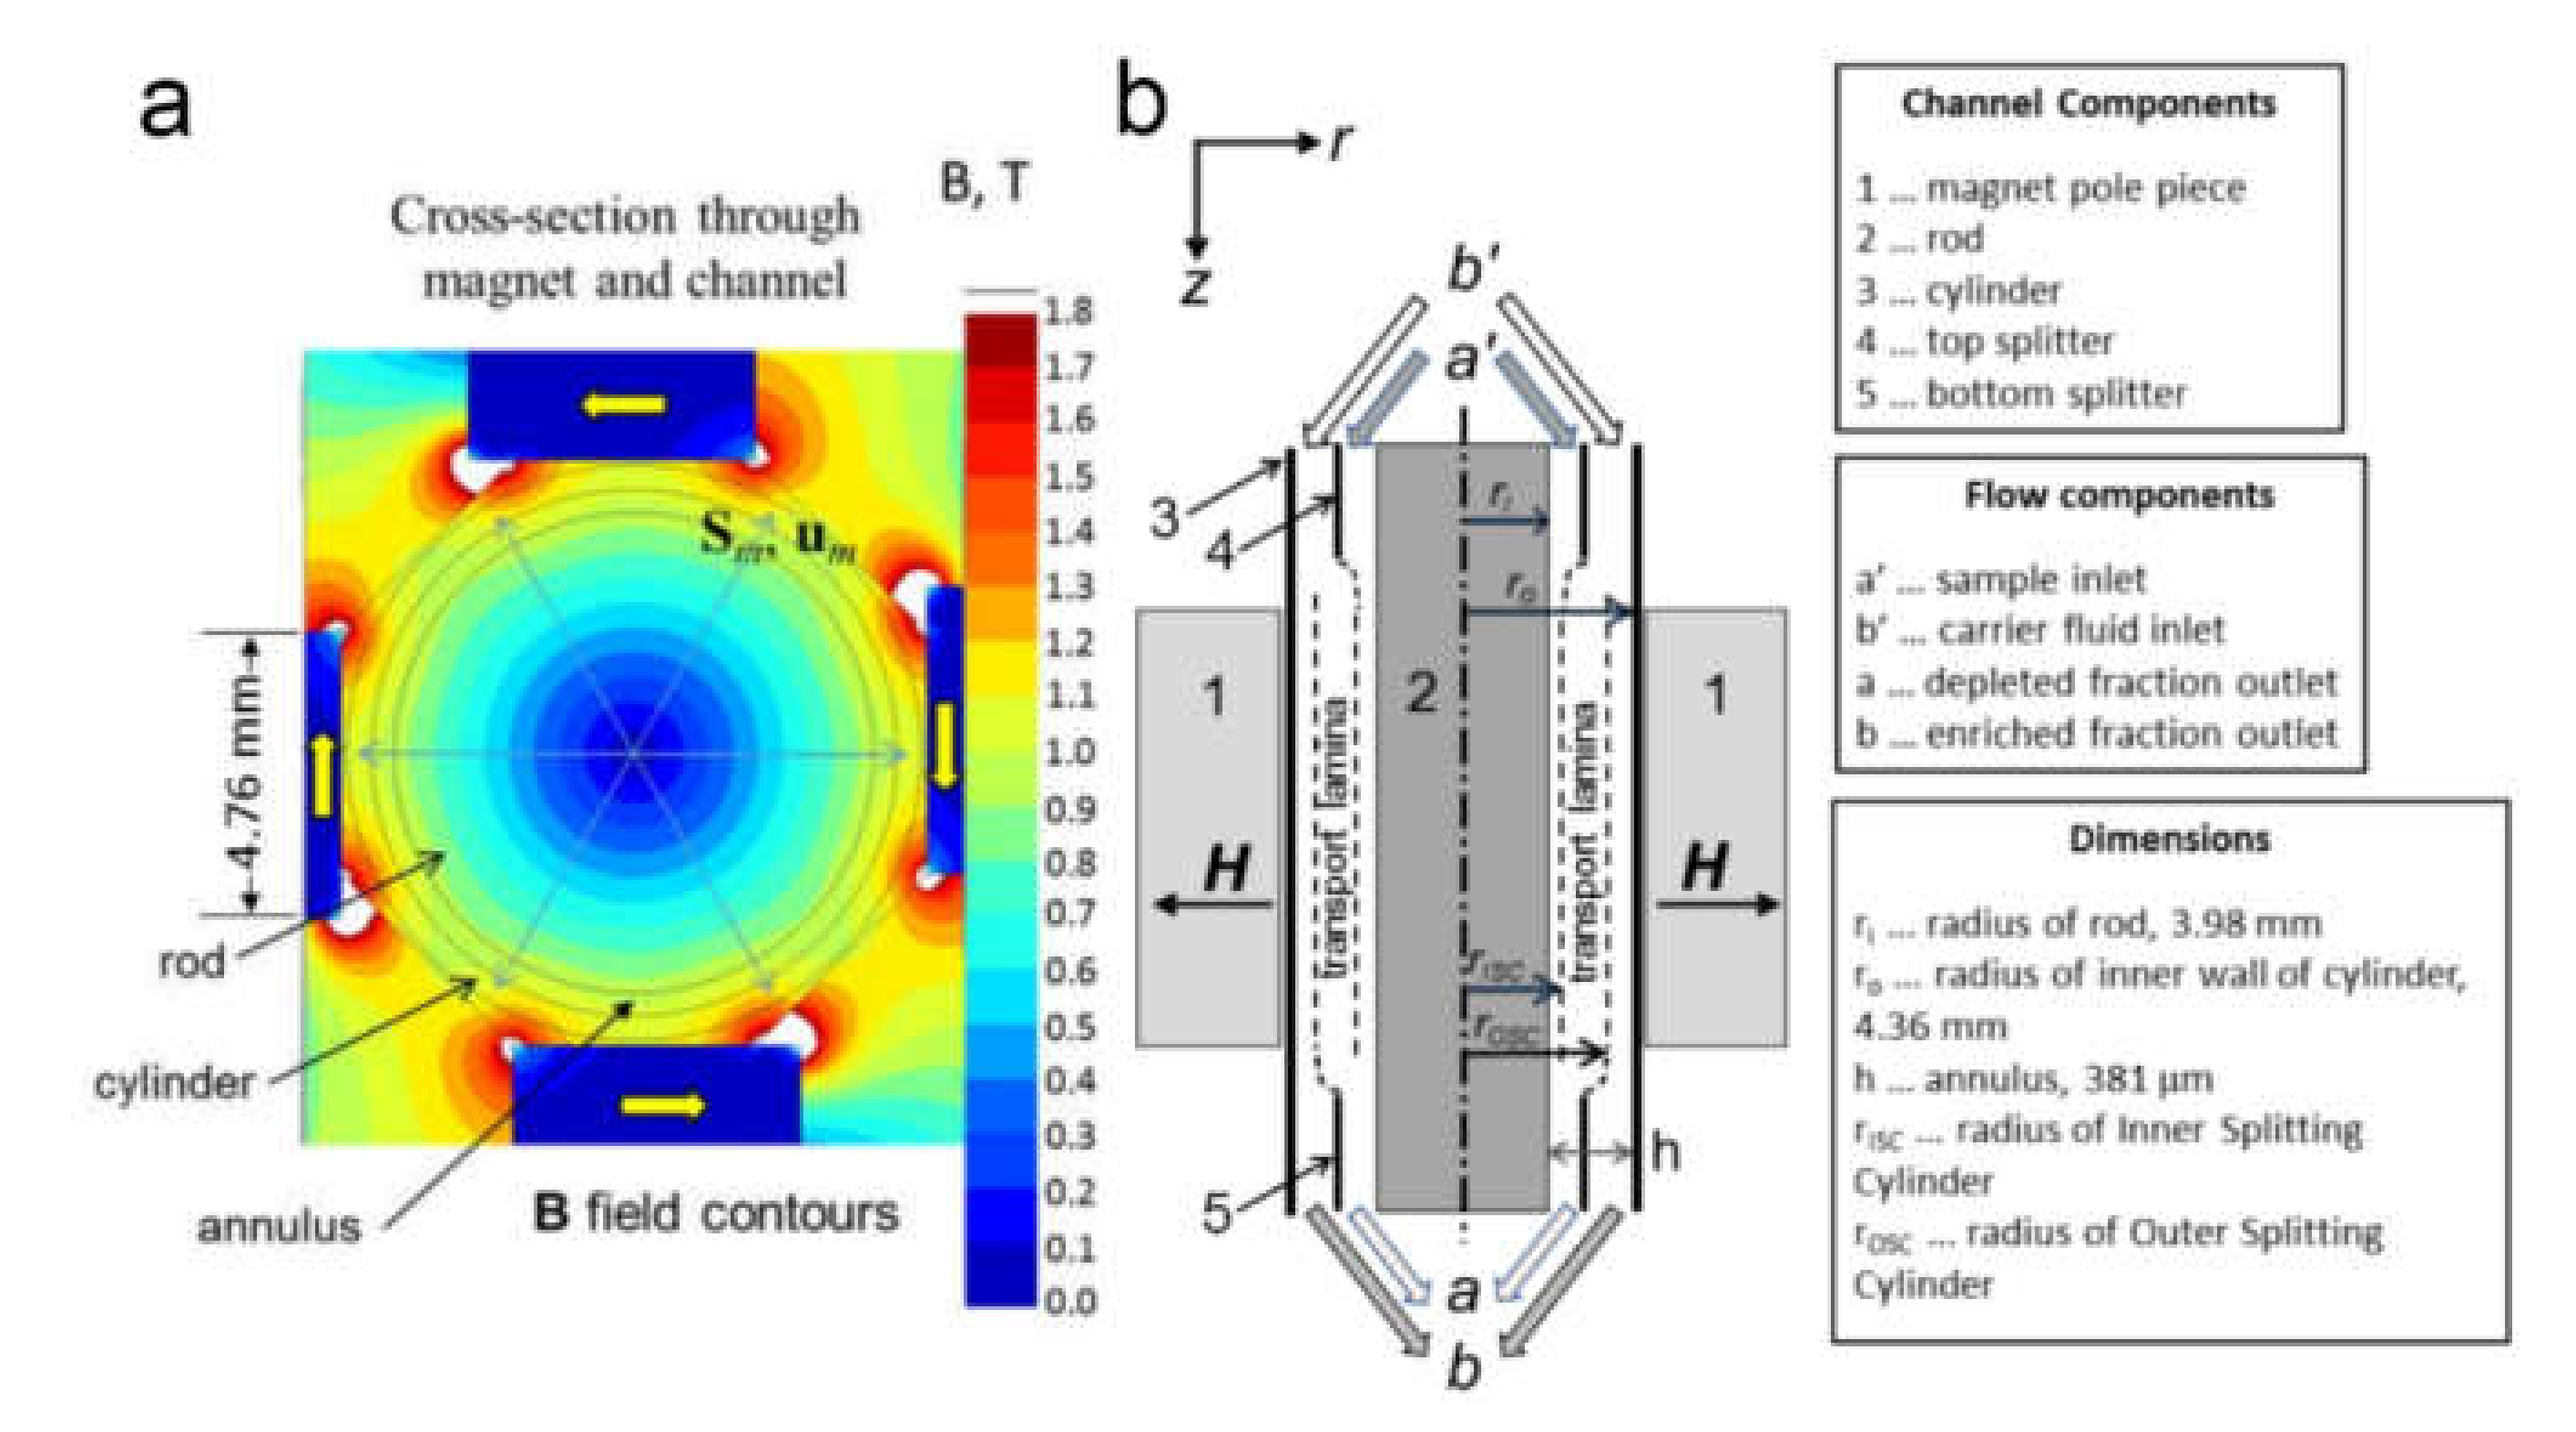
- Moore, L.R.; Mizutani, D.; Tanaka, T.; Buck, A.; Yazer, M.; Zborowski, M.; Chalmers, J.J. Continuous, intrinsic magnetic depletion of erythrocytes from whole blood with a quadrupole magnet and annular flow channel; pilot scale study. Biotechnol. Bioeng. 2018, 115, 1521–1530. [Google Scholar] [CrossRef]
- Jing, Y.; Moore, L.R.; Williams, P.S.; Chalmers, J.J.; Farag, S.S.; Bolwell, B.; Zborowski, M. Blood progenitor cell separation from clinical leukapheresis product by magnetic nanoparticle binding and magnetophoresis. Biotechnol. Bioeng. 2007, 96, 1139–1154. [Google Scholar] [CrossRef]
- Tong, X.D.; Xiong, Y.; Zborowski, M.; Farag, S.S.; Chalmers, J.J. A novel high throughput immunomagnetic cell sorting system for potential clinical scale depletion of T cells for allogeneic stem cell transplantation. Exp. Hematol. 2007, 35, 1613–1622. [Google Scholar] [CrossRef][Green Version]
- Shenkman, R.M.; Chalmers, J.J.; Hering, B.J.; Kirchhof, N.; Papas, K.K. Quadrupole Magnetic Sorting of Porcine Islets of Langerhans. Tissue Eng. Part C-Methods 2009, 15, 147–156. [Google Scholar] [CrossRef] [PubMed]
- Sajja, V.S.K.; Hanley, T.R.; Gapsis, H.; Guernsey, B.; Kennedy, D.J.; Taylor, M.J.; Papas, K.K.; Todd, P.W. Application of Magnetic Particle Tracking Velocimetry to Quadrupole Magnetic Sorting of Porcine Pancreatic Islets. Biotechnol. Bioeng. 2011, 108, 2107–2117. [Google Scholar] [CrossRef] [PubMed][Green Version]
- Samanta, A.; Modak, N.; Datta, A.; Ganguly, R. Operating regimes of a magnetic split-flow thin (SPLITT) fractionation microfluidic device for immunomagnetic separation. Microfluid. Nanofluid. 2016, 20, 87. [Google Scholar] [CrossRef]
- Kumar, V.; Rezai, P. Multiplex Inertio-Magnetic Fractionation (MIMF) of magnetic and non-magnetic microparticles in a microfluidic device. Microfluid. Nanofluid. 2017, 21, 83. [Google Scholar] [CrossRef]
- Huang, N.-T.; Hwong, Y.-J.; Lai, R.L. A microfluidic microwell device for immunomagnetic single-cell trapping. Microfluid. Nanofluid. 2018, 22, 16. [Google Scholar] [CrossRef]
- Khashan, S.A.; Dagher, S.; Alazzam, A. Microfluidic multi-target sorting by magnetic repulsion. Microfluid. Nanofluid. 2018, 22, 64. [Google Scholar] [CrossRef]
- Khashan, S.A.; Alazzam, A.; Mathew, B.; Hamdan, M. Mixture model for biomagnetic separation in microfluidic systems. J. Magn. Magn. Mater. 2017, 442, 118–127. [Google Scholar] [CrossRef]
- Shi, W.; Wang, S.; Maarouf, A.; Uhl, C.G.; He, R.; Yunus, D.; Liu, Y. Magnetic particles assisted capture and release of rare circulating tumor cells using wavy-herringbone structured microfluidic devices. Lab Chip 2017, 17, 3291–3299. [Google Scholar] [CrossRef]
- Zhang, L.; Xu, Z.; Kang, Y.; Xue, P. Three-dimensional microfluidic chip with twin-layer herringbone structure for high efficient tumor cell capture and release via antibody-conjugated magnetic microbeads. Electrophoresis 2018, 39, 1452–1459. [Google Scholar] [CrossRef]
- Jung, S.H.; Hahn, Y.K.; Oh, S.; Kwon, S.; Um, E.; Choi, S.; Kang, J.H. Advection Flows-Enhanced Magnetic Separation for High-Throughput Bacteria Separation from Undiluted Whole Blood. Small 2018, 14, 1801731. [Google Scholar] [CrossRef]
- Xu, H.; Dong, B.; Xu, S.; Xu, S.; Sun, X.; Sun, J.; Yang, Y.; Xu, L.; Bai, X.; Zhang, S.; et al. High purity microfluidic sorting and in situ inactivation of circulating tumor cells based on multifunctional magnetic composites. Biomaterials 2017, 138, 69–79. [Google Scholar] [CrossRef] [PubMed]
- Droz, X.; Harraghy, N.; Lançon, E.; Le Fourn, V.; Calabrese, D.; Colombet, T.; Liechti, P.; Rida, A.; Girod, P.-A.; Mermod, N. Automated microfluidic sorting of mammalian cells labeled with magnetic microparticles for those that efficiently express and secrete a protein of interest. Biotechnol. Bioeng. 2017, 114, 1791–1802. [Google Scholar] [CrossRef] [PubMed]
- Lee, T.Y.; Hyun, K.-A.; Kim, S.-I.; Jung, H.-I. An integrated microfluidic chip for one-step isolation of circulating tumor cells. Sens. Actuators B Chem. 2017, 238, 1144–1150. [Google Scholar] [CrossRef]
- Bhagwat, N.; Dulmage, K.; Pletcher, C.H.; Wang, L.; DeMuth, W.; Sen, M.; Balli, D.; Yee, S.S.; Sa, S.; Tong, F.; et al. An integrated flow cytometry-based platform for isolation and molecular characterization of circulating tumor single cells and clusters. Sci. Rep. 2018, 8, 5035. [Google Scholar] [CrossRef] [PubMed]
- Green, B.J.; Kermanshah, L.; Labib, M.; Ahmed, S.U.; Silva, P.N.; Mahmoudian, L.; Chang, I.H.; Mohamadi, R.M.; Rocheleau, J.V.; Kelley, S.O. Isolation of Phenotypically Distinct Cancer Cells Using Nanoparticle-Mediated Sorting. ACS Appl. Mater. Interfaces 2017, 9, 20435–20443. [Google Scholar] [CrossRef] [PubMed]
- Dettke, M.; Leitner, G.; Kopp, C.W.; Chen, Y.; Gyöngyösi, M.; Lang, I. Processing of autologous bone marrow cells by apheresis technology for cell-based cardiovascular regeneration. Cytotherapy 2012, 14, 1005–1010. [Google Scholar] [CrossRef] [PubMed]
- Luten, M.; Roerdinkholder-Stoelwinder, B.; Schaap, N.P.M.; de Grip, W.J.; Bos, H.J.; Bosman, G. Survival of red blood cells after transfusion: A comparison between red cells concentrates of different storage periods. Transfusion 2008, 48, 1478–1485. [Google Scholar] [CrossRef]
- Hod, E.A.; Zhang, N.; Sokol, S.A.; Wojczyk, B.S.; Francis, R.O.; Ansaldi, D.; Francis, K.P.; Della-Latta, P.; Whittier, S.; Sheth, S.; et al. Transfusion of red blood cells after prolonged storage produces harmful effects that are mediated by iron and inflammation. Blood 2010, 115, 4284–4292. [Google Scholar] [CrossRef]
- Melville, D.; Paul, F.; Roath, S. Direct magnetic separation of red cells from whole blood. Nature 1975, 255, 706. [Google Scholar] [CrossRef]
- Owen, C.S. High gradient magnetic separation of erythrocytes. Biophys. J. 1978, 22, 171–178. [Google Scholar] [CrossRef]
- Takayasu, M.; Duske, N.; Ash, S.; Friedlaender, F. HGMS studies of blood cell behavior in plasma. IEEE Trans. Magn. 1982, 18, 1520–1522. [Google Scholar] [CrossRef]
- Han, K.-H.; Frazier, A.B. Continuous magnetophoretic separation of blood cells in microdevice format. J. Appl. Phys. 2004, 96, 5797–5802. [Google Scholar] [CrossRef]
- Qu, B.-Y.; Wu, Z.-Y.; Fang, F.; Bai, Z.-M.; Yang, D.-Z.; Xu, S.-K. A glass microfluidic chip for continuous blood cell sorting by a magnetic gradient without labeling. Anal. Bioanal. Chem. 2008, 392, 1317. [Google Scholar] [CrossRef] [PubMed]
- Moore, L.R.; Nehl, F.; Dorn, J.; Chalmers, J.J.; Zborowski, M. Open Gradient Magnetic Red Blood Cell Sorter Evaluation on Model Cell Mixtures. IEEE Trans. Magn. 2013, 49, 309–315. [Google Scholar] [CrossRef] [PubMed][Green Version]
- Sun, J.; Moore, L.; Xue, W.; Kim, J.; Zborowski, M.; Chalmers, J.J. Correlation of simulation/finite element analysis to the separation of intrinsically magnetic spores and red blood cells using a microfluidic magnetic deposition system. Biotechnol. Bioeng. 2018, 115, 1288–1300. [Google Scholar] [CrossRef]
- Hackett, S.; Hamzah, J.; Davis, T.M.E.; St Pierre, T.G. Magnetic susceptibility of iron in malaria-infected red blood cells. Biochim. Biophys. Acta 2009, 1792, 93–99. [Google Scholar] [CrossRef]
- Inyushin, M.; Kucheryavih, Y.; Kucheryavih, L.; Rojas, L.; Khmelinskii, I.; Makarov, V. Superparamagnetic Properties of Hemozoin. Sci. Rep. 2016, 6, 9. [Google Scholar] [CrossRef]
- Paul, F.; Roath, S.; Melville, D.; Warhurst, D.C.; Osisanya, J.O.S. Separation of Malaria-Infected Erythrocytes from Whole Blood: Use of a Selective High-Gradient Magnetic Separation Technique. The Lancet 1981, 318, 70–71. [Google Scholar] [CrossRef]
- Moore, L.R.; Fujioka, H.; Williams, P.S.; Chalmers, J.J.; Grimberg, B.; Zimmerman, P.A.; Zborowski, M. Hemoglobin degradation in malaria-infected erythrocytes determined from live cell magnetophoresis. FASEB J. 2006, 20, 747–749. [Google Scholar] [CrossRef] [PubMed]
- Nam, J.; Huang, H.; Lim, H.; Lim, C.; Shin, S. Magnetic Separation of Malaria-Infected Red Blood Cells in Various Developmental Stages. Anal. Chem. 2013, 85, 7316–7323. [Google Scholar] [CrossRef] [PubMed]
- Kim, J.; Kim, C.N. Evaluation of optimization algorithms for the design of a magnetic cell separator for malaria-infected blood. J. Mech. Sci. Technol. 2015, 29, 4833–4839. [Google Scholar] [CrossRef]
- Wu, W.T.; Martin, A.B.; Gandini, A.; Aubry, N.; Massoudi, M.; Antaki, J.F. Design of microfluidic channels for magnetic separation of malaria-infected red blood cells. Microfluid. Nanofluid. 2016, 20, 11. [Google Scholar] [CrossRef]
- Vyas, S.; Genis, V.; Friedman, G. Computational study of a magnetic design to improve the diagnosis of malaria: 2D model. J. Magn. Magn. Mater. 2017, 423, 301–305. [Google Scholar] [CrossRef]
- Blue Martin, A.; Wu, W.-T.; Kameneva, M.V.; Antaki, J.F. Development of a High-Throughput Magnetic Separation Device for Malaria-Infected Erythrocytes. Ann. Biomed. Eng. 2017, 45, 2888–2898. [Google Scholar] [CrossRef] [PubMed]
- Kasetsirikul, S.; Buranapong, J.; Srituravanich, W.; Kaewthamasorn, M.; Pimpin, A. The development of malaria diagnostic techniques: A review of the approaches with focus on dielectrophoretic and magnetophoretic methods. Malar. J. 2016, 15, 14. [Google Scholar] [CrossRef]
- Alix-Panabières, C.; Pantel, K. Challenges in circulating tumour cell research. Nat. Rev. Cancer 2014, 14, 623. [Google Scholar] [CrossRef]
- Vermesh, O.; Aalipour, A.; Ge, T.J.; Saenz, Y.; Guo, Y.; Alam, I.S.; Park, S.-m.; Adelson, C.N.; Mitsutake, Y.; Vilches-Moure, J.; et al. An intravascular magnetic wire for the high-throughput retrieval of circulating tumour cells in vivo. Nat. Biomed. Eng. 2018, 2, 696–705. [Google Scholar] [CrossRef]
- Huang, S.; He, Y.-Q.; Jiao, F. Advances of Particles/Cells Magnetic Manipulation in Microfluidic Chips. Chin. J. Anal. Chem. 2017, 45, 1238–1246. [Google Scholar] [CrossRef]
- Munaz, A.; Shiddiky, M.J.A.; Nguyen, N.-T. Recent advances and current challenges in magnetophoresis based micro magnetofluidics. Biomicrofluidics 2018, 12, 031501. [Google Scholar] [CrossRef]
- Pezzi, H.M.; Niles, D.J.; Schehr, J.L.; Beebe, D.J.; Lang, J.M. Integration of Magnetic Bead-Based Cell Selection into Complex Isolations. ACS Omega 2018, 3, 3908–3917. [Google Scholar] [CrossRef]
- Gossett, D.R.; Weaver, W.M.; Mach, A.J.; Hur, S.C.; Tse, H.T.K.; Lee, W.; Amini, H.; Di Carlo, D. Label-free cell separation and sorting in microfluidic systems. Anal. Bioanal. Chem. 2010, 397, 3249–3267. [Google Scholar] [CrossRef] [PubMed]
- Hultström, J.; Manneberg, O.; Dopf, K.; Hertz, H.M.; Brismar, H.; Wiklund, M. Proliferation and viability of adherent cells manipulated by standing-wave ultrasound in a microfluidic chip. Ultrasound Med. Biol. 2007, 33, 145–151. [Google Scholar] [CrossRef] [PubMed]
- Laurell, T.; Petersson, F.; Nilsson, A. Chip integrated strategies for acoustic separation and manipulation of cells and particles. Chem. Soc. Rev. 2007, 36, 492–506. [Google Scholar] [CrossRef] [PubMed]
- Cho, S.H.; Chen, C.H.; Tsai, F.S.; Godin, J.M.; Lo, Y.-H. Human mammalian cell sorting using a highly integrated micro-fabricated fluorescence-activated cell sorter (μFACS). Lab Chip 2010, 10, 1567–1573. [Google Scholar] [CrossRef] [PubMed]
- Augustsson, P.; Magnusson, C.; Nordin, M.; Lilja, H.; Laurell, T. Microfluidic, Label-Free Enrichment of Prostate Cancer Cells in Blood Based on Acoustophoresis. Anal. Chem. 2012, 84, 7954–7962. [Google Scholar] [CrossRef] [PubMed]
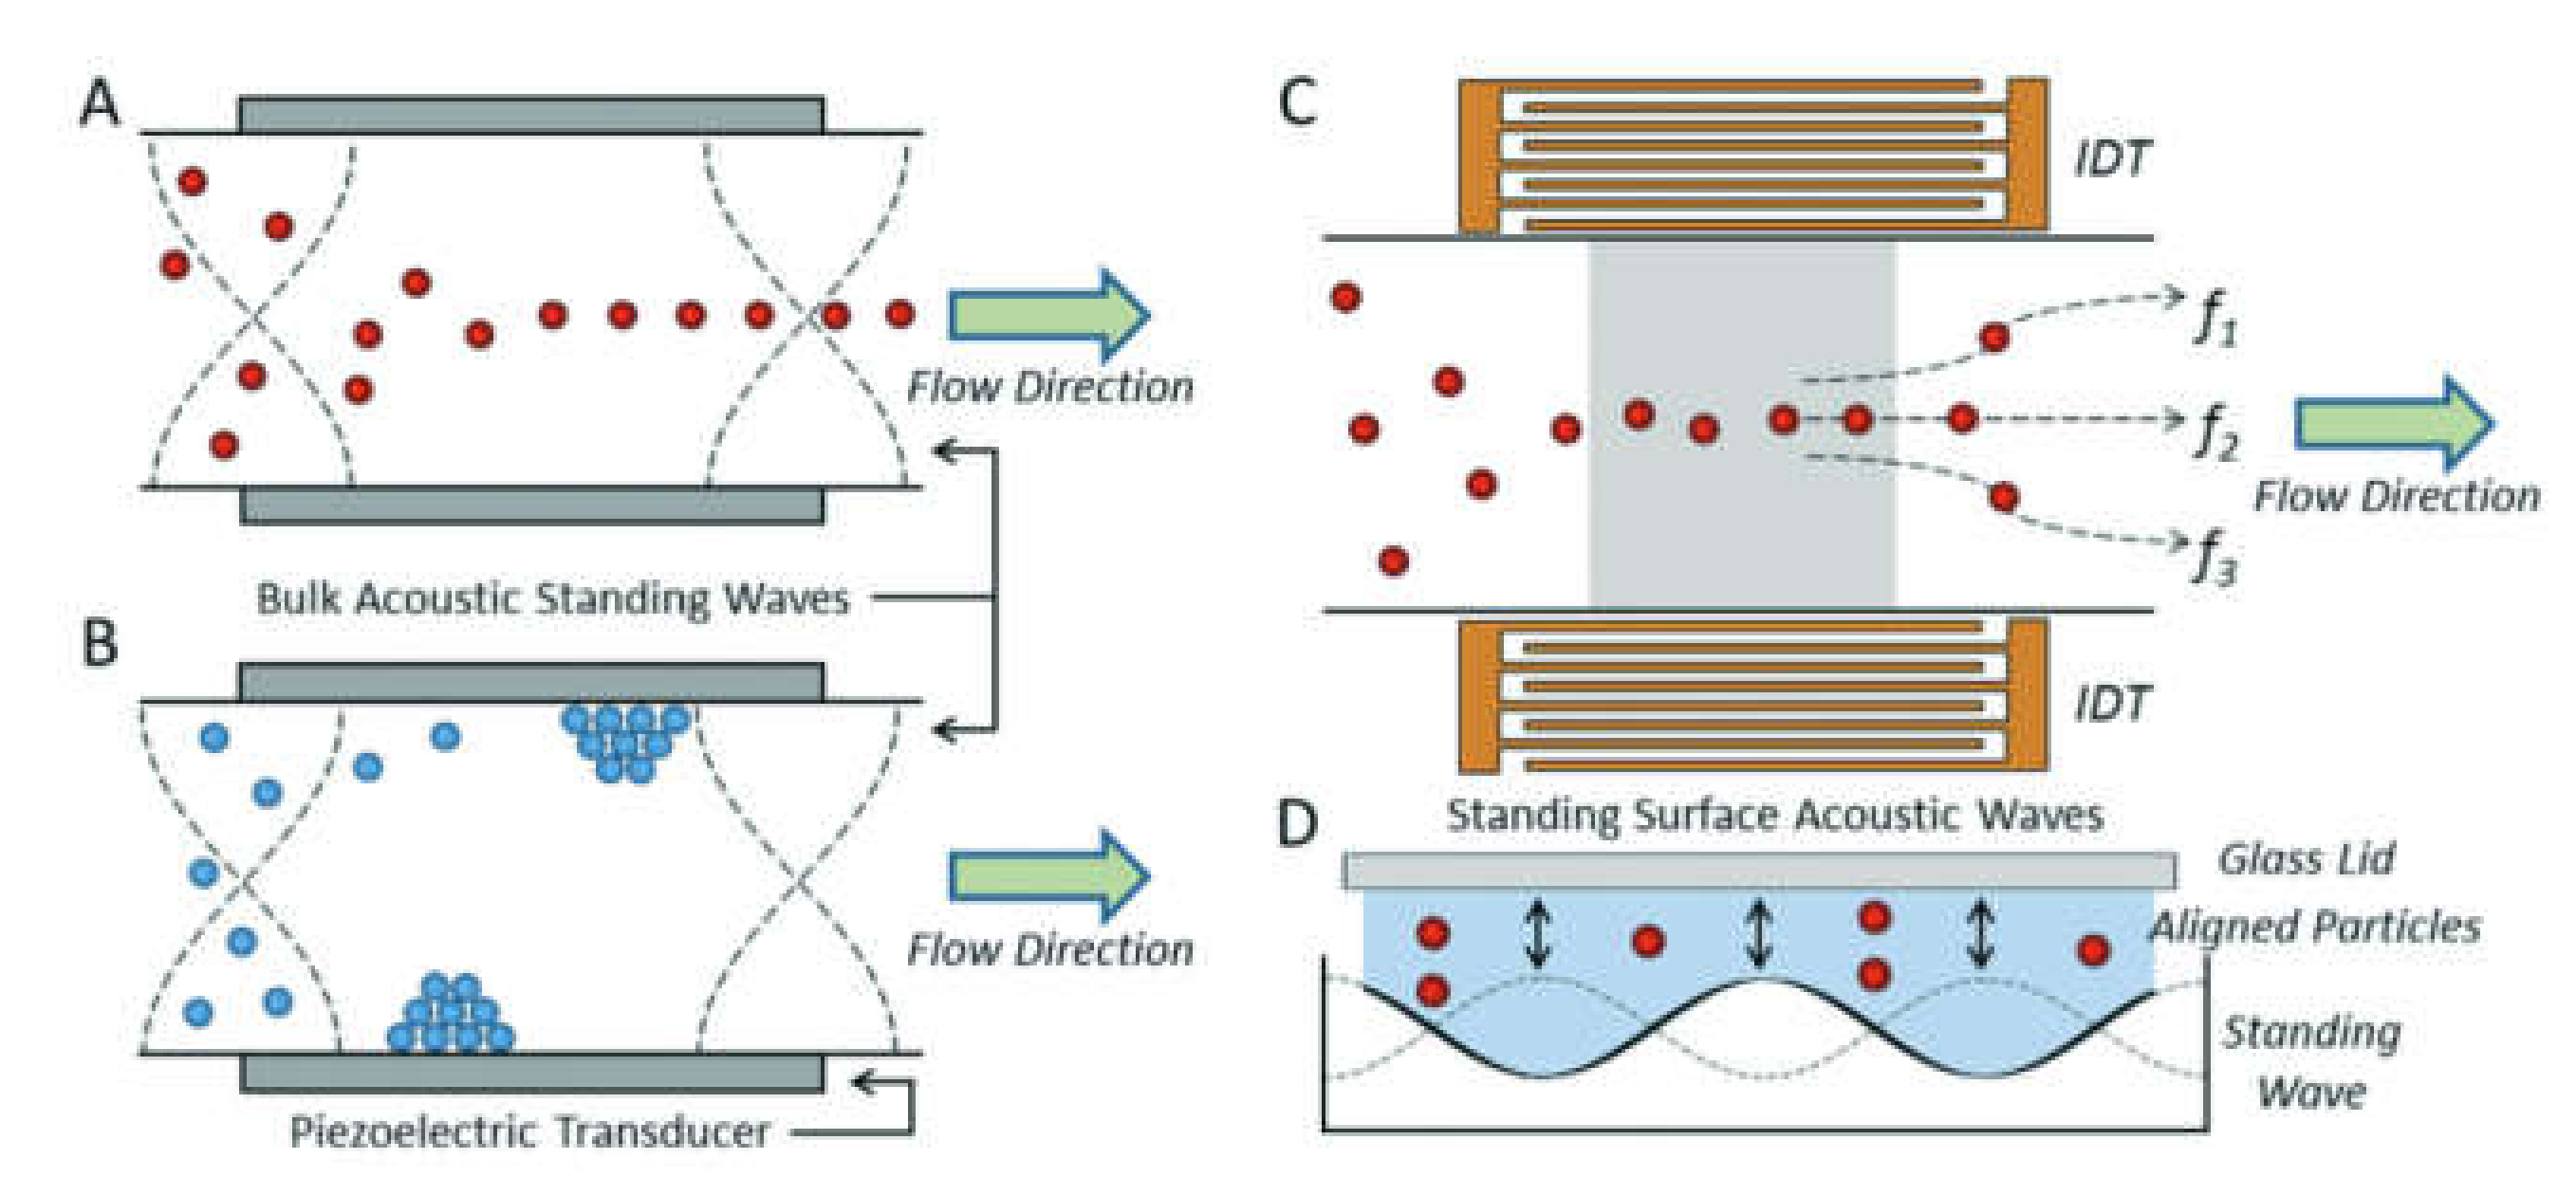
- Ding, X.; Peng, Z.; Lin, S.-C.S.; Geri, M.; Li, S.; Li, P.; Chen, Y.; Dao, M.; Suresh, S.; Huang, T.J. Cell separation using tilted-angle standing surface acoustic waves. Proc. Natl. Acad. Sci. USA 2014, 111, 12992–12997. [Google Scholar] [CrossRef]
- Franke, T.; Braunmüller, S.; Schmid, L.; Wixforth, A.; Weitz, D.A. Surface acoustic wave actuated cell sorting (SAWACS). Lab Chip 2010, 10, 789–794. [Google Scholar] [CrossRef]
- Schmid, L.; Weitz, D.A.; Franke, T. Sorting drops and cells with acoustics: Acoustic microfluidic fluorescence-activated cell sorter. Lab Chip 2014, 14, 3710–3718. [Google Scholar] [CrossRef]
- Petersson, F.; Åberg, L.; Swärd-Nilsson, A.-M.; Laurell, T. Free Flow Acoustophoresis: Microfluidic-Based Mode of Particle and Cell Separation. Anal. Chem. 2007, 79, 5117–5123. [Google Scholar] [CrossRef]
- Dykes, J.; Lenshof, A.; Åstrand-Grundström, I.-B.; Laurell, T.; Scheding, S. Efficient Removal of Platelets from Peripheral Blood Progenitor Cell Products Using a Novel Micro-Chip Based Acoustophoretic Platform. PLoS One 2011, 6, e23074. [Google Scholar] [CrossRef]
- Thévoz, P.; Adams, J.D.; Shea, H.; Bruus, H.; Soh, H.T. Acoustophoretic Synchronization of Mammalian Cells in Microchannels. Anal. Chem. 2010, 82, 3094–3098. [Google Scholar] [CrossRef]
- Yang, A.H.J.; Soh, H.T. Acoustophoretic Sorting of Viable Mammalian Cells in a Microfluidic Device. Anal. Chem. 2012, 84, 10756–10762. [Google Scholar] [CrossRef]
- Johansson, L.; Nikolajeff, F.; Johansson, S.; Thorslund, S. On-Chip Fluorescence-Activated Cell Sorting by an Integrated Miniaturized Ultrasonic Transducer. Anal. Chem. 2009, 81, 5188–5196. [Google Scholar] [CrossRef] [PubMed]
- Petersson, F.; Nilsson, A.; Holm, C.; Jönsson, H.; Laurell, T. Separation of lipids from blood utilizing ultrasonic standing waves in microfluidic channels. Analyst 2004, 129, 938–943. [Google Scholar] [CrossRef] [PubMed]
- Hammarström, B.; Laurell, T.; Nilsson, J. Seed particle-enabled acoustic trapping of bacteria and nanoparticles in continuous flow systems. Lab Chip 2012, 12, 4296–4304. [Google Scholar] [CrossRef] [PubMed]
- Lin, S.-C.S.; Mao, X.; Huang, T.J. Surface acoustic wave (SAW) acoustophoresis: now and beyond. Lab Chip 2012, 12, 2766–2770. [Google Scholar] [CrossRef]
- Ding, X.; Lin, S.-C.S.; Lapsley, M.I.; Li, S.; Guo, X.; Chan, C.Y.; Chiang, I.K.; Wang, L.; McCoy, J.P.; Huang, T.J. Standing surface acoustic wave (SSAW) based multichannel cell sorting. Lab Chip 2012, 12, 4228–4231. [Google Scholar] [CrossRef]
- Nam, J.; Lim, H.; Kim, D.; Shin, S. Separation of platelets from whole blood using standing surface acoustic waves in a microchannel. Lab Chip 2011, 11, 3361–3364. [Google Scholar] [CrossRef]
- Wu, Y.; Stewart, A.G.; Lee, P.V.S. On-chip cell mechanophenotyping using phase modulated surface acoustic wave. Biomicrofluidics 2019, 13, 024107. [Google Scholar] [CrossRef]
- Li, S.; Ding, X.; Mao, Z.; Chen, Y.; Nama, N.; Guo, F.; Li, P.; Wang, L.; Cameron, C.E.; Huang, T.J. Standing surface acoustic wave (SSAW)-based cell washing. Lab Chip 2015, 15, 331–338. [Google Scholar] [CrossRef]
- Wang, K.; Zhou, W.; Lin, Z.; Cai, F.; Li, F.; Wu, J.; Meng, L.; Niu, L.; Zheng, H. Sorting of tumour cells in a microfluidic device by multi-stage surface acoustic waves. Sens. Actuators B Chem. 2018, 258, 1174–1183. [Google Scholar] [CrossRef]
- Sollier, E.; Rostaing, H.; Pouteau, P.; Fouillet, Y.; Achard, J.-L. Passive microfluidic devices for plasma extraction from whole human blood. Sens. Actuators B Chem. 2009, 141, 617–624. [Google Scholar] [CrossRef]
- Tsutsui, H.; Ho, C.-M. Cell separation by non-inertial force fields in microfluidic systems. Mech. Res. Commun. 2009, 36, 92–103. [Google Scholar] [CrossRef] [PubMed]
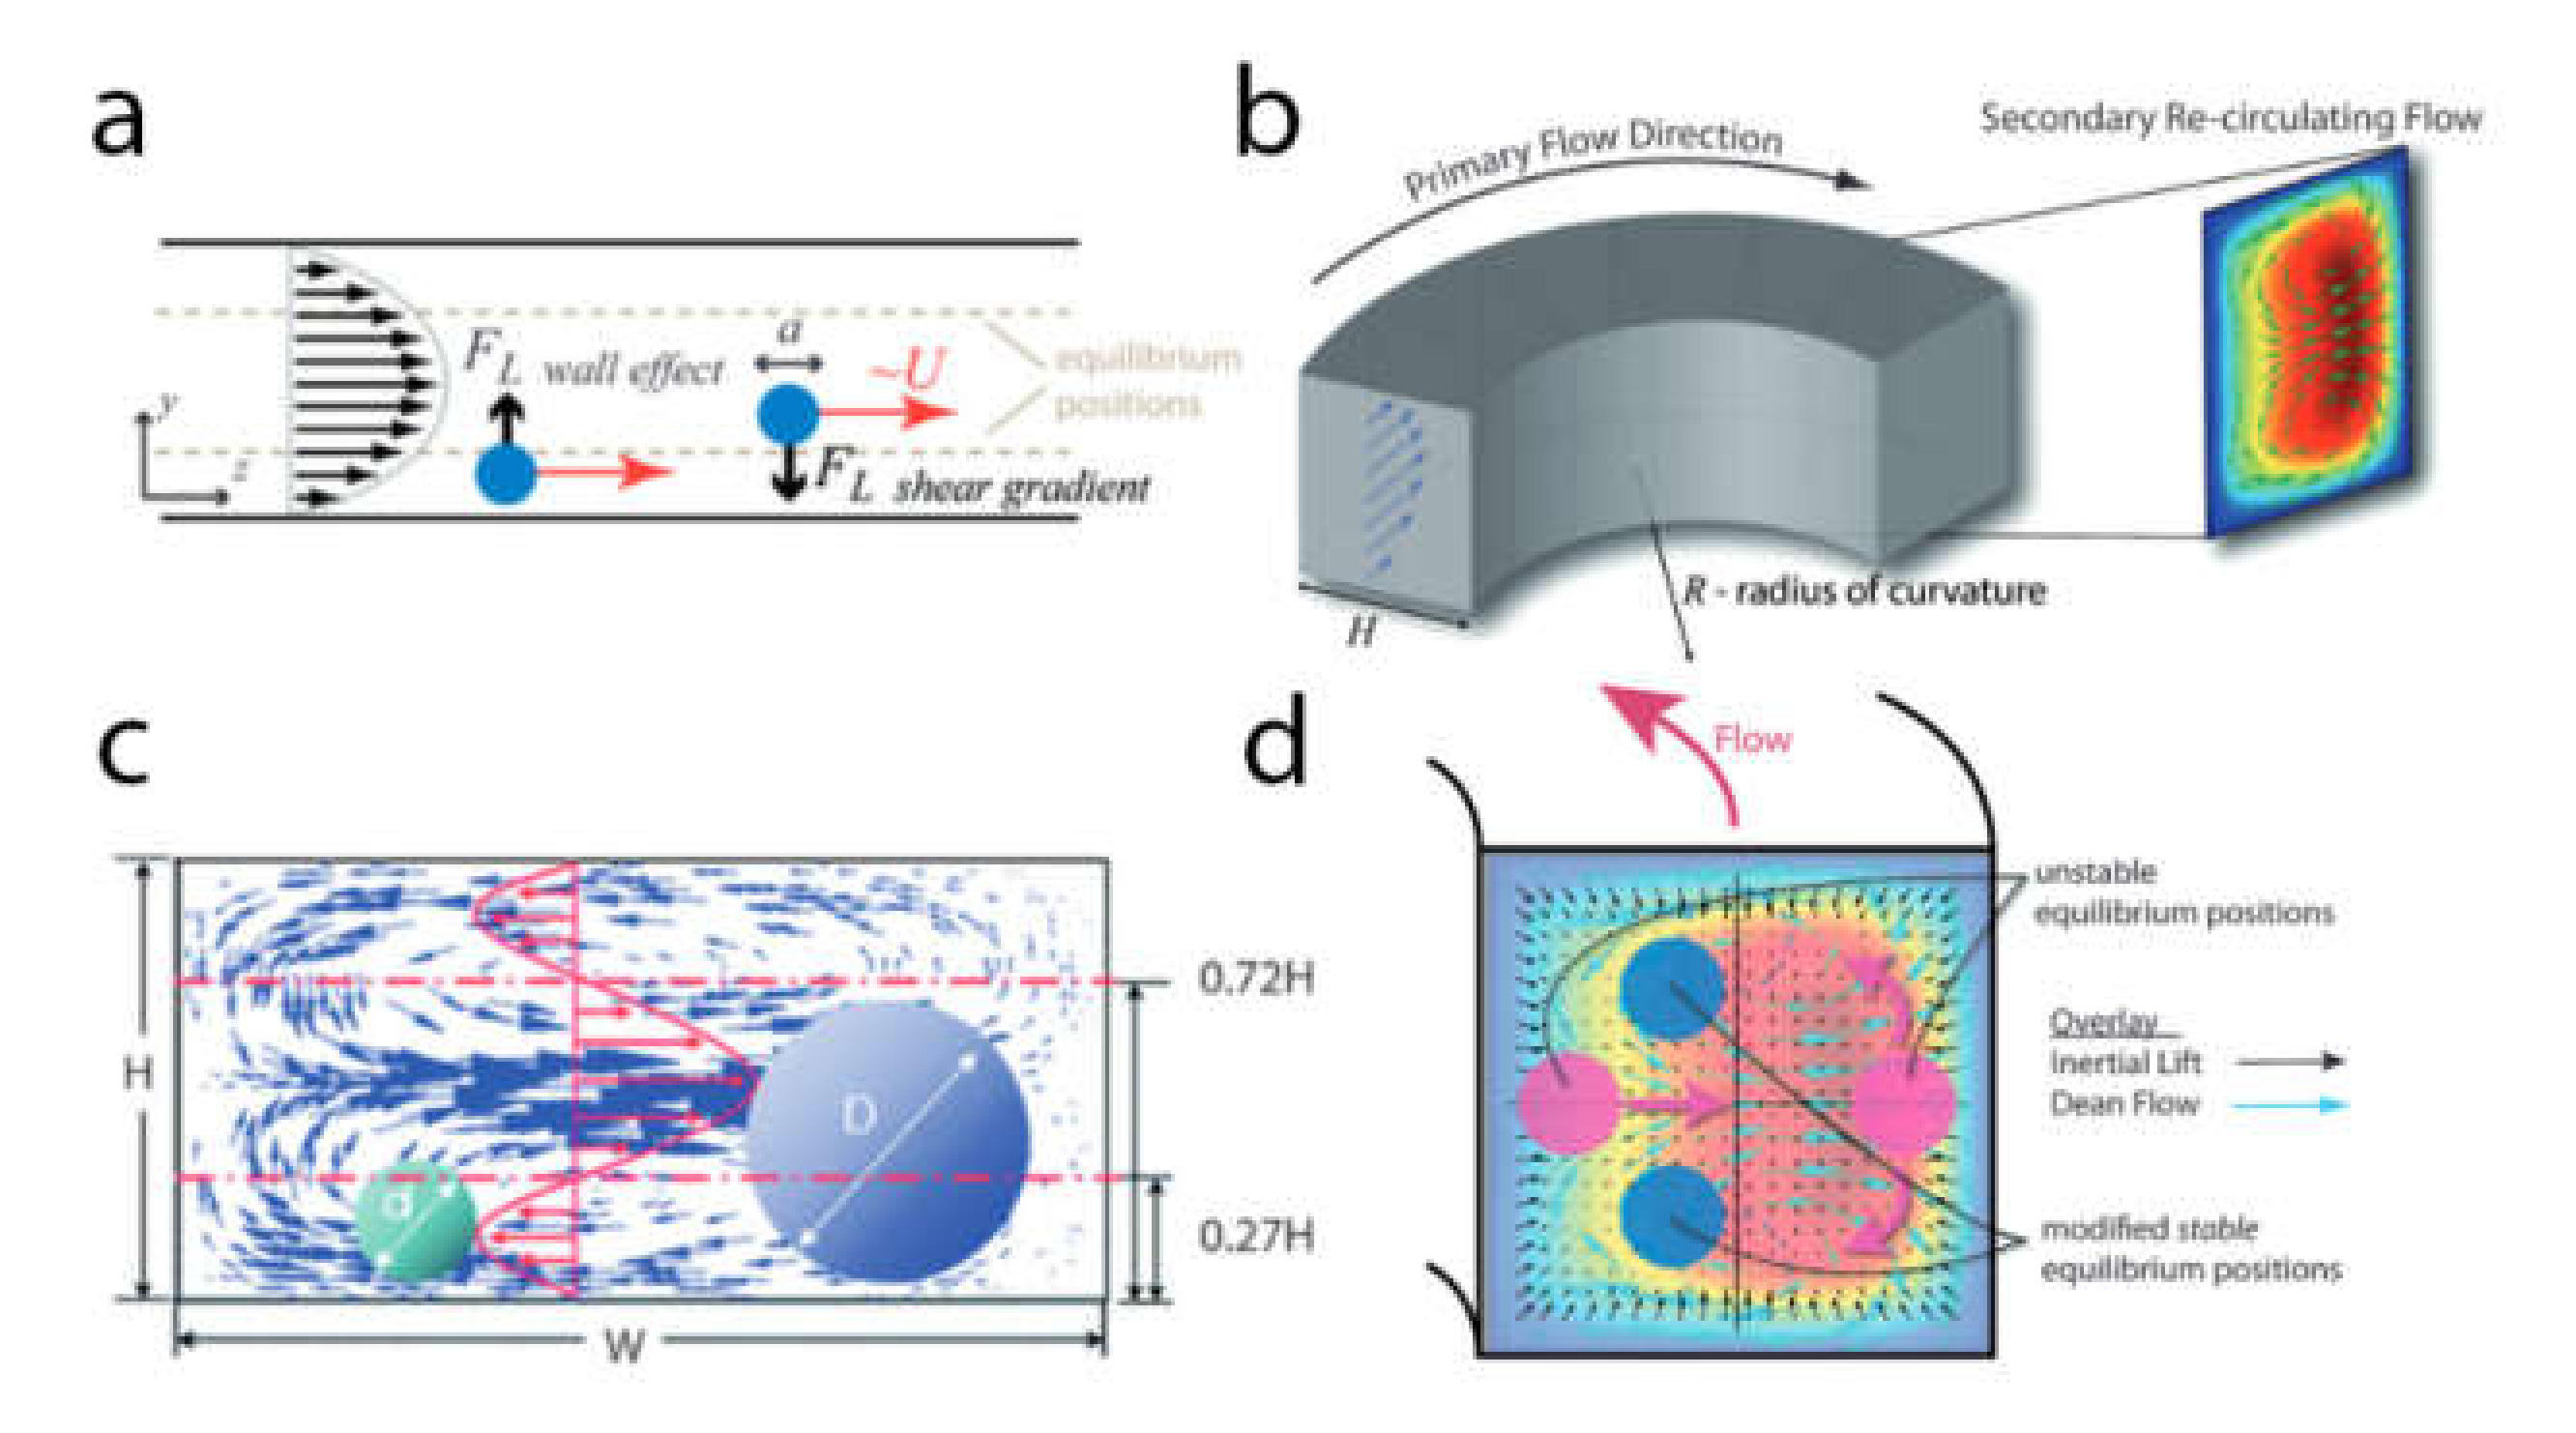
- Di Carlo, D. Inertial microfluidics. Lab Chip 2009, 9, 3038–3046. [Google Scholar] [CrossRef]
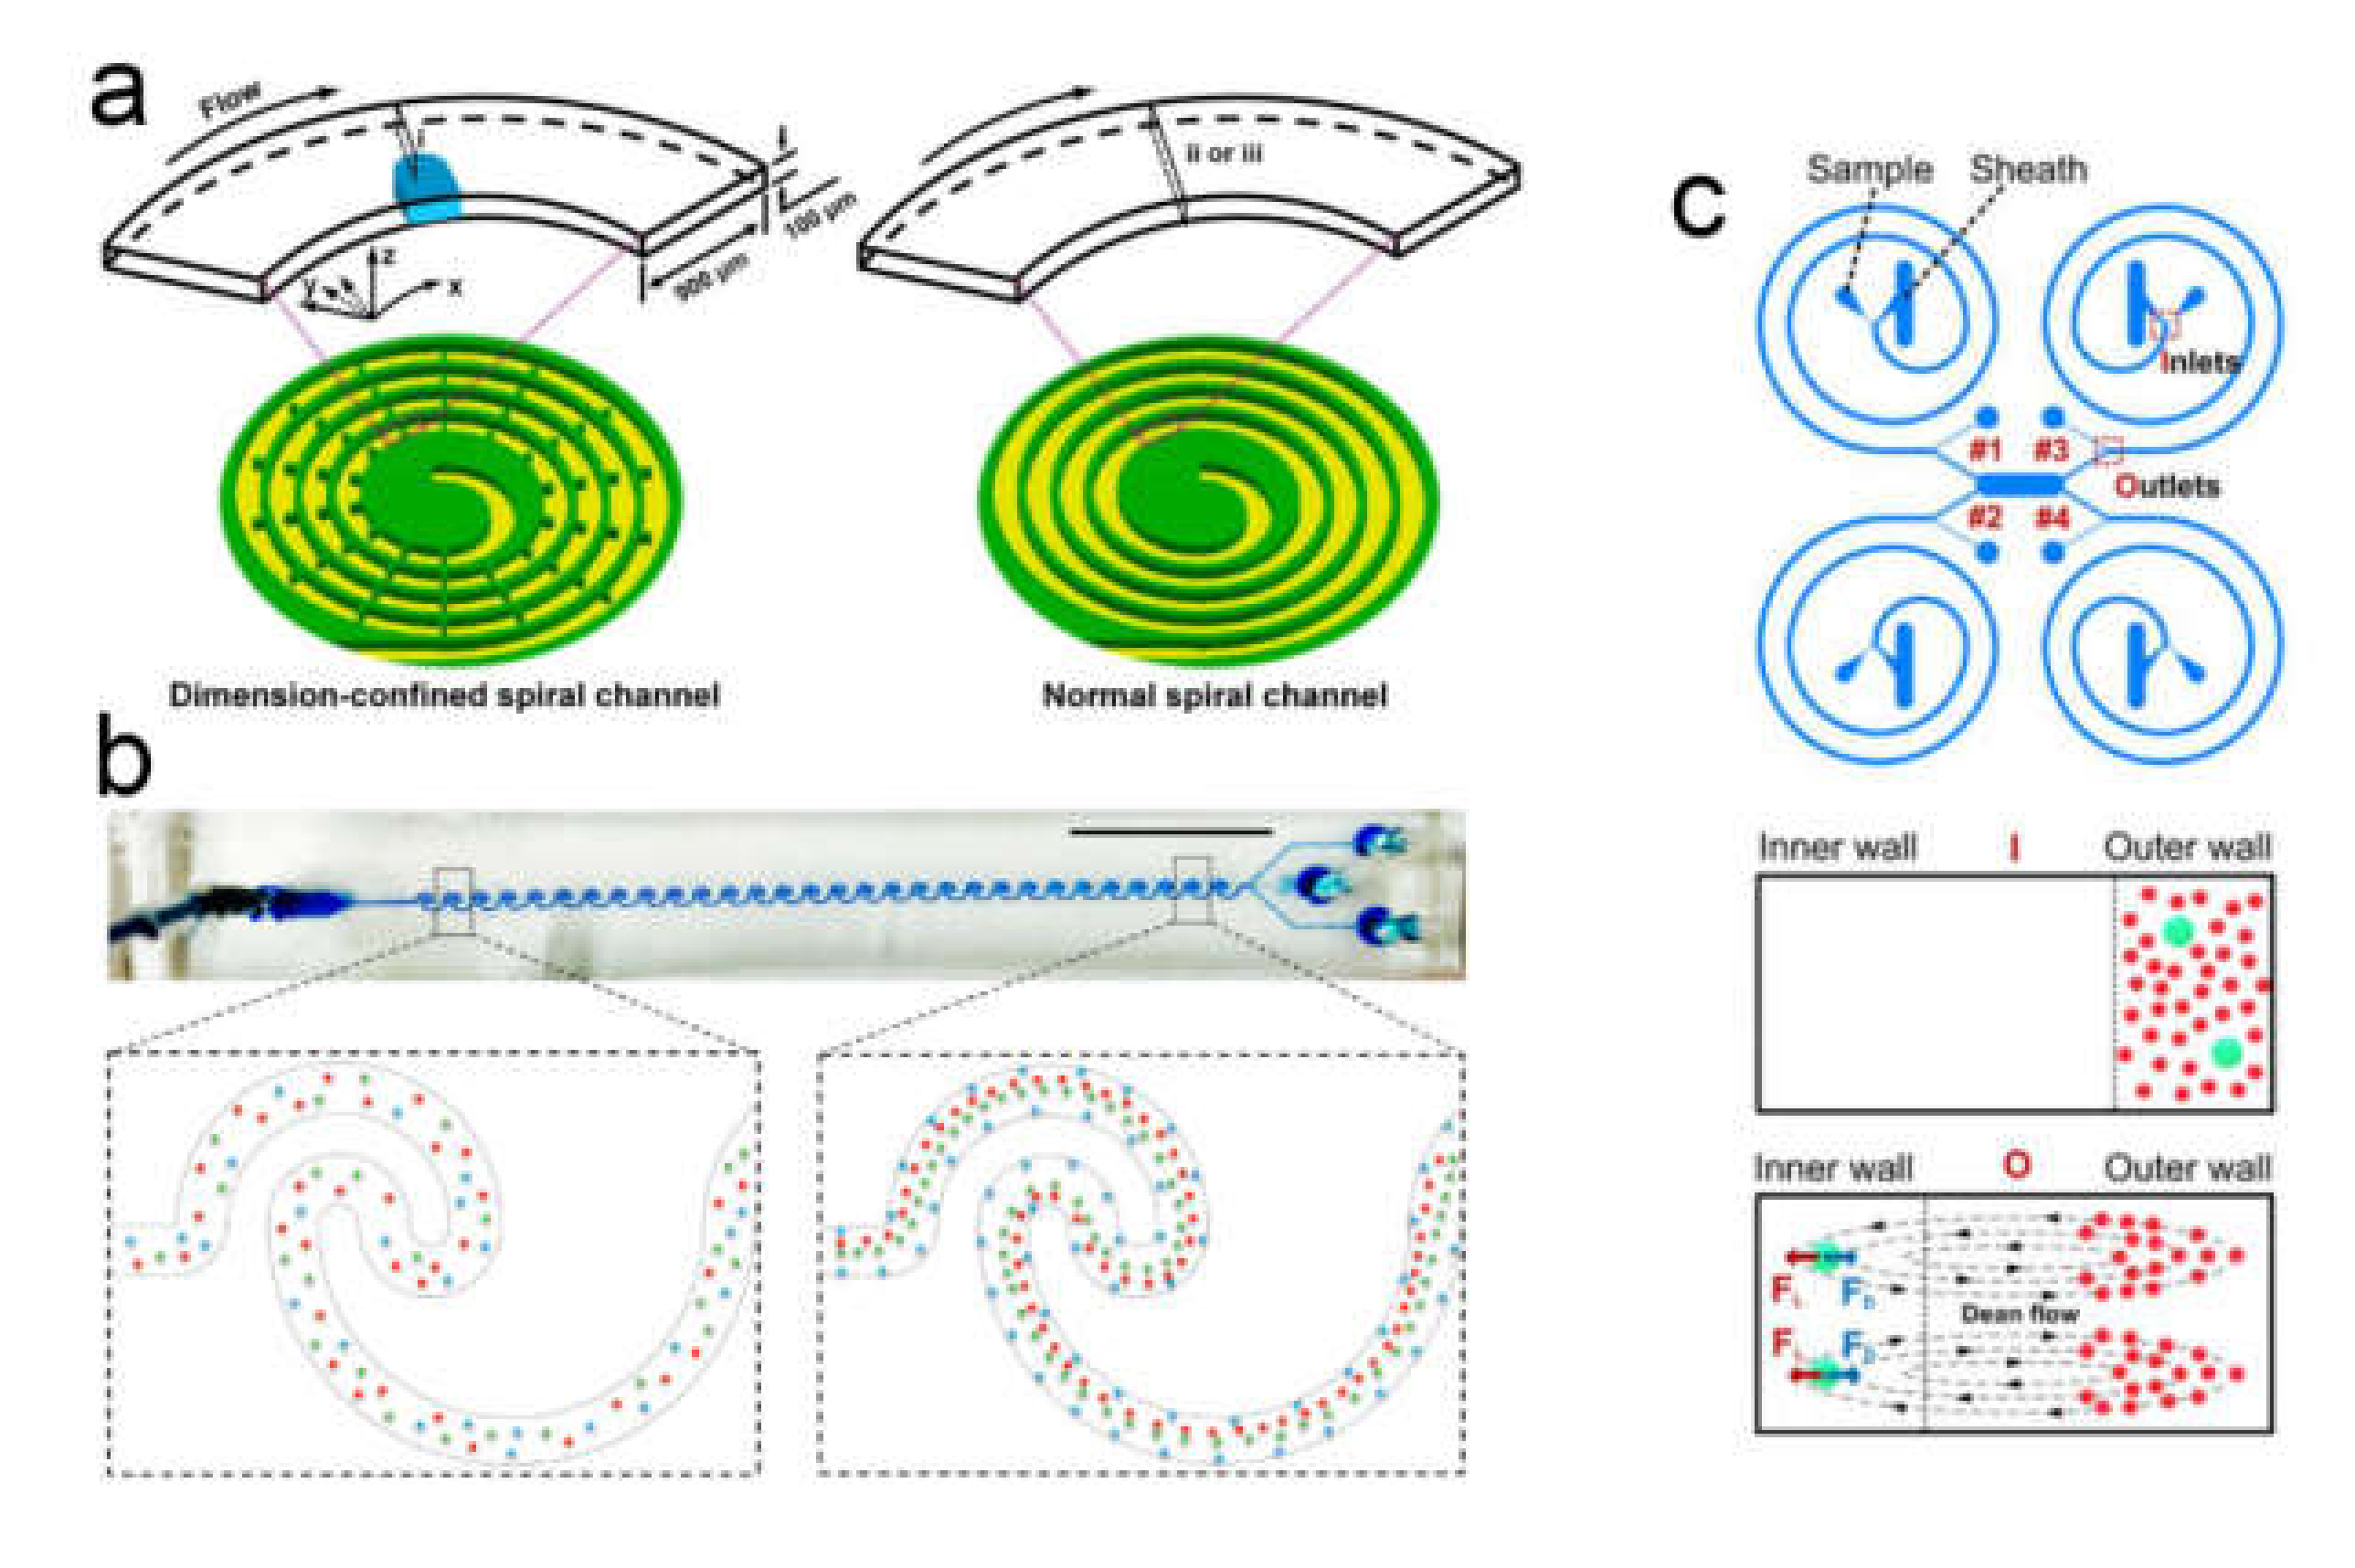
- Kuntaegowdanahalli, S.S.; Bhagat, A.A.S.; Kumar, G.; Papautsky, I. Inertial microfluidics for continuous particle separation in spiral microchannels. Lab Chip 2009, 9, 2973–2980. [Google Scholar] [CrossRef]
- Nathamgari, S.S.P.; Dong, B.; Zhou, F.; Kang, W.; Giraldo-Vela, J.P.; McGuire, T.; McNaughton, R.L.; Sun, C.; Kessler, J.A.; Espinosa, H.D. Isolating single cells in a neurosphere assay using inertial microfluidics. Lab Chip 2015, 15, 4591–4597. [Google Scholar] [CrossRef]
- Son, J.; Murphy, K.; Samuel, R.; Gale, B.K.; Carrell, D.T.; Hotaling, J.M. Non-motile sperm cell separation using a spiral channel. Anal. Methods 2015, 7, 8041–8047. [Google Scholar] [CrossRef]
- Son, J.; Samuel, R.; Gale, B.K.; Carrell, D.T.; Hotaling, J.M. Separation of sperm cells from samples containing high concentrations of white blood cells using a spiral channel. Biomicrofluidics 2017, 11, 054106. [Google Scholar] [CrossRef]
- Schaap, A.; Dumon, J.; Toonder, J.d. Sorting algal cells by morphology in spiral microchannels using inertial microfluidics. Microfluid. Nanofluid. 2016, 20, 125. [Google Scholar] [CrossRef]
- Lee, L.M.; Rosano, J.M.; Wang, Y.; Klarmann, G.J.; Garson, C.J.; Prabhakarpandian, B.; Pant, K.; Alvarez, L.M.; Lai, E. Label-free mesenchymal stem cell enrichment from bone marrow samples by inertial microfluidics. Anal. Methods 2018, 10, 713–721. [Google Scholar] [CrossRef]
- Shen, S.; Tian, C.; Li, T.; Xu, J.; Chen, S.-W.; Tu, Q.; Yuan, M.-S.; Liu, W.; Wang, J. Spiral microchannel with ordered micro-obstacles for continuous and highly-efficient particle separation. Lab Chip 2017, 17, 3578–3591. [Google Scholar] [CrossRef] [PubMed]
- Nivedita, N.; Garg, N.; Lee, A.P.; Papautsky, I. A high throughput microfluidic platform for size-selective enrichment of cell populations in tissue and blood samples. Analyst 2017, 142, 2558–2569. [Google Scholar] [CrossRef]
- Zhou, Y.; Ma, Z.; Ai, Y. Sheathless inertial cell focusing and sorting with serial reverse wavy channel structures. Microsyst. Nanoeng. 2018, 4, 5. [Google Scholar] [CrossRef] [PubMed]
- Syverud, B.C.; Lin, E.; Nagrath, S.; Larkin, L.M. Label-Free, High-Throughput Purification of Satellite Cells Using Microfluidic Inertial Separation. Tissue Eng. Part C Methods 2018, 24, 32–41. [Google Scholar] [CrossRef] [PubMed]
- Wang, C.; Sun, S.; Chen, Y.; Cheng, Z.; Li, Y.; Jia, L.; Lin, P.; Yang, Z.; Shu, R. Inertial particle focusing and spacing control in microfluidic devices. Microfluid. Nanofluid. 2018, 22, 25. [Google Scholar] [CrossRef]
- Zhang, X.; Zhu, Z.; Xiang, N.; Long, F.; Ni, Z. Automated Microfluidic Instrument for Label-Free and High-Throughput Cell Separation. Anal. Chem. 2018, 90, 4212–4220. [Google Scholar] [CrossRef]
- Moloudi, R.; Oh, S.; Yang, C.; Ebrahimi Warkiani, M.; Naing, M.W. Inertial particle focusing dynamics in a trapezoidal straight microchannel: Application to particle filtration. Microfluid. Nanofluid. 2018, 22, 33. [Google Scholar] [CrossRef]
- Mutlu, B.R.; Edd, J.F.; Toner, M. Oscillatory inertial focusing in infinite microchannels. Proc. Natl. Acad. Sci. USA 2018, 115, 7682–7687. [Google Scholar] [CrossRef]
- McGrath, J.; Jimenez, M.; Bridle, H. Deterministic lateral displacement for particle separation: A review. Lab Chip 2014, 14, 4139–4158. [Google Scholar] [CrossRef]
- Inglis, D.W.; Davis, J.A.; Austin, R.H.; Sturm, J.C. Critical particle size for fractionation by deterministic lateral displacement. Lab Chip 2006, 6, 655–658. [Google Scholar] [CrossRef]
- Huang, L.R.; Cox, E.C.; Austin, R.H.; Sturm, J.C. Continuous Particle Separation Through Deterministic Lateral Displacement. Science 2004, 304, 987–990. [Google Scholar] [CrossRef] [PubMed]
- Davis, J.A.; Inglis, D.W.; Morton, K.J.; Lawrence, D.A.; Huang, L.R.; Chou, S.Y.; Sturm, J.C.; Austin, R.H. Deterministic hydrodynamics: Taking blood apart. Proc. Natl. Acad. Sci. USA 2006, 103, 14779–14784. [Google Scholar] [CrossRef] [PubMed]
- Inglis, D.W.; Davis, J.A.; Zieziulewicz, T.J.; Lawrence, D.A.; Austin, R.H.; Sturm, J.C. Determining blood cell size using microfluidic hydrodynamics. J. Immunol. Methods 2008, 329, 151–156. [Google Scholar] [CrossRef] [PubMed]
- Huang, R.; Barber, T.A.; Schmidt, M.A.; Tompkins, R.G.; Toner, M.; Bianchi, D.W.; Kapur, R.; Flejter, W.L. A microfluidics approach for the isolation of nucleated red blood cells (NRBCs) from the peripheral blood of pregnant women. Prenat. Diagn. 2008, 28, 892–899. [Google Scholar] [CrossRef] [PubMed]
- Holm, S.H.; Beech, J.P.; Barrett, M.P.; Tegenfeldt, J.O. Separation of parasites from human blood using deterministic lateral displacement. Lab Chip 2011, 11, 1326–1332. [Google Scholar] [CrossRef] [PubMed]
- Zhang, B.; Green, J.V.; Murthy, S.K.; Radisic, M. Label-Free Enrichment of Functional Cardiomyocytes Using Microfluidic Deterministic Lateral Flow Displacement. PLoS One 2012, 7, e37619. [Google Scholar] [CrossRef] [PubMed]
- Liu, Z.; Huang, F.; Du, J.; Shu, W.; Feng, H.; Xu, X.; Chen, Y. Rapid isolation of cancer cells using microfluidic deterministic lateral displacement structure. Biomicrofluidics 2013, 7, 011801. [Google Scholar] [CrossRef]
- Liu, Z.; Zhang, W.; Huang, F.; Feng, H.; Shu, W.; Xu, X.; Chen, Y. High throughput capture of circulating tumor cells using an integrated microfluidic system. Biosens. Bioelectron. 2013, 47, 113–119. [Google Scholar] [CrossRef]
- Loutherback, K.; D’Silva, J.; Liu, L.; Wu, A.; Austin, R.H.; Sturm, J.C. Deterministic separation of cancer cells from blood at 10 mL/min. AIP Advances 2012, 2, 042107. [Google Scholar] [CrossRef]
- D’Silva, J.; Austin, R.H.; Sturm, J.C. Inhibition of clot formation in deterministic lateral displacement arrays for processing large volumes of blood for rare cell capture. Lab Chip 2015, 15, 2240–2247. [Google Scholar] [CrossRef]
- Mehendale, N.; Sharma, O.; D’Costa, C.; Paul, D. A Radial Pillar Device (RAPID) for continuous and high-throughput separation of multi-sized particles. Biomed. Microdevices 2017, 20, 6. [Google Scholar] [CrossRef] [PubMed]
- Mehendale, N.; Sharma, O.; Pandey, S.; Paul, D. Clogging-free continuous operation with whole blood in a radial pillar device (RAPID). Biomed. Microdevices 2018, 20, 75. [Google Scholar] [CrossRef] [PubMed]
- Dincau, B.M.; Aghilinejad, A.; Hammersley, T.; Chen, X.; Kim, J.-H. Deterministic lateral displacement (DLD) in the high Reynolds number regime: high-throughput and dynamic separation characteristics. Microfluid. Nanofluid. 2018, 22, 59. [Google Scholar] [CrossRef]
- Dincau, B.M.; Aghilinejad, A.; Chen, X.; Moon, S.Y.; Kim, J.-H. Vortex-free high-Reynolds deterministic lateral displacement (DLD) via airfoil pillars. Microfluid. Nanofluid. 2018, 22, 137. [Google Scholar] [CrossRef]
- Behdani, B.; Monjezi, S.; Carey, M.J.; Weldon, C.G.; Zhang, J.; Wang, C.; Park, J. Shape-based separation of micro-/nanoparticles in liquid phases. Biomicrofluidics 2018, 12, 051503. [Google Scholar] [CrossRef]
- Beech, J.P.; Holm, S.H.; Adolfsson, K.; Tegenfeldt, J.O. Sorting cells by size, shape and deformability. Lab Chip 2012, 12, 1048–1051. [Google Scholar] [CrossRef]
- Kabacaoğlu, G.; Biros, G. Sorting same-size red blood cells in deep deterministic lateral displacement devices. J. Fluid Mech. 2018, 859, 433–475. [Google Scholar] [CrossRef]
- Zeming, K.K.; Ranjan, S.; Zhang, Y. Rotational separation of non-spherical bioparticles using I-shaped pillar arrays in a microfluidic device. Nat. Commun. 2013, 4, 1625. [Google Scholar] [CrossRef]
- Au, S.H.; Edd, J.; Stoddard, A.E.; Wong, K.H.K.; Fachin, F.; Maheswaran, S.; Haber, D.A.; Stott, S.L.; Kapur, R.; Toner, M. Microfluidic Isolation of Circulating Tumor Cell Clusters by Size and Asymmetry. Sci. Rep. 2017, 7, 2433. [Google Scholar] [CrossRef]
- Wunsch, B.H.; Smith, J.T.; Gifford, S.M.; Wang, C.; Brink, M.; Bruce, R.L.; Austin, R.H.; Stolovitzky, G.; Astier, Y. Nanoscale lateral displacement arrays for the separation of exosomes and colloids down to 20 nm. Nat. Nanotechnol. 2016, 11, 936. [Google Scholar] [CrossRef]
- Song, Y.; Shi, Y.; Huang, M.; Wang, W.; Wang, Y.; Cheng, J.; Lei, Z.; Zhu, Z.; Yang, C. Bioinspired Engineering of a Multivalent Aptamer-Functionalized Nanointerface to Enhance the Capture and Release of Circulating Tumor Cells. Angew. Chem. Int. Ed. 2019, 58, 2236–2240. [Google Scholar] [CrossRef] [PubMed]
- Yamada, M.; Nakashima, M.; Seki, M. Pinched Flow Fractionation: Continuous Size Separation of Particles Utilizing a Laminar Flow Profile in a Pinched Microchannel. Anal. Chem. 2004, 76, 5465–5471. [Google Scholar] [CrossRef] [PubMed]
- Takagi, J.; Yamada, M.; Yasuda, M.; Seki, M. Continuous particle separation in a microchannel having asymmetrically arranged multiple branches. Lab Chip 2005, 5, 778–784. [Google Scholar] [CrossRef] [PubMed]
- Andersen, K.B.; Levinsen, S.; Svendsen, W.E.; Okkels, F. A generalized theoretical model for “continuous particle separation in a microchannel having asymmetrically arranged multiple branches”. Lab Chip 2009, 9, 1638–1639. [Google Scholar] [CrossRef]
- Vig, A.L.; Kristensen, A. Separation enhancement in pinched flow fractionation. Appl. Phys. Lett. 2008, 93, 203507. [Google Scholar] [CrossRef]
- Huh, D.; Bahng, J.H.; Ling, Y.; Wei, H.-H.; Kripfgans, O.D.; Fowlkes, J.B.; Grotberg, J.B.; Takayama, S. Gravity-Driven Microfluidic Particle Sorting Device with Hydrodynamic Separation Amplification. Anal. Chem. 2007, 79, 1369–1376. [Google Scholar] [CrossRef]
- Sai, Y.; Yamada, M.; Yasuda, M.; Seki, M. Continuous separation of particles using a microfluidic device equipped with flow rate control valves. J. Chromatogr. A 2006, 1127, 214–220. [Google Scholar] [CrossRef]
- Jain, A.; Posner, J.D. Particle Dispersion and Separation Resolution of Pinched Flow Fractionation. Anal. Chem. 2008, 80, 1641–1648. [Google Scholar] [CrossRef]
- Srivastav, A.; Podgorski, T.; Coupier, G. Efficiency of size-dependent particle separation by pinched flow fractionation. Microfluid. Nanofluid. 2012, 13, 697–701. [Google Scholar] [CrossRef]
- Cupelli, C.; Borchardt, T.; Steiner, T.; Paust, N.; Zengerle, R.; Santer, M. Leukocyte enrichment based on a modified pinched flow fractionation approach. Microfluid. Nanofluid. 2013, 14, 551–563. [Google Scholar] [CrossRef]
- Pødenphant, M.; Ashley, N.; Koprowska, K.; Mir, K.U.; Zalkovskij, M.; Bilenberg, B.; Bodmer, W.; Kristensen, A.; Marie, R. Separation of cancer cells from white blood cells by pinched flow fractionation. Lab Chip 2015, 15, 4598–4606. [Google Scholar] [CrossRef] [PubMed]
- Morijiri, T.; Sunahiro, S.; Senaha, M.; Yamada, M.; Seki, M. Sedimentation pinched-flow fractionation for size- and density-based particle sorting in microchannels. Microfluid. Nanofluid. 2011, 11, 105–110. [Google Scholar] [CrossRef]
- Lu, X.; Hsu, J.-P.; Xuan, X. Exploiting the Wall-Induced Non-inertial Lift in Electrokinetic Flow for a Continuous Particle Separation by Size. Langmuir 2015, 31, 620–627. [Google Scholar] [CrossRef] [PubMed]
- Lee, K.H.; Kim, S.B.; Lee, K.S.; Sung, H.J. Enhancement by optical force of separation in pinched flow fractionation. Lab Chip 2011, 11, 354–357. [Google Scholar] [CrossRef]
- Khashei, H.; Latifi, H.; Seresht, M.J.; Ghasemi, A.H.B. Microparticles manipulation and enhancement of their separation in pinched flow fractionation by insulator-based dielectrophoresis. Electrophoresis 2016, 37, 775–785. [Google Scholar] [CrossRef]
- Lu, X.; Xuan, X. Inertia-Enhanced Pinched Flow Fractionation. Anal. Chem. 2015, 87, 4560–4565. [Google Scholar] [CrossRef]
- Fulwyler, M.J. Electronic Separation of Biological Cells by Volume. Science 1965, 150, 910–911. [Google Scholar] [CrossRef]
- Li, Y.; Mahjoubfar, A.; Chen, C.L.; Niazi, K.R.; Pei, L.; Jalali, B. Deep Cytometry: Deep learning with Real-time Inference in Cell Sorting and Flow Cytometry. Sci. Rep. 2019, 9, 11088. [Google Scholar] [CrossRef]
- Hennig, H.; Rees, P.; Blasi, T.; Kamentsky, L.; Hung, J.; Dao, D.; Carpenter, A.E.; Filby, A. An open-source solution for advanced imaging flow cytometry data analysis using machine learning. Methods 2017, 112, 201–210. [Google Scholar] [CrossRef]
- Markovic, S.; Li, B.; Pera, V.; Sznaier, M.; Camps, O.; Niedre, M. A computer vision approach to rare cell in vivo fluorescence flow cytometry. Cytom. A 2013, 83, 1113–1123. [Google Scholar] [CrossRef][Green Version]
- Ceccarelli, M.; Speranza, A.; Grimaldi, D.; Lamonaca, F. Automatic Detection and Surface Measurements of Micronucleus by a Computer Vision Approach. IEEE Trans. Instrum. Meas. 2010, 59, 2383–2390. [Google Scholar] [CrossRef]
- Rueden, C.T.; Schindelin, J.; Hiner, M.C.; DeZonia, B.E.; Walter, A.E.; Arena, E.T.; Eliceiri, K.W. ImageJ2: ImageJ for the next generation of scientific image data. BMC Bioinformatics 2017, 18, 529. [Google Scholar] [CrossRef] [PubMed]
- Schneider, C.A.; Rasband, W.S.; Eliceiri, K.W. NIH Image to ImageJ: 25 years of image analysis. Nat. Methods 2012, 9, 671–675. [Google Scholar] [CrossRef] [PubMed]
- McQuin, C.; Goodman, A.; Chernyshev, V.; Kamentsky, L.; Cimini, B.A.; Karhohs, K.W.; Doan, M.; Ding, L.; Rafelski, S.M.; Thirstrup, D.; et al. CellProfiler 3.0: Next-generation image processing for biology. PLoS Biol. 2018, 16, e2005970. [Google Scholar] [CrossRef]
- Kamentsky, L.; Jones, T.R.; Fraser, A.; Bray, M.A.; Logan, D.J.; Madden, K.L.; Ljosa, V.; Rueden, C.; Eliceiri, K.W.; Carpenter, A.E. Improved structure, function and compatibility for CellProfiler: modular high-throughput image analysis software. Bioinformatics 2011, 27, 1179–1180. [Google Scholar] [CrossRef]
- Carpenter, A.E.; Jones, T.R.; Lamprecht, M.R.; Clarke, C.; Kang, I.H.; Friman, O.; Guertin, D.A.; Chang, J.H.; Lindquist, R.A.; Moffat, J.; et al. CellProfiler: image analysis software for identifying and quantifying cell phenotypes. Genome Biol. 2006, 7, R100. [Google Scholar] [CrossRef]
- Lo, K.; Brinkman, R.R.; Gottardo, R. Automated gating of flow cytometry data via robust model-based clustering. Cytom. A 2008, 73A, 321–332. [Google Scholar] [CrossRef]
- Pyne, S.; Hu, X.; Wang, K.; Rossin, E.; Lin, T.-I.; Maier, L.M.; Baecher-Allan, C.; McLachlan, G.J.; Tamayo, P.; Hafler, D.A.; et al. Automated high-dimensional flow cytometric data analysis. Proc. Natl. Acad. Sci. USA 2009, 106, 8519–8524. [Google Scholar] [CrossRef]
- Pyne, S.; Lee, S.X.; Wang, K.; Irish, J.; Tamayo, P.; Nazaire, M.-D.; Duong, T.; Ng, S.-K.; Hafler, D.; Levy, R.; et al. Joint Modeling and Registration of Cell Populations in Cohorts of High-Dimensional Flow Cytometric Data. PLoS One 2014, 9, e100334. [Google Scholar] [CrossRef]
- Cron, A.; Gouttefangeas, C.; Frelinger, J.; Lin, L.; Singh, S.K.; Britten, C.M.; Welters, M.J.P.; van der Burg, S.H.; West, M.; Chan, C. Hierarchical Modeling for Rare Event Detection and Cell Subset Alignment across Flow Cytometry Samples. PLoS Comp. Biol. 2013, 9, e1003130. [Google Scholar] [CrossRef]
- Naim, I.; Datta, S.; Rebhahn, J.; Cavenaugh, J.S.; Mosmann, T.R.; Sharma, G. SWIFT—scalable clustering for automated identification of rare cell populations in large, high-dimensional flow cytometry datasets, Part 1: Algorithm design. Cytom. A 2014, 85, 408–421. [Google Scholar] [CrossRef] [PubMed]
- Weber, L.M.; Robinson, M.D. Comparison of clustering methods for high-dimensional single-cell flow and mass cytometry data. Cytom. A 2016, 89, 1084–1096. [Google Scholar] [CrossRef] [PubMed]
- Sörensen, T.; Baumgart, S.; Durek, P.; Grützkau, A.; Häupl, T. immunoClust—An automated analysis pipeline for the identification of immunophenotypic signatures in high-dimensional cytometric datasets. Cytom. A 2015, 87, 603–615. [Google Scholar] [CrossRef] [PubMed]
- Qiu, P.; Simonds, E.F.; Bendall, S.C.; Gibbs, K.D.; Bruggner, R.V.; Linderman, M.D.; Sachs, K.; Nolan, G.P.; Plevritis, S.K. Extracting a cellular hierarchy from high-dimensional cytometry data with SPADE. Nat. Biotechnol. 2011, 29, 886–891. [Google Scholar] [CrossRef] [PubMed]
- Van Gassen, S.; Callebaut, B.; Van Helden, M.J.; Lambrecht, B.N.; Demeester, P.; Dhaene, T.; Saeys, Y. FlowSOM: Using self-organizing maps for visualization and interpretation of cytometry data. Cytom. A 2015, 87, 636–645. [Google Scholar] [CrossRef]
- Maaten, L.v.d.; Hinton, G. Visualizing Data using t-SNE. J. Mach. Learn. Res. 2008, 9, 2579–2605. [Google Scholar]
- Amir, E.-a.D.; Davis, K.L.; Tadmor, M.D.; Simonds, E.F.; Levine, J.H.; Bendall, S.C.; Shenfeld, D.K.; Krishnaswamy, S.; Nolan, G.P.; Pe’er, D. viSNE enables visualization of high dimensional single-cell data and reveals phenotypic heterogeneity of leukemia. Nat. Biotechnol. 2013, 31, 545–552. [Google Scholar] [CrossRef]
- Aghaeepour, N.; Finak, G.; Hoos, H.; Mosmann, T.R.; Brinkman, R.; Gottardo, R.; Scheuermann, R.H.; The Flow, C.A.P.C.; The, D.C. Critical assessment of automated flow cytometry data analysis techniques. Nat. Methods 2013, 10, 228–238. [Google Scholar] [CrossRef]
- Mair, F.; Hartmann, F.J.; Mrdjen, D.; Tosevski, V.; Krieg, C.; Becher, B. The end of gating? An introduction to automated analysis of high dimensional cytometry data. Eur. J. Immunol. 2016, 46, 34–43. [Google Scholar] [CrossRef]
- LeCun, Y.; Boser, B.; Denker, J.S.; Henderson, D.; Howard, R.E.; Hubbard, W.; Jackel, L.D. Backpropagation Applied to Handwritten Zip Code Recognition. Neural Comput. 1989, 1, 541–551. [Google Scholar] [CrossRef]
- Simonyan, K.; Zisserman, A. Very Deep Convolutional Networks for Large-Scale Image Recognition. arXiv 2014, arXiv:1409.1556v6. [Google Scholar]
- Chen, Y.; Jiang, H.; Li, C.; Jia, X.; Ghamisi, P. Deep Feature Extraction and Classification of Hyperspectral Images Based on Convolutional Neural Networks. IEEE Trans. Geosci. Remote 2016, 54, 6232–6251. [Google Scholar] [CrossRef]
- Popova, M.; Isayev, O.; Tropsha, A. Deep reinforcement learning for de novo drug design. Sci. Adv. 2018, 4, eaap7885. [Google Scholar] [CrossRef] [PubMed]
- Castelvecchi, D. Can we open the black box of AI? Nature 2016, 538, 20–23. [Google Scholar] [CrossRef] [PubMed]
- Nitta, N.; Sugimura, T.; Isozaki, A.; Mikami, H.; Hiraki, K.; Sakuma, S.; Iino, T.; Arai, F.; Endo, T.; Fujiwaki, Y.; et al. Intelligent Image-Activated Cell Sorting. Cell 2018, 175, 266–276. [Google Scholar] [CrossRef] [PubMed]
- Tanhaemami, M.; Alizadeh, E.; Sanders, C.K.; Marrone, B.L.; Munsky, B. Using flow cytometry and multistage machine learning to discover label-free signatures of algal lipid accumulation. Phys. Biol. 2019, 16, 055001. [Google Scholar] [CrossRef]
- Eulenberg, P.; Köhler, N.; Blasi, T.; Filby, A.; Carpenter, A.E.; Rees, P.; Theis, F.J.; Wolf, F.A. Reconstructing cell cycle and disease progression using deep learning. Nat. Commun. 2017, 8, 463. [Google Scholar] [CrossRef]
- Doan, M.; Sebastian, J.A.; Pinto, R.N.; McQuin, C.; Goodman, A.; Wolkenhauer, O.; Parsons, M.J.; Acker, J.P.; Rees, P.; Hennig, H.; et al. Label-free assessment of red blood cell storage lesions by deep learning. bioRxiv 2018, 256180. [Google Scholar] [CrossRef]
- Mendelsohn, M.L. The Attributes and Applications of Flow-Cytometry. Acta Pathol. Microbiol. Scand. Sect. Pathol. 1981, 4, 15–27, WOS ID:A1981LP23300001. [Google Scholar]
- Grimberg, B.T. Methodology and application of flow cytometry for investigation of human malaria parasites. J. Immunol. Methods 2011, 367, 1–16. [Google Scholar] [CrossRef]
- Laerum, O.D.; Farsund, T. Clinical application of flow cytometry: A review. Cytometry 1981, 2, 1–13. [Google Scholar] [CrossRef] [PubMed]
- Álvarez-Barrientos, A.; Arroyo, J.; Cantón, R.; Nombela, C.; Sánchez-Pérez, M. Applications of Flow Cytometry to Clinical Microbiology. Clin. Microbiol. Rev. 2000, 13, 167–195. [Google Scholar] [CrossRef] [PubMed]
- Rieseberg, M.; Kasper, C.; Reardon, K.F.; Scheper, T. Flow cytometry in biotechnology. Appl. Microbiol. Biotechnol. 2001, 56, 350–360. [Google Scholar] [CrossRef] [PubMed]
- Lebedová, J.; Hedberg, Y.S.; Odnevall Wallinder, I.; Karlsson, H.L. Size-dependent genotoxicity of silver, gold and platinum nanoparticles studied using the mini-gel comet assay and micronucleus scoring with flow cytometry. Mutagenesis 2017, 33, 77–85. [Google Scholar] [CrossRef]
- Watson, D.A.; Gaskill, D.F.; Brown, L.O.; Doorn, S.K.; Nolan, J.P. Spectral measurements of large particles by flow cytometry. Cytom. A 2009, 75A, 460–464. [Google Scholar] [CrossRef]
- Chattopadhyay, P.K.; Roederer, M. Cytometry: Today’s technology and tomorrow’s horizons. Methods 2012, 57, 251–258. [Google Scholar] [CrossRef]
- Roederer, M. Spectral compensation for flow cytometry: Visualization artifacts, limitations, and caveats. Cytometry 2001, 45, 194–205. [Google Scholar] [CrossRef]
- Szalóki, G.; Goda, K. Compensation in multicolor flow cytometry. Cytom. A 2015, 87, 982–985. [Google Scholar] [CrossRef]
- Barteneva, N.S.; Fasler-Kan, E.; Vorobjev, I.A. Imaging Flow Cytometry:Coping with Heterogeneity in Biological Systems. J. Histochem. Cytochem. 2012, 60, 723–733. [Google Scholar] [CrossRef]
- Ortyn, W.E.; Hall, B.E.; George, T.C.; Frost, K.; Basiji, D.A.; Perry, D.J.; Zimmerman, C.A.; Coder, D.; Morrissey, P.J. Sensitivity measurement and compensation in spectral imaging. Cytom. A 2006, 69A, 852–862. [Google Scholar] [CrossRef]
- Erdbrügger, U.; Rudy, C.K.; Etter, M.E.; Dryden, K.A.; Yeager, M.; Klibanov, A.L.; Lannigan, J. Imaging flow cytometry elucidates limitations of microparticle analysis by conventional flow cytometry. Cytom. A 2014, 85, 756–770. [Google Scholar] [CrossRef]
- Lacroix, R.; Robert, S.; Poncelet, P.; Dignat-George, F. Overcoming Limitations of Microparticle Measurement by Flow Cytometry. Semin. Thromb. Hemost. 2010, 36, 807–818. [Google Scholar] [CrossRef] [PubMed]
- Bianconi, E.; Piovesan, A.; Facchin, F.; Beraudi, A.; Casadei, R.; Frabetti, F.; Vitale, L.; Pelleri, M.C.; Tassani, S.; Piva, F.; et al. An estimation of the number of cells in the human body. Ann. Hum. Biol. 2013, 40, 463–471. [Google Scholar] [CrossRef] [PubMed]


© 2020 by the authors. Licensee MDPI, Basel, Switzerland. This article is an open access article distributed under the terms and conditions of the Creative Commons Attribution (CC BY) license (http://creativecommons.org/licenses/by/4.0/).
Share and Cite
Voronin, D.V.; Kozlova, A.A.; Verkhovskii, R.A.; Ermakov, A.V.; Makarkin, M.A.; Inozemtseva, O.A.; Bratashov, D.N. Detection of Rare Objects by Flow Cytometry: Imaging, Cell Sorting, and Deep Learning Approaches. Int. J. Mol. Sci. 2020, 21, 2323. https://doi.org/10.3390/ijms21072323
Voronin DV, Kozlova AA, Verkhovskii RA, Ermakov AV, Makarkin MA, Inozemtseva OA, Bratashov DN. Detection of Rare Objects by Flow Cytometry: Imaging, Cell Sorting, and Deep Learning Approaches. International Journal of Molecular Sciences. 2020; 21(7):2323. https://doi.org/10.3390/ijms21072323
Chicago/Turabian StyleVoronin, Denis V., Anastasiia A. Kozlova, Roman A. Verkhovskii, Alexey V. Ermakov, Mikhail A. Makarkin, Olga A. Inozemtseva, and Daniil N. Bratashov. 2020. "Detection of Rare Objects by Flow Cytometry: Imaging, Cell Sorting, and Deep Learning Approaches" International Journal of Molecular Sciences 21, no. 7: 2323. https://doi.org/10.3390/ijms21072323
APA StyleVoronin, D. V., Kozlova, A. A., Verkhovskii, R. A., Ermakov, A. V., Makarkin, M. A., Inozemtseva, O. A., & Bratashov, D. N. (2020). Detection of Rare Objects by Flow Cytometry: Imaging, Cell Sorting, and Deep Learning Approaches. International Journal of Molecular Sciences, 21(7), 2323. https://doi.org/10.3390/ijms21072323