Article

A Survey of Antimicrobial Resistance Determinants in Category A Select Agents, Exempt Strains, and Near-Neighbor Species

1
US Naval Research Laboratory, Center for Biomolecular Science & Engineering, Washington, DC 20375, USA
2
Karle’s Fellow, US Naval Research Laboratory, Washington, DC 20375, USA
3
US Army Combat Capabilities Development Command (CCDC) Chemical Biological Center, Edgewood, MD 21010, USA
4
US Naval Medical Research Center - Biological Defense Research Directorate, Frederick, MD 20910, USA
5
Defense Biological Product Assurance Office, Joint Program Executive Office for Chemical, Biological, Radiological and Nuclear Defense (CBRND), Frederick, MD 21702, USA
6
Logistics Management Institute, Tysons, VA 22012, USA
7
Defense Threat Reduction Agency, Joint Science and Technology Office, Ft. Belvoir, VA 22060, USA
*
Author to whom correspondence should be addressed.
Int. J. Mol. Sci. 2020, 21(5), 1669; https://doi.org/10.3390/ijms21051669
Submission received: 8 January 2020 / Revised: 25 February 2020 / Accepted: 26 February 2020 / Published: 29 February 2020
(This article belongs to the Special Issue Drug Resistance Mechanisms in Bacteria)

Abstract

:
A dramatic increase in global antimicrobial resistance (AMR) has been well documented. Of particular concern is the dearth of information regarding the spectrum and prevalence of AMR within Category A Select Agents. Here, we performed a survey of horizontally and vertically transferred AMR determinants among Category A agents and their near neighbors. Microarrays provided broad spectrum screening of 127 Francisella spp., Yersinia spp., and Bacillus spp. strains for the presence/absence of 500+ AMR genes (or families of genes). Detecting a broad variety of AMR genes in each genus, microarray analysis also picked up the presence of an engineered plasmid in a Y. pestis strain. High resolution melt analysis (HRMA) was also used to assess the presence of quinolone resistance-associated mutations in 100 of these strains. Though HRMA was able to detect resistance-causing point mutations in B. anthracis strains, it was not capable of discriminating these point mutations from other nucleotide substitutions (e.g., arising from sequence differences in near neighbors). Though these technologies are well-established, to our knowledge, this is the largest survey of Category A agents and their near-neighbor species for genes covering multiple mechanisms of AMR.

1. Introduction

Ever-increasing levels of antimicrobial resistance (AMR) are considered a top global health concern and pose a “threat to the success and continuation of clinical medicine as we know it.” [1,2]. The issue of AMR is also challenging for biosecurity reasons. While morbidity/mortality and ease of dissemination/weaponization remain the top reasons for classification of various species as Category A threat agents, increasingly greater attention is being paid to the potential for multidrug resistance (MDR) within these strains. Whether naturally occurring or engineered, the emergence and spread of agents expressing multidrug resistance (MDR) present a clear risk for significant consequences [3]. Even without deliberate engineering of MDR into threat strains, there exists considerable risk of the emergence and spread of resistant strains. Rapid identification of virulent strains and AMR profiles is essential for implementation of suitable infection control measures.
Standard therapeutic guidelines for treatment of infections with Category A agents are well defined (Table 1). Of particular concern, resistance to fluoroquinolones—among the top choices for treating anthrax, tularemia, and plague (Table 1)—is commonly associated with point mutations in DNA gyrase (gyrA, gyrB) and topoisomerase IV (parC, parE) genes. Mutations within the quinolone resistance determining regions (QRDRs) of these genes can occur spontaneously or with intentional application of selective pressure [4,5,6,7,8,9].
Horizontally transferred resistance determinants also pose a significant threat. MDR Yersinia pestis strains isolated in Madagascar in the 1990s harbored plasmids with up to eight AMR determinants, at least four of which confer resistance to recommended therapeutics or prophylactic treatments [13,14,15,16,17]. Fortunately, the strains responsible for more recent outbreaks in Madagascar, the Democratic Republic of Congo, and Uganda do not carry these plasmids and are susceptible to the standard therapeutics [18,19]. Even so, AMR determinants present on mobile elements have the potential to spread widely; a number of reports have described the means of transferring naturally occurring plasmids harboring AMR determinants to and from these strains [14,20,21]. Furthermore, ever increasing numbers of cloning vectors are being described that are capable of being transferred to and from Y. pestis and other Category A agents, such as Bacillus anthracis and Francisella tularensis [22,23,24,25,26]. In most cases, common AMR markers are used for selection and could potentially be suggestive of engineered strains.
In spite of the large number of publications describing the pathophysiology of these Category A agents, there still remains a dearth of information regarding the full spectrum and prevalence of AMR and their molecular mechanisms within these agents and their near neighbors. For this reason, we performed a survey of 62 Bacillus spp., 23 Francisella spp., and 42 Yersinia spp. strains for both horizontally and vertically transferred AMR determinants; included amongst these strains were 46 Category A Select Agents. Microarrays were used for broad spectrum screening of all 127 strains for the presence/absence of 500+ AMR genes and gene families, while high resolution melt analysis (HRMA) was used to assess the presence of quinolone resistance-associated mutations in 100 of these strains. To our knowledge, this is the largest survey of Category A agents and their near-neighbor species for genes covering multiple mechanisms of AMR.

2. Results and Discussion

Phenotypic antimicrobial susceptibility testing (AST) is still considered the gold standard for determination of resistance profiles. However, ASTs cannot be used to trace the spread of AMR strains nor the mobile genetic elements responsible for transmission of resistance. Phenotypic testing further cannot distinguish between various resistance mechanisms with overlapping specificities and are generally inadequate for epidemiological and forensic tracking. While not always predictive of phenotype, molecular tests can nonetheless determine the genetic basis and overall mechanisms for resistance, as well as the potential for transmission to other strains or species via horizontal gene transfer.
Here, we genetically characterized 127 archived Category A agents and their near neighbors with respect to AMR. To accomplish this, we determined the presence/absence of >500 AMR determinants using the ARDM v.3.1. In parallel, we used a combination of targeted PCR and HRMA to identify mutations in gyrA, parC, and parE that confer resistance to fluoroquinolones used as first-line therapeutics. By combining the broad screening capability of microarrays with the fine discriminatory capabilities of HRMA, we detected markers acquired through both horizontal transfer and mutation. The dataset generated here provides a baseline measurement of the spectrum and prevalence of various resistance mechanisms in both Category A select agents and their near neighbors. These baseline data may be helpful in development of predictive algorithms designed to assess risk associated with outbreaks with naturally occurring or engineered threats, as well as in guiding development of new therapeutics.

2.1. Testing for Horizontally-Acquired Genes—Microarray Analysis

Based on the ARDM v.2 [27] and v.3 [28], the ARDM v.3.1 contains probes directed against emerging AMR determinants of global importance (e.g., blaNDM), as well as those derived from several Select Agent species (including F. tularensis, B. anthracis, Y. pestis), their near neighbors, and more distantly related species in the same genera. In total, the ARDM v.3.1 content (4480 probes per two sub-arrays) covers 512 AMR determinants, conferring resistance to 19 categories of antimicrobials (Figure 1a). Microarray content was derived from Actinobacteria, Firmicutes, Bacteroidetes, and Proteobacteria phyla (Figure 1b). Pertinent to the current study, the following determinants were derived from Select Agents and their near neighbors: 7 genes from Francisella spp. (blaA, blaB, tet, bcr/cfl1, bcr/cflA2, and bcr/cflA3 from F. tularensis, and bla from F. philomiragia); 6 genes from Yersinia spp. (qacE, yegB, emrA, emrB, and bacA from Y. pestis CO92, and vatF/sat from Y. enterocolitica); and 30 genes from a wide variety of Bacillus species (including bla1, bla2, bla[Vollum1], bla[Vollum3], bla[Vollum4], aacC7, aad[Vollum1], aad[Vollum2], aph[Vollum1], aph[Vollum2], aph[Vollum3], mph, tetM, vanY, cat from B. anthracis; and fosB from B. cereus).

2.1.1. Francisella spp.

Twenty F. tularensis and three F. philomiragia strains were characterized on the ARDM v.3.1. Not surprisingly, all F. tularensis strains were positive for the six F. tularensis-derived genes and the three F. philomiragia strains were positive for the single F. philomiragia-derived gene, bla (Table 2). One of the F. philomiragia strains, Jensen O#319-029, was also positive for the presence of bcr/cflA1. The reference sequence for bcr/cflA1 was compared with the published sequence for this strain (CP009343.1) and the other two F. philomiragia strains via BLAST. The bcr/cflA1 reference sequence had 91.6% sequence identity with Jensen O#319-029 while sequence identity with Jensen O#319L and Jensen O#319-036 was only ~65%. Similar BLAST comparisons showed ~80% or lower sequence identities between the three F. philomiragia strains and the other F. tularensis-derived genes on the microarray. Though not PCR-confirmed, these results support previous observations [27,29] that the specificity of the ARDM can enable detection of closely related genes (or families of genes), but that a sequence identity of >90% is required.

2.1.2. Yersinia spp.

DNA from 42 Yersinia spp. strains was characterized on the ARDM v.3.1. Strains included 26 isolates from the closely related Y. pestis/Y. pseudotuberculosis group [30], seven Y. enterocolitica strains, and nine strains from six species related more distantly to both Y. pestis/Y. pseudotuberculosis and Y. enterocolitica. Not surprisingly, all of the Y. pestis (17 isolates) and Y. pseudotuberculosis (9 isolates) strains were positive for the same five Y. pestis-derived genes: bacA, qacE, emrA, emrB, and yegB. Importantly, Y. pestis KIM(pCD1Ap+) was also positive for the presence of blaTEM; KIM(pCD1Ap+) is a KIM5 strain harboring plasmid pCD1 into which blaTEM was inserted into the yadA gene (i.e., as a selectable marker) [31]. Therefore, the ARDM was able to accurately detect the presence of a non-native AMR gene engineered into Y. pestis.
All Y. enterocolitica strains except strain 8081 were positive for the Y. enterocolitica-derived gene, vatF/sat (Table 3); strain 8081 tested negative for this gene. A BLAST search of Y. enterocolitica 8081 whole genome sequence for vatF/sat yielded a single sequence with only 79% identity, indicating that the microarray’s negative results were indeed accurate. None of the more distantly related Yersinia spp. strains were positive for any of the 512 resistance determinants on the ARDM v.3.1, including those derived from Yersinia spp. (Table 3).

2.1.3. Bacillus spp.

DNA preparations from 62 different strains from the B. cereus group were characterized on the microarray, including 41 B. anthracis, 13 B. cereus, and eight B. thuringiensis strains. Not surprisingly, all of the B. anthracis strains were positive for the same sixteen B. anthracis- or B. cereus-derived genes (Table 4). A plasmid-borne gene encoding a chloramphenicol acetyltransferase originally isolated from Staphylococcus aureus, cat(pSCS5), was also detected in a number of B. anthracis samples. The cat(pSCS5) gene has no identical allele in B. anthracis. However, six of the ARDM’s 10 probes for this gene have a 25-nt sequence with 92% identity to the B. anthracis-derived cat gene represented on the ARDM v.3.1 (Figure 2); this latter cat gene was observed in all B. anthracis and most B. cereus and B. thuringiensis strains. These cat(pSCS5)-positive calls therefore represent false-positive results. To minimize the potential for future false-positives, redesign of the ARDM—or more specifically, the group of cat(pSCS5) probes—is needed to improve specificity and eliminate redundant sequences.
Four B. cereus and five B. thuringiensis were also positive for the same 16 genes observed in all of the B. anthracis strains. Of the remaining samples that did not harbor all 16 genes, the number of positive genes ranged from two (B. thuringiensis var. israelensis) to 15 genes (B. cereus D17 and 03BB108). Perhaps not surprisingly, the number of genes detected was generally correlated to the phylogenetic similarity between strains (Figure 3), with fewer genes detected in near-neighbor strains more distantly related to B. anthracis.
In general, the microarray-based survey of AMR determinants did not reveal any significant surprises, with Select Agent species harboring AMR genes expected to be present. Similarly, near-neighbor species harbored the expected genes (e.g., F. philomiragia-derived bla in all three F. philomiragia strains, vatF/sat in all but one Y. enterocolitica strains). The microarray was, however, able to detect a non-native AMR determinant (blaTEM) in a single Y. pestis strain (KIM (pCD1Ap)); this gene was engineered into a plasmid in the parent strain as a selectable marker in knock-out experiments. The ability to detect such a non-native gene in a Select Agent species—within <24-h and without a priori knowledge of its potential presence—illustrates the value of a broad-based screening method such as microarray analysis.

2.2. HRMA

High-resolution melt analysis (HRMA) combines the finely detailed discriminatory capabilities of sequence analysis with the rapidity, relevance, and user-friendliness of PCR. Originally developed for genotyping studies, HRMA determines the melting profile of double stranded DNA sequences using a DNA intercalating dye. The shape and position of the melting curve yield information about the composition of a given DNA sequence from which mutational data can be derived; substitution of a G/C with A/T will reduce the Tm while an A/T→G/C change will result in a similar increase in Tm. In this manner, HRMA can provide the capability to distinguish allelic variants which play an important role in resistance arising from mutations. As these mutations are not detectable with the ARDM alone, HRMA is a valuable approach that is highly complementary to the ARDM.
High level resistance to ciprofloxacin—a first- or second-line therapeutic for tularemia, plague, and anthrax—often arises from point mutations in the QRDRs of gyrA, gyrB, parC, parE. Loveless [34] previously demonstrated that HRMA could be used to detect point mutations in QRDRs of F. tularensis, Y. pestis, and B. anthracis. Here, we applied their strategy to assess sequence differences in 10 Francisella spp. strains (gyrA, parE), 34 Yersinia spp. strains (gyrA only), and 60 Bacillus spp. strains (gyrA, parC) to determine the practicality of this method for rapid screening.

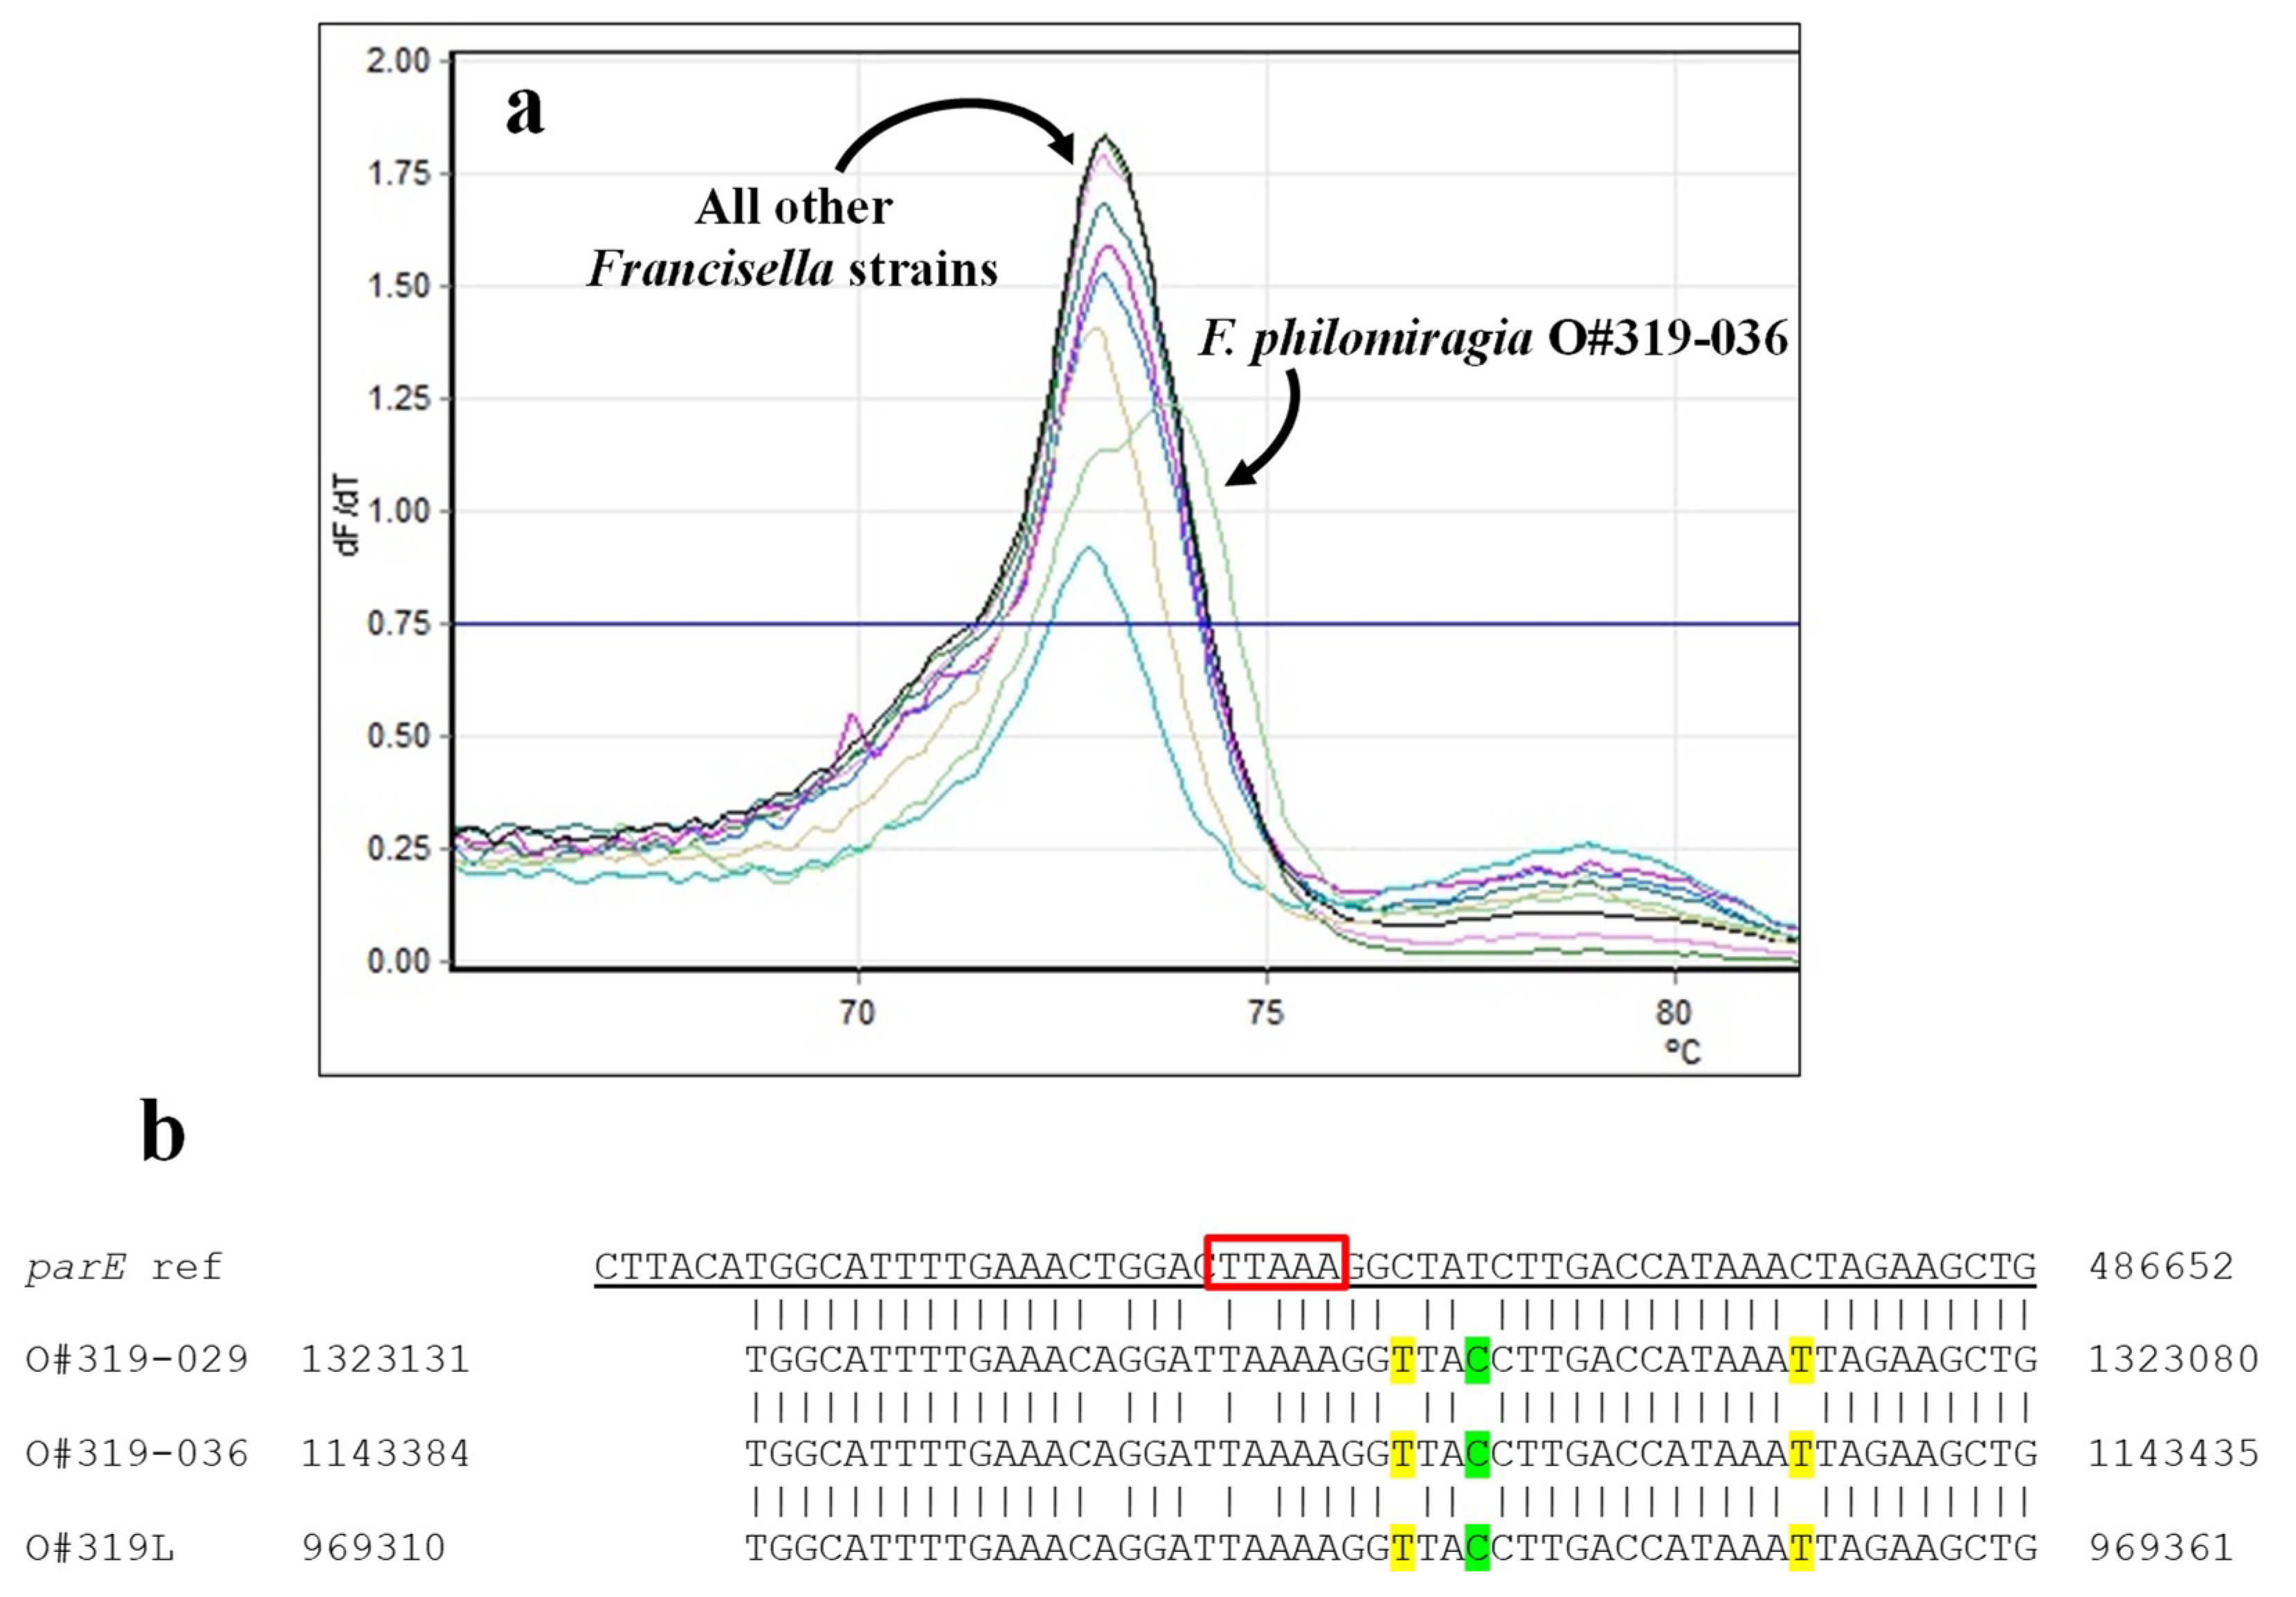
2.2.1. Francisella spp.

QRDRs in gyrA and parC were assessed by HRMA in seven F. tularensis and three F. philomiragia strains using PCR primers designed to bracket mutations observed to result in ciprofloxacin resistance [9,34,35]. In the gyrA assay, all F. tularensis strains clustered together (Table 5, Figure 4); these results are consistent with the phenotypic susceptibility of all strains for which ASTs have been reported [36]. Formation of a separate cluster by all three F. philomiragia, with Tms nearly a degree higher, was not surprising. There are three A/T→C/G and one C/G→A/T changes within the gyrA target sequence; these changes would be expected to—and did—cause a significant change in Tm. Differences within the primer sequences were also likely responsible for the significantly higher Cts observed with the F. philomiragia samples (average Ct of 32.7 versus 13.8 for F. tularensis, p < 0.025).
The HRMA primers used here for the parE assay were designed to detect a 5-bp deletion previously noted by Loveless [34]. All of the strains—both F. tularensis and F. philomiragia—clustered together, in spite of second Tm peak observed with F. philomiragia O#319-036. Clustering together of the F. tularensis and F. philomiragia strains was not unexpected, though the clustering was not as tight as observed with gyrA. Though the 5-bp region interrogated had a single nucleotide difference (T→A) not predicted to cause a change in Tm, there were multiple differences within the primer regions that might affect the Tms of half the amplicons in each PCR reaction (highlighted in Figure 5b). As with the gyrA amplifications, Cts for the three F. philomiragia strains were significantly greater than those of the F. tularensis strains (p < 0.005), likely due to these changes in the primed regions.

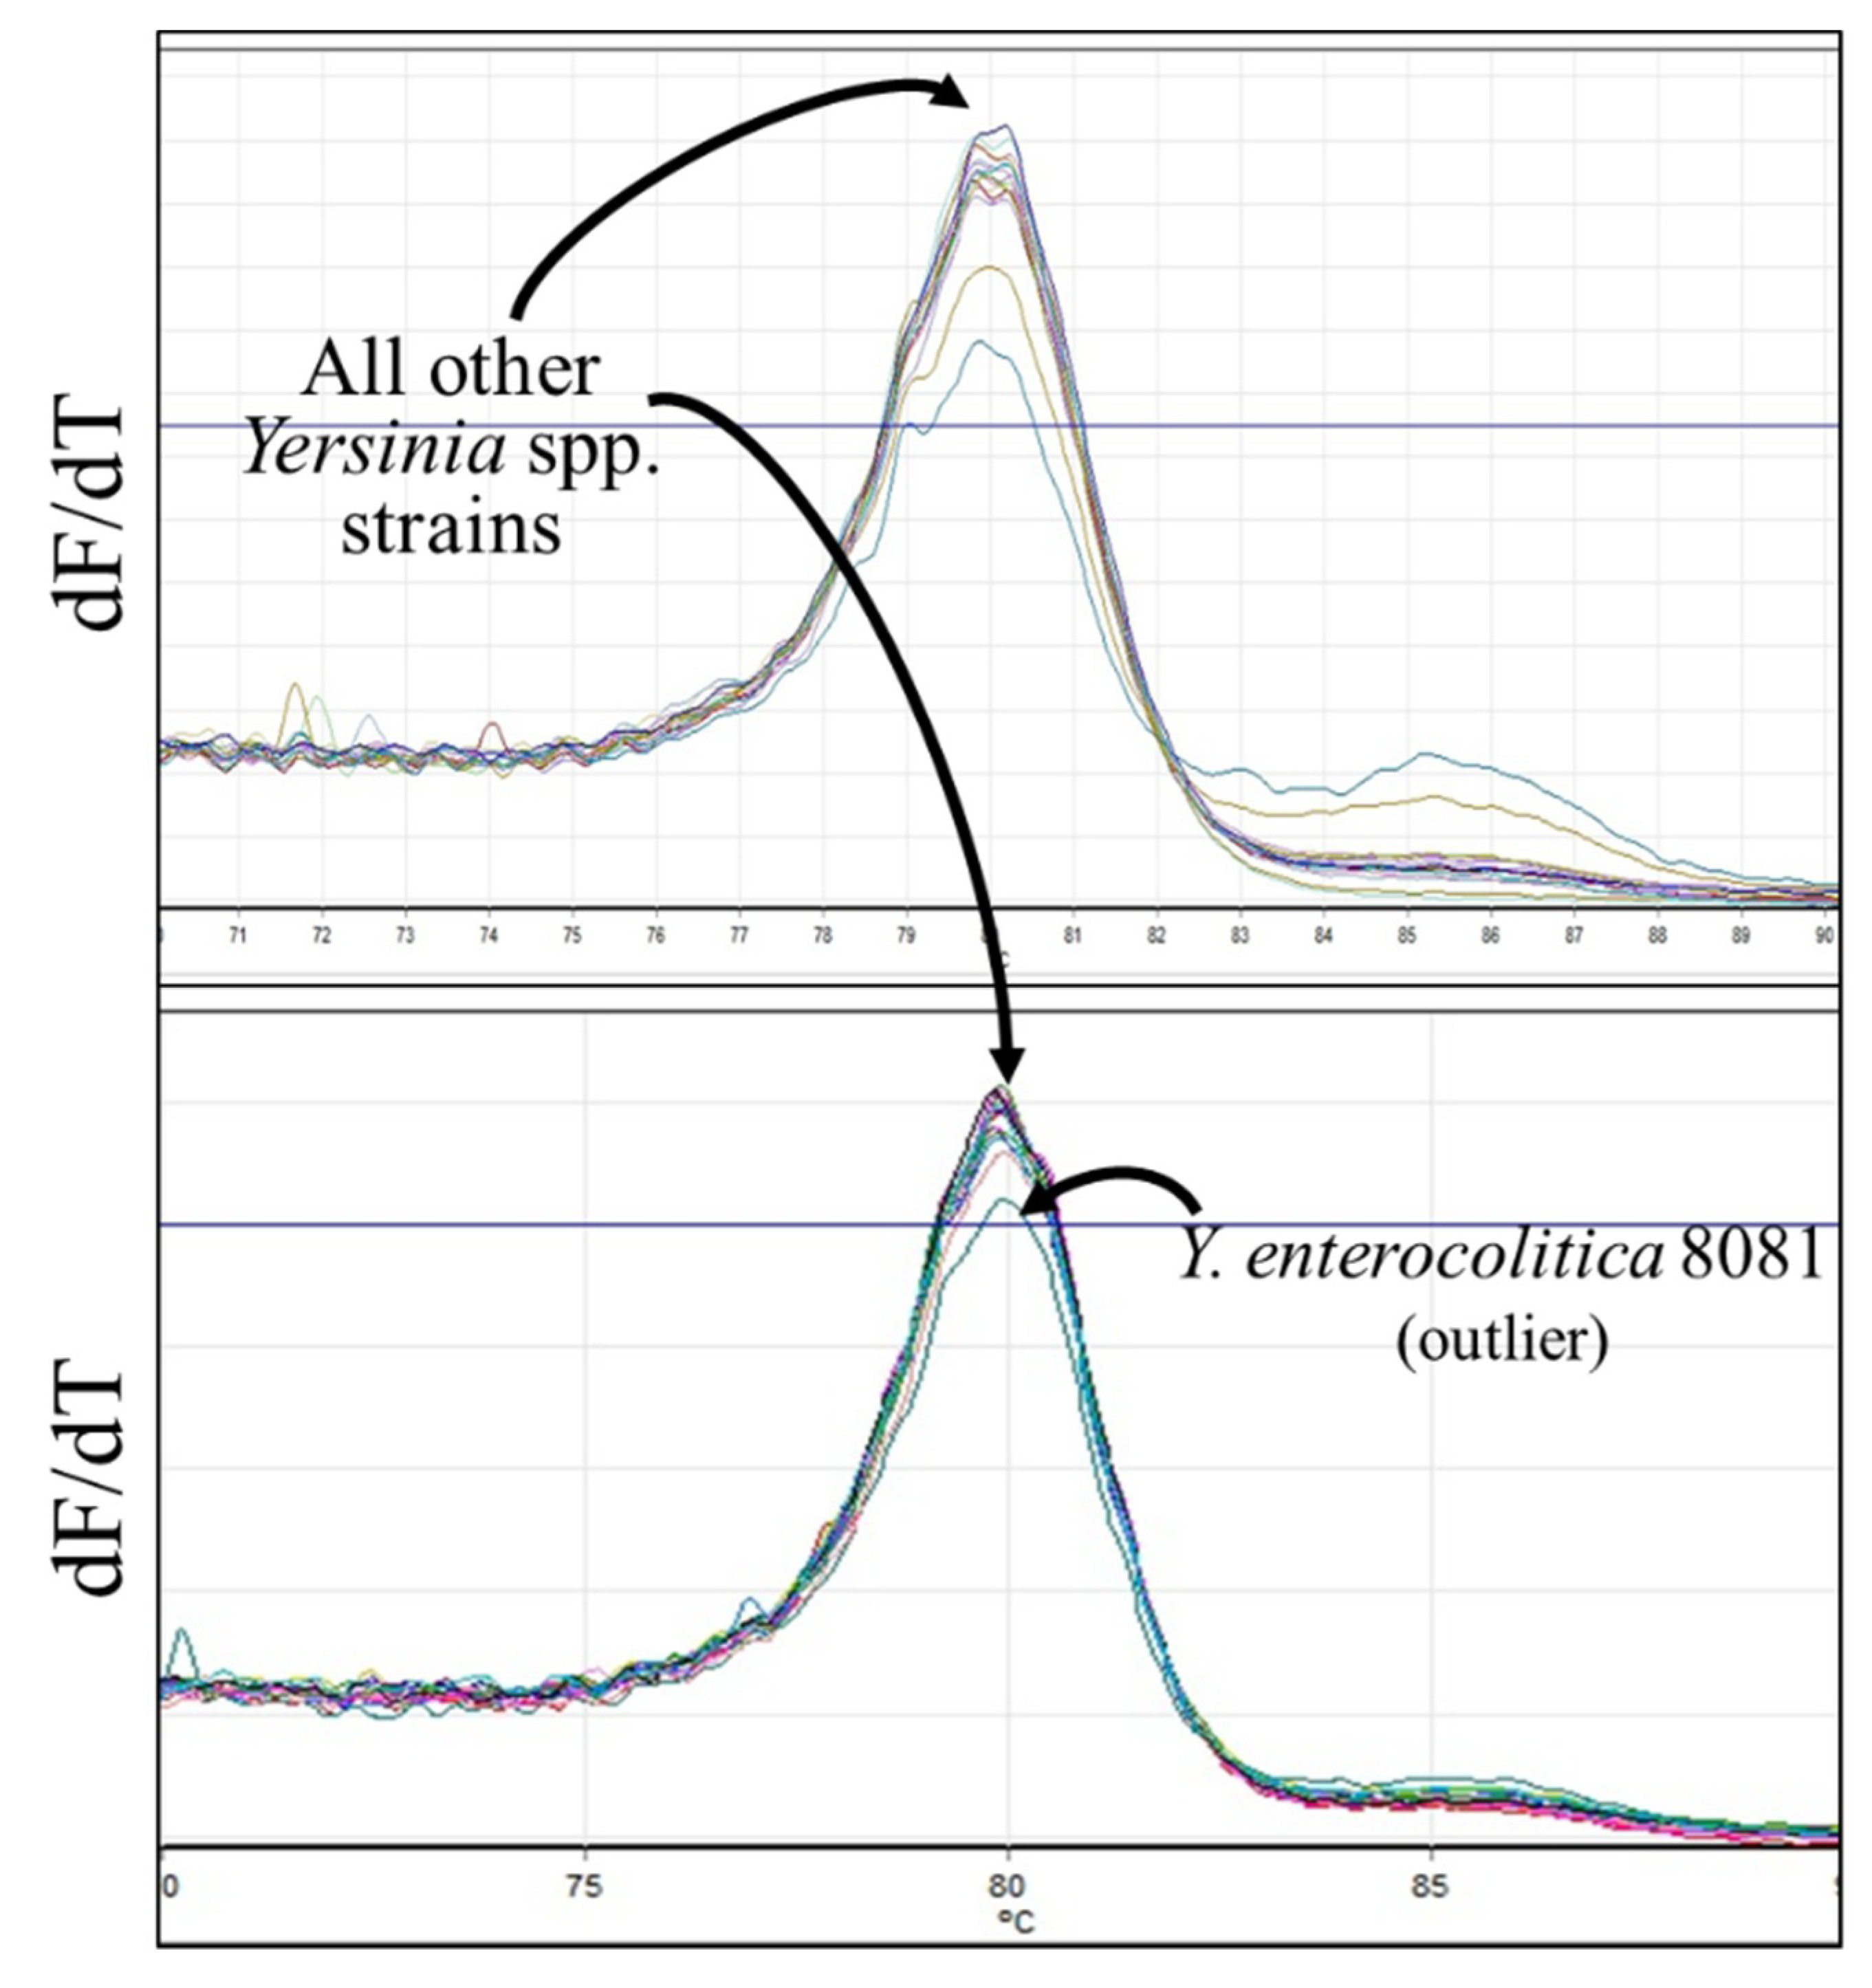
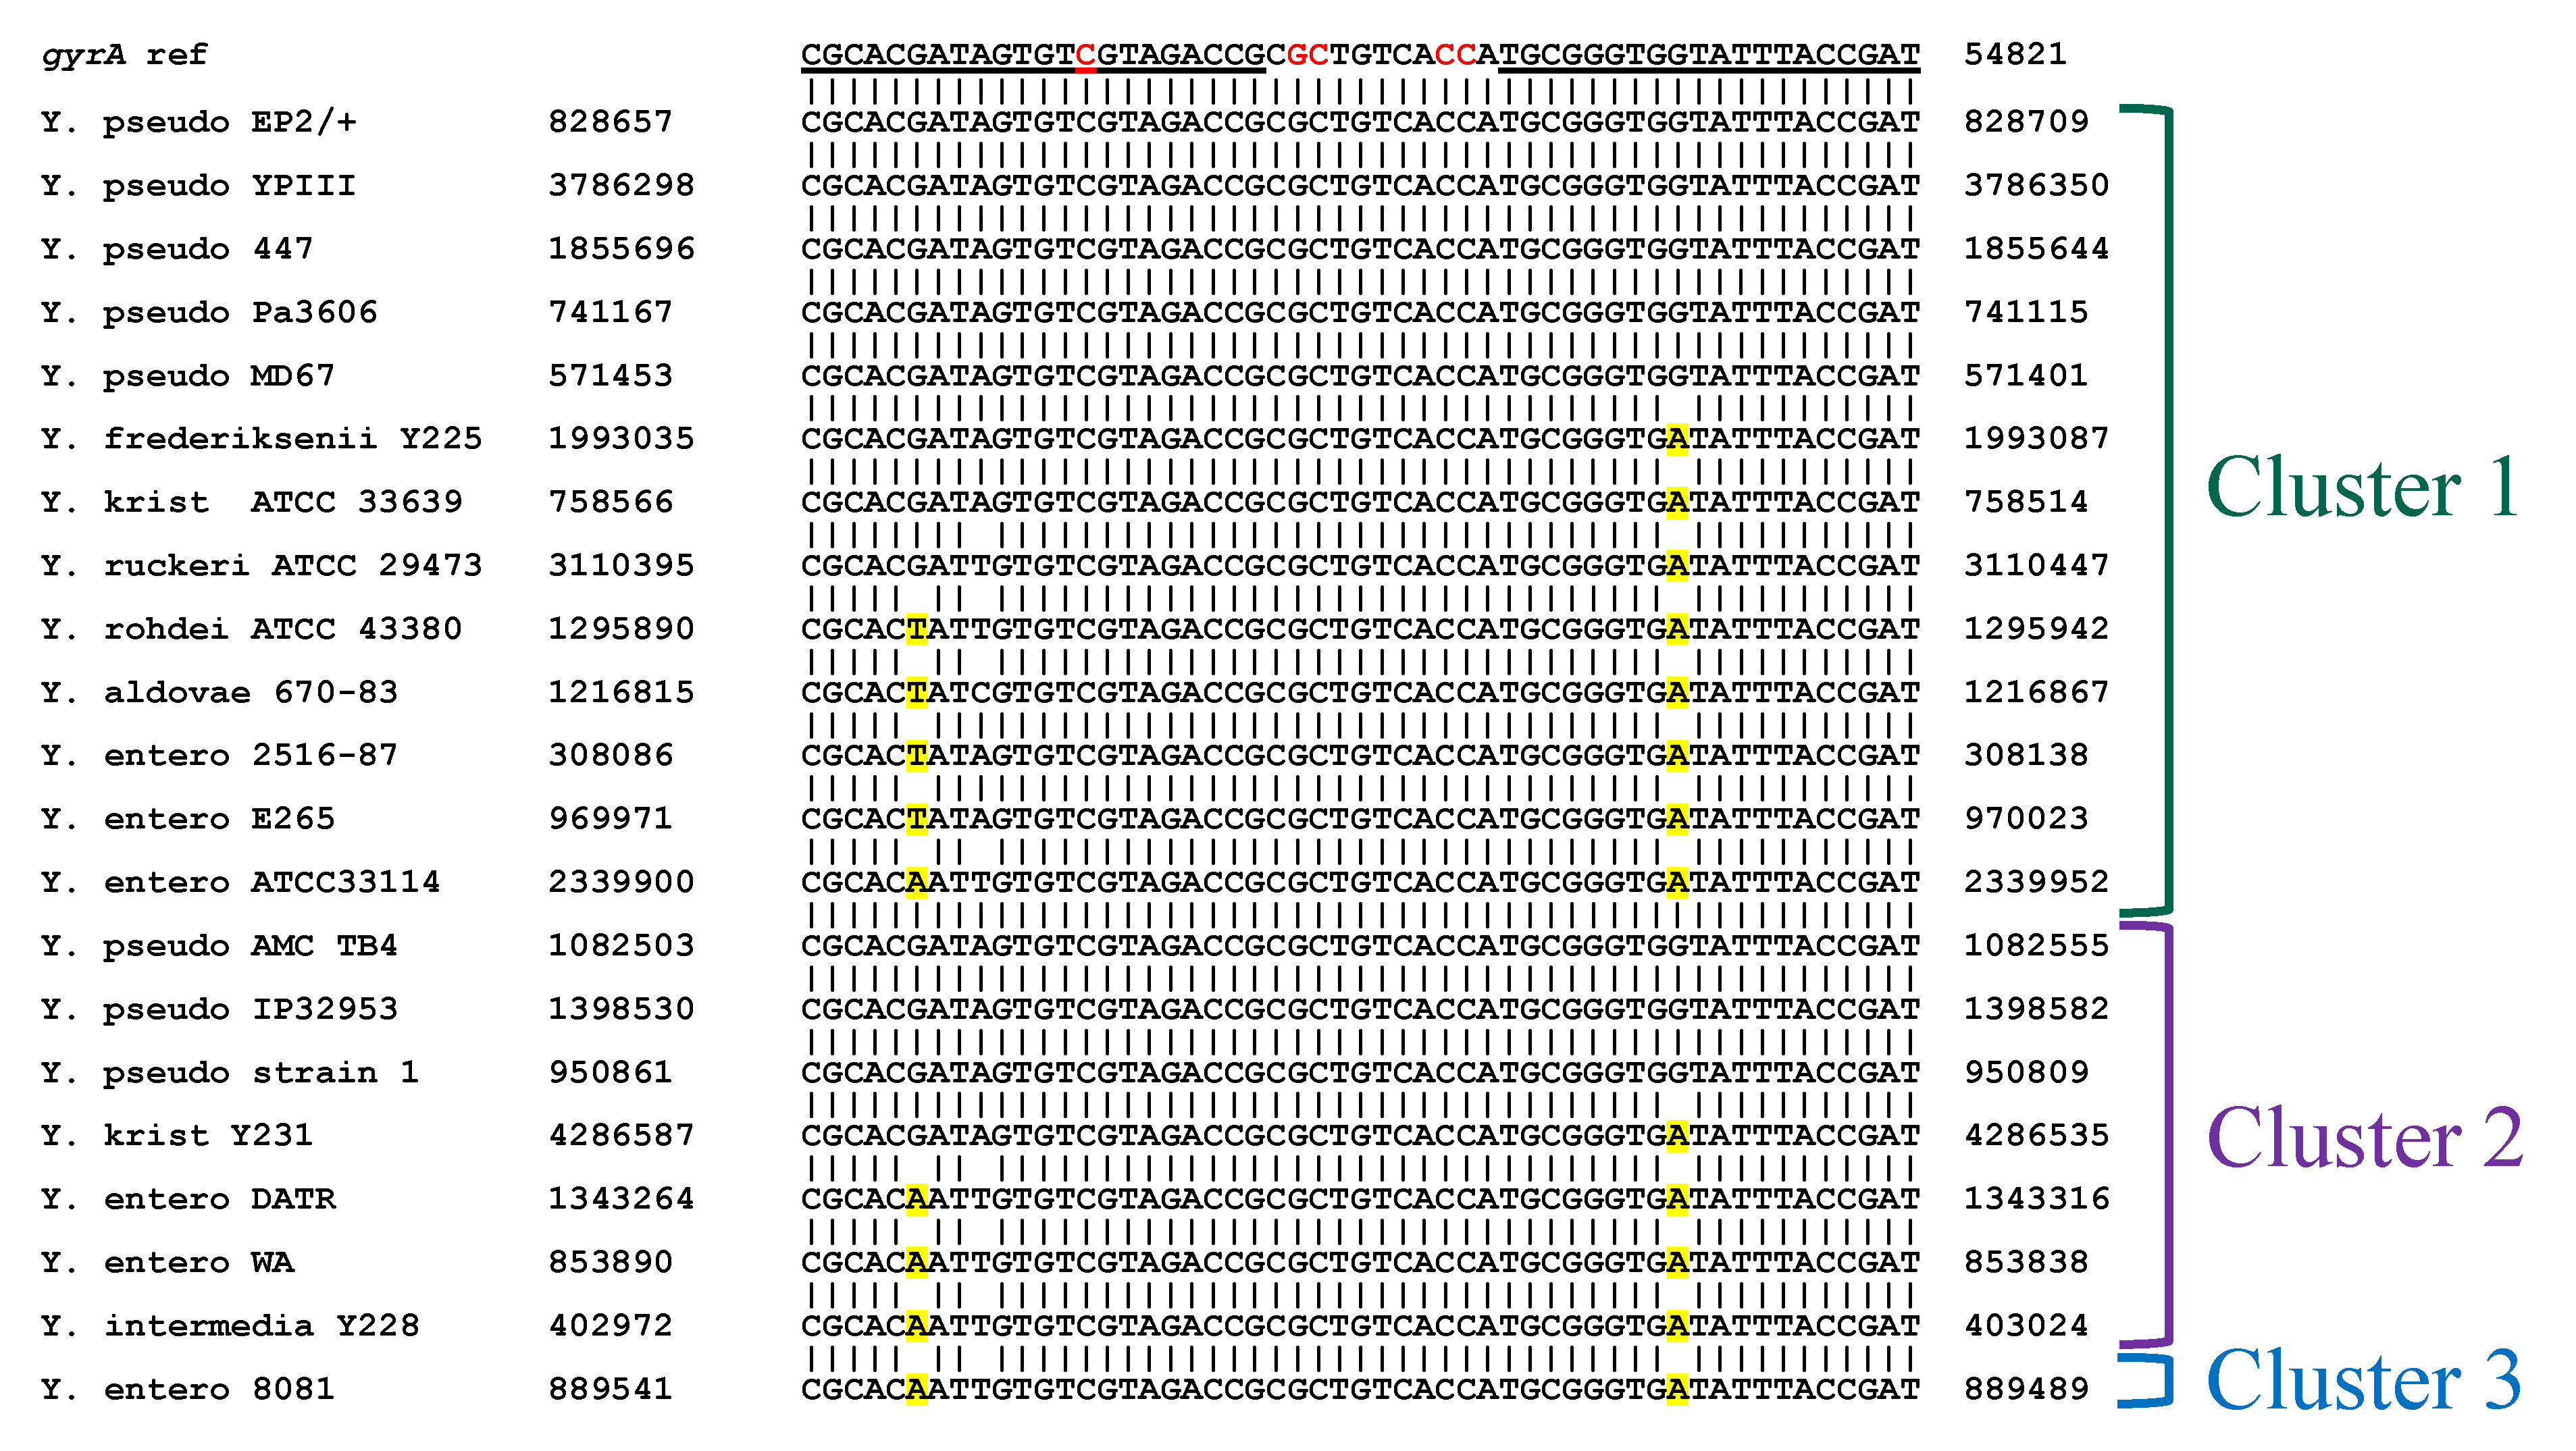
2.2.2. Yersinia spp.

Multiple studies have reported ciprofloxacin resistance arising in Y. pestis from mutations in the gyrA QRDR [34,37,38,39,40], but to our knowledge, analogous mutations in parC or parE have not been documented. For this reason, only gyrA-specific HRMA assays were used with Yersinia spp. The site bracketed in the Y. pestis assay encompassed four mutations causing phenotypic ciprofloxacin resistance, with an additional two mutations found within the primer sequences [37,38].
HRMA was performed on DNA from thirty-five Yersinia spp. strains, including 10 Y. pestis, eight Y. pseudotuberculosis, and seven Y. enterocolitica isolates. In many cases, two peaks (or a peak and a shoulder) were observed (Figure 6); Tms of the lower peaks ranged between 79.03 °C and 79.95 °C and of the higher peaks between 78.83 °C and 80.25 °C. All of the Y. pestis strains formed a single tight cluster with average Tm of 79.83; five Y. pseudotuberculosis, four Y. enterocolitica, and six more distantly related strains clustered with these Y. pestis strains (Table 6). A separate cluster was comprised of the remaining Y. pseudotuberculosis strains (AMC TB4, IP32953, strain 1), Y. enterocolitica DATR and WA, Y. intermedia, Y. kristensenii, and Y. rohdei strains. A single Y. enterocolitica isolate (strain 8081) was an outlier.
Based on the published sequences available for the Yersinia spp. strains (Figure 7), the basis for principal component 1 used in the clustering analysis is unclear. Though all Y. pestis strains were placed in the same cluster, several Y. pseudotuberculosis strains with sequences identical to the reference sequence were placed in cluster 2. Similarly, amplicons from other strains having predicted C/G→A/T changes that would decrease Tm (typically within the primer regions) were split evenly between clusters 1 and 2. The predictability in clustering could potentially be improved through analysis of additional replicates. Furthermore, inclusion of quinolone-resistant strains with documented QRDR mutations (to which we did not have access) would help demonstrate the true efficacy in using HRMA to detect both species-specific and sequence-specific changes predictive of phenotype. As is, based on the current knowledge of known point mutations causing fluoroquinolone resistance and the location of sequence differences, none of the tested strains would be predicted to be resistant. Indeed, for those strains for which phenotypic susceptibility has been determined (Y. pestis Nairobi, PBM19, Pestoides F, Harbin35, Java9, CO92, Pestoides G, Angola, and Nicholisk 41), none are resistant [41]. At present, however, the utility of HRMA to detect such differences is not clear.

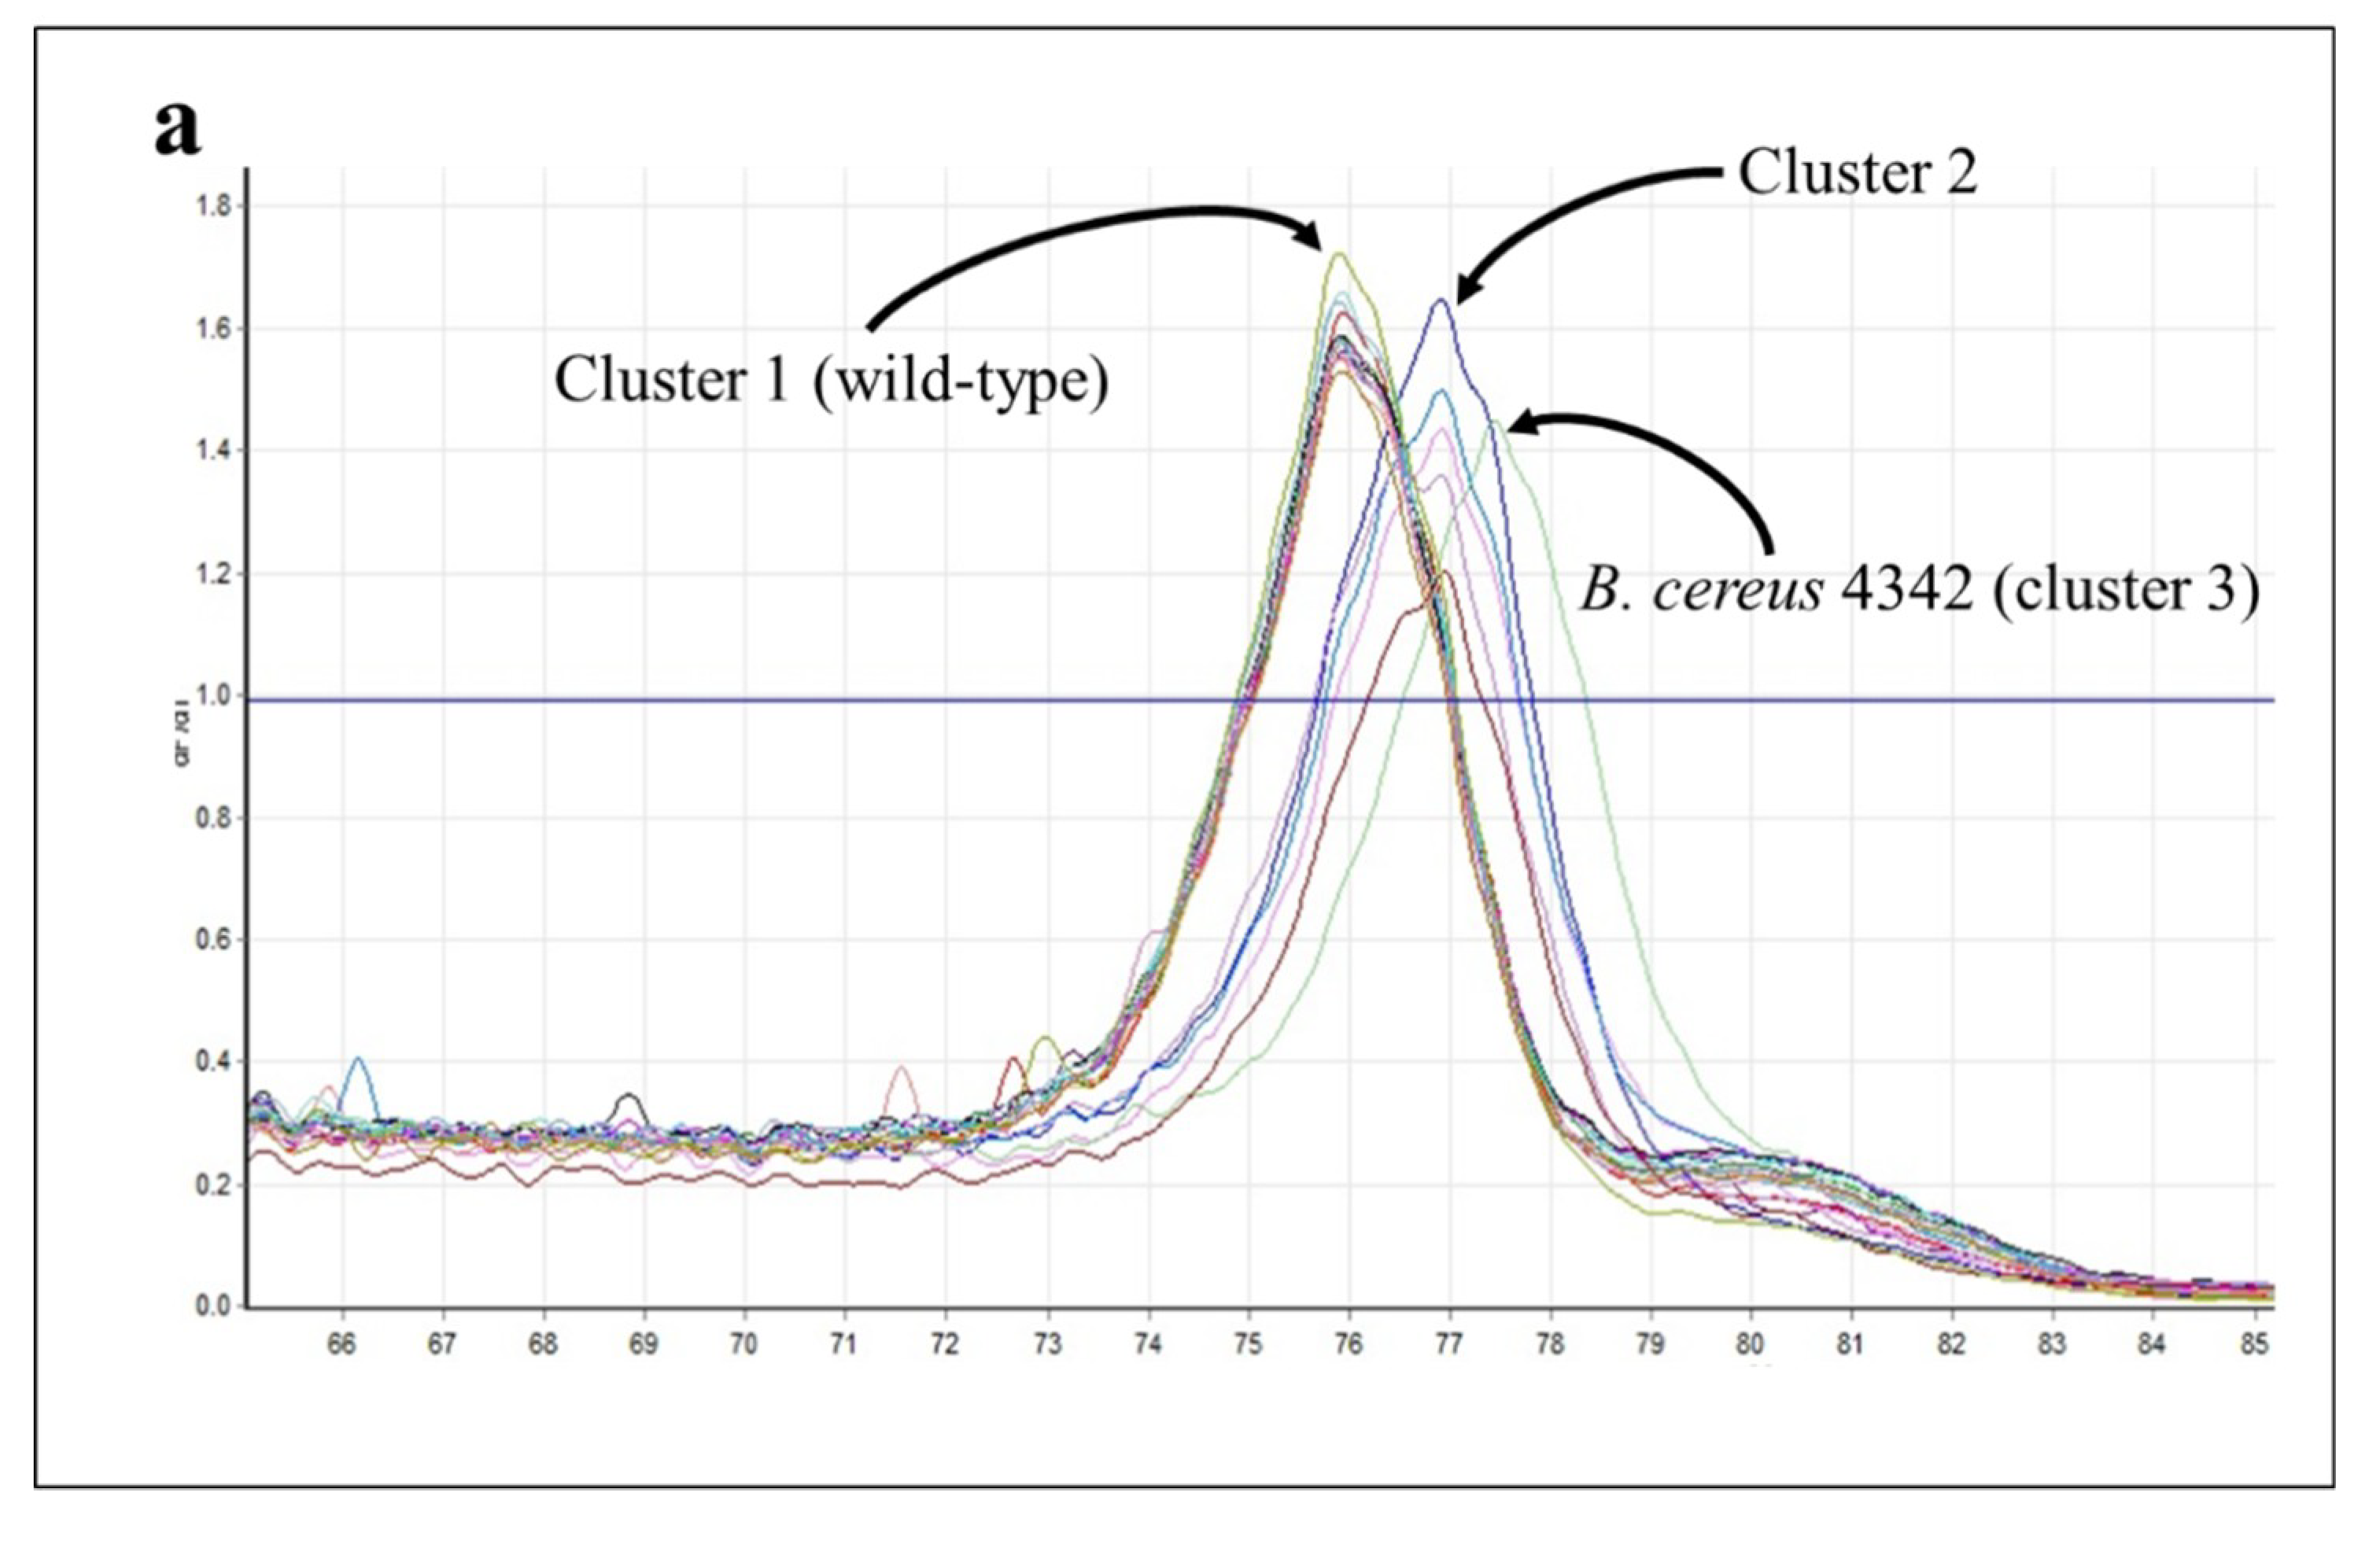
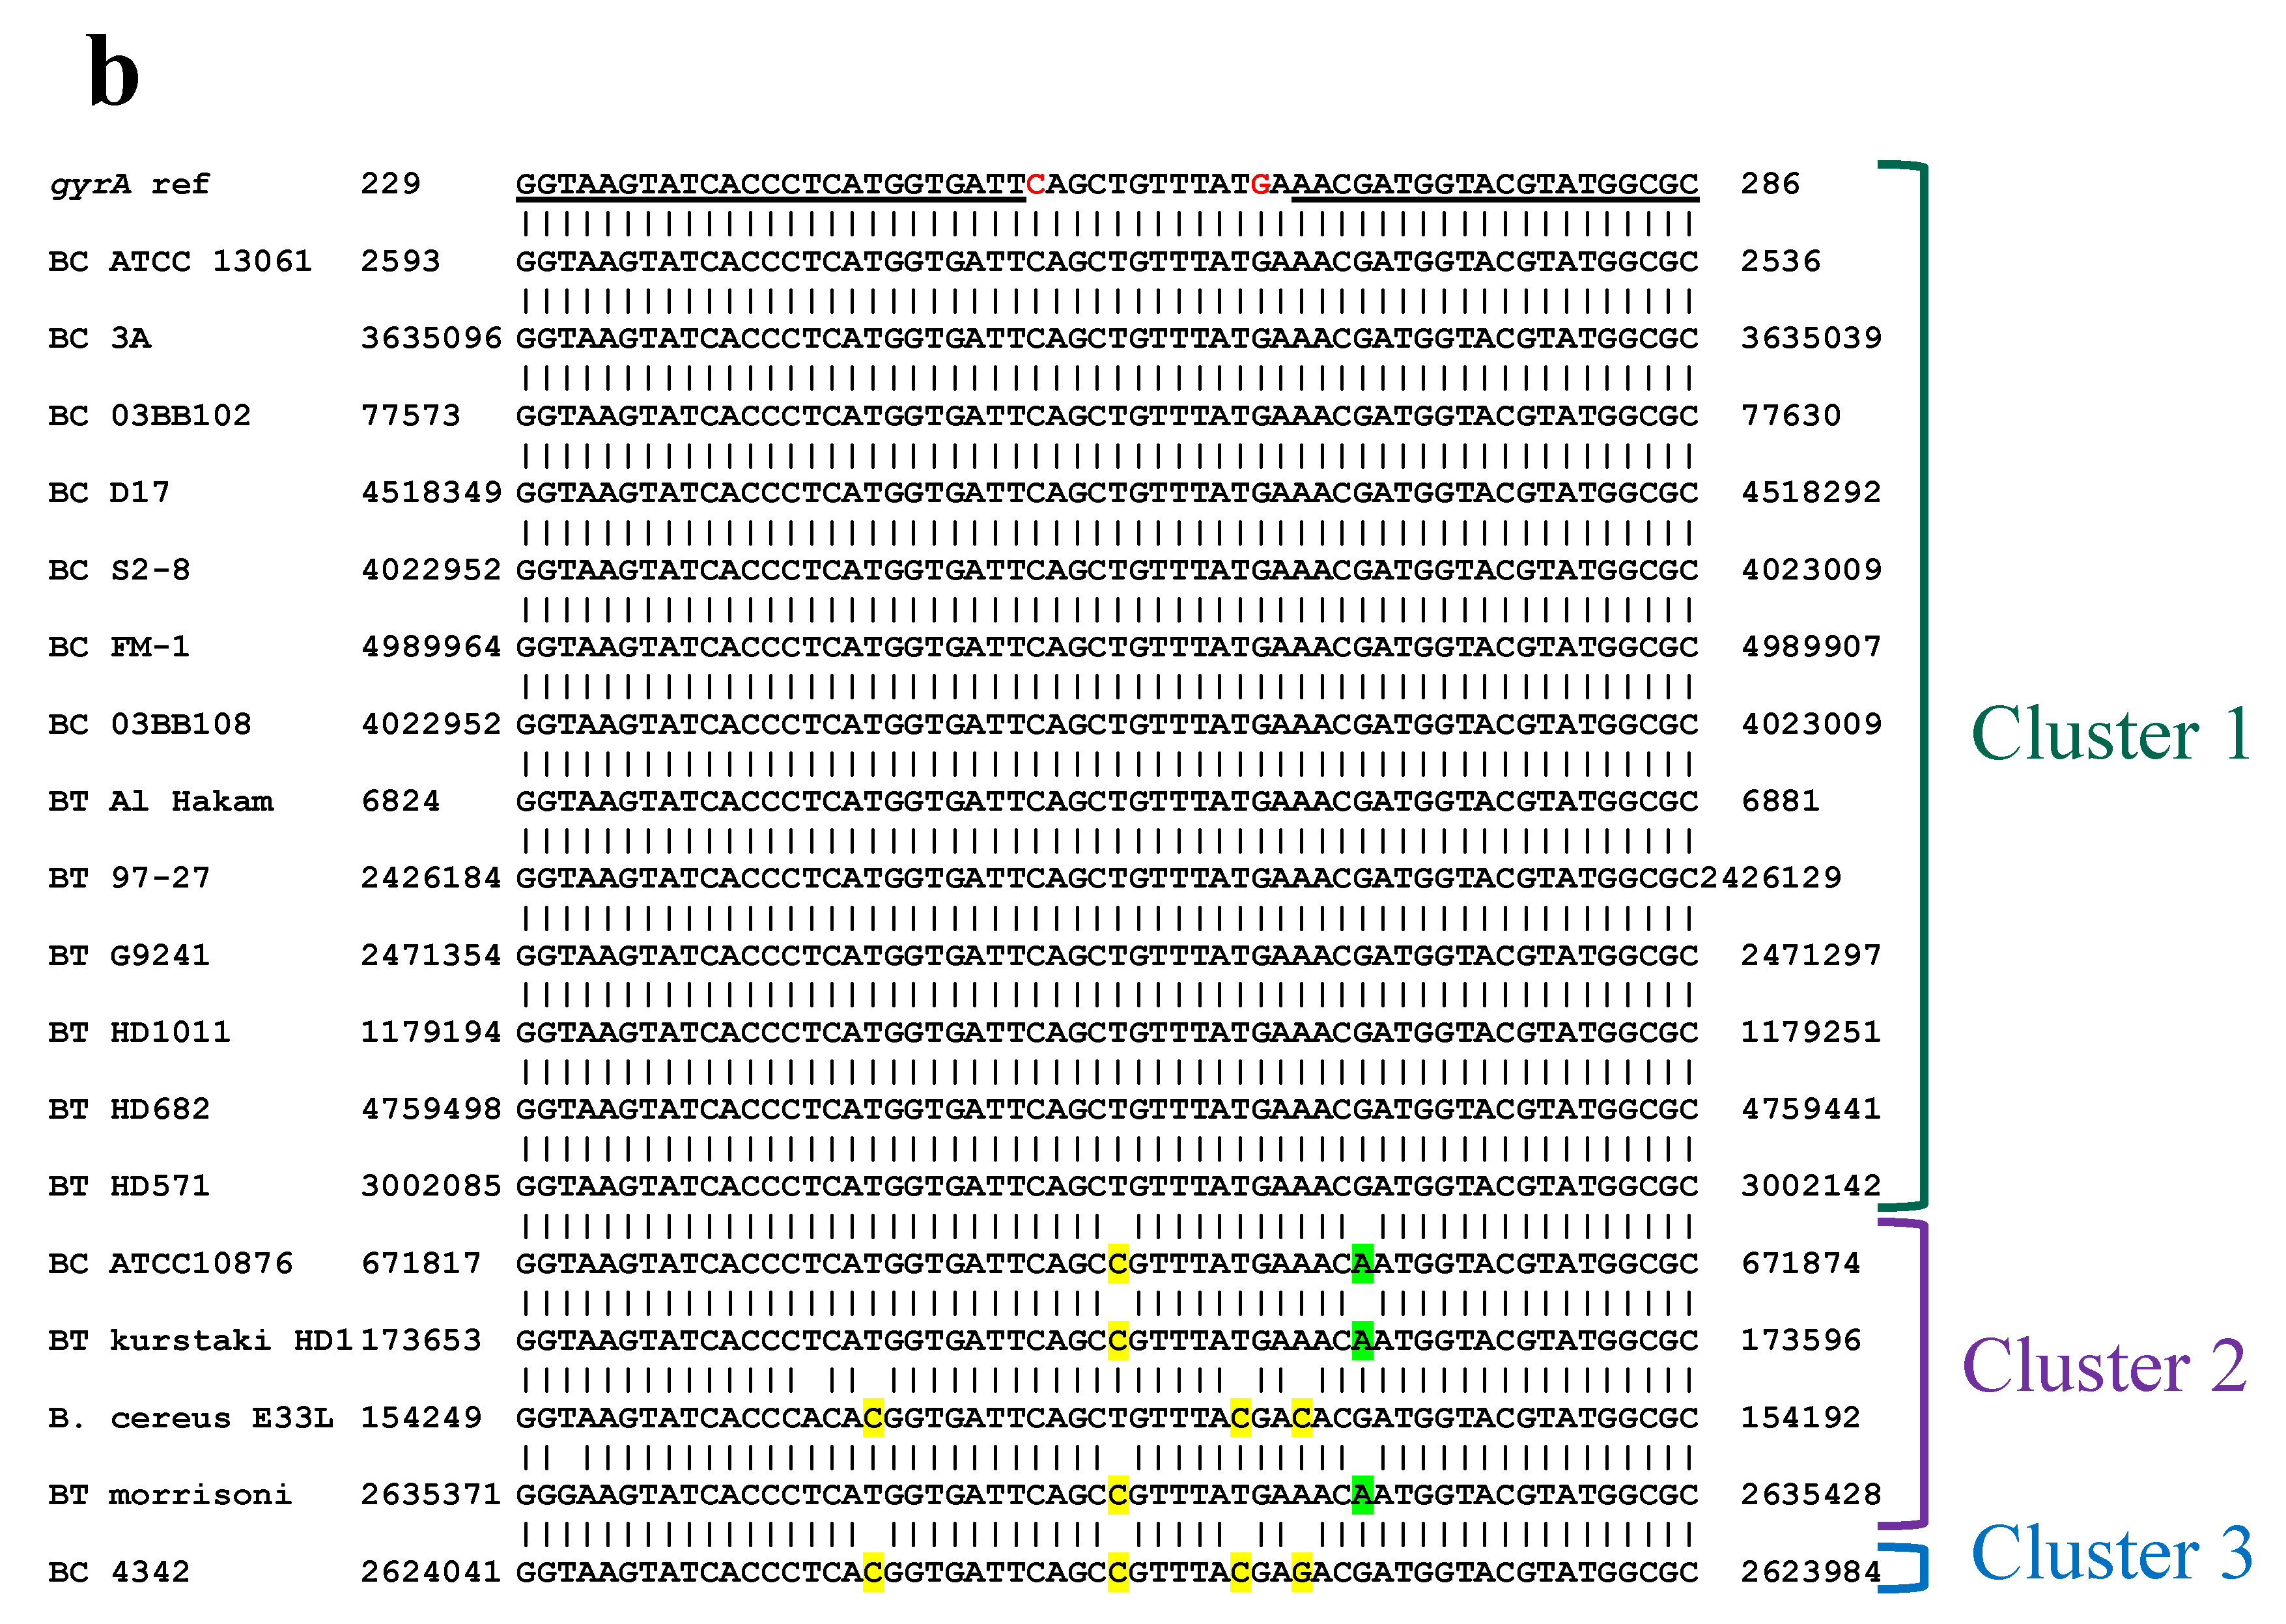
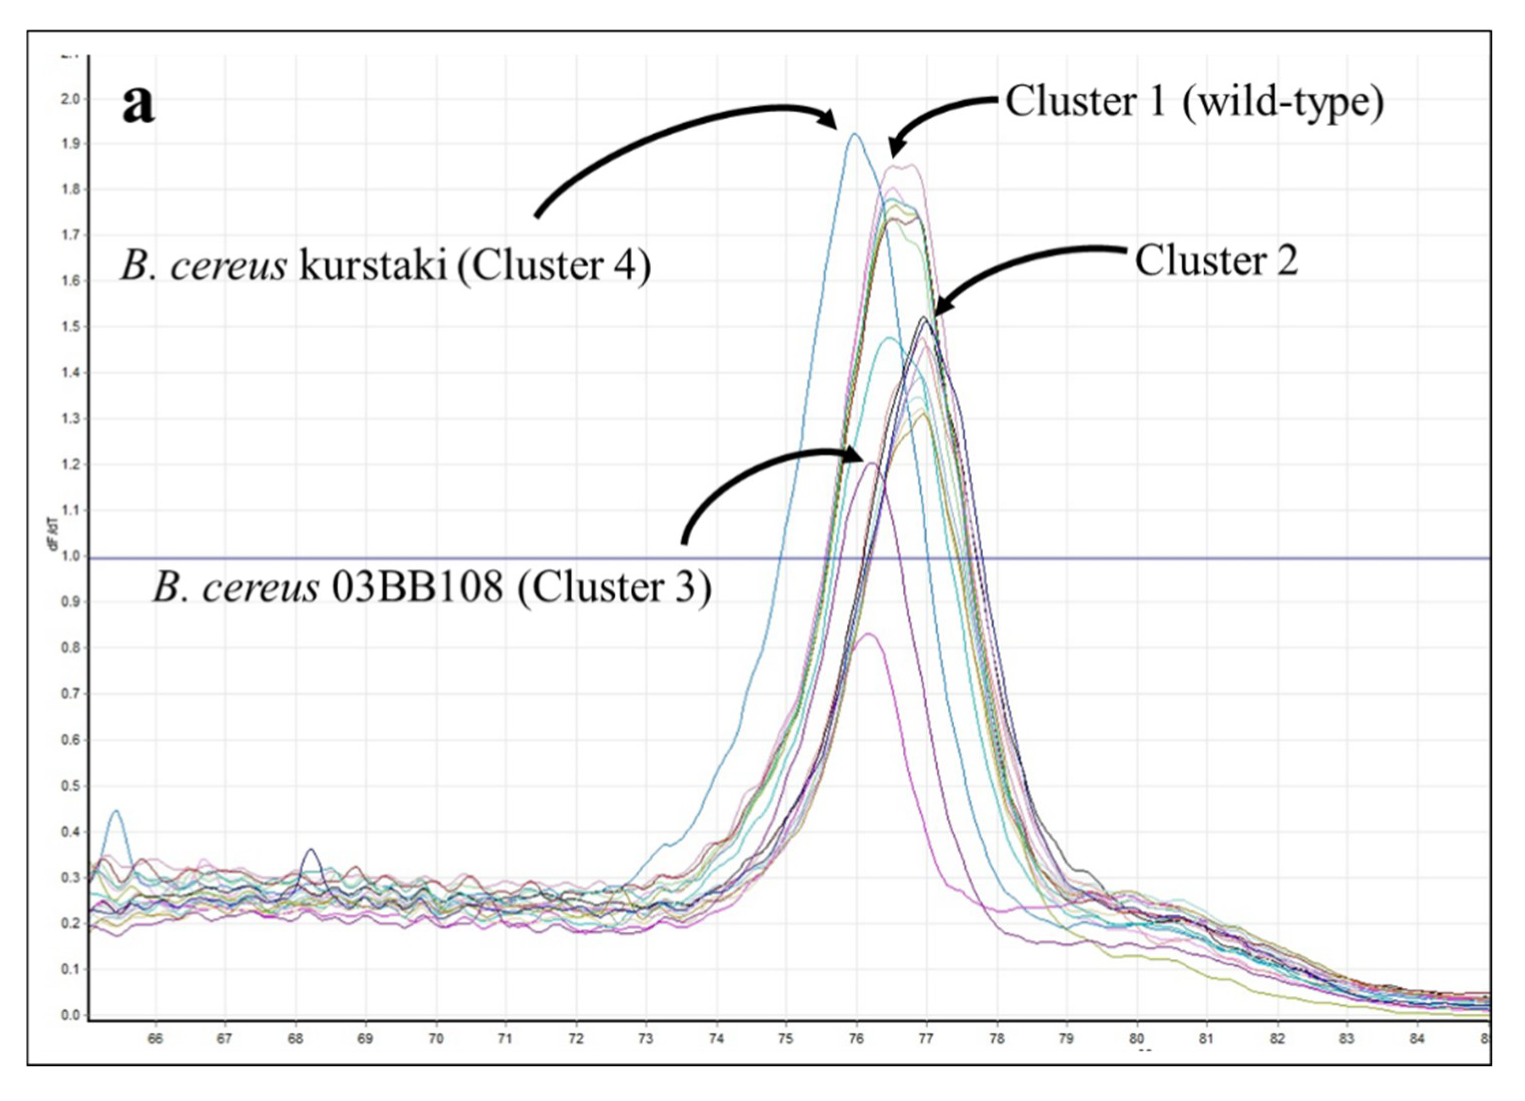
2.2.3. Bacillus spp.

HRMA was performed on DNA preparations from 37 B. anthracis strains. This sample set included DNA preparations from both 18 wild-type strains and 19 plasmid-cured strains selected for development of high-level ciprofloxacin resistance [6] to assess whether documented mutations within gyrA and parC QRDRs could be detected.
In HRMA for gyrA, all B. anthracis wild-type strains produced Tms in the range of 75.9 °C to 76.2 °C, whereas Tms for B. anthracis gyrA mutants had Tms at least 0.5 °C lower (Figure 8, Table 7). Principal component analysis yielded three clusters: wild-type strains (Cluster 1 = wt), Cluster 2 with most gyrA-mutant strains, and Cluster 3 comprising two samples with significantly lower Tms (mutant strains S3-5 and S3-15). Interestingly, strain S3-16 has two mutations in gyrA (C254→T and A266→C) that should thermodynamically balance each other; Loveless previously observed that this strain clustered with wild-type B. anthracis [34]. However, in our hands, this strain was found in Cluster 2 with other C/G→A/T-mutated B. anthracis strains (Table 7). Unpublished sequences of the targeted loci (S. Sozhamannan, C. Bernhards personal communication, manuscript in preparation) support clustering of the remaining mutants not previously described [6,34] away from wild-type B. anthracis.
HRMA and clustering of the same set of B. anthracis samples based on parC sequences were complicated by higher PCR failure rates and a narrower temperature range between Tms of wild-type and mutant amplicons. Furthermore, Tms for control strains could shift from day to day by as much as 0.5 °C, making it difficult to compare samples tested on different days, other than to indicate that they clustered with (or separate from) specific control samples (see footnote to Table 7).
Most of the B. anthracis strains with documented parC mutations clustered separately from wild-type B. anthracis (Figure 9; Table 7, Clusters 2A, 3A, 3B). Decreased Tms observed with mutant strains were consistent with C242→T changes. However, in contrast to previous observations [34], two strains that should have wild-type parC genes (S1-1 and S1-2 [6]) clustered separately from wild-type strains, with strain S1-2 as the sole member of Cluster 3A. From the melt curve, it is unclear why this sample clusters separately from all other strains tested. However, as with the gyrA results, unpublished sequences of the remaining mutants (S2-1 through S3-18) support their exclusion from the wild-type cluster (S. Sozhamannan, C. Bernhards, personal communication; manuscript in preparation).
Twelve B. cereus and eight B. thuringiensis strains were also analyzed by HRMA to determine whether their gyrA and parC sequences were sufficiently similar to B. anthracis to allow robust amplification, for species discrimination, and for detection of QRDR mutants.
Almost two-thirds (14/19) of the near neighbor strains clustered closely with wild-type B. anthracis (cluster 1) in gyrA assays (Table 8). Two additional clusters were comprised of five strains (cluster 2) and a single strain (cluster 3) with Tms that were 1–1.5 °C higher than the wild-type B. anthracis cluster (Figure 10). Cluster 2 represented four strains distantly related to B. anthracis (B. thuringiensis kurstaki, morrisoni, israelensis, and B. cereus ATCC 10876) and B. cereus E33L. Although closely related to B. anthracis, [42], E33L’s published sequence has, like other strains clustering with it, a T→C substitution within the interrogated sequence (Figure 10); this substitution—though in a location different from the others—would be expected to cause an increase in Tm. The published sequence for B. cereus 4342 shows two T→C substitutions within the interrogated sequence, which may explain its larger increase in Tm and formation of its own outlying cluster.
In parC HRMA assays, roughly half of both B. cereus and B. thuringiensis strains clustered with wild-type B. anthracis controls (cluster 1) and most of the remainders formed a separate cluster (cluster 2). There were two outliers: B. cereus 03BB108 clustered with B. anthracis mutant S3-5 (cluster 3) and B. thuringiensis kurstaki formed its own cluster (cluster 4) (Table 8). Comparisons of published sequences (Figure 11) support our hypothesis that strains with sequences identical to the reference should—and do—cluster with B. anthracis wild-type, while those with a T→C change in the interrogated region should have higher Tms and cluster separately (cluster 2; Figure 11). Similarly, B. thuringiensis kurstaki, having a predicted C→T substitution, should produce an amplicon with a lower Tm, which we observed here (cluster 4). It is unclear, however, why B. cereus 03BB108 (predicted T→C substitution) produced an amplicon with lower Tm and did not fall within cluster 2. For this strain—and all of these near neighbors—it is possible that various substitutions within the primed regions affected the melt curves in ways that could not always be predicted.
We did not have access to Y. pestis or F. tularensis strains with known mutations causing ciprofloxacin resistance in this study. Therefore, we were unable to assess whether HRMA could be used to discriminate between wild-type and resistant strains within these two genera. Fortunately, we were clearly able to distinguish between wild-type and mutant strains of B. anthracis in a readily observed and relatively predictable fashion.
Furthermore, in spite of numerous failures in parC amplifications, clustering of most near neighbor species for gyrA, parC, and parE in all three genera could be predicted through comparisons of the sequences targeted. F. tularensis could be easily discriminated from F. philomiragia based on gyrA, but not parE melt curves, potentially due to the short (5-nt) parE sequence targeted. Similarly, as expected, all Y. pestis and wild-type B. anthracis clustered with most, but not all, near neighbor strains having identical target sequences, though some anomalous clustering was observed (e.g., Y. pseudotuberculosis strains AMC TB4 and IP32983, B. cereus 03BB108). It is certainly possible that the unpredictable clustering may simply have been due to noisy data [43]. More likely, these anomalous results likely represent contaminants within the samples or errors introduced through use of whole genome amplicons in these HRMA studies. While φ29 DNA polymerase is much less prone to errors than other DNA polymerases, any errors introduced in the targeted QRDRs (or even potentially within the primer regions) could result in anomalous melt curves and subsequent clustering. A final possibility is that these anomalies may be due to spontaneous mutations or genetic drift. Assessment of this possibility would require additional amplicon sequencing, which was not performed here.

3. Materials and Methods

3.1. Materials

All genomic materials were obtained from Unified Culture Collection (UCC) of the Defense Biological Product Assurance Office (DBPAO), Frederick, MD USA and were provided as purified, certified inactive preparations previously extracted using Epicentre MasterPure DNA Purification kits (Lucigen Corporation, Middletown, WI, USA). Francisella spp., Yersinia spp., and Bacillus spp. strains used in this study are shown in Table 9, Table 10, Table 11, Table 12 and Table 13. Forty-six of the DNA preparations were derived from Select Agent Strains, as indicated.

3.2. Microarray Analysis Using the ARDM v.3.1

Illustra GenomiPhi HY kits (GE Healthcare, Pittsburgh, PA, USA) were used to amplify preparations of genomic DNA from each strain per the manufacturer’s instructions, using 10 ng of starting material. An amplification time of 90 min at 30 °C was used, followed by a 10 min enzyme inactivation step at 95 °C. After quantification using Qubit 2.0 fluorometer (Thermofisher, Rockland, IL, USA), amplicons were subjected a combined fragmentation/biotin-labeling step using the Bionick DNA-Labeling System (ThermoFisher); this method has proven superior to sequential fragmentation and biotinylation for subsequent microarray analysis on the ARDM [52]. Each reaction ─ sufficient for hybridization on two sub-arrays ─ used 3.2 µg whole genome amplicon in a final volume of 40 µL; reactions were incubated for 1–1.5 h at 16 °C before addition of 5 µL Stop Buffer. Twenty-two microliters of 3× hybridization buffer (18× SSPE/0.15% Tween-20/60 mM EDTA/300 ng/µL denatured salmon sperm DNA) was then added to each sample, samples were heated to 95 °C for 3 min, and cooled on ice for 3 min before loading on hydrated microarrays previously incubated for at least 30 min at 60 °C in prehybridization buffer (6× SSPE/0.05% Tween-20/20 mM EDTA/5×Denhardt’s solution/0.05% SDS/100 ng/µL denatured salmon sperm DNA; 30 µL per sub-array; Customarray, Bothell, WA, USA). After overnight hybridization at 60 °C, microarrays were washed twice at 60 °C in 3× SSPET (3× SSPE/0.05% Tween-20), twice at room temperature with 0.5× SSPET (0.5× SSPE/0.05% Tween-20), and twice at room temperature with PBST Wash (2× PBS/0.1% Tween-20). Arrays were then treated sequentially for 15 min with Biotin Blocking Solution (Customarray), and then 30 min with polymeric horseradish peroxidase-streptavidin conjugate (Cat. No. 65R-S104PHRP [Fitzgerald, Acton, MA, USA], diluted 1:1000 in PBS/10 mg/mL bovine serum albumin/0.05% Tween-20). Microarrays were then washed three times (5 min each wash) with PBST Wash Solution (Customarray) and finally interrogated as previously described [27,52].
The ARDM v.3.1 has a total of four subarrays (two pairs of identical subarrays, 2240 probes/subarray). The subarrays are based on two previous versions—ARDM v.2 (238 AMR determinants) [27,53,54], and ARDM v.3 (542 AMR determinants) [28]—and was re-designed to remove non-relevant or redundant content and emphasize AMR-related content from Select Agents. Each microarray slide could therefore analyze two samples (each sample = two subarrays). Each determinant on the microarray was represented by 8–10 probes, typically corresponding to 4–5 duplicate pairs of probes. Samples were called positive for a gene if signals from half of the gene’s probes exceeded the 95% threshold (mean signal from lowest 2128 probes + 3 standard deviations, SD) or if ≥70% of the probes had signals exceeding two lower stringency thresholds [29]. Using a combination of these thresholds has allowed us to detect families of closely related genes using probes with minor mismatches.

3.3. High Resolution Melt Analysis (HRMA)

The HRMA protocol, primers, and conditions used here were based on those described by Loveless [34] and are shown in Table 14. The analyses were performed using Type-it HRMA PCR kit (cat#206542, Qiagen, Germantown, MD, USA). The total volume of HRMA reactions was 25 µL and the reaction mixes were prepared according to the manufacturer instructions. Final concentrations of the primers (Eurofins/Operon, Louisville, KY, USA) in the reaction mix were 0.7 µM; template DNA was added to achieve the final concentration of approximately 100 pg/µL. The HRMA PCRs were performed on Rotor-Gene Q MDx (Qiagen, Hilden, Germany) using the following cycling conditions: 5 min at 95 °C, followed by 45 cycles of (10 s at 95 °C, 30 s at 55 °C), ending with melt curve generation (65 °C to 95 °C at 0.1 °C increments, 2 s each). Samples with Ct > 35 cycles or without sigmoidal amplification curves were called negative or invalid, respectively. Melt curves of valid amplifications were analyzed and clustering performed using ScreenClust software with unsupervised cluster analysis [55].

4. Conclusions

Both PCR and microarrays are valuable tools for the tracking the genetic underpinnings of AMR resistance. Here, we used two complementary technologies—microarray analysis and HRMA—to survey 127 Select Agents, exempt strains, and near-neighbor species for a broad variety of resistance mechanisms acquired through both horizontal transfer and gene mutations. To our knowledge, this is the largest survey of Category A agents, exempt strains, and near-neighbor species for genes covering multiple mechanisms of AMR.
Both of the methods used here had benefits and limitations. The broad detection capabilities of the microarray analysis enabled detection of the genes that we expected to find within the Select Agent species for all three genera. We further detected a non-native gene within a Select Agent strain (KIM (pCD1Ap)+) and detected families of similar genes in near-neighbor species; detection of these related genes was highly dependent on the phylogenetic distance (and hence, sequence conservation) between the near neighbor species and the species from which the reference sequence was derived. However, each microarray analysis is only as good as its content, and while its content is relatively comprehensive (500+ AMR genes), the ARDM v.3.1 is certainly not all-encompassing and is unable to detect small mutations that can affect specificity. HRMA, on the other hand, was able to rapidly discriminate between ciprofloxacin-resistant B. anthracis strains with point mutations within QRDRs of gyrA and parC, though several strains clustered anomalously (albeit separately from wild-type strains). One limitation of HRMA is that each reaction must be designed for each target sequence and reactions are not easily multiplexable. Furthermore, changes in DNA sequence detectable by HRMA do not always represent a change in amino acid sequence, and near-neighbor species may be erroneously identified as resistant mutants.
Provided suitable sensitivity can be achieved and data processing simplified, this is where rapidly evolving technologies such as next generation sequencing (NGS) may find tremendous application [56]. Several excellent studies have recently demonstrated use of targeted pyrosequencing and next generation sequencing approaches to rapid detect and identify both horizontally and vertically transmitted AMR determinants within Select Agent strains [57,58,59]. While these recent studies emphasized a limited number of AMR genes, we hope that these technologies will prove useful in performing similarly broad-based surveys of Select Agents and other pathogenic species.

Author Contributions

Conceptualization, C.R.T., T.A.L., M.J.G., S.S., D.L.D.; methodology, C.R.T., T.A.L., M.J.G.; validation, C.R.T., T.A.L., S.S.; formal analysis, C.R.T., T.A.L.; investigation, C.R.T., T.A.L., A.C., K.L.B., M.J.G.; resources, K.L.B., R.W.D., S.S., K.G.F., D.L.D.; data curation, C.R.T., S.S.; writing—original draft preparation, C.R.T.; writing—review and editing, C.R.T., T.A.L., A.C., K.L.B., R.W.D., M.J.G., S.S., K.G.F., D.L.D., G.J.V.; visualization, C.R.T., T.A.L.; supervision, C.R.T., D.L.D.; project administration, C.R.T., D.L.D., G.J.V.; funding acquisition, C.R.T., M.J.G., S.S., D.L.D., G.J.V. All authors have read and agreed to the published version of the manuscript.

Funding

This research was supported by the Defense Threat Reduction Agency (grant number CB10146) and the Office of Naval Research via NRL core funds.

Acknowledgments

The authors would like to express their gratitude to Eric I. Thompson, DBPAO, for the many hours spent enabling us to receive and work with these DNA preparations.

Conflicts of Interest

The authors declare no conflict of interest. DTRA was active in both the research design and project management, and in preparation of the manuscript. This manuscript is approved for public release: distribution is unlimited.

Abbreviations

AMRAntimicrobial resistance
ARDMAntimicrobial Resistance Determinant Microarray
ASTAntimicrobial susceptibility testing
BCBacillus cereus
BTBacillus thuringiensis
CHLChloramphenicol
CIPCiprofloxacin
CLIClindamycin
DORDoripenem
DOXDoxycycline
GMGentamicin
HRMAHigh resolution melt analysis
IPMImipenem
LVXLevofloxacin
LZDLinezolid
MDRMultidrug resistance
MEMMeropenem
MXFMoxifloxacin
QRDRQuinolone resistance-determining region
RIFRifampin
STRStreptomycin

References

  1. Centers for Disease Control and Prevention. Antibiotic Resistance Threats in the United States; US Department of Health and Human Services, CDC: Atlanta, GA, USA, 2019.
  2. World Health Organization. The Evolving Threat of Antimicrobial Resistance—Options for Action; WHO: Geneva, Switzerland, 2012. [Google Scholar]
  3. National Research Council of the National Academies. Department of Homeland Security Bioterrorism Risk Assessment: A Call for Change; National Academies Press: Washington, DC, USA, 2008. [Google Scholar]
  4. Athamna, A.; Athamna, M.; Abu-Rashed, N.; Medlej, B.; Bast, D.J.; Rubinstein, E. Selection of Bacillus anthracis isolates resistant to antibiotics. J. Antimicrob. Chemother. 2004, 54, 424–428. [Google Scholar] [CrossRef] [Green Version]
  5. Caspar, Y.; Maurin, M. Francisella tularensis susceptibility to antibiotics: A comprehensive review of the cata obtained in vitro and in animal models. Front. Cell. Infect. Microbiol. 2017, 7, 122. [Google Scholar] [CrossRef] [PubMed] [Green Version]
  6. Price, L.B.; Vogler, A.; Pearson, T.; Busch, J.D.; Schupp, J.M.; Keim, P. In vitro selection and characterization of Bacillus anthracis mutants with high-level resistance to ciprofloxacin. Antimicrob. Agents Chemother. 2003, 47, 2362–2365. [Google Scholar] [CrossRef] [Green Version]
  7. Brook, I.; Elliott, T.B.; Pryor, H.I.; Sautter, T.E.; Gnade, B.T.; Thakar, J.H.; Knudson, G.B. In vitro resistance of Bacillus anthracis Sterne to doxycycline, macrolides and quinolones. Int. J. Antimicrob. Agents 2001, 18, 559–562. [Google Scholar] [CrossRef]
  8. Jaing, C.J.; McLoughlin, K.S.; Thissen, J.B.; Zemla, A.; Gardner, S.N.; Vergez, L.M.; Bourguet, F.; Mabery, S.; Fofanov, V.Y.; Koshinskiy, H.; et al. Identification of genome-wide mutations in ciprofloxacin-resistant F. tularensis LVS using whole genome tiling arrays and next generation sequencing. PLoS ONE 2016, 11, e0163458. [Google Scholar]
  9. Sutera, V.; Levert, M.; Burmeister, W.P.; Schneider, D.; Maurin, M. Evolution toward high-level fluoroquinolone resistance in Francisella species. J. Antimicrob. Chemother. 2013, 69, 101–110. [Google Scholar] [CrossRef] [PubMed] [Green Version]
  10. Plague—Resources for Clinicians. Available online: www.cdc.gov/plague/heathcare/clinicians.html (accessed on 20 November 2019).
  11. Hendricks, K.A.; Wright, M.E.; Shadomy, S.V.; Bradley, J.S.; Morrow, M.G.; Pavia, A.T.; Rubinstein, E.; Holty, J.-E.; Messonnier, N.E.; Smith, T.L.; et al. Centers for Disease Control and Prevention expert panel meetings on prevention and treatment of anthrax in adults. Emerg. Infect. Dis. 2014, 20, e130687. [Google Scholar] [CrossRef] [PubMed]
  12. Gilbert, D.N.; Chambers, H.F.; Eliopoulos, G.M.; Saag, M.S. The Sanford Guide to Antimicrobial Therapy 2014, 44th ed.; Antimicrobial Therapy Inc.: Sperryville, VA, USA, 2014. [Google Scholar]
  13. Galimand, M.; Carniel, E.; Courvalin, P. Resistance of Yersinia pestis to antimicrobial agents. Antimicrob. Agents Chemother. 2006, 50, 3233–3236. [Google Scholar] [CrossRef] [PubMed] [Green Version]
  14. Galimand, M.; Guiyoule, A.; Gerbaud, G.; Rasoamanana, B.; Chaneau, S. Multidrug resistance in Yersinia pestis mediated by a transferrable plasmid. N. Engl. J. Med. 1997, 337, 667–680. [Google Scholar] [CrossRef] [PubMed]
  15. Guiyoule, A.; Rasoamanana, B.; Buchreise, C.; Michel, P.; Chanteau, S.; Carniel, E. Recent emergence of new variants of Yersinia pestis in Madagascar. J. Clin. Microbiol. 1997, 35, 2826–2833. [Google Scholar] [CrossRef] [PubMed] [Green Version]
  16. Rasoamanana, B.; Leroy, F.; Raharimanana, C.; Chanteau, S. Surveillance de la sensibilite aux antibiotiques des souches de Y. pestis a Madagascar de 1989 a 1995. Archives de l’Institut Pasteur de Madagascar 1995, 62, 108–110. [Google Scholar]
  17. Vogler, A.J.; Chan, F.; Wagner, D.M.; Roumagnac, P.; Lee, J.; Nera, R.; Eppinger, M.; Ravel, J.; Rahalison, L.; Rasoamanana, B.W.; et al. Phylogeography and molecular epidemiology of Yersinia pestis in Madagascar. PLoS Negl. Trop. Dis. 2011, 5, e1319. [Google Scholar] [CrossRef] [PubMed]
  18. Urich, S.K.; Chalcraft, L.; Schriefer, M.E.; Yockey, B.M.; Petersen, J.M. Lack of antimicrobial resistance in Yersinia pestis isolates from 17 countries in the Americas, Africa, and Asia. Antimicrob. Agents Chemother. 2012, 56, 555. [Google Scholar] [CrossRef] [PubMed] [Green Version]
  19. Randremanana, R.; Andrianaivoarimanana, V.; Nikolay, B.; Ramasindrazana, B.; Paireau, J.; ten Bosch, Q.A.; Rakotondramanga, J.M.; Rahajandraibe, S.; Rahelinirina, S.; Rakotomanana, F.; et al. Epidemiological characteristics of an urban plague epidemic in Madagascar, August-November, 2017: An outbreak report. Lancet Infect. Dis. 2019, 19, 537–545. [Google Scholar] [CrossRef] [Green Version]
  20. Guiyoule, A.; Gerbaud, G.; Buchrieser, C.; Galimand, M.; Rahalison, L.; Chanteau, S.; Courvalin, P.; Carniel, E. Transferable plasmid-mediated resistance to streptomycin in a clinical isolate of Yersinia pestis. Emerg. Infect. Dis. 2001, 7, 43–48. [Google Scholar] [CrossRef] [Green Version]
  21. Zakharenko, V.I.; Gorelov, V.N.; Seliutina, D.F.; Kulakov, I.K.; Nenashev, A.V.; Skavronskaia, A.G. Functional properties of the pOV13 plasmid as a vector for DNA cloning in a broad spectrum of Gram-negative bacteria. Mol. Gen. Mikrobiol. Virusol. 1990, 1990, 22–26. [Google Scholar]
  22. Liu, J.; Zogaj, X.; Barker, J.R.; Klose, K.E. Construction of targeted insertion mutations in Francisella tularensis subsp. novicida. BioTechniques 2007, 43, 487–490. [Google Scholar] [CrossRef] [Green Version]
  23. Obrist, M.W.; Miller, V.L. Low copy expression vectors for use in Yersinia sp. and related organisms. Plasmid 2012, 68, 33–42. [Google Scholar] [CrossRef] [Green Version]
  24. Oster, C.J. New Tools for Studying Mal Gene Regulation in Yersinia Pestis. Master’s Thesis, Iowa State University, Ames, IA, USA, 2012. [Google Scholar]
  25. Bina, X.R.; Miller, M.A.; Bina, J.E. Construction of a bioluminescence reporter plasmid for Francisella tularensis. Plasmid 2010, 64, 156–161. [Google Scholar] [CrossRef] [Green Version]
  26. Saldanha, R.J.; Pemberton, A.; Shiflett, P.; Perutka, J.; Whitt, J.T.; Ellington, A.; Lambowitz, A.M.; Kramer, R.; Taylor, D.; Lamkin, T.J. Rapid targeted gene disruption in Bacillus anthracis. BMC Biotechnol. 2013, 13, 72. [Google Scholar] [CrossRef] [Green Version]
  27. Taitt, C.R.; Leski, T.A.; Stockelman, M.; Craft, D.W.; Zurawski, D.V.; Kirkup Jr, B.C.; Vora, G.J. Antimicrobial resistance determinants in Acinetobacter baumannii isolates taken from military treatment facilities. Antimicrob. Agents Chemother. 2014, 58, 767–781. [Google Scholar] [CrossRef] [Green Version]
  28. Heang, V.; Hout, B.; Prouty, M.G.; Supraprom, C.; Ford, G.W.; Newell, S.W.; Leski, T.A.; Vora, G.J.; Taitt, C.R. Detection of qnrVC and rmtB from a multidrug-resistant Ralstonia pickettii wound infection isolate in Cambodia. Int. J. Antimicrob. Agents 2014, 44, 84–85. [Google Scholar] [CrossRef]
  29. Leski, T.A.; Vora, G.J.; Barrows, B.R.; Pimentel, G.; House, B.L.; Nicklasson, M.; Wasfy, M.; Abdel-Maksoud, M.; Taitt, C.R. Molecular characterization of multidrug resistant hospital isolates using the Antimicrobial Resistance Determinant Microarray. PLoS ONE 2013, 8, e69507. [Google Scholar] [CrossRef] [Green Version]
  30. Achtman, M.; Zurth, K.; Morelli, G.; Torrea, G.; Guiyoule, A.; Carniel, E. Yersinia pestis, the cause of plague, is a recently emerged clone of Yersinia pseudotuberculosis. Proc. Nat. Acad. Sci. USA 1999, 96, 14043–14048. [Google Scholar] [CrossRef] [PubMed] [Green Version]
  31. Gong, S.; Bearden, S.W.; Geoffroy, V.A.; Fetherston, J.D.; Perry, R.D. Characterization of the Yersinia pestis Yfu ABC inorganic iron transport system. Infect. Immun. 2001, 69, 2829–2837. [Google Scholar] [CrossRef] [PubMed] [Green Version]
  32. Hill, K.K.; Ticknor, L.O.; Okinaka, R.T.; Asay, M.; Blair, H.; Bliss, K.A.; Laker, M.; Pardington, P.E.; Richardson, A.P.; Tonks, M.; et al. Fluorescent amplified fragment length polymorphism analysis of Bacillus anthracis, Bacillus cereus, and Bacillus thuringiensis isolates. Appl. Environ. Microbiol. 2004, 70, 1068–1080. [Google Scholar] [CrossRef] [PubMed] [Green Version]
  33. Hoffmaster, A.R.; Hill, K.K.; Gee, J.E.; Marston, C.K.; De, B.K.; Popovic, T.; Sue, D.; Wilkins, P.P.; Avashia, S.B.; Drumgoole, R.; et al. Characterization of Bacillus cereus isolates associated with fatal pneumonias: Strains are closely related to Bacillus anthracis and harbor B. anthracis virulence genes. J. Clin. Microbiol. 2006, 44, 3352. [Google Scholar] [CrossRef] [Green Version]
  34. Loveless, B.M.; Yermakova, A.; Christensen, D.R.; Kondig, J.P.; Heine, H.S.; Wasieloski, L.P.; Kulesh, D.A. Identification of ciprofloxacin resistance by SimpleProbe, high resolution melt and pyrosequencing nucleic acid analysis in biothreat agents: Bacillus anthracis, Yersinia pestis and Francisella tularensis. Mol. Cell. Probes 2010, 24, 154–160. [Google Scholar] [CrossRef]
  35. La Scola, B.; Elkarkouri, K.; Li, W.; Wahab, T.; Fournous, G.; Rolain, J.-M.; Biswas, S.; Drancourt, M.; Robert, C.; Audic, S.; et al. Rapid comparative genomic analysis for clinical microbiology: The Francisella tularensis paradigm. Genome Res. 2008, 18, 742–750. [Google Scholar] [CrossRef] [Green Version]
  36. Heine, H.S.; Miller, L.; Halasohoris, S.; Purcell, B.K. In vitro antibiotic susceptibilities of Francisella tularensis determined by both microdilution following CLSI methods. Antimicrob. Agents Chemother. 2017, 61, e00612-17. [Google Scholar] [CrossRef] [Green Version]
  37. Hurtle, W.; Lindler, L.; Fan, W.; Shoemaker, D.; Henchal, E.; Norwood, D. Detection and identification of ciprofloxacin-resistant Yersinia pestis by denaturing high-performance liquid chromatography. J. Clin. Microbiol. 2003, 41, 3273–3283. [Google Scholar] [CrossRef] [PubMed] [Green Version]
  38. Lindler, L.E.; Fan, W.; Jahan, N. Detection of ciprofloxacin-resistant Yersinia pestis by fluorogenic PCR using the LightCycler. J. Clin. Microbiol. 2001, 39, 3649–3655. [Google Scholar] [CrossRef] [PubMed] [Green Version]
  39. Gargis, A.S.; Cherney, B.; Conley, A.B.; McLaughlin, H.P.; Sue, D. Rapid detection of genetic engineering, structural variation, and antimicrobial resistance markers in bacterial biothreat pathogens by nanopore sequencing. Sci. Rep. 2019, 9, 13501. [Google Scholar] [CrossRef] [PubMed]
  40. Steinberger-Levy, I.; Shifman, O.; Zvi, A.; Ariel, N.; Beth-Din, A.; Israeli, O.; Gur, D.; Aftalion, M.; Maoz, S.; Ber, R. A rapid molecular test for determining Yersinia pestis susceptibility to ciprofloxacin by the quantification of differentially expressed marker genes. Front. Microbiol. 2016, 7, 763. [Google Scholar] [CrossRef]
  41. Heine, H.S.; Hershfield, J.; Marchand, C.; Miller, L.; Halasohoris, S.; Purcell, B.K.; Worsham, P.L. In vitro antibiotic susceptibilities of Yersinia pestis determined by broth microdilution following CLSI methods. Antimicrob. Agents Chemother. 2015, 59, 1919–1921. [Google Scholar] [CrossRef] [Green Version]
  42. Han, C.S.; Xie, G.; Challacombe, J.F.; Altherr, M.R.; Bhotika, S.S.; Brown, N.; Bruce, D.; Campbell, C.S.; Campbell, M.L.; Chen, J.; et al. Pathogenomic sequence analysis of Bacillus cereus and Bacillus thuringiensis isolates closely related to Bacillus anthracis. J. Bacteriol. 2006, 188, 3382–3390. [Google Scholar] [CrossRef] [Green Version]
  43. Milligan, G. An examination of the effect of six types of error perturbation on fifteen clustering algorithms. Psychometrika 1980, 45, 325–342. [Google Scholar] [CrossRef]
  44. Johnson, S.L.; Daligault, H.E.; Davenport, K.W.; Coyne, S.R.; Frey, K.G.; Koroleva, G.I.; Broomall, S.M.; Bishop-Lilly, K.A.; Bruce, D.C.; Chertkov, O.; et al. Genome sequencing of 18 Francisella strains to aid in assay development and testing. Genome Announc. 2015, 3, e00147-15. [Google Scholar] [CrossRef] [Green Version]
  45. Davenport, K.W.; Daligault, H.E.; Minogue, T.D.; Bishop-Lilly, K.A.; Broomall, S.M.; Bruce, D.C.; Chain, P.S.; Coyne, S.R.; Frey, K.G.; Gibbons, H.S.; et al. Whole-genome sequences of nine Francisella isolates. Genome Announc. 2014, 2, e00941-14. [Google Scholar] [CrossRef]
  46. Johnson, S.L.; Daligault, H.E.; Davenport, K.W.; Jaissle, J.; Frey, K.G.; Ladner, J.T.; Broomall, S.M.; Bishop-Lilly, K.A.; Bruce, D.C.; Coyne, S.R.; et al. Thirty-two complete genome assemblies of nine Yersinia species, including Y. pestis, Y. pseudotuberculosis, and Y. enterocolitica. Genome Announc. 2015, 3, e00148-15. [Google Scholar] [CrossRef] [Green Version]
  47. Daligault, H.E.; Davenport, K.W.; Minogue, T.D.; Bishop-Lilly, K.A.; Broomall, S.M.; Bruce, D.C.; Chain, P.S.; Coyne, S.R.; Frey, K.G.; Gibbons, H.S.; et al. Whole-genome Yersinia sp. assemblies from 10 diverse strains. Genome Announc. 2014, 2, e01055-14. [Google Scholar] [CrossRef] [PubMed] [Green Version]
  48. Johnson, S.L.; Minogue, T.D.; Daligault, H.E.; Wolcott, M.J.; Teshima, H.; Coyne, S.R.; Davenport, K.W.; Jaissle, J.G.; Chain, P.S. Finished genome assembly of Yersinia pestis EV76D and KIM 10v. Genome Announc. 2015, 3, e01024-15. [Google Scholar] [CrossRef] [PubMed] [Green Version]
  49. Johnson, S.L.; Daligault, H.E.; Davenport, K.W.; Jaissle, J.; Frey, K.G.; Ladner, J.T.; Broomall, S.M.; Bishop-Lilly, K.A.; Bruce, D.C.; Gibbons, H.S.; et al. Complete genome sequences for 35 biothreat assay-relevant Bacillus species. Genome Announc. 2015, 3, e00151-15. [Google Scholar] [CrossRef] [PubMed] [Green Version]
  50. Daligault, H.E.; Davenport, K.W.; Minogue, T.D.; Bishop-Lilly, K.A.; Broomall, S.M.; Bruce, D.C.; Chain, P.S.; Coyne, S.R.; Frey, K.G.; Gibbons, H.S.; et al. Twenty whole-genome Bacillus sp. assemblies. Genome Announc. 2014, 2, e00958-14. [Google Scholar] [CrossRef] [Green Version]
  51. Challacombe, J.F.; Altherr, M.R.; Xie, G.; Bhotika, S.S.; Brown, N.; Bruce, D.; Campbell, C.S.; Campbell, M.L.; Chen, J.; Chertkov, O.; et al. The complete genome sequence of Bacillus thuringiensis Al Hakam. J. Bacteriol. 2007, 189, 3680–3681. [Google Scholar] [CrossRef] [Green Version]
  52. Taitt, C.R.; Leski, T.A.; Colston, S.M.; Bernal, M.; Canal, E.; Regeimbal, J.; Rios, P.; Vora, G.J. A comparison of methods for DNA preparation prior to microarray analysis. Anal. Biochem. 2019, 585, 113405. [Google Scholar] [CrossRef]
  53. Taitt, C.R.; Leski, T.A.; Erwin, D.P.; Odundo, E.A.; Kipkemoi, N.C.; Ndonye, J.N.; Kirera, R.K.; Ombogo, A.N.; Walson, J.L.; Pavlinac, P.B.; et al. Antimicrobial resistance of Klebsiella pneumoniae stool isolates circulating in Kenya. PLoS ONE 2017, 12, e0178880. [Google Scholar] [CrossRef] [Green Version]
  54. Taitt, C.R.; Leski, T.A.; Heang, V.; Ford, G.W.; Prouty, M.G.; Newell, S.W.; Vora, G.J. Antimicrobial resistance genotypes and phenotypes from multidrug-resistant bacterial wound infection isolates in Cambodia. J. Glob. Antimicrob. Resist. 2015, 3, 198–204. [Google Scholar] [CrossRef] [Green Version]
  55. Reja, V.; Kwok, A.; Stone, G.; Yang, L.; Missel, A.; Menzel, C.; Bassam, B. ScreenClust: Advanced statistical software for supervised and unsupervised high resolution melting (HRM) analysis. Methods 2010, 50, S10–S14. [Google Scholar] [CrossRef]
  56. Minogue, T.D.; Koehler, J.W.; Stefan, C.P.; Conrad, T.A. Next-generation sequencing for biodefense: Biothreat detection, forensics, and the clinic. Clin. Chem. 2019, 65, 383–392. [Google Scholar] [CrossRef] [Green Version]
  57. Amoako, K.K.; Thomas, M.C.; Kong, F.; Janzen, T.W.; Hahn, K.R.; Shields, M.J.; Goji, N. Rapid detection and antimicrobial resistance gene profiling of Yersinia pestis using pyrosequencing technology. J. Microbiol. Methods 2012, 90, 228–234. [Google Scholar] [CrossRef]
  58. Stefan, C.P.; Koehler, J.W.; Minogue, T.D. Targeted next-generation sequencing for the detection of ciprofloxacin resistance markers using molecular inversion probes. Sci. Rep. 2016, 6, 25904. [Google Scholar] [CrossRef] [Green Version]
  59. Gardner, S.N.; Frey, K.G.; Redden, C.L.; Thissen, J.B.; Allen, J.E.; Allred, A.F.; Dyer, M.D.; Mokashi, V.P.; Slezak, T.R. Targeted amplification for enhanced detection of biothreat agents by next-generation sequencing. BMC Res. Notes 2015, 8, 682. [Google Scholar] [CrossRef] [Green Version]
Figure 1. Content of the ARDM v.3.1: (a) Categories of antimicrobials for which resistance determinants are included in the ARDM v.3.1; (b) Bacterial sources of resistance determinants.
Ijms 21 01669 g001
Figure 2. Source of false-positive calls for cat(pSCS5) in B. anthracis. (a) Sequences of cat(pSCS5) probes derived from S. aureus gene (accession no. M58515). (b) Alignment of probe sequences with B. anthracis cat gene (CP009315) represented on the ARDM v.3.1. The 25-nt sequence with 92% identity to the B. anthracis cat gene is underlined.
Ijms 21 01669 g002
Figure 3. Phylogenetic tree of B. cereus group strains showing locations of B. anthracis, B. cereus (BC), and B. thuringiensis (BT) strains tested (tree based on [32,33]). The number of genes detected in B. cereus and B. thuringiensis strains is correlated to the phylogenetic distance from B. anthracis.
Ijms 21 01669 g003
Figure 4. HRMA—Francisella spp. gyrA. (a) Melt curves for Francisella spp. gyrA amplicons. (b) Comparison of reference gyrA sequence with published sequences from F. philomiragia strains (see Table 9). All F. tularensis strains tested are identical to the reference sequence within the stretch interrogated. Primer sequences are underlined. Arrows indicate nucleotide positions where changes are demonstrated to result in quinolone resistance [34,35]. Sequence differences predicted to result in increased or decreased Tms are highlighted in green and yellow, respectively.
Ijms 21 01669 g004
Figure 5. HRMA—Francisella spp. parE. (a) Melt curves for Francisella spp. parE amplicons. (b) Comparison of reference parE sequence with published sequences for the F. philomiragia strains (see Table 9). All F. tularensis strains tested are 98% identical to the reference sequence within this locus. Primer sequences are underlined. The sequence within the red box indicates the 5-nt deletion of interest [34]; mutations/substitutions predicted to increase or decrease amplicon Tms are highlighted in green or yellow, respectively.
Ijms 21 01669 g005
Figure 6. Melt curves for Yersinia spp. gyrA. All samples, independent of species, had melt curve profiles with Tms centered around 80.0 °C (panels show results obtained on different days). The melt curve for the outlier Y. enterocolitica 8081 is shown on the lower curve; there is no obvious feature responsible for its clustering outside of all other Yersinia spp. strains tested.
Ijms 21 01669 g006
Figure 7. Alignment of interrogated gyrA sequences with published reference sequences from all non-pestis Yersinia spp. strains tested (see Table 11). The Y. pestis reference sequence is shown at the top with primer sequences underlined. Mutations at the positions shown in red have been demonstrated to cause quinolone resistance [37,38]. Sequence substitutions predicted to cause a decrease in Tm are highlighted in yellow. Y. entero = Y. enterocolitica; Y. krist = Y. kristensenii; Y. pseudo = Y. pseudotuberculosis.
Ijms 21 01669 g007
Figure 8. GyrA melt curves for B. anthracis strains. (a) Melt curves for wild-type strains, Sterne and ∆ANR, and gyrA-mutated ∆ANR strains, S1-1, S1-2, S2-1, S2-2, S2-3, S3-1, S3-3, and S3-4. (b) Melt curves for the remainder of wild-type and gyrA-mutated ∆ANR strains (see Table 7).
Ijms 21 01669 g008
Figure 9. ParC melt curves for B. anthracis strains. (a) Melt curves for wild-type strains, Sterne and ∆ANR, and gyrA-mutated ΔANR strains, S1-1, S1-2, S2-1, S2-2, S2-3, S3-1, S3-3, and S3-4. (b) Melt curves for the remainder of wild-type and gyrA-mutated ΔANR strains (see Table 7).
Ijms 21 01669 g009
Figure 10. HRMA—B. cereus and B. thuringiensis gyrA. (a) Melt curves for B. cereus and B. thuringiensis gyrA amplicons. (b) Comparison of reference gyrA sequence with published sequences for the B. cereus (BC) and B. thuringiensis (BT) strains (see Table 13). Primer sequences are underlined; nucleotide substitutions at the locations shown in red have been documented to cause resistance. Substitutions predicted to increase or decrease amplicon Tms are highlighted in green or yellow, respectively.
Ijms 21 01669 g010aIjms 21 01669 g010b
Figure 11. HRMA—B. cereus and B. anthracis parC. (a) Melt curves for B. cereus and B. thuringiensis parC amplicons. (b) Comparison of reference B. anthracis parC sequence with published sequences for the B. cereus (BC) and B. thuringiensis (BT) strains (see Table 13 for accession numbers). Primer sequences are underlined; mutations at the locations shown in red have been documented to cause fluoroquinolone resistance in B. anthracis. Substitutions predicted to increase or decrease amplicon Tms are highlighted in yellow or green, respectively.
Ijms 21 01669 g011aIjms 21 01669 g011b
Table 1. Recommended therapeutic, prophylactic interventions for tularemia, plague, and anthrax.
First Line Therapy 1Alternative TherapyPost-Exposure Prophylaxis
TularemiaSTRGM or tetracycline familyCIP
PlagueSTR or GMCIP, DOX, or CHLCIP or DOX
AnthraxCIP + MEM + LZDLVX (or MXF) + IPM (or DOR) + CLI (or CHL or RIF)CIP or DOX
1 CHL = chloramphenicol; CIP = ciprofloxacin; CLI = clindamycin; DOR = doripenem; DOX = doxycycline; GM = gentamicin; IPM = imipenem; LVX = levofloxacin; LZD = linezolid; MXF = moxifloxacin; MEM = meropenem; RIF = rifampin; STR = streptomycin. Data compiled from [10,11,12].
Table 2. Microarray-detected antimicrobial resistance (AMR) genes in Francisella spp. strains.
StrainResistance Determinants by Class
β-LactamsTetracyclinesMultidrug Efflux Pumps
F. philomiragia (n = 3)
Jensen O#319L, Jensen O#319-036bla1
Jensen O#319-029bla1 bcr/cflA1
F. tularensis (n = 20)
NIH B-38, U112, LVS, DS89-R-54,
DS88-R-675, DS88-R-160,
DS87-R-135, DS88-R-144,
DS87-R-200, DST6755,
DSAL91-1623, DS88-R-147,
SCHU-S4, JAP (Cincinnati), VT68,
strain 425, Scherm, WY96-3418,
GA99-3548, GA99-3549
blaA, blaBtetbcr/cflA1, bcr/cflA2, bcr/cflA3
1 F. philomiragia-derived bla gene.
Table 3. Microarray-detected AMR genes in Yersinia spp. strains.
UCC StrainResistance Determinants by Class
β-LactamsBaci-tracinQuater-nary aminesStrepto-graminsMultidrug Efflux Pumps
Y. pestis (n = 17)
Antigua, Nairobi, PBM19, Pestoides, Pestoides F, Harbin35, Java9, CO92, KIM 10v, Dodson, Shasta, A1122, Pestoides G, Angola, Nicholisk 41, El Dorado 2572-1 bacAqacE emrA, emrB, yegB
KIM (pCD1Ap)+blaTEMbacAqacE emrA, emrB, yegB
Y. pseudotuberculosis (n = 9)
AMC TB4, ATCC 4284, ATCC 6904, IP32953, YPIII, Pa3606, EP2/+, MD67, strain 1 bacAqacE emrA, emrB, yegB
Y. enterocolitica (n = 7)
ATCC 33114, ATCC 55075, E265, DATR, WA, 2516-87 vatF/sat
8081(none)
Other Yersinia spp. (n = 9)
Y. aldovae 670-83
Y. frederiksenii 1461-81 and Y225
Y. intermedia Y228
Y. kristensenii ATCC 33639 and Y231
Y. rohdei ATCC 43380
Y. ruckeri ATCC 29473 and YERS063
(none)
Table 4. Microarray-detected AMR genes in B. cereus group strains.
UCC StrainResistance Determinants by Class
β-LactamsAminoglycosidesMacro-lidesTetra-cyclinesGlyco-peptidesPhenicolsFosfo-mycin
B. anthracis (n = 41)
V770-NP1-R, Ames, Smith 1013, Delta Sterne, Vollum 1B, Zimbabwe 89, Pakistan SK-102, Scotland K1811, BA0052, Canadian Bison, Pasteur, RA3, strain 108, Ohio ACB, Turkey 32, A0435, 2000031021, 2002013094, ΔANR, S1-1, S2-1, S2-3, S3-3, S3-4, S3-5, S3-6, S3-7, S3-8, S3-11, S3-12, S3-17, S3-18bla1, bla2
bla[Vollum1]
bla[Vollum3]
bla[Vollum4]
aacC7, aad[Vollum1]
aad[Vollum2]
aph[Vollum1]
aph[Vollum2]
aph[Vollum3]
mphtetMvanYcatfosB
Vollum, Sterne, South Africa, S1-2, S2-2, S3-1, S3-14, S3-15,
S3-16
bla1, bla2
bla[Vollum1]
bla[Vollum3]
bla[Vollum4]
aacC7, aad[Vollum1]
aad[Vollum2]
aph[Vollum1]
aph[Vollum2]
aph[Vollum3]
mphtetMvanYcat
cap(pSCS5)
fosB
B. cereus (n = 13)
NRRLB-569bla1, bla2
bla[Vollum3]
bla[Vollum4]
aad[Vollum1]
aph[Vollum1]
aph[Vollum3]
tetMvanY
NRL 731bla[Vollum1]
bla[Vollum3]
bla[Vollum4]
aad[Vollum1]
aad[Vollum2]
aph[Vollum1]
aph[Vollum3]
catfosB
PCI 246bla2, bla[Vollum1]
bla[Vollum3]
bla[Vollum4]
aacC7, aad[Vollum1]
aph[Vollum1]
aph[Vollum3]
tetM fosB
F1-15bla1, bla2
bla[Vollum1]
bla[Vollum3]
bla[Vollum4]
aad[Vollum1]
aph[Vollum1]
aph[Vollum3]
tetMvanY fosB
G9241, FM-1bla1, bla2
bla[Vollum1]
bla[Vollum3]
bla[Vollum4]
aad[Vollum1]
aad[Vollum2]
aph[Vollum1]
aph[Vollum2]
aph[Vollum3]
tetM catfosB
4342bla1, bla2, bla[Vollum1]
bla[Vollum3]
bla[Vollum4]
aacC7, aad[Vollum1]
aad[Vollum2]
aph[Vollum1]
aph[Vollum2]
aph[Vollum3]
vanYcatfosB
D17bla2
bla[Vollum1]
bla[Vollum3]
bla[Vollum4]
aacC7, aad[Vollum1]
aad[Vollum2]
aph[Vollum1]
aph[Vollum2]
aph[Vollum3]
mphtetMvanYcatfosB
03BB108bla1, bla2
bla[Vollum3]
bla[Vollum4]
aacC7, aad[Vollum1]
aad[Vollum2]
aph[Vollum1]
aph[Vollum2]
aph[Vollum3]
mphtetMvanYcatfosB
3A, 03BB102, E33L, S2-8bla1, bla2
bla[Vollum1]
bla[Vollum3]
bla[Vollum4]
aacC7, aad[Vollum1]
aad[Vollum2]
aph[Vollum1]
aph[Vollum2]
aph[Vollum3]
mphtetMvanYcatfosB
B. thuringiensis (n = 8)
var israelensisbla[Vollum3]aph[Vollum3]
morrisonibla[Vollum3]aph[Vollum3] cat
kurstakibla1, bla2, bla[Vollum3]aad[Vollum1]
aph[Vollum1]
tetM cat
Al Hakam, 97-27, HD1011, HD682, HD571bla1, bla2, bla[Vollum1], bla[Vollum3], bla[Vollum4]aacC7, aad[Vollum1]
aad[Vollum2]
aph[Vollum1]
aph[Vollum2]
aph[Vollum3]
mphtetMvanYcatfosB
Table 5. High resolution melt analysis (HRMA) melt temperatures and clusters for Francisella spp. strains.
StraingyrAparE
TmClusterTmCluster
F. tularensis
NIH B-3874.92173.001
DS87-R-13574.95173.021
DS88-R-14474.9173.001
JAP (Cincinnati)74.951invalid 1-
WY96-341874.87173.021
GA99-354874.9173.051
GA99-354974.93173.031
F. philomiragia
Jensen O#319L75.98272.831
Jensen O#319-02975.67272.901
Jensen O#319-03676.03273.00, 73.801
1 Did not have characteristic sigmoidal amplification curves.
Table 6. GyrA melt temperatures and clusters for Yersinia spp. strains analyzed by HRMA.
SampleTm 1ClusterSampleTmCluster
Y. pestis
PBM1979.87, 80.151Shasta79.85, 80.11
Pestoides F79.85, 80.21A112279.881
Java979.82, 80.221Pestoides G79.83, 80.221
KIM 10v79.85, 80.181KIM (pCD1Ap)+79.8, 80.21
Dodson79.83, 80.171El Dorado 2572-179.1, 79.83, 80.171
Y. pseudotuberculosis
AMC TB479.13, 79.982Pa360679.881
ATCC 428479.9, 80.171EP2/+79.921
IP3295379.852MD6779.951
YPIII79.91strain 179.882
Y. enterocolitica
ATCC 3311479.9, 80.251WA79.92
ATCC 5507579.85, 80.231808179.953
E26579.87, 80.1812516-8779.971
DATR79.03, 79.872
Other Yersinia spp.
Y. kristensenii ATCC 3363979.85, 80.231Y. kristensenii Y23179.92
Y. ruckeri ATCC 2947379.951Y. frederiksenii Y22579.881
Y. rohdei ATCC 4338079.931Y. aldovae 670-8379.851
Y. ruckeri YERS06379.92Y. intermedia Y22879.92
1 Some samples had multiple Tm values (determined by RotorGene Q series software), based on presence of multiple peaks on melt curves.
Table 7. HRMA melt temperatures and clusters for B. anthracis strains (wild-type and mutant).
StraingyrAparC
GenotypeTmClusterGenotypeTmCluster
V770-NP1-RWt 176.181wt76.48, 76.771
Vollumwt76.21wtinvalid 2-
Sternewt76.151wt76.5, 76.851
Smith 1013wt76.131wt76.451
Delta Sternewt76.151wt76.531
Zimbabwe 89wt76.171wtinvalid-
Pakistan SK-102wt76.21wt76.451
Scotland K1811wt76.21wt76.571
BA0052wt76.081wt76.551
PasteurwtInvalid 2-wt76.521
RA3wt76.151wt76.521
Strain 108wt76.031wt76.551
Ohio ACBwt76.151wt76.551
Turkey 32wt76.181wt76.531
A0435wt76.121wt76.51
2000031021wt76.131wt76.451
2002013094wt76.051wt76.51
∆ANRwt76.151wt76.631
S1-1C254→T 475.432wt75.432A 3
S1-2G265→A75.432wt76.423A
S2-1C254→T75.452C242→T76.452A
S2-2C254→T75.432C242→A76.022A
S2-3C254→T75.452C242→A or G253→A75.92A
S3-1C254→T75.452C242→T75.922A
S3-3 75.422 75.852A
S3-4 75.422 75.92A
S3-5 74.753 76.12B
S3-6C254→T75.52C242→T76.182B
S3-7 75.52 76.182B
S3-8C254→T75.522C242→T76.122B
S3-11C254→T; G265→A75.522C242→Tinvalid-
S3-12 75.52 invalid-
S3-14 75.52 invalid-
S3-15 74.723 invalid-
S3-16C254→T; A266→C75.52C242→T76.122B
S3-17 75.522 76.12B
S3-18 75.52 invalid-
1 Presumptive wild-type (genotypic confirmation not performed). 2 Samples without characteristic sigmoidal amplification curves were deemed invalid. 3 Two clusters separate from wild-type were observed on Day 1 (2A, 3A), whereas only a single non-wild-type cluster was observed on Day 2 (2B). 4 Substitutions shown were described by [6] or [34].
Table 8. HRMA melt temperatures and clusters for B. cereus and B. thuringiensis strains.
gyrAparC
StrainTmClusterTmCluster
B. cereus
NRRLB-56976.92invalid-
PCI 24675.95176.932
F1-15invalid-76.952
3A75.92176.471
G924175.9176.872
03BB10275.9176.92
D1775.951invalid-
434277.453772
E33L76.5, 76.92276.55, 76.81
S2-875.93176.51
FM-175.931772
03BB10875.9176.223
B. thuringiensis
var israelensis76.922invalid-
kurstaki76.92276.174
Al Hakam75.95176.922
97-2775.95176.51
HD101175.93176.52, 76.781
HD68275.9176.53, 76.851
HD57175.9176.952
morrisoni76.952invalid-
Table 9. Francisella spp. strains used in this study.
Strain Designation, DescriptionAlternative Strain DesignationDBPAO/UCC Strain No. NCBI Accession Number(s)Reference
F. tularensis
NIH B-38ATCC 6223FRAN001CP010115, KN046815[44]
U112ATCC 15482;
CDC GA99-3550
FRAN 003CP009633[44]
LVSLVS (var. palearctica)FRAN004CP009694[44]
DS89-R-54 * FRAN005
DS88-R-675 * FRAN006
DS88-R-160 * FRAN007KN046806; JPGP00000000[45]
DS87-R-135 * FRAN008JOOU00000000[45]
DS88-R-144 * FRAN009JOOV00000000[45]
DS87-R-200 * FRAN 010KN046802[45]
DST6755 * FRAN 011KN046796-KN046797; JOUF00000000[45]
DSAL91-1623 * FRAN 012
DS88-R-147 * FRAN 015KN046810; JOOR00000000[45]
SCHU-S4 * FRAN016CP010290[44]
JAP (Cincinnati) * FRAN024JUJU00000000[44]
VT68* FRAN025CP010288[44]
strain 425 * FRAN029CP010289[44]
Scherm * FRAN031CP010287[44]
WY96-3418 * FRAN072CP010103[44]
GA99-3548 FRAN133NZ_DS264587-NZ_DS264591
GA99-3549 FRAN134DS264124-DS264132
F. philomiragia
Jensen O#319LATCC 25015FRAN002CP010019[44]
Jensen O#319-029ATCC 25016FRAN017CP009342–CP009343[44]
Jensen O#319-036ATCC 25017FRAN018CP009442–CP009443[44]
* Select Agent strain.
Table 10. Y. pestis strains used in this study.
Strain Designation, DescriptionAlternative Strain DesignationDBPAO/UCC Strain No.NCBI Accession Number(s)Ref.
Antigua * YERS016CP009903– CP009906[46]
NairobiYE0237; WRAIR 710YERS017CP010293– CP010294[46]
PBM19 * YERS 018CP009489–CP009492[46]
Pestoides * YERS 019CP010020–CP010023[46]
Pestoides F * YERS020CP009713–CP009715[46]
Harbin35 YERS021CP009701–CP009704[46]
Java9 * YERS022CP009992–CP009996[46]
CO92* YERS023JPMB00000000; KN150724-KN150730[47]
KIM 10v * YERS061LFXP01000001-LFXP01000006[48]
Dodson * YERS073CP009842–CP009844[46]
Shasta * YERS074CP009721–CP009724[46]
A1122ATCC 11953; WRAIR 720YERS078CP009839–CP009841[46]
Pestoides G * YERS079CP010246–CP010248[46]
Angola *NCBI39746YERS080CP009934–CP009937[46]
KIM (pCD1Ap)+ * YERS082 [31]
Nicholisk 41 YERS083CP009988– CP009991[46]
El Dorado 2572-1 * YERS100CP009782– CP009785[46]
* Select Agent strain.
Table 11. Other Yersinia spp. strains used in this study.
Strain Designation, DescriptionAlternative Strain DesignationDBPAO/UCC Strain No.NCBI Accession Number(s)Ref.
Y. enterocolitica (n = 7)
ATCC 33114ATCC 9610; CCUG 11291; CCUG 12369; CIP 80.27; DSM 4780; LMG 7899; NCTC 12982YERS001JPDV00000000; KN150735[47]
ATCC 55075 YERS004
E265YE1012YERS014JPDW00000000; KN150736-KN150738[47]
DATRYE1013YERS015JPDU00000000; KN150733-KN150734[47]
WA YERS093CP009366, CP009367[46]
8081 YERS094CP009845, CP009846[46]
2516-87 YERS095CP009837, CP009838[46]
Y. pseudotuberculosis (n = 9)
AMC TB4ATCC 6904; YE1022YERS008
ATCC 4284MIDI 3293YERS036JPIY00000000; KN150741-KN150744[47]
ATCC 6904NCTC 2476YERS038CP008943[47]
IP32953 YERS086CP009710– CP009712[46]
YPIII YERS087CP009792[46]
Pa3606 YERS088CP010067– CP010069[46]
EP2/+ YERS090CP009758, CP009759[46]
MD67 YERS091CP009757[46]
strain 1 YERS092CP009786[46]
Misc. Yersinia spp. (n = 9)
Y. aldovae 670-83 YERS098CP009781[46]
Y. frederiksenii CDC 1461-81ATCC 33641; CIP 80-29; YE1056YERS005JPPS00000000; KN150731-KN150732[47]
Y. frederiksenii Y225 YERS097CP009363, CP009364[46]
Y. intermedia Y228 YERS099CP009801[46]
Y. kristensenii ATCC 33639CDC 1459-81YERS002CP008955[47]
Y. kristensenii Y231 YERS096CP009997[46]
Y. rohdei ATCC 43380 CDC 3022-85YERS062CP009787[46]
Y. ruckeri ATCC 29473CDC 2396-61; NCIMB 2194YERS012JPPT00000000; KN150747-KN150748[47]
Y. ruckeri YERS063 YERS063
Table 12. B. anthracis strains used in this study.
Strain Designation, DescriptionAlternative Strain DesignationDBPAO/UCC Strain No. NCBI Accession Number(s)Ref
B. anthracis (n = 41)
V770-NP1-R BACI002CP009597- CP009598[49]
Vollum* BACI007CP007664-CP007666[50]
Ames* BACI008CP009979-CP009981[49]
Sterne BACI012CP009540-CP009541[49]
Smith 1013 * BACI055
Delta Sterne BACI056CP008752[50]
Vollum 1B *USAMRIID BA1002BACI124CP009326-CP009328[49]
Zimbabwe 89 * BACI125KN050648-KN050650[50]
Pakistan SK-102 * BACI126CP009462- CP009464[49]
Scotland K1811 * BACI128
BA0052 * BACI131CP007702-CP007704 [50]
Canadian Bison *CDC 607; USAMRIID BA0018BACI153CP010320-CP010322[49]
Pasteur * BACI155CP009475-CP009476[49]
South Africa *BA1035BACI207CP009698-CP009700[49]
RA3 * BACI225CP009695-CP009697[49]
strain 108 *USAMRIID BA1015BAC226 [49]
Ohio ACB * BACI259CP009339-CP009341[49]
Turkey 32 *A0149BACI260CP009314-CP009316[49]
A0435 *K3BACI261CP009329-CP009331[49]
2000031021 * BACI292CP007617-CP007618[50]
2002013094 * BACI293CP009900-CP009902[49]
ΔANR BACI355 [6]
S1-1 BACI356 [6]
S1-2 BACI357 [6]
S2-1 BACI358 [6]
S2-2 BACI359 [6]
S2-3 BACI360 [6]
S3-1 BACI361 [6]
S3-3 BACI362 [6]
S3-4 BACI363 [6]
S3-5 BACI364 [6]
S3-6 BACI365 [6]
S3-7 BACI366 [6]
S3-8 BACI367 [6]
S3-11 BACI368 [6]
S3-12 BACI369 [6]
S3-14 BACI370 [6]
S3-15 BACI371 [6]
S3-16 BACI372 [6]
S3-17 BACI373 [6]
S3-18 BACI374 [6]
* Select Agent strain.
Table 13. B. cereus and B. thuringiensis strains used in this study.
Strain Designation, DescriptionAlternative Strain DesignationDBPAO/UCC Strain No. NCBI Accession Number(s)Ref
B. cereus (n = 13)
NRRLB-569ATCC 10876; NRRL B-569;
NRS 1256
BACI015KN050654, KN050655; JMPW01000022[50]
PCI 246ATCC 10876a; ATCC 13061; ATCC 13640; IFO 13494; NCTC 9946; NRRL B-3537BACI016JMPX01000039-JMPX01000053[50]
NRL 731ATCC 4342; MIDI 3561; NRS 731BACI083JMPW01000022[50]
F1-15 BACI227NZ_KN049962-NZ_KN049966[50]
3A BACI228CP009593–CP009596[49]
G9241 BACI232CP009589–CP009592[49]
03BB102 BACI234CP009317–CP009318[49]
D17 BACI262CP009299–CP009300[49]
4342 BACI263CP009627–CP009628[49]
E33LZebra killerBACI267CP009965–CP009970[49]
S2-8 BACI268CP009604–CP009606[49]
FM-1 BACI290CP009368–CP009369[49]
03BB108 BACI291CP009634–CP009641[49]
B. thuringiensis (n = 8)
var. israelensis ATCC 35646; USDA HD522BACI036
kurstakiATCC 33679; NRRL B-3792BACI204CP009998–CP010012[49]
Al Hakam BACI229NC_008600, CP000485[51]
97-27 BACI230CP010087–CP010088[49]
HD1011 BACI264CP009332–CP009336[49]
HD682 BACI265CP009717–CP009720[49]
HD571 BACI266CP009599–CP009600[49]
morrisoniNRRL HD-597BACI289JTHH01000001- JTHH01000008[49]
Table 14. Primers, probes for HRMA, derived from Loveless [34].
SpeciesPrimers
F. tularensisgyrA-F: TCGGTAAATATCACCCTCATGGAG
gyrA-R: AGGTTGTGCCATTCTGACAATAGTAT
parE-F: CTTACATGGCATTTTGAAACTGGAC
parE-R: CAGCTTCTAGTTTATGGTCAAGATAGCC
Y. pestisgyrA-F: ATCGGTAAATACCACCCGCAT
gyrA-R: CGCACGATAGTGTCGTAGACCG
B. anthracisgyrA-F: GGTAAGTATCACCCTCATGGTGATT
gyrA-R: GCGCCATACGTACCATCGTT
parC-F: CTATCACCCGCACGGTGATT
parC-R: CGTACTTTCCAAGTTTGACTTAAACG

