Abstract
Prostate cancer is one of the leading causes of cancer mortality in men worldwide. An unusual but unique environment for studying tumor cell processes is provided by microgravity, either in space or simulated by ground-based devices like a random positioning machine (RPM). In this study, prostate adenocarcinoma-derived PC-3 cells were cultivated on an RPM for time periods of 3 and 5 days. We investigated the genes associated with the cytoskeleton, focal adhesions, extracellular matrix, growth, survival, angiogenesis, and metastasis. The gene expression of signaling factors of the vascular endothelial growth factor (VEGF), mitogen-activated protein kinase (MAPK), and PI3K/AKT/mTOR (PAM) pathways was investigated using qPCR. We performed immunofluorescence to study the cytoskeleton, histological staining to examine the morphology, and a time-resolved immunofluorometric assay to analyze the cell culture supernatants. When PC-3 cells were exposed to simulated microgravity (s-µg), some cells remained growing as adherent cells (AD), while most cells detached from the cell culture flask bottom and formed multicellular spheroids (MCS). After 3-day RPM exposure, PC-3 cells revealed significant downregulation of the VEGF, SRC1, AKT, MTOR, and COL1A1 gene expression in MCS, whereas FLT1, RAF1, MEK1, ERK1, FAK1, RICTOR, ACTB, TUBB, and TLN1 mRNAs were not significantly changed. ERK2 and TLN1 were elevated in AD, and FLK1, LAMA3, COL4A5, FN1, VCL, CDH1, and NGAL mRNAs were significantly upregulated in AD and MCS after 3 days. After a 5-day culture in s-µg, the PC-3 cells showed significant downregulations of VEGF mRNA in AD and MCS, and FN1, CDH1, and LAMA3 in AD and SCR1 in MCS. In addition, we measured significant upregulations in FLT1, AKT, ERK1, ERK2, LCN2, COL1A1, TUBB, and VCL mRNAs in AD and MCS, and increases in FLK1, FN1, and COL4A5 in MCS as well as LAMB2, CDH1, RAF1, MEK1, SRC1, and MTOR mRNAs in AD. FAK1 and RICTOR were not altered by s-µg. In parallel, the secretion rate of VEGFA and NGAL proteins decreased. Cytoskeletal alterations (F-actin) were visible, as well as a deposition of collagen in the MCS. In conclusion, RPM-exposure of PC-3 cells induced changes in their morphology, cytoskeleton, and extracellular matrix protein synthesis, as well as in their focal adhesion complex and growth behavior. The significant upregulation of genes belonging to the PAM pathway indicated their involvement in the cellular changes occurring in microgravity.
1. Introduction
Space research and investigations on cell signaling processes in the growth and development of cells exposed to microgravity (µg) is currently a hot topic in cancer research and regenerative medicine [1,2,3,4,5]. Prostate cancer is the fifth leading cause of cancer mortality in men, with the second highest cancer incidence worldwide. It is the most frequently diagnosed cancer in more than half of the countries in the world. In 2018, 1,276,106 cases of prostate cancer and 358,989 deaths were recorded worldwide [6]. Therefore, it is important to increase the current knowledge and develop novel treatment strategies for prostate cancer.
According to the 2016 World Health Organization (WHO) classification of tumors of the prostate, one of the main groups of prostate carcinomas are epithelial tumors, including the subtype acinar adenocarcinoma [7], which is by far the most common type of prostate carcinoma [8,9]. Initially, this carcinoma is local and confined to the prostate. If not detected early, it can progress to advanced stages, characterized by local invasion of the vesicular glands. The cancer can eventually progress to metastatic disease, usually resulting in death [9]. Moreover, the disease can change to a state of androgen independence, increasing the difficulty of treatment [9].
Many studies have shown that changes in gravity have extensive effects on cell functions [10,11,12]. Microgravity can induce alterations in morphology, growth, and protein biosynthesis and secretion [10], depending on the responding cell type [12]. In addition, cell cultures in µg can be performed scaffold-free to engineer three-dimensional (3D) aggregates, including multicellular spheroids (MCS), tissues, and tubular structures [13,14,15]. These organoids can be used for research in space medicine [13,16] and for testing the delivery and efficacy of drugs [17].
However, real µg can only be experienced during spaceflights, unmanned Bion flights, suborbital flights, rocket flights, parabolic flights, or with the help of a drop tower [18]. As these opportunities are rare and costly, devices have been developed to simulate µg on Earth, including the random positioning machine (RPM), rotating wall vessel (RWV), and the two-dimensional (2D) or 3D clinostat [16,18].
An RPM consists of two independently rotating frames, each moving at a randomized speed and direction [16]. By placing a sample of sufficiently small objects or cells in the middle of the RPM, the gravity vector perceived by the sample is averaged to zero over time; thus, the objects are exposed to simulated µg (s-µg) [16,19]. It has been shown for various cell types, including thyroid [20] and breast cancer cells [21], that cultivation on an RPM results in MCS formation [16].
This method facilitates long-term scaffold-free 3D-aggregate formation with the advantage of a lack of necrosis. This makes it possible to conduct long-term experiments where huge spheroids can be produced [22]. Experiments with follicular thyroid cancer cells cultured in a scaffold-free manner on an RPM for 14 days [23] and endothelial cells exposed to s-µg for 28 and 35 days revealed no necrosis. The endothelial cells grew in a large number of 3D organoids and tubular structures [15,24]. The liquid overlay and spinner flask techniques and other 1 g methods provide specific environments for 3D formation [25]. Unfortunately, after two weeks the spheroids revealed a necrotic center [26].
MCS are spherical cell clusters containing networks of cell–cell and cell–matrix interactions [17]. They are similar to in vivo tissue regarding the complexity of cell types, cell–cell interactions, extracellular matrix (ECM) deposition, and chemical gradients [17]. The concentration of oxygen and nutrients is highest in the outer layers, while metabolic wastes accumulate in the center [17,27], which resembles the conditions in avascular tumors but is “inside-out” compared to tumors containing capillaries in the center [28]. It has been shown that when MCS are formed from cancer cells, they mimic tumors formed in vivo [29] better than monolayers of cells [28]. Therefore, they can be used as in vitro model systems and for high-throughput screening assays [30] to measure the responses of tumors to potential anticancer drugs [28,29,30]. This increases the opportunity for cell-based research in drug development [30] and can be used as an addition to in vivo models and/or to reduce animal experiments [28].
Various studies have shown that µg can affect the secretion of vascular endothelial growth factors (VEGFs) in different cell types [15,23,31]. VEGFs are signaling molecules important for the process of angiogenesis [32]. Abnormal angiogenesis is one of the hallmarks of cancer [33], and overexpression of VEGF-A has been implicated in pathological angiogenesis in tumors and other diseases, causing the development of dysfunctional and disorganized types of blood vessels [32]. In tumors, neoangiogenesis changes blood flow, oxygenation, and interstitial fluid pressure, creating an abnormal microenvironment, increasing cancer progression, and decreasing the efficacy of treatment [33]. Anti-VEGF treatment has been developed and successfully utilized as cancer treatment [33,34].
The actions of VEGF-A are mediated through the molecule binding to its two receptors, VEGFR-1/fetal liver kinase 1 (FLT1) and VEGFR-2 Fms-related tyrosine kinase 1 (FLK1). Upon VEGF-A binding to VEGFR-2, phosphorylation of specific tyrosine residues leads to recruitment of downstream effector proteins and initiation of specific signaling pathways [35]. The extracellular signal regulated kinase 1/2 (ERK1/2)/rapidly accelerated fibrosarcoma (raf)-mitogen-activated protein kinase kinase 1 (MEK1)-mitogen-activated protein kinase (MAPK) pathway is activated, leading to increased proliferation [35,36]. Apoptosis is inhibited through the steroid receptor coactivator (SRC) proto-oncogene, non-receptor tyrosine kinase (Src)/phosphoinositide 3-kinase (PI3K)/protein kinase B (PKB, also known as Akt) signaling pathway, leading to increased cell survival [35,37]. Mammalian target of rapamycin (mTOR) signaling, which includes mTOR complex 2 (mTORC2), containing the subunits mTOR and rapamycin-insensitive companion of mTOR (RICTOR), is activated through the PI3K/Akt signaling pathway, regulating processes such as cell growth and differentiation [38]. VEGF signaling through VEGFR-2 also leads to activation of focal adhesion kinase (FAK), which stimulates increased vascular permeability [39] as well as migration and anti-apoptosis via Src [40]. Moreover, p38MAPK is activated, affecting cell motility through actin cytoskeleton reorganization [35].
In comparison to other VEGFRs, the signaling functions of VEGFR-1 are less well characterized [41]. It has been associated with the ERK/MAPK, PI3K/AKT, and p38MAPK signaling pathways [42]. Furthermore, VEGFR-1 has been shown to bind VEGF with a higher affinity than VEGFR-2 and thereby have a negative impact on angiogenesis caused by VEGFR-2 [41].
Previous findings showed 3D growth patterns of PC-3 cells when cultured in an RWV culture system [14]. Spheroid formation followed within a few hours after reducing gravitational conditions, and expression of cell adhesion molecules (CD44 and E-cadherin) was increased in the MCS. In parallel, Zhau and co-workers established a 3D human prostatic cancer model by co-culturing prostate fibroblasts with prostate cancer cells under s-µg conditions using an RWV system [43]. Using a similar setup, Clejan and colleagues studied the effects of RWV cultivation on DU-145 human prostate carcinoma cells [44]. Notably, after 6 days of RWV growth, the activation of the PI3K pathway was observed. From this study the authors concluded that RWV cultivation provides a 3D growth model of prostate cancer that imitates in vivo tissue growth. In addition, Margolis et al. reported long-term maintenance (minimum of 28 days) of benign explanted human prostate tissue grown in culture medium in an RWV [45]. This study investigated the impact of s-µg on PC-3 prostate cancer cells in vitro.
The principal aims of this study are to (i) investigate the changes and behavior of PC-3 prostate cancer cells exposed to s-µg created by an RPM; (ii) test, based on previous findings, the hypothesis that exposure of PC-3 cells to s-µg induces the formation of MCS and alters the expression of genes related to angiogenesis, metastasis, the cytoskeleton, the ECM, and focal adhesions (FAs); and (iii) focus on the VEGF, MAPK, and PI3K/AKT/mTOR (PAM) signaling pathways.
2. Results
2.1. Morphology and Cell Growth
In order to examine whether PC-3 cells will form MCS when cultured under s-µg conditions, cell culture flasks containing PC-3 cells were placed on the RPM for 3 and 5 days; 1 g controls were cultured in parallel.
The 1 g control cells (Figure 1A,D) kept dividing throughout the experiment, reaching 100% confluence. The cells on the RPM (Figure 1B,C,E,F) were exposed to s-µg conditions. Only a few cells remained adherent, growing as a 2D monolayer (AD), while the majority detached and aggregated to MCS. After 3 days (Figure 1B,C), there were numerous MCS floating in the medium. In addition, a smaller number of loose aggregates could be found among the spheroids. After 5 days (Figure 1E,F), the spheroids had grown significantly. The size, shape, and density varied among the spheroids, as well as among the cell culture flasks used in the same experiment.
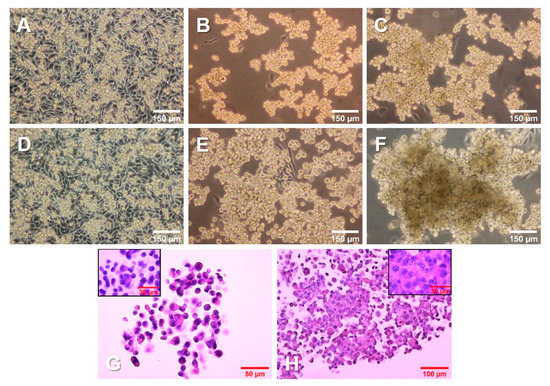
Figure 1.
Growth of PC-3 prostate cancer cells in simulated microgravity. PC-3 cells were cultured (A, D) under 1 g conditions or (B,C,E,F) on an RPM for 3 days (A–C) and 5 days (D–F). (G,H) PC-3 cells growing in MCS, stained with hematoxylin and eosin (HE) after a 3-day (G) and 5-day (H) RPM exposure, respectively.
Hematoxylin–eosin (HE) staining of spheroids grown after 3 days (Figure 1G) and 5 days (Figure 1H) on the RPM presented a condensation of cells together with an increased amount of ECM. In addition, the cells in all groups were viable and did not undergo apoptosis or necrosis, as seen from the normal cell shape, cytoplasm staining, and intact nuclei.
2.2. VEGF, MAPK, and PAM Signaling Pathways
Quantitative real-time polymerase chain reaction (qPCR) analysis was performed to examine the gene expression of relevant genes of the VEGF, MAPK, and PAM signaling pathways. The qPCR data revealed a significant decrease in the amount of VEGFA mRNA in MCS compared to 1 g controls after 3 days and 5 days (Figure 2A).
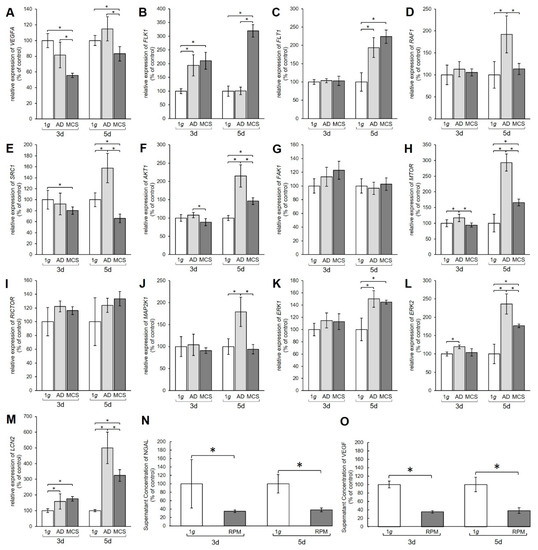
Figure 2.
Gene expression of various proteins from the vascular endothelial growth factor (VEGF) signaling pathway. Results show relative mRNA transcription levels from (A) VEGFA, (B) FLK1, (C) FLT1, (D) RAF1, (E) SRC1, (F) AKT1, (G) FAK1, (H) MTOR, (I) RICTOR, (J) MAP2K1, (K) ERK1, (L) ERK2, and (M) LCN2 genes. Results are shown as percentages of 3-day and 5-day 1 g controls. Time-resolved immunofluorometric assay (TRIFMA) results show amounts of (N) NGAL and (O) VEGF proteins in the supernatant taken from 3-day and 5-day flasks containing PC-3 cells, shown as percentages of 3-day and 5-day 1 g controls. * p < 0.05.
The mRNA levels of the VEGFA receptors FLK1 and FLT also showed changes (Figure 2B,C). After 3 days the FLK1 gene expression was significantly upregulated in both AD and MCS compared to 1 g. After 5 days the FLK1 mRNA level in AD was unchanged, while MCS showed an increase compared to 1 g and AD (Figure 2B). The FLT1 mRNA was unchanged after 3 days, but clearly upregulated in both 5-day AD and MCS groups compared with 1 g controls (Figure 2C).
Furthermore, the MAPK pathway was affected by the s-µg conditions. The RAF1 mRNA was not changed after 3 days, but significantly increased in AD cells after 5 days (Figure 2D). The SRC1 mRNA expression was significantly downregulated in 3-day MCS compared to corresponding 1 g samples, whereas a 5-day exposure induced upregulation of SRC1 mRNA in AD and downregulation in MCS compared with 1 g controls and AD samples (Figure 2E). AKT1 was downregulated in MCS compared to AD, but not significantly changed compared with 1 g after a 3-day RPM exposure. After 5 days, we measured an upregulation of the AKT1 gene in AD and MCS compared with 1 g (Figure 2F). Interestingly, the FAK1 gene expression was not significantly changed in all samples (Figure 2G). MTOR mRNA was significantly elevated in AD after 3 days and further enhanced after 5 days in both AD and MCS samples (Figure 2H). RICTOR gene expression was not differentially displayed in all groups (Figure 2I). Similarly, there was also no change in MAP2K1 mRNA after 3 days, whereas after 5 days MAP2K1 mRNA was significantly upregulated in AD cells (Figure 2J). ERK1 was not changed in 3-day samples, but significantly enhanced in AD and MCS after 5 days (Figure 2K). ERK2 was upregulated in AD samples after 3 days and, like ERK1, clearly upregulated in AD and MCS after 5 days (Figure 2L).
The transcription level of the lipocalin 2/NGAL protein neutrophil gelatinase-associated lipocalin (LCN2) gene, however, was increased in both AD and MCS compared to 1 g after 3 and 5 days, but decreased from AD to MCS after 5 days (Figure 2M). Furthermore, the amount of VEGF and NGAL protein secreted from the PC-3 cells into the medium was examined using time-resolved immunofluorometric assay (TRIFMA) (Figure 2N,O). Secreted amounts of VEGF and NGAL were significantly decreased after both 3 and 5 days of RPM-exposure.
2.3. Cytoskeleton
The effect of RPM exposure on the cytoskeleton was examined by qPCR analysis for the genes encoding β-actin and β-tubulin. In addition, F-actin and β-actin were visualized by immunofluorescence (IF). A redistribution of F-actin was observed in PC-3 cells when exposed to s-µg for 3 and 5 days (Figure 3A–C and Figure 3D–F, respectively). AD cells showed an accumulation of cortical actin compared to 1 g control cells. After 3 days, the formation of filopodia and lamellipodia could be observed (Figure 3B). After 5 days, filopodia, lamellipodia, and cortical stress fibers were prominent (Figure 3E). F-actin was accumulated at the cell membrane in MCS after both 3 and 5 days (Figure 3C,F). IF staining for β-actin (Figure 3G–L) did not show a clear difference in the distribution of the protein, although the AD at 3 days (Figure 3H) showed some membrane blebbing. ACTB gene expression revealed a significant upregulation in MCS compared to AD after 3 days (Figure 3M), while TUBB presented no expression changes (Figure 3N). After 5 days, ACTB and TUBB mRNAs were increased in both AD and MCS compared to 1 g control cells, and were lower in MCS than AD (Figure 3M,N).
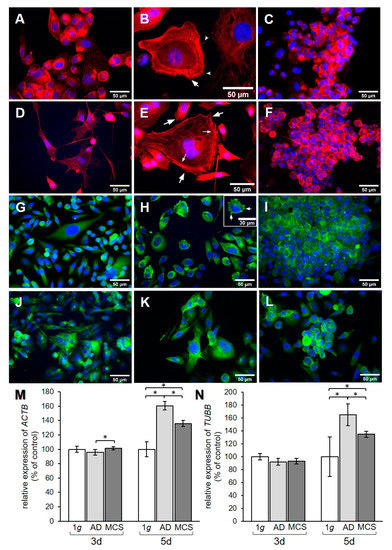
Figure 3.
Investigation of the cytoskeleton. F-actin visualized by means of phalloidin and immunofluorescence (IF) staining for β-actin. F-actin pictures show (A) 3-day 1 g control, (B) 3-day AD, (C) 3-day MCS, (D) 5-day 1 g, (E) 5-day AD, and (F) 5-day MCS. Big arrows in (B) and (E) point to lamellipodia, notched arrows in (B) point to filopodia, and small arrows in (E) point to stress fibers. β-actin pictures show (G) 3-day 1 g control, (H) 3-day AD, (I) 3-day MCS, (J) 5-day 1 g, (K) 5-day AD, and (L) 5-day MCS. Arrows in (H) point to membrane blebbing. Relative mRNA transcription levels of (M) ACTB and (N) TUBB genes in 3-day and 5-day samples were analyzed by qPCR. * p < 0.05.
2.4. Extracellular Matrix
To examine the effect of s-µg on the ECM, the regulation of collagen, laminin, and fibronectin at the mRNA level and collagen deposition were investigated (Figure 4).
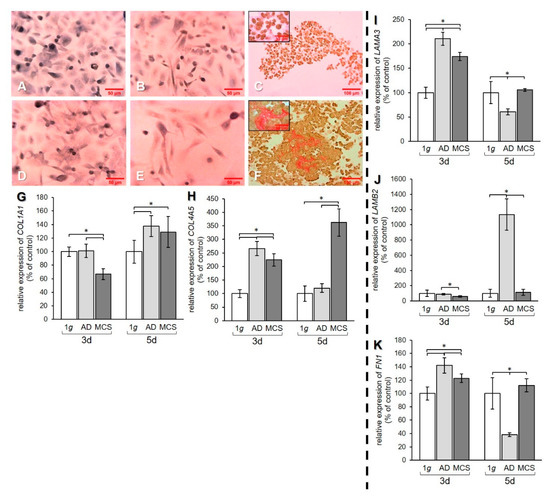
Figure 4.
Investigation of ECM components. Collagen deposition in PC-3 cells stained with Sirius red (SR) after (A–C) 3 days and (D–F) 5 days. 1 g control cells (A,D) AD (B,E) and MCS (C,F). Depositions of collagen I and III are stained in red. qPCR results show relative mRNA transcription levels of (G) COL1A1, (H) COL4A5, (I) LAMA3, (J) LAMB2, and (K) FN1 genes in 3-day and 5-day AD and MCS. * p < 0.05.
Sirius red staining of PC-3 cells revealed that 1 g cell samples (Figure 4A,D) and AD (Figure 4B,E) were negative for extracellular collagen after 3 and 5 days. However, collagen was found in RPM-exposed samples and was detectable in MCS. After 3-day exposure, a rim of collagen was formed around the cells in the MCS (Figure 4C). After 5 days, larger amounts of collagen were detectable in the center of the MCS, as demonstrated by the prominent red structures (Figure 4F).
qPCR data of the COL1A1 gene expression revealed a decrease of this gene in MCS compared to both 1 g and AD after 3 days. After 5 days, an upregulation of COL1A1 mRNA was measured in both AD and MCS compared to 1 g controls (Figure 4G). The gene expression of COL4A5 was increased after 3 days in AD and MCS compared to 1 g, but decreased in MCS compared to AD. After 5 days, the COL4A5 mRNA level was strongly elevated in MCS, while no difference was found between AD and 1 g (Figure 4H). The mRNA expression of the genes for the laminin α3 and β2 subunits was investigated. The mRNA level of the LAMA3 gene was upregulated in AD and MCS compared to 1 g after 3 days, while the LAMA3 mRNA level in MCS was lower than in AD. After 5 days, the LAMA3 mRNA in AD was decreased compared to both 1 g and MCS, while MCS did not show a difference compared to 1 g (Figure 4I).
The LAMB2 mRNA level in AD and MCS was unchanged after 3 days compared to 1 g. LAMB2 was downregulated in MCS compared to AD. After 5 days, the LAMB2 mRNA transcription was very high in AD compared to both 1 g and MCS (Figure 4J). The qPCR data for FN1 showed an increase in AD and MCS cells compared to 1 g after 3 days (Figure 4K). After 5 days, the FN1 mRNA level was decreased in AD samples compared to both 1 g and MCS (Figure 4K).
2.5. Altered Expression of Genes of the Focal Adhesion Complex
Finally, we examined the effect of s-µg-exposure of PC-3 cells on the transcription of genes involved in FA.
TLN1 gene expression was upregulated mRNA level after 3 days in AD, but not in MCS compared to 1 g, whereas after 5 days no significant changes were measured (Figure 5A). The mRNA expression of VCL was significantly elevated in AD and MCS samples compared to 1 g controls. This elevation of VCL was further enhanced after 5 days in both AD and MCS (Figure 5B). Moreover, the CDH1 gene expression was clearly upregulated after an RPM-exposure in 3-day AD and MCS samples. In contrast, the CDH1 mRNA expression was downregulated in AD after 5 days, while the CDH1 level was still upregulated in MCS compared to both 1 g and AD (Figure 5C).
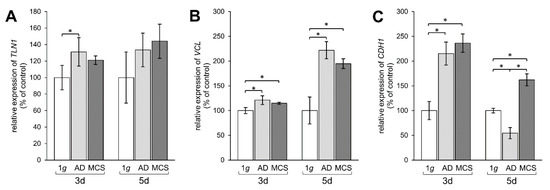
Figure 5.
Investigation of gene expression of focal adhesion molecules talin-1, vinculin, and E-cadherin. qPCR results show relative mRNA transcription levels of (A) TLN1, (B) VCL, and (C) CDH1 genes in 3-day and 5-day samples. * p < 0.05.
2.6. Interaction of Genes Investigated by Pathway Analysis
The various genes analyzed by qPCR (Figure 6A) were differentially regulated in µg samples (AD and RPM). Figure 6A presents a summary of the qPCR data, already described in Figure 2, Figure 3, Figure 4 and Figure 5, and gives a comparable overview on the results. A closer look at the 3-day samples reveals that most genes involved in VEGF signaling (blue bars) are upregulated in AD samples compared to 1 g, while the gene expression in MCS presents a more heterogeneous pattern. Notably, VEGFA, FLK1, and LCN2 are equally regulated in AD and MCS samples after 3 days. After a 5-day RPM-exposure, most of the investigated VEGF signaling molecules are significantly upregulated in AD samples. In comparison, 5-day MCS samples presented a significant regulation, which is in contrast to 3-day samples. Remarkably, VEGFA is not regulated in 5-day AD samples compared to 1 g. In addition, LCN2 is strongly upregulated in all conditions. The cytoskeletal molecules of interest (green bars) are not regulated after 3 days. However, after 5 days, both conditions are upregulated. The investigated ECM molecules (violet bars) after a 3-day RPM-exposure present a comparable image in AD and MCS samples. After 5 days, AD cells show a heterogeneous expression image, while LAMB2 is strikingly upregulated. In MCS, however, collagens are clearly enhanced, while LAMB2 is not changed compared to the controls. Genes of the focal adhesion molecule complex (orange bars), especially CDH1 mRNA, are highly upregulated in both 3-day conditions. Even though CDH1 is still significantly upregulated, it seems to be reduced in 5-day conditions.
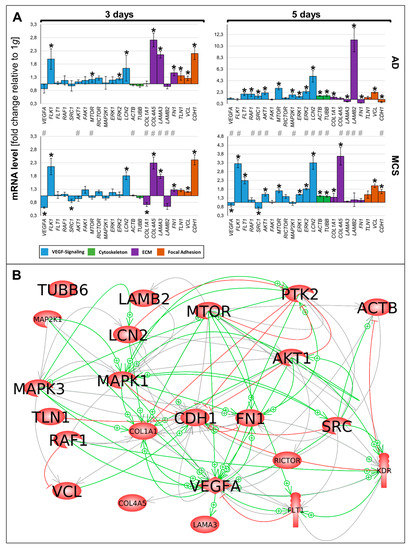
Figure 6.
(A) Summary of gene expression fold change measured by qPCR of 3- and 5-day RPM-exposed PC-3 samples. Results determined in AD and MCS in relation to 1 g are shown. Color-coded bars represent genes of related biological processes. * p < 0.01 1 g vs. AD/MCS, # p < 0.01 AD vs. MCS. (B) Interaction network of selected items at gene expression level; 22 of 23 selected genes analyzed by qPCR contribute to the network comprising 114 relations. Green arrows indicate activation and red arrows indicate inhibition. Gray lines signify that interactions take place whose effects have not been clarified. The interaction network was built using Elsevier Pathway Studio plus.
The 23 genes of interest were investigated in regard to their 114 possible interaction and mutual expression dependence. A pathway analysis of these items, represented in molecular action mode, is shown in Figure 6B. It can be seen that the components investigated are members of a complicated network, which includes the central factors CDH1, VCL, TLN1, FN1, VEGFA, KDR, RAF1, ERK1/2, MAP2K1, MTOR, AKT1, PTK2, and SRC1. Of these components, CDH1 seemed to be the main node point.
3. Discussion
In this study, we focused on the changes induced in PC-3 cells when they were cultured under s-µg conditions. Possible simulation devices included RPM, RVW, and 2D clinostat. The RPM was chosen as this device rotates samples around two axes, thus enabling the cells to float freely and randomly in the medium, which increases the chances of interactions and MCS formation [16]. In addition, the RPM provides efficient diffusion of nutrients, gases, and waste through a small fluid flow [16]. The optimal method would be to cultivate the cells on a spaceflight, as this would provide real µg. In contrast, simulation devices average the gravity level to near zero without neutralizing it [18] and expose the cells to small fluid shear forces [46], which might slightly decrease the reproducibility in real µg. However, previous studies have noted that in many cases s-µg produces results similar to real µg [47]. Genes and proteins involved in the regulation of cancer cell proliferation and metastasis, such as IL6, IL8, and VEGFA, were similarly regulated under RPM and spaceflight conditions [47]. Therefore, in the future, it would be interesting to expose PC-3 cells to real µg to compare its effects to our results, as only space experiments can validate results obtained on devices on Earth [18].
When PC-3 cells were placed on the RPM, some of the cells remained adherent, while others detached and formed multicellular tumor-like spheroids. After 5 days, only a few cells remained growing adherently, while the majority were growing in MCS. Notably, variations in the shape, size, and density of the spheroids were observed. This could be due to variations in placement on the RPM. Nevertheless, various cell types exposed to s-µg have grown as multicellular spheroids and also as an adherent monolayer. Examples are thyroid cancer cells [20], breast cancer cells [21], and nonmalignant cells, such as endothelial cells [15].
3.1. Signaling Pathways Involved in Three-Dimensional Growth
3.1.1. VEGF Signaling
We examined the expression of genes belonging to the VEGF signaling pathway and found that the gene expression of VEGFA was downregulated after 3 and 5 days of exposure, except in 5-day AD. Accordingly, significant decreases in the amount of secreted VEGF and NGAL were found. This points toward development of a less-aggressive phenotype as a result of cultivation on the RPM, as VEGFA has been implicated in pathological angiogenesis and tumor development [32,48], while NGAL induces VEGFA expression [49], among other cancer-promoting functions [50,51,52]. The LCN2 gene expression, on the other hand, was increased in all groups, potentially due to a counterregulatory mechanism. Possibly, mRNA levels increase in order to compensate the elevated protein secretion of NGAL protein in the supernatant. The development of a less-aggressive phenotype is supported by the findings in thyroid cancer cells [22,47] and human adult retinal pigment epithelium cells [31]. In contrast, the VEGF and NGAL secretion was elevated in endothelial cells exposed to µg [15]. Future studies should explore this µg-induced shift in greater detail. This can be elucidated by investigating the regulation of other genes and proteins linked to metastasis and proliferation of cancer cells, such as interleukin 6 (IL6), IL8, osteopontin, and fibroblast growth factor 17 [22,47].
In contrast to these findings, we found the expression of genes for the VEGF receptors FLT1 and FLK1 to be upregulated after 5 days in MCS, which might indicate a counterregulatory effect of the two VEGF receptors. Furthermore, we found a significant regulation of downstream signaling molecules, with a general trend to upregulate the gene expression. This was especially evident after 5 days on the RPM.
3.1.2. MAPK Signaling
Factors of the MAPK signaling pathway are known to be involved in 3D growth and metastasis [1]. The biological process of the epithelial–mesenchymal transition (EMT) is known to increase migration and spreading of cancer cells, progression of the cell cycle, and resistance to apoptosis and chemotherapy [53]. Thus, we focused on RAF1 mRNA expression. RAF1 acts as a regulatory link between the membrane-associated Ras GTPases and the MAPK/ERK cascade and functions as a switch determining, among others, proliferation, differentiation, and oncogenic transformation of human cells. Its main cellular role is in phosphorylation and activation of the MAP kinase kinases MEK1 and MEK2 [54].
In this study we found RAF1 to be upregulated in AD cells but not in MCS. This indicates its activation by s-µg and its possible involvement in spheroid formation (Figure 2D). As RAF1 activation initiates a mitogen-activated protein kinase cascade, we also determined MAP2K1 (also known as MEK1) gene expression. MAP2K1 gene expression was comparable to the RAF1 mRNA level and was significantly elevated in 5-day AD cells (Figure 2J). In a next step, we determined the expression of ERK1 and ERK2. The ERK subfamily consists of typical (ERK 1/2/5) and atypical (ERK 3/4/7/8) members. ERKs are known to regulate EMT and promote tumor progression [54]. ERK1/2 gene expression was significantly upregulated after 5 days in AD and MCS compared to 1 g samples (Figure 2K,L). Both ERK1 and ERK2 seem to be involved in 3D aggregation in µg.
3.1.3. PI3K/AKT/mTOR (PAM) Signaling
Tee et al. showed that the PAM signaling pathway is frequently mutated in prostate cancer [55]. The PAM pathway is involved in the regulation of growth, metabolism, and migration [55]. In our experiment, the AKT gene expression was enhanced in AD and MCS samples after a 5-day RPM-exposure of prostate cancer cells. Activated AKT phosphorylates a host of proteins involved in cell growth, including mTOR [56]. Interestingly, we observed an upregulation of the MTOR gene expression in AD after 3 days and in all RPM-exposed cell samples after 5 days. According to the clinicaltrials.gov database, various inhibitors of this pathway are currently being tested in 36 phase I/II clinical trials for prostate cancer, either as monotherapy or in combination with conventional chemotherapies [57].
Finally, we focused on the SRC1 gene, which belongs to the p160 family of SRCs. SRCs promote cancer cell proliferation, survival, metabolism, migration, invasion, and metastasis. In prostate cancer, SRC1 is highly expressed [58]. We found an upregulated SRC1 gene in AD cells after 5 days, indicating its involvement in migration and 3D formation.
Together with MAP1K2, SRC-1 regulates the transcriptional activity of STAT3 [59]. In addition, it blocks upregulation of the VEGF-A receptors [60] and inhibits expression of E-cadherin [61]. On the other side, SRC-1 activates FAK1 [62], which strengthens vinculin, containing focal adhesion complexes [63] that link cells to fibronectin or other components of the ECM [64] and include talin-1 as a hinge between the cytoskeleton and the extracellular space [65]. Downregulation of talin favors activation of the MAPK1/MAPK3 pathway [66].
3.2. Changes in the Cytoskeleton and the Extracellular Matrix
In this study we observed s-µg-induced changes in the F-actin network of the cells. The formation of lamellipodia and filopodia in our cells under s-µg might indicate that the cells are trying to adhere better to the ECM to resist the s-µg conditions, because these structures are involved in migration and adherence of cells to the substrate [67]. In addition, the stress fibers also present might have formed in order to compensate for changes in adhesion and cell morphology [68].
The cortical F-actin accumulation is consistent with earlier findings in endothelial cells, although the latter also showed perinuclear accumulation [12]. An increase in the density of F-actin was also found in A431 cells, although the actin filaments became less organized [69]. Just like PC-3 cells, human fetal osteoblasts showed formation of filopodia and lamellipodia [70]. In contrast, osteoblasts had reduced cortical actin and fewer stress fibers [71]. It is clear from these examples that the changes in F-actin induced by µg depend on the cell type.
Moreover, we found that the mRNA level of ACTB was increased after 5 days. This is in accordance with similar findings in follicular thyroid cancer cells [72]. In addition, our qPCR analysis showed an increased TUBB mRNA level in PC-3 cells exposed to s-µg, which is similar to earlier results in endothelial cells [73].
In general, we found a tendency of elevated ECM components at the mRNA level when PC-3 cells were exposed to s-µg on the RPM. The mRNA levels of the COL1A1, COL4A5, LAMA3, LAMB2, and FN1 genes were upregulated or unchanged, with only a few exceptions. In addition, collagen deposition was found in spheroids. A possible explanation for this finding could be that the cells try to increase the ECM to resist the s-µg conditions, because the ECM provides structural support for the cells [74], which they lack after detaching because of the RPM-exposure. Our results concerning the ECM fit the findings of a study of human fetal osteoblasts exposed to s-µg, where the cells showed collagen deposition in spheroids and increased FN1 and LAMA1 gene expression [70]. However, the gene expression of COL4A5, FN1, and LAMB2 was reduced in s-µg-exposed adult retinal pigment epithelial cells [31]. Thus, regulation of ECM compounds because of µg-exposure must depend on the cell type.
We found an increase in the focal adhesion component VCL mRNA. It is plausible that this change occurs because the cells are trying to resist the s-µg conditions and hold onto the ECM, although this does not match the generally unchanged amounts of TLN1 gene expression in our experiment. In contrast to the results of this study, FTC-133 cells exposed to µg showed no change in VCL expression and decreased TLN mRNA [75]. Thus, PC-3 cells and FTC-133 cells show a different regulation of FA gene expression and, possibly, synthesis or secretion of proteins.
Finally, we detected a general upregulation of the CDH1 gene expression. In conjunction with our observations on the secretion of VEGF and NGAL described above, this could also indicate a tendency toward a less-aggressive phenotype, as CDH1 is a tumor suppressor gene, and inactivation of E-cadherin is involved in the development of prostate cancer [76,77]. E-cadherin was enhanced in papillary thyroid carcinoma cells [78], but decreased in human breast cancer cells [79] exposed to s-µg conditions. Thus, E-cadherin acts depending on the cell type.
3.3. Interaction Network of Selected Genes Evaluated by Pathway Analysis
In the pathway analysis various interactions were found, but VCL, FN1, mTOR, SRC1, and VEGFA are indicated as dominant target genes, as many arrows point to their icons (Figure 6B).
There are interactions between vinculin and fibronectin. FN1 and VCL1 were both upregulated in MCS after 3- and 5-day RPM-exposure (Figure 4K and Figure 5B). Similar findings were reported after 24- and 48-h clinostat-exposures of poorly differentiated follicular thyroid cancer cells exhibiting increased expression of vinculin and among other ECM proteins as well as fibronectin in MCS compared with 1 g controls [11]. A recent paper reported that FN1 KO podocytes showed significant downregulated FA molecules (talin, vinculin, and paxillin) and reduced cell spreading, indicating an important role of FN1 in adhesion [80]. FN1 plays a key role in the adaptation of podocytes to mechanical stress. Moreover, this supports the hypothesis that its interaction with vinculin is an adaptive mechanism to protect µg-exposed prostate cancer cells and other cell types.
In addition, there is an interaction between vinculin and MAPK1 (ERK2). Both factors are involved in transmitting and transducing environmental signals to biochemical cascades. The protein kinases are known to regulate the activity of FA proteins [81]. Vinculin also interacts with MAPK3 (ERK1). Macrophages grown on polished surfaces changed from spherical to well-spread cells. These morphological changes were associated with an altered distribution of vinculin [82]. The pFAK, pSrc, pERK1/2 levels were associated with cell shape and a more spread morphology [82].
There is an interesting interaction between FN1 and MAPK3 (ERK2). Treatment of PC-3 cells with 1 μM FN1 resulted in a decrease of activated ERK1/2 [83]. In clear-cell renal cancer, eight differentially expressed genes were identified as biomarkers, including VEGFA, FLT1, FN1, and others [84]. Both fibronectin and VEGF are known to stimulate blood vessel formation. Patient data showed that circulating fibronectin modulates blood vessel formation and tumor growth by modifying the amount of and response to VEGF [85]. In addition, measuring the fibronectin level can serve as a prognostic biomarker for prostate cancer and possibly others.
The SRC1 mRNA was significantly downregulated in MCS after 3- and 5-day RPM-exposure of prostate cancer cells (Figure 2E), whereas VCL was elevated in MCS in our experimental setting (Figure 5B). Moreover, CDH1 mRNA expression was enhanced in PC-3 MCS after 3 and 5 days on the RPM (Figure 5C). The product of the human SRC gene, c-Src, is overexpressed and often activated in many human cancers. The relationship between Src activation and cancer progression appears to be significant [86].
Interestingly, the exposure of PC-3 cells induced a decrease in SRC1, which supports the hypothesis that the PC-3 cells showed a more moderate expansion behavior as compared to MCF-7 breast cancer cells. In contrast, in MCF-7 breast cancer spheroids, c-Src was elevated and E-cadherin was reduced [79]. MCS formation could be prevented by inhibition of c-Src and enhanced by blocking of E-cadherin. These results suggest that the balance of proteins that up- or downregulate E-cadherin mediates the tendency of breast cancer cells to form MCS during s-µg-exposure [79].
In addition, there was another detectable interaction between SRC and laminin subunit alpha-3 (LAMA3). LAMA3 gene expression was upregulated in AD and MCS after a 3-day RPM-exposure of the cells. It also was shown earlier that the recently identified Lm3B11, consisting of laminin α3B (encoded by LAMA3), β1, and γ1 chains, stimulated the phosphorylation of Src and Akt more strongly than other laminins in vascular basement membranes [87]. This unique activity of Lm3B11 appears to be favorable to the process of angiogenesis.
SRC has been found to play a crucial role in VEGF-dependent vascular permeability involved in angiogenesis. Chou et al. showed that the two main VEGFRs, kinase insert domain-containing receptor/fetal liver kinase-1 (KDR/Flk-1) and Fms-like tyrosine kinase-1 (Flt-1), interact with SRC. VEGF stimulation elevated SRC activity associated with activated KDR/Flk-1 in endothelial cells [88]. The gene expression of VEGFA was downregulated, whereas both VEGFA-receptor genes, KDR and FLT1, were upregulated in all 5-day RPM samples, which might indicate a counterregulatory effect (Figure 2A–C). In colon cancer cells, SRC induced VEGF, thus enhancing angiogenesis [89,90]. The relationship between Src and VEGF appears to be somewhat reciprocal [86]. VEGF-induced activity is negated with the inhibition of Src activity. Src also appears to provide a link in VEGF signaling of MAPK pathways, contributing to spreading and metastasis [90].
In PC-3 prostate cancer cells, we found a significant downregulation of VEGFA mRNA and protein secretion, indicating a lower metastatic potential of the cells when exposed to microgravity. These results are similar to those obtained from low-differentiated follicular thyroid cancer cells in space [47], where we also found a downregulation of both VEGFA gene and protein secretion.
The PI3K/AKT/mTOR signaling pathway plays a key role in cancer metastasis. The activation of a mitogenic pathway involving a feedback mechanism between mTOR and PI3K/ERK1/2 is important for the tumorigenesis of glioblastoma multiforme [91] and may be involved in 3D spheroid formation in s-µg. The MAPK and PI3K/AKT/mTOR pathways regulate cell survival, proliferation, and motility. In addition to their independent signaling programs, the pathways engage in an extensive crosstalk to both positively and negatively regulate each other. Encouragingly, co-inhibition of both pathways has been successful in reducing tumor growth in xenograft cancer models and, importantly, also in genetically engineered mouse models [92,93]. mTOR catalyzes the phosphorylation of multiple targets such as AKT, protein kinase C (PKC), and others, thereby regulating various biological processes such as tumor growth and metastasis. Many mTOR inhibitors have been developed to treat cancer. While some of them have been approved to treat human cancer, more mTOR inhibitors are being evaluated in clinical trials. In addition, current research is designed to optimize the use of VEGF/VEGF receptor inhibitors and mTOR inhibitors for combination or sequential treatment of patients with advanced cancer [94,95].
In short, the s-µg conditions created by the RPM caused differential regulations of the expression of the VEGF, MAPK, and PAM pathway-involved genes VEGFA, FLK1, FLT1, RAF1, SRC1, AKT1, MTOR, MAP2K1, ERK1, and ERK2, as well as the genes ACTB, TUBB, COL1A1, COL4A5, LAMA3, LAMB2, FN1, TLN1, VCL, and CDH1, involved in signal transduction in the cytoskeleton, ECM, and FAs. Furthermore, a redistribution of F-actin was found in the cells, as well as a deposition of collagen in MCS and decreased secretion of VEGF and NGAL. Thus, s-µg resulted in the regulation of proteins and genes involved in angiogenesis, cell morphology, migration, attachment, ECM, and 3D growth. Possibly, some changes are due to attempts to resist the alterations in µg. Moreover, the PC-3 cells formed spheroids when cultured in s-µg conditions. These 3D constructs might be useful in future studies on the effects of anticancer drugs, as they more closely mimic the cellular environment in actual metastasis, including, for example, the need for diffusion of the drug into the core of the spheroid as opposed to monolayer cell cultures. A future project could be to examine the effects of drugs targeting the proteins regulated in the PC-3 cells when exposed to µg. This was done, for example, with dexamethasone targeting NFκB in breast cancer cells [21], and possible drug investigations are planned for thyroid cancer cells in µg [22]. In addition, it is also important to apply different signaling pathway inhibitors as well as an agonist to investigate the role of µg in prostate cells. Further examination of prostate cancer cells in weightlessness may thus contribute to investigations concerning treatment options and possibly reduce animal experiments in the field of prostate cancer.
4. Materials and Methods
4.1. Cell Culturing and Microgravity Simulation on the RPM
The human prostatic carcinoma cell line PC-3 was established from a human prostatic adenocarcinoma metastatic to bone, enabling investigations concerning the changes involved in advanced prostate cancer as well as response to treatment [96]. PC-3 cells (ECACC 90112714) were thawed from a frozen aliquot preserved in liquid nitrogen. They were seeded in T75 flasks (Sarstedt, Nümbrecht, Germany) with RPMI 1640 medium (Gibco, Fisher Scientific, Schwerte, Germany) containing 14% fetal bovine serum (FBS) (Sigma-Aldrich) and 1% penicillin/streptomycin (Gibco, Fisher Scientific, Schwerte, Germany). Afterwards, the medium was changed when necessary, using RPMI 1640 medium with 7% FBS and 1% penicillin/streptomycin. When the cells had grown appropriately, they were subcultured in T25 flasks (Sarstedt) and slideflasks (Thermo Scientific, Waltham, MA, USA) and left in 1 g conditions until reaching approximately 60% confluence.
After reaching 60% confluence, all flasks were filled completely with RPMI medium containing 10% FBS and 1% penicillin/streptomycin. Filling the flasks completely and without air bubbles was important to reduce shear stress and disturbance of the cells. Half of the flasks were mounted on the middle frame of the RPM. The other half were placed beside the RPM in 1 g conditions as controls. The RPM used in this experiment (a desktop model from Airbus, Defense and Space, Leiden, the Netherlands) was, along with all flasks, placed in an incubator at 37 °C and 5% CO2. Then, the RPM was started, exposing the cells to s-µg conditions for the chosen time periods (3 or 5 days). The RPM simulates µg with a calculated residual acceleration of approximately ~10−3 g [97]. The maximal distance to the rotation center was chosen to be 7 cm, and the rotational acceleration was 20°/s2. The device was described in detail by Grimm et al. [98].
4.2. Sample Collection
Three groups were collected from the RPM experiments: 1 g, AD, and MCS. In addition, aliquots of medium (cell supernatants) were collected for the TRIFMA experiment.
The control cells were collected from the T25 flasks exposed to 1 g conditions. First, several aliquots of medium from the flasks were collected. The rest of the medium was discarded, the cells were washed with 5 mL of phosphate-buffered saline (PBS) and then scraped off the bottom of each flask with a cell scraper, and another 5 mL PBS (Gibco, Fisher Scientific, Schwerte, Germany). The cell suspensions were transferred to tubes and subsequently centrifuged. After discarding the supernatant, the cell pellets were resuspended in PBS and transferred to reaction tubes.
MCS were collected from the T25 flasks from the RPM. First, the flasks were left until the spheroids had all fallen to the bottom. Then, several aliquots of medium were collected, after which the flasks were shaken to allow the MCS to redistribute themselves in the liquid. The medium was transferred to new tubes and centrifuged. The supernatant was discarded and the pellets containing the MCS were resuspended in PBS and transferred to Eppendorf tubes.
AD were collected from the RPM flasks by scraping the cells in PBS, then transferred to Eppendorf tubes.
Following the collection, all Eppendorf tubes were centrifuged, the supernatant was discarded, and pellets were snap-frozen in liquid nitrogen and stored at −80 °C. The supernatant aliquots were frozen and stored at −20 °C. All centrifugation steps were performed at 3000 rpm and 4 °C for 10 min.
4.3. RNA Isolation
RNA isolation was done using the RNeasy Mini Kit (Qiagen, Hilden, Germany). The samples were thawed and kept on ice. First, 10 µL of β-mercaptoethanol (BME) was added to 1 mL of lysis buffer (RTL), followed by the addition of 600 µL of this mixture to each sample. The samples were incubated for 2 min and the cells were lysed by applying shear force while passing them through a 20 G needle. Finally, 600 µL of 70% ethanol was added to each sample.
Then 700 µL of each sample was transferred to RNeasy Mini spin columns and 700 µL of Buffer RW1 and 500 µL of Buffer RPE were added. Between these steps the samples were centrifuged for 15 s at 8000× g, and flow-through was discarded. Then 500 µL of Buffer RPE was added again, this time followed by centrifugation for 2 min at 8000× g, and flow-through was discarded. Finally, the samples were centrifuged for 1 min to dry the membrane and remove any remaining ethanol.
The RNeasy spin columns were placed in new collection tubes, followed by the addition of 35 µL of RNase-free water directly to the membrane. The RNA was eluted from the membrane by centrifugation for 1 min at 8000× g.
4.4. Quantitative Real-Time Polymerase Chain Reaction
Before performing qPCR, primers were designed using NCBI Primer Blast, which were selective for cDNA by spanning exon–exon junctions and had a melting temperature of around 60 °C. The primers were synthesized by TIB Molbiol (Berlin, Germany). The primers used are listed in Table 1.

Table 1.
List of primer sequences used in quantitative PCR. All sequences are listed in the 5′–3′ direction.
The first step was to generate cDNA from the RNA using the high capacity cDNA reverse transcription kit (Applied Biosystems, Foster City, CA, USA). The RNA concentrations of all samples were measured using a NanoDrop. The results were used to calculate the amount of RNA and nuclease-free water needed to obtain 1 µg of RNA in a final volume of 10 µL. The nuclease-free water was pipetted into wells on a 96-well plate, followed by addition of RNA, then 10 µL of master mix was added to each well. This contained RT buffer, dNTP mix, RT random primers, reverse transcriptase, and nuclease-free water. The plate was sealed and centrifuged briefly to eliminate any air bubbles and spin down liquid. The thermal cycler was run using the following program: primer annealing for 10 min at 25 °C reverse transcription for 120 min at 37 °C and enzyme deactivation for 5 min at 85 °C. After this, 50 µL of nuclease-free water was added to each well to obtain a working volume of 70 µL for the next steps.
The qPCR was carried out using FAST SYBR™ Green Master Mix (Applied Biosystems) and the 7500 Fast Real-Time PCR System (Applied Biosystems). First, a master mix was prepared for measurement of all samples in triplicate as well as 3 no-template controls (NTCs). The master mix contained MM Buffer, reverse primer, forward primer, and water. Then, a sub-master mix was prepared for each sample by mixing 42 µL of master mix and 3 µL of cDNA. For each sample, 13 µL of the sub-master mix was pipetted into a 96-well plate in triplicate. NTCs were added to the last 3 wells. The plate was sealed, centrifuged briefly, and stored at 4 °C. When ready to use, the plate was placed in the instrument, and the thermal cycling conditions were set: 95 °C for 20 s, 95 °C for 3 s, and 60 °C for 30 s. The reaction volume was set to 15 µL and the program was run.
In the following analysis the samples were normalized to 18S rRNA. The comparative threshold cycle (ΔΔCT) method was utilized to obtain the relative transcription levels; 1 g controls were defined as 100%.
4.5. Immunofluorescence
Staining experiments were performed on cells grown in slideflasks that had been cultured on the RPM for 3 or 5 days and their corresponding 1 g controls in order to investigate the change in distribution of F-actin and β-actin.
When the flasks were taken off the RPM, the medium was discarded and the cells were washed three times with PBS and afterwards fixed with 4% paraformaldehyde (PFA; Sigma-Aldrich, St. Louis, MO, USA) in PBS. All slides were stored at 4 °C until ready to use. When ready, the PFA was removed and the slides were washed with PBS, followed by the addition of 0.1% Triton X-100 (Sigma-Aldrich, St. Louis, MO, USA), which was left for 15 min. Then, the slides were removed from the flasks and placed in a dark and moist chamber. Rhodamine–phalloidin (for F-actin; Sigma, P1951, diluted 1:250) or primary antibody (for β-actin; Sigma, A5316, diluted 1:1000) diluted in 0.5% bovine serum albumin (BSA) (Merck, Darmstadt, Germany) in PBS was pipetted onto each slide. For β-actin, the incubation was left overnight, and the next day secondary antibody (anti-mouse IgG Fab2 Alexa Fluor® 488 Molecular Probes 2 mg/mL #4408S, diluted 1:500) diluted in PBS was added. The secondary antibody was left on the slides for a minimum of 4 h.
Finally, the slides were prepared with Fluoroshield™ mounting medium containing 4′,6′-diamidino-2-phenylindole (DAPI) (Sigma-Aldrich, St. Louis, MO, USA). The slides were sealed by putting a coverslip on top and stored in a dark box at 4 °C. Between steps, the slides were washed with cold PBS.
4.6. Histochemical Staining
Histological staining was performed on 3- and 5-day 1 g controls and RPM slides using hematoxylin-eosin (HE) and Sirius red (SR) stains as described earlier [99,100].
The histological staining was done on cells on slides and on MCS on separate slides. After culturing the cells on the RPM for 3 or 5 days, the MCS were collected from the slides with a pipette, washed three times in PBS, and then fixed in 4% PFA. Then they were embedded in paraffin, followed by sectioning into 3 µm sections with a microtome. For 1 g and RPM AD samples, the medium was discarded and the slides were washed three times with PBS, and afterwards 4% PFA was applied. The slides and sectioned spheroids were stained with HE or SR. HE staining was used to evaluate the cell morphology, while SR staining was used to investigate the collagen content.
4.7. Microscopy
All flasks containing viable cells were examined throughout growth as well as before and after RPM-exposure with a Leica phase contract microscope. Pictures were taken using a Canon EOS 550D camera. All cells stained by immunofluorescence were examined with a Leica DFC310 FX fluorescence microscope. Pictures were taken at 20×, 40×, and 100× magnification using the LAS V3.7 software. The pictures were not taken using the same settings, as the signal intensities were not quantified. The pictures were instead used to examine the locations of the proteins. Immersion oil (Sigma-Aldrich, St. Louis, MO, USA) was applied to the slides when using the higher resolution.
4.8. Time-Resolved Immunofluorometric Assay
TRIFMA was performed as described earlier [101,102]. In brief, microtiter 96-well plates were coated overnight at 4 °C with primary antibodies dissolved in PBS. They were specific for either NGAL (1 µg/mL) or VEGF (2 µg/mL). All wells were then incubated with blocking buffer (1% Tween-20 in PBS) for 2 h.
The samples were diluted 1:2 in assay buffer to a total of 100 µL and added to the plates. The assay buffer used was PBS supplemented with 0.05% Tween-20. In addition, recombinant standards (VEGF and NGAL) were added to the plate (100 µL per well). Negative control samples, containing 100 µL of assay buffer without added supernatant, were also added to the plates. All samples were added to the plates in duplicate to increase the precision of the results.
The Fluorescence was measured using a time-resolved fluorometer (PerkinElmer, Waltham, MA, USA). The concentrations of VEGF and NGAL were determined using a 4-parameter standard curve fit implemented in WorkOut 2.5 data analysis software (PerkinElmer, Waltham, MA, USA).
4.9. Pathway Analysis
To investigate the mutual regulation of genes and visualize localization and interactions between proteins, we entered relevant UniProtKB entry numbers in the Pathway Studio plus software (Elsevier Research Solutions, Amsterdam, The Netherlands). Graphs were generated for gene expression and protein regulation and binding. The method was described previously [103].
4.10. Statistical Analysis
All statistical evaluations were performed using IBM SPSS Statistics 23 (IBM Deutschland GmbH, Ehningen, Germany). The Mann–Whitney U-test was utilized to evaluate the statistical significance of the changes in expression levels following RPM exposure, thus comparing 1 g control to AD and MCS. A significance level of 0.05 was used. The standard deviation was calculated and presented together with the mean values as percentages in bar plots.
5. Conclusions
Prostate cancer cells (PC-3 cell line) exposed to s-µg conditions generated by an RPM grew as adherent cells and in the form of 3D MCS. The RPM-exposed cells revealed alterations in the cytoskeleton, as well as gene expression changes of cytoskeletal and FA factors and ECM components. The VEGF, MAPK, and PAM signaling pathways are involved in 3D formation of prostate cancer cells. The majority of the factors are upregulated, indicating their impact on growth and progression of these cells.
Overall, our study suggests that these pathways drive the regulation of metastasis, survival, and angiogenesis of prostate cancer cells.
Author Contributions
RPM experiments: T.E.H. and J.S.; conceptualization, D.G., T.J.C., and S.K.; methodology, S.K., M.Z.N., D.D., and J.S.; software, J.B., M.W., and S.K.; validation, D.G., T.J.C., S.K., and M.K.; formal analysis, M.Z.N., S.K., J.S., D.D., and M.W.; investigation, T.E.H., N.E.M., M.Z.N., J.S., M.E., and S.K.; resources, M.I. and K.U.; writing—original draft preparation, T.E.H., S.K., T.J.C., D.G., and J.B.; project administration, D.G.; funding acquisition, D.G. and M.I. All authors have read and agree to the published version of the manuscript.
Funding
This research was funded by the German Space Agency (DLR; BMWi project 50WB1924) and Aarhus University (DG).
Acknowledgments
We would like to thank Christa Baumann, Institute of Pathology, University of Regensburg, University Hospital, Regensburg, Germany for performing the paraffin sections, and HE and Sirius red staining.
Conflicts of Interest
The authors declare no conflict of interest.
Abbreviations
| AD | Adherent cell(s) |
| BME | β-mercaptoethanol |
| BSA | Bovine serum albumin |
| DAPI | 4′,6-diamidino-2-phenylindole |
| ECM | Extracellular matrix |
| EMT | Epithelial–mesenchymal transition |
| ERK | Extracellular signal regulated kinase |
| FA | Focal adhesion |
| FAK | Focal adhesion kinase |
| FLK1 | Fms-related tyrosine kinase 1 |
| FLT1 | Fetal liver kinase 1 |
| FBS | Fetal bovine albumin |
| HE | Hematoxylin–eosin |
| HRP | Horseradish peroxidase |
| IF | Immunofluorescence |
| MAPK | Mitogen-activated protein kinase |
| MCS | Multicellular spheroid(s) |
| MEK1 | Mitogen-activated protein kinase kinase 1 |
| mTOR | Mammalian target of rapamycin |
| mTORC2 | mTOR complex 2 |
| µg | Microgravity |
| NGAL (LCN2) | Neutrophil gelatinase-associated lipocalin (lipocalin 2) |
| NTC | No-template control |
| 1 g | Normal gravity |
| PAM | PI3K/AKT/mTOR |
| PBS | Phosphate-buffered saline |
| PBST | Phosphate-buffered saline with Tween |
| PFA | Paraformaldehyde |
| PI3K | Phosphoinositide 3-kinase |
| PKB | Protein kinase B |
| qPCR | Quantitative real-time polymerase chain reaction |
| RAF | Rapidly accelerated fibrosarcoma |
| RICTOR | Rapamycin-insensitive companion of mTOR |
| RIPA | Radioimmunoprecipitation assay |
| RPM | Random positioning machine |
| rpm | Rounds per minute |
| RWV | Rotating wall vessel |
| SR | Sirius red |
| SRC (Src) | Steroid receptor coactivator (proto-oncogene, non-receptor tyrosine kinase) |
| S-µg | Simulated microgravity |
| TBST | Tris-buffered saline with Tween |
| VEGF | Vascular endothelial growth factor |
| VEGFR | Vascular endothelial growth factor receptor |
| WHO | World Health Organization |
| TRIFMA | Time-resolved immunofluorometric assay |
| 2D | Two-dimensional |
| 3D | Three-dimensional |
References
- Nassef, M.Z.; Kopp, S.; Melnik, D.; Corydon, T.J.; Sahana, J.; Krüger, M.; Wehland, M.; Bauer, T.J.; Liemersdorf, C.; Hemmersbach, R.; et al. Short-Term Microgravity Influences Cell Adhesion in Human Breast Cancer Cells. Int. J. Mol. Sci. 2019, 20, 5730. [Google Scholar] [CrossRef] [PubMed]
- Fukazawa, T.; Tanimoto, K.; Shrestha, L.; Imura, T.; Takahashi, S.; Sueda, T.; Hirohashi, N.; Hiyama, E.; Yuge, L. Simulated microgravity enhances CDDP-induced apoptosis signal via p53-independent mechanisms in cancer cells. PLoS ONE 2019, 14, e0219363. [Google Scholar] [CrossRef] [PubMed]
- Camberos, V.; Baio, J.; Bailey, L.; Hasaniya, N.; Lopez, L.V.; Kearns-Jonker, M. Effects of Spaceflight and Simulated Microgravity on YAP1 Expression in Cardiovascular Progenitors: Implications for Cell-Based Repair. Int. J. Mol. Sci. 2019, 20, 2742. [Google Scholar] [CrossRef] [PubMed]
- Qin, W.; Liu, L.; Wang, Y.; Wang, Z.; Yang, A.; Wang, T. Mir-494 inhibits osteoblast differentiation by regulating BMP signaling in simulated microgravity. Endocrine 2019, 65, 426–439. [Google Scholar] [CrossRef] [PubMed]
- Deng, B.; Liu, R.; Tian, X.; Han, Z.; Chen, J. Simulated microgravity inhibits the viability and migration of glioma via FAK/RhoA/Rock and FAK/Nek2 signaling. In Vitro Cell. Dev. Biol. Anim. 2019, 55, 260–271. [Google Scholar] [CrossRef] [PubMed]
- Bray, F.; Ferlay, J.; Soerjomataram, I.; Siegel, R.L.; Torre, L.A.; Jemal, A. Global cancer statistics 2018: GLOBOCAN estimates of incidence and mortality worldwide for 36 cancers in 185 countries. CA Cancer J. Clin. 2018, 68, 394–424. [Google Scholar] [CrossRef]
- Humphrey, P.A.; Moch, H.; Cubilla, A.L.; Ulbright, T.M.; Reuter, V.E. The 2016 WHO Classification of Tumours of the Urinary System and Male Genital Organs-Part B: Prostate and Bladder Tumours. Eur. Urol. 2016, 70, 106–119. [Google Scholar] [CrossRef]
- Humphrey, P.A. Histological variants of prostatic carcinoma and their significance. Histopathology 2012, 60, 59–74. [Google Scholar] [CrossRef]
- Abate-Shen, C.; Shen, M.M. Molecular genetics of prostate cancer. Genes. Dev. 2000, 14, 2410–2434. [Google Scholar] [CrossRef]
- Feng, M.; Peng, J.; Song, C.; Wang, Y. Mammalian cell cultivation in space. Microgravity Sci. Technol. 1994, 7, 207–210. [Google Scholar]
- Grimm, D.; Bauer, J.; Kossmehl, P.; Shakibaei, M.; Schoberger, J.; Pickenhahn, H.; Schulze-Tanzil, G.; Vetter, R.; Eilles, C.; Paul, M.; et al. Simulated microgravity alters differentiation and increases apoptosis in human follicular thyroid carcinoma cells. FASEB J. 2002, 16, 604–606. [Google Scholar] [CrossRef]
- Grimm, D.; Wise, P.; Lebert, M.; Richter, P.; Baatout, S. How and why does the proteome respond to microgravity? Expert Rev. Proteom. 2011, 8, 13–27. [Google Scholar] [CrossRef] [PubMed]
- Aleshcheva, G.; Bauer, J.; Hemmersbach, R.; Slumstrup, L.; Wehland, M.; Infanger, M.; Grimm, D. Scaffold-free Tissue Formation Under Real and Simulated Microgravity Conditions. Basic Clin. Pharmacol. Toxicol. 2016, 119 (Suppl. 3), 26–33. [Google Scholar] [CrossRef] [PubMed]
- Ingram, M.; Techy, G.B.; Saroufeem, R.; Yazan, O.; Narayan, K.S.; Goodwin, T.J.; Spaulding, G.F. Three-dimensional growth patterns of various human tumor cell lines in simulated microgravity of a NASA bioreactor. In Vitro Cell. Dev. Biol. Anim. 1997, 33, 459–466. [Google Scholar] [CrossRef] [PubMed]
- Dittrich, A.; Grimm, D.; Sahana, J.; Bauer, J.; Kruger, M.; Infanger, M.; Magnusson, N.E. Key Proteins Involved in Spheroid Formation and Angiogenesis in Endothelial Cells After Long-Term Exposure to Simulated Microgravity. Cell. Physiol. Biochem. 2018, 45, 429–445. [Google Scholar] [CrossRef]
- Grimm, D.; Wehland, M.; Pietsch, J.; Aleshcheva, G.; Wise, P.; van Loon, J.; Ulbrich, C.; Magnusson, N.E.; Infanger, M.; Bauer, J. Growing tissues in real and simulated microgravity: New methods for tissue engineering. Tissue Eng. Part B Rev. 2014, 20, 555–566. [Google Scholar] [CrossRef]
- Mehta, G.; Hsiao, A.Y.; Ingram, M.; Luker, G.D.; Takayama, S. Opportunities and challenges for use of tumor spheroids as models to test drug delivery and efficacy. J. Control. Release 2012, 164, 192–204. [Google Scholar] [CrossRef]
- Herranz, R.; Anken, R.; Boonstra, J.; Braun, M.; Christianen, P.C.; de Geest, M.; Hauslage, J.; Hilbig, R.; Hill, R.J.; Lebert, M.; et al. Ground-based facilities for simulation of microgravity: Organism-specific recommendations for their use, and recommended terminology. Astrobiology 2013, 13, 1–17. [Google Scholar] [CrossRef]
- Hoson, T.; Kamisaka, S.; Masuda, Y.; Yamashita, M.; Buchen, B. Evaluation of the three-dimensional clinostat as a simulator of weightlessness. Planta 1997, 203, S187–S197. [Google Scholar] [CrossRef]
- Warnke, E.; Pietsch, J.; Wehland, M.; Bauer, J.; Infanger, M.; Gorog, M.; Hemmersbach, R.; Braun, M.; Ma, X.; Sahana, J.; et al. Spheroid formation of human thyroid cancer cells under simulated microgravity: A possible role of CTGF and CAV1. Cell. Commun. Signal. 2014, 12, 32. [Google Scholar] [CrossRef]
- Kopp, S.; Sahana, J.; Islam, T.; Petersen, A.G.; Bauer, J.; Corydon, T.J.; Schulz, H.; Saar, K.; Huebner, N.; Slumstrup, L.; et al. The role of NFkappaB in spheroid formation of human breast cancer cells cultured on the Random Positioning Machine. Sci. Rep. 2018, 8, 921. [Google Scholar] [CrossRef] [PubMed]
- Kruger, M.; Melnik, D.; Kopp, S.; Buken, C.; Sahana, J.; Bauer, J.; Wehland, M.; Hemmersbach, R.; Corydon, T.J.; Infanger, M.; et al. Fighting Thyroid Cancer with Microgravity Research. Int. J. Mol. Sci. 2019, 20, 2553. [Google Scholar] [CrossRef] [PubMed]
- Kopp, S.; Warnke, E.; Wehland, M.; Aleshcheva, G.; Magnusson, N.E.; Hemmersbach, R.; Corydon, T.J.; Bauer, J.; Infanger, M.; Grimm, D. Mechanisms of three-dimensional growth of thyroid cells during long-term simulated microgravity. Sci. Rep. 2015, 5, 16691. [Google Scholar] [CrossRef] [PubMed]
- Grimm, D.; Infanger, M.; Westphal, K.; Ulbrich, C.; Pietsch, J.; Kossmehl, P.; Vadrucci, S.; Baatout, S.; Flick, B.; Paul, M.; et al. A delayed type of three-dimensional growth of human endothelial cells under simulated weightlessness. Tissue Eng. Part A 2009, 15, 2267–2275. [Google Scholar] [CrossRef]
- Svejgaard, B.; Wehland, M.; Ma, X.; Kopp, S.; Sahana, J.; Warnke, E.; Aleshcheva, G.; Hemmersbach, R.; Hauslage, J.; Grosse, J.; et al. Common Effects on Cancer Cells Exerted by a Random Positioning Machine and a 2D Clinostat. PLoS ONE 2015, 10, e0135157. [Google Scholar] [CrossRef]
- Soranzo, C.; Della Torre, G.; Ingrosso, A. Formation, growth and morphology of multicellular tumor spheroids from a human colon carcinoma cell line (LoVo). Tumori 1986, 72, 459–467. [Google Scholar] [CrossRef]
- Cui, X.; Hartanto, Y.; Zhang, H. Advances in multicellular spheroids formation. J. R. Soc. Interface 2017, 14. [Google Scholar] [CrossRef]
- Kunz-Schughart, L.A. Multicellular tumor spheroids: Intermediates between monolayer culture and in vivo tumor. Cell. Biol. Int. 1999, 23, 157–161. [Google Scholar] [CrossRef]
- Mueller-Klieser, W. Method for the determination of oxygen consumption rates and diffusion coefficients in multicellular spheroids. Biophys. J. 1984, 46, 343–348. [Google Scholar] [CrossRef]
- Kunz-Schughart, L.A.; Freyer, J.P.; Hofstaedter, F.; Ebner, R. The use of 3-D cultures for high-throughput screening: The multicellular spheroid model. J. Biomol. Screen. 2004, 9, 273–285. [Google Scholar] [CrossRef]
- Corydon, T.J.; Mann, V.; Slumstrup, L.; Kopp, S.; Sahana, J.; Askou, A.L.; Magnusson, N.E.; Echegoyen, D.; Bek, T.; Sundaresan, A.; et al. Reduced Expression of Cytoskeletal and Extracellular Matrix Genes in Human Adult Retinal Pigment Epithelium Cells Exposed to Simulated Microgravity. Cell. Physiol. Biochem. 2016, 40, 1–17. [Google Scholar] [CrossRef]
- Nagy, J.A.; Dvorak, A.M.; Dvorak, H.F. VEGF-A and the induction of pathological angiogenesis. Annu. Rev. Pathol. 2007, 2, 251–275. [Google Scholar] [CrossRef]
- Goel, S.; Duda, D.G.; Xu, L.; Munn, L.L.; Boucher, Y.; Fukumura, D.; Jain, R.K. Normalization of the vasculature for treatment of cancer and other diseases. Physiol. Rev. 2011, 91, 1071–1121. [Google Scholar] [CrossRef]
- Carmeliet, P.; Jain, R.K. Molecular mechanisms and clinical applications of angiogenesis. Nature 2011, 473, 298–307. [Google Scholar] [CrossRef]
- Peach, C.J.; Mignone, V.W.; Arruda, M.A.; Alcobia, D.C.; Hill, S.J.; Kilpatrick, L.E.; Woolard, J. Molecular Pharmacology of VEGF-A Isoforms: Binding and Signalling at VEGFR2. Int. J. Mol. Sci. 2018, 19, 1264. [Google Scholar] [CrossRef]
- Takahashi, T.; Ueno, H.; Shibuya, M. VEGF activates protein kinase C-dependent, but Ras-independent Raf-MEK-MAP kinase pathway for DNA synthesis in primary endothelial cells. Oncogene 1999, 18, 2221–2230. [Google Scholar] [CrossRef] [PubMed]
- Gerber, H.P.; McMurtrey, A.; Kowalski, J.; Yan, M.; Keyt, B.A.; Dixit, V.; Ferrara, N. Vascular endothelial growth factor regulates endothelial cell survival through the phosphatidylinositol 3′-kinase/Akt signal transduction pathway. Requirement for Flk-1/KDR activation. J. Biol. Chem. 1998, 273, 30336–30343. [Google Scholar] [CrossRef]
- Conciatori, F.; Bazzichetto, C.; Falcone, I.; Pilotto, S.; Bria, E.; Cognetti, F.; Milella, M.; Ciuffreda, L. Role of mTOR Signaling in Tumor Microenvironment: An Overview. Int. J. Mol. Sci. 2018, 19, 2453. [Google Scholar] [CrossRef]
- Chen, X.L.; Nam, J.O.; Jean, C.; Lawson, C.; Walsh, C.T.; Goka, E.; Lim, S.T.; Tomar, A.; Tancioni, I.; Uryu, S.; et al. VEGF-induced vascular permeability is mediated by FAK. Dev. Cell. 2012, 22, 146–157. [Google Scholar] [CrossRef]
- Abu-Ghazaleh, R.; Kabir, J.; Jia, H.; Lobo, M.; Zachary, I. Src mediates stimulation by vascular endothelial growth factor of the phosphorylation of focal adhesion kinase at tyrosine 861, and migration and anti-apoptosis in endothelial cells. Biochem. J. 2001, 360, 255–264. [Google Scholar] [CrossRef]
- Koch, S.; Claesson-Welsh, L. Signal transduction by vascular endothelial growth factor receptors. Cold Spring Harb. Perspect. Med. 2012, 2, a006502. [Google Scholar] [CrossRef]
- Tchaikovski, V.; Fellbrich, G.; Waltenberger, J. The molecular basis of VEGFR-1 signal transduction pathways in primary human monocytes. Arterioscler. Thromb. Vasc. Biol. 2008, 28, 322–328. [Google Scholar] [CrossRef] [PubMed]
- Zhau, H.E.; Goodwin, T.J.; Chang, S.M.; Baker, T.L.; Chung, L.W. Establishment of a three-dimensional human prostate organoid coculture under microgravity-simulated conditions: Evaluation of androgen-induced growth and PSA expression. In Vitro Cell. Dev. Biol. Anim. 1997, 33, 375–380. [Google Scholar] [CrossRef] [PubMed]
- Clejan, S.; O’Connor, K.; Rosensweig, N. Tri-dimensional prostate cell cultures in simulated microgravity and induced changes in lipid second messengers and signal transduction. J. Cell. Mol. Med. 2001, 5, 60–73. [Google Scholar] [CrossRef]
- Margolis, L.; Hatfill, S.; Chuaqui, R.; Vocke, C.; Emmert-Buck, M.; Linehan, W.M.; Duray, P.H. Long term organ culture of human prostate tissue in a NASA-designed rotating wall bioreactor. J. Urol. 1999, 161, 290–297. [Google Scholar] [CrossRef]
- Leguy, C.A.D.; Delfos, R.; Pourquié, M.; Poelma, C.; Krooneman, J.; Westerweel, J.; van Loon, J.J.W.A. Fluid motion for microgravity simulations in a random positioning machine. Gravit. Space Biol. 2011, 25, 36–39. [Google Scholar]
- Ma, X.; Pietsch, J.; Wehland, M.; Schulz, H.; Saar, K.; Hubner, N.; Bauer, J.; Braun, M.; Schwarzwalder, A.; Segerer, J.; et al. Differential gene expression profile and altered cytokine secretion of thyroid cancer cells in space. FASEB J. 2014, 28, 813–835. [Google Scholar] [CrossRef] [PubMed]
- Viallard, C.; Larrivee, B. Tumor angiogenesis and vascular normalization: Alternative therapeutic targets. Angiogenesis 2017, 20, 409–426. [Google Scholar] [CrossRef]
- Yang, J.; Moses, M.A. Abstract 1293: Neutrophil gelatinase-associated lipocalin regulates the expression of angiogenic cytokines and VEGF in human breast and ovarian cancer cells. Cancer Res. 2010, 70, 1293. [Google Scholar] [CrossRef]
- Iannetti, A.; Pacifico, F.; Acquaviva, R.; Lavorgna, A.; Crescenzi, E.; Vascotto, C.; Tell, G.; Salzano, A.M.; Scaloni, A.; Vuttariello, E.; et al. The neutrophil gelatinase-associated lipocalin (NGAL), a NF-kappaB-regulated gene, is a survival factor for thyroid neoplastic cells. Proc. Natl. Acad. Sci. USA 2008, 105, 14058–14063. [Google Scholar] [CrossRef]
- Sun, Y.; Yokoi, K.; Li, H.; Gao, J.; Hu, L.; Liu, B.; Chen, K.; Hamilton, S.R.; Fan, D.; Sun, B.; et al. NGAL expression is elevated in both colorectal adenoma-carcinoma sequence and cancer progression and enhances tumorigenesis in xenograft mouse models. Clin. Cancer Res. 2011, 17, 4331–4340. [Google Scholar] [CrossRef] [PubMed]
- Zhang, X.F.; Zhang, Y.; Zhang, X.H.; Zhou, S.M.; Yang, G.G.; Wang, O.C.; Guo, G.L.; Yang, G.Y.; Hu, X.Q. Clinical significance of Neutrophil gelatinase-associated lipocalin(NGAL) expression in primary rectal cancer. BMC Cancer 2009, 9, 134. [Google Scholar] [CrossRef] [PubMed]
- Olea-Flores, M.; Zuniga-Eulogio, M.D.; Mendoza-Catalan, M.A.; Rodriguez-Ruiz, H.A.; Castaneda-Saucedo, E.; Ortuno-Pineda, C.; Padilla-Benavides, T.; Navarro-Tito, N. Extracellular-Signal Regulated Kinase: A Central Molecule Driving Epithelial-Mesenchymal Transition in Cancer. Int. J. Mol. Sci. 2019, 20, 2885. [Google Scholar] [CrossRef] [PubMed]
- Eblen, S.T. Extracellular-Regulated Kinases: Signaling From Ras to ERK Substrates to Control Biological Outcomes. Adv. Cancer Res. 2018, 138, 99–142. [Google Scholar] [CrossRef] [PubMed]
- Tee, S.S.; Suster, I.; Truong, S.; Jeong, S.; Eskandari, R.; DiGialleonardo, V.; Alvarez, J.A.; Aldeborgh, H.N.; Keshari, K.R. Targeted AKT Inhibition in Prostate Cancer Cells and Spheroids Reduces Aerobic Glycolysis and Generation of Hyperpolarized [1-(13)C] Lactate. Mol. Cancer Res. 2018, 16, 453–460. [Google Scholar] [CrossRef]
- Cully, M.; You, H.; Levine, A.J.; Mak, T.W. Beyond PTEN mutations: The PI3K pathway as an integrator of multiple inputs during tumorigenesis. Nat. Rev. Cancer 2006, 6, 184–192. [Google Scholar] [CrossRef]
- Available online: https://clinicaltrials.gov/ (accessed on 13 February 2020).
- Magani, F.; Peacock, S.O.; Rice, M.A.; Martinez, M.J.; Greene, A.M.; Magani, P.S.; Lyles, R.; Weitz, J.R.; Burnstein, K.L. Targeting AR Variant-Coactivator Interactions to Exploit Prostate Cancer Vulnerabilities. Mol. Cancer Res. 2017, 15, 1469–1480. [Google Scholar] [CrossRef]
- Jain, N.; Zhang, T.; Fong, S.L.; Lim, C.P.; Cao, X. Repression of Stat3 activity by activation of mitogen-activated protein kinase (MAPK). Oncogene 1998, 17, 3157–3167. [Google Scholar] [CrossRef][Green Version]
- Shen, B.Q.; Lee, D.Y.; Gerber, H.P.; Keyt, B.A.; Ferrara, N.; Zioncheck, T.F. Homologous up-regulation of KDR/Flk-1 receptor expression by vascular endothelial growth factor in vitro. J. Biol. Chem. 1998, 273, 29979–29985. [Google Scholar] [CrossRef]
- Fan, P.; Agboke, F.A.; McDaniel, R.E.; Sweeney, E.E.; Zou, X.; Creswell, K.; Jordan, V.C. Inhibition of c-Src blocks oestrogen-induced apoptosis and restores oestrogen-stimulated growth in long-term oestrogen-deprived breast cancer cells. Eur. J. Cancer 2014, 50, 457–468. [Google Scholar] [CrossRef]
- Calalb, M.B.; Polte, T.R.; Hanks, S.K. Tyrosine phosphorylation of focal adhesion kinase at sites in the catalytic domain regulates kinase activity: A role for Src family kinases. Mol. Cell. Biol. 1995, 15, 954–963. [Google Scholar] [CrossRef] [PubMed]
- Dumbauld, D.W.; Shin, H.; Gallant, N.D.; Michael, K.E.; Radhakrishna, H.; Garcia, A.J. Contractility modulates cell adhesion strengthening through focal adhesion kinase and assembly of vinculin-containing focal adhesions. J. Cell. Physiol. 2010, 223, 746–756. [Google Scholar] [CrossRef] [PubMed]
- Bauer, T.J.; Gombocz, E.; Kruger, M.; Sahana, J.; Corydon, T.J.; Bauer, J.; Infanger, M.; Grimm, D. Augmenting cancer cell proteomics with cellular images—A semantic approach to understand focal adhesion. J. Biomed. Inform. 2019, 100, 103320. [Google Scholar] [CrossRef] [PubMed]
- Humphries, J.D.; Wang, P.; Streuli, C.; Geiger, B.; Humphries, M.J.; Ballestrem, C. Vinculin controls focal adhesion formation by direct interactions with talin and actin. J. Cell. Biol. 2007, 179, 1043–1057. [Google Scholar] [CrossRef]
- Chen, P.; Lei, L.; Wang, J.; Zou, X.; Zhang, D.; Deng, L.; Wu, D. Downregulation of Talin1 promotes hepatocellular carcinoma progression through activation of the ERK1/2 pathway. Cancer Sci. 2017, 108, 1157–1168. [Google Scholar] [CrossRef]
- Small, J.V.; Stradal, T.; Vignal, E.; Rottner, K. The lamellipodium: Where motility begins. Trends Cell. Biol. 2002, 12, 112–120. [Google Scholar] [CrossRef]
- Tojkander, S.; Gateva, G.; Lappalainen, P. Actin stress fibers--assembly, dynamics and biological roles. J. Cell. Sci. 2012, 125, 1855–1864. [Google Scholar] [CrossRef]
- Rijken, P.J.; de Groot, R.P.; Kruijer, W.; de Laat, S.W.; Verkleij, A.J.; Boonstra, J. Identification of specific gravity sensitive signal transduction pathways in human A431 carcinoma cells. Adv. Space Res. 1992, 12, 145–152. [Google Scholar] [CrossRef]
- Mann, V.; Grimm, D.; Corydon, T.J.; Kruger, M.; Wehland, M.; Riwaldt, S.; Sahana, J.; Kopp, S.; Bauer, J.; Reseland, J.E.; et al. Changes in Human Foetal Osteoblasts Exposed to the Random Positioning Machine and Bone Construct Tissue Engineering. Int. J. Mol. Sci. 2019, 20, 1357. [Google Scholar] [CrossRef]
- Nabavi, N.; Khandani, A.; Camirand, A.; Harrison, R.E. Effects of microgravity on osteoclast bone resorption and osteoblast cytoskeletal organization and adhesion. Bone 2011, 49, 965–974. [Google Scholar] [CrossRef]
- Ulbrich, C.; Pietsch, J.; Grosse, J.; Wehland, M.; Schulz, H.; Saar, K.; Hubner, N.; Hauslage, J.; Hemmersbach, R.; Braun, M.; et al. Differential gene regulation under altered gravity conditions in follicular thyroid cancer cells: Relationship between the extracellular matrix and the cytoskeleton. Cell. Physiol. Biochem. 2011, 28, 185–198. [Google Scholar] [CrossRef] [PubMed]
- Grosse, J.; Wehland, M.; Pietsch, J.; Ma, X.; Ulbrich, C.; Schulz, H.; Saar, K.; Hubner, N.; Hauslage, J.; Hemmersbach, R.; et al. Short-term weightlessness produced by parabolic flight maneuvers altered gene expression patterns in human endothelial cells. FASEB J. 2012, 26, 639–655. [Google Scholar] [CrossRef]
- Bonnans, C.; Chou, J.; Werb, Z. Remodelling the extracellular matrix in development and disease. Nat. Rev. Mol. Cell. Biol. 2014, 15, 786–801. [Google Scholar] [CrossRef] [PubMed]
- Kopp, S.; Kruger, M.; Bauer, J.; Wehland, M.; Corydon, T.J.; Sahana, J.; Nassef, M.Z.; Melnik, D.; Bauer, T.J.; Schulz, H.; et al. Microgravity Affects Thyroid Cancer Cells during the TEXUS-53 Mission Stronger than Hypergravity. Int. J. Mol. Sci. 2018, 19, 4001. [Google Scholar] [CrossRef] [PubMed]
- Birchmeier, W.; Behrens, J. Cadherin expression in carcinomas: Role in the formation of cell junctions and the prevention of invasiveness. Biochim. Biophys. Acta 1994, 1198, 11–26. [Google Scholar] [CrossRef]
- Semb, H.; Christofori, G. The tumor-suppressor function of E-cadherin. Am. J. Hum. Genet. 1998, 63, 1588–1593. [Google Scholar] [CrossRef]
- Infanger, M.; Kossmehl, P.; Shakibaei, M.; Bauer, J.; Kossmehl-Zorn, S.; Cogoli, A.; Curcio, F.; Oksche, A.; Wehland, M.; Kreutz, R.; et al. Simulated weightlessness changes the cytoskeleton and extracellular matrix proteins in papillary thyroid carcinoma cells. Cell. Tissue Res. 2006, 324, 267–277. [Google Scholar] [CrossRef]
- Sahana, J.; Nassef, M.Z.; Wehland, M.; Kopp, S.; Kruger, M.; Corydon, T.J.; Infanger, M.; Bauer, J.; Grimm, D. Decreased E-Cadherin in MCF7 Human Breast Cancer Cells Forming Multicellular Spheroids Exposed to Simulated Microgravity. Proteomics 2018, 18, e1800015. [Google Scholar] [CrossRef]
- Kliewe, F.; Kaling, S.; Lotzsch, H.; Artelt, N.; Schindler, M.; Rogge, H.; Schroder, S.; Scharf, C.; Amann, K.; Daniel, C.; et al. Fibronectin is up-regulated in podocytes by mechanical stress. FASEB J. 2019. [Google Scholar] [CrossRef]
- Garakani, K.; Shams, H.; Mofrad, M.R.K. Mechanosensitive Conformation of Vinculin Regulates Its Binding to MAPK1. Biophys. J. 2017, 112, 1885–1893. [Google Scholar] [CrossRef]
- Ghrebi, S.; Hamilton, D.W.; Douglas Waterfield, J.; Brunette, D.M. The effect of surface topography on cell shape and early ERK1/2 signaling in macrophages; linkage with FAK and Src. J. Biomed. Mater. Res. A 2013, 101, 2118–2128. [Google Scholar] [CrossRef]
- Wei, X.; Zhou, D.; Wang, H.; Ding, N.; Cui, X.X.; Wang, H.; Verano, M.; Zhang, K.; Conney, A.H.; Zheng, X.; et al. Effects of pyridine analogs of curcumin on growth, apoptosis and NF-kappaB activity in prostate cancer PC-3 cells. Anticancer Res. 2013, 33, 1343–1350. [Google Scholar] [PubMed]
- Wu, F.; Wu, S.; Gou, X. Identification of biomarkers and potential molecular mechanisms of clear cell renal cell carcinoma. Neoplasma 2018, 65, 242–252. [Google Scholar] [CrossRef] [PubMed]
- von Au, A.; Vasel, M.; Kraft, S.; Sens, C.; Hackl, N.; Marx, A.; Stroebel, P.; Hennenlotter, J.; Todenhofer, T.; Stenzl, A.; et al. Circulating fibronectin controls tumor growth. Neoplasia 2013, 15, 925–938. [Google Scholar] [CrossRef] [PubMed]
- Irby, R.B.; Yeatman, T.J. Role of Src expression and activation in human cancer. Oncogene 2000, 19, 5636–5642. [Google Scholar] [CrossRef]
- Mori, T.; Ono, K.; Kariya, Y.; Ogawa, T.; Higashi, S.; Miyazaki, K. Laminin-3B11, a novel vascular-type laminin capable of inducing prominent lamellipodial protrusions in microvascular endothelial cells. J. Biol. Chem. 2010, 285, 35068–35078. [Google Scholar] [CrossRef]
- Chou, M.T.; Wang, J.; Fujita, D.J. Src kinase becomes preferentially associated with the VEGFR, KDR/Flk-1, following VEGF stimulation of vascular endothelial cells. BMC Biochem. 2002, 3, 32. [Google Scholar] [CrossRef]
- Fleming, R.Y.; Ellis, L.M.; Parikh, N.U.; Liu, W.; Staley, C.A.; Gallick, G.E. Regulation of vascular endothelial growth factor expression in human colon carcinoma cells by activity of src kinase. Surgery 1997, 122, 501–507. [Google Scholar] [CrossRef]
- Munshi, N.; Groopman, J.E.; Gill, P.S.; Ganju, R.K. c-Src mediates mitogenic signals and associates with cytoskeletal proteins upon vascular endothelial growth factor stimulation in Kaposi’s sarcoma cells. J. Immunol. 2000, 164, 1169–1174. [Google Scholar] [CrossRef]
- Albert, L.; Karsy, M.; Murali, R.; Jhanwar-Uniyal, M. Inhibition of mTOR Activates the MAPK Pathway in Glioblastoma Multiforme. Cancer Genom. Proteom. 2009, 6, 255–261. [Google Scholar]
- Kinkade, C.W.; Castillo-Martin, M.; Puzio-Kuter, A.; Yan, J.; Foster, T.H.; Gao, H.; Sun, Y.; Ouyang, X.; Gerald, W.L.; Cordon-Cardo, C.; et al. Targeting AKT/mTOR and ERK MAPK signaling inhibits hormone-refractory prostate cancer in a preclinical mouse model. J. Clin. Investig. 2008, 118, 3051–3064. [Google Scholar] [CrossRef]
- Engelman, J.A.; Chen, L.; Tan, X.; Crosby, K.; Guimaraes, A.R.; Upadhyay, R.; Maira, M.; McNamara, K.; Perera, S.A.; Song, Y.; et al. Effective use of PI3K and MEK inhibitors to treat mutant Kras G12D and PIK3CA H1047R murine lung cancers. Nat. Med. 2008, 14, 1351–1356. [Google Scholar] [CrossRef] [PubMed]
- Bendtsen, M.A.F.; Grimm, D.; Bauer, J.; Wehland, M.; Wise, P.; Magnusson, N.E.; Infanger, M.; Kruger, M. Hypertension Caused by Lenvatinib and Everolimus in the Treatment of Metastatic Renal Cell Carcinoma. Int. J. Mol. Sci. 2017, 18, 1736. [Google Scholar] [CrossRef] [PubMed]
- Nielsen, O.H.; Grimm, D.; Wehland, M.; Bauer, J.; Magnusson, N.E. Anti-Angiogenic Drugs in the Treatment of Metastatic Renal Cell Carcinoma: Advances in Clinical Application. Curr. Vasc. Pharm. 2015, 13, 381–391. [Google Scholar] [CrossRef] [PubMed]
- Kaighn, M.E.; Narayan, K.S.; Ohnuki, Y.; Lechner, J.F.; Jones, L.W. Establishment and characterization of a human prostatic carcinoma cell line (PC-3). Investig. Urol. 1979, 17, 16–23. [Google Scholar]
- Wuest, S.L.; Richard, S.; Kopp, S.; Grimm, D.; Egli, M. Simulated microgravity: Critical review on the use of random positioning machines for mammalian cell culture. Biomed. Res. Int. 2015, 2015, 971474. [Google Scholar] [CrossRef]
- Grimm, D.; Egli, M.; Kruger, M.; Riwaldt, S.; Corydon, T.J.; Kopp, S.; Wehland, M.; Wise, P.; Infanger, M.; Mann, V.; et al. Tissue Engineering Under Microgravity Conditions-Use of Stem Cells and Specialized Cells. Stem Cells Dev. 2018, 27, 787–804. [Google Scholar] [CrossRef]
- Kopp, S.; Slumstrup, L.; Corydon, T.J.; Sahana, J.; Aleshcheva, G.; Islam, T.; Magnusson, N.E.; Wehland, M.; Bauer, J.; Infanger, M.; et al. Identifications of novel mechanisms in breast cancer cells involving duct-like multicellular spheroid formation after exposure to the Random Positioning Machine. Sci. Rep. 2016, 6, 26887. [Google Scholar] [CrossRef]
- Grimm, D.; Jabusch, H.C.; Kossmehl, P.; Huber, M.; Fredersdorf, S.; Griese, D.P.; Kramer, B.K.; Kromer, E.P. Experimental diabetes and left ventricular hypertrophy: Effects of beta-receptor blockade. Cardiovasc. Pathol. 2002, 11, 229–237. [Google Scholar] [CrossRef]
- Grosse, J.; Warnke, E.; Pohl, F.; Magnusson, N.E.; Wehland, M.; Infanger, M.; Eilles, C.; Grimm, D. Impact of sunitinib on human thyroid cancer cells. Cell. Physiol. Biochem. 2013, 32, 154–170. [Google Scholar] [CrossRef]
- Magnusson, N.E.; Hornum, M.; Jorgensen, K.A.; Hansen, J.M.; Bistrup, C.; Feldt-Rasmussen, B.; Flyvbjerg, A. Plasma neutrophil gelatinase associated lipocalin (NGAL) is associated with kidney function in uraemic patients before and after kidney transplantation. BMC Nephrol. 2012, 13, 8. [Google Scholar] [CrossRef] [PubMed]
- Lützenberg, R.; Solano, K.; Buken, C.; Sahana, J.; Riwaldt, S.; Kopp, S.; Kruger, M.; Schulz, H.; Saar, K.; Huebner, N.; et al. Pathway Analysis Hints Towards Beneficial Effects of Long-Term Vibration on Human Chondrocytes. Cell. Physiol. Biochem. 2018, 47, 1729–1741. [Google Scholar] [CrossRef] [PubMed]


© 2020 by the authors. Licensee MDPI, Basel, Switzerland. This article is an open access article distributed under the terms and conditions of the Creative Commons Attribution (CC BY) license (http://creativecommons.org/licenses/by/4.0/).