Article

Exploring the Photodynamic Properties of Two Antiproliferative Benzodiazopyrrole Derivatives

1
Department of Pharmacy, University of Naples Federico II, 80131 Naples, Italy
2
Department of Physics “Ettore Pancini”, University of Naples Federico II, 80126 Naples, Italy
3
CoNISMa–Italian Interuniversity Consortium on Marine Sciences, Piazzale Flaminio 9, 00196 Rome, Italy
4
Department of Pharmacy/DIFARMA, University of Salerno, 84084 Fisciano, Salerno, Italy
*
Authors to whom correspondence should be addressed.
These authors contributed equally to this work.
Int. J. Mol. Sci. 2020, 21(4), 1246; https://doi.org/10.3390/ijms21041246
Submission received: 13 December 2019 / Revised: 7 February 2020 / Accepted: 11 February 2020 / Published: 13 February 2020
(This article belongs to the Special Issue Solution Chemical Kinetics 2.0)

Abstract

:
The identification of molecules whose biological activity can be properly modulated by light is a promising therapeutic approach aimed to improve drug selectivity and efficacy on the molecular target and to limit the side effects compared to traditional drugs. Recently, two photo-switchable diastereomeric benzodiazopyrrole derivatives 1RR and 1RS have been reported as microtubules targeting agents (MTAs) on human colorectal carcinoma p53 null cell line (HCT 116 p53-/-). Their IC50 was enhanced upon Light Emitting Diode (LED) irradiation at 435 nm and was related to their cis form. Here we have investigated the photo-responsive behavior of the acid derivatives of 1RR and 1RS, namely, d1RR and d1RS, in phosphate buffer solutions at different pH. The comparison of the UV spectra, acquired before and after LED irradiation, indicated that the transcis conversion of d1RR and d1RS is affected by the degree of ionization. The apparent rate constants were calculated from the kinetic data by means of fast UV spectroscopy and the conformers of the putative ionic species present in solution (pH range: 5.7–8.0) were modelled. Taken together, our experimental and theoretical results suggest that the photo-conversions of trans d1RR/d1RS into the corresponding cis forms and the thermal decay of cis d1RR/d1RS are dependent on the presence of diazonium form of d1RR/d1RS. Finally, a photo-reaction was detected only for d1RR after prolonged LED irradiation in acidic medium, and the resulting product was characterized by means of Liquid Chromatography coupled to High resolution Mass Spectrometry (LC-HRMS) and Nuclear Magnetic Resonance (NMR) spectroscopy.

1. Introduction

Photo-switchable molecules have gained increasing attention in recent years, as they can provide, by means of light irradiation having a proper wavelength, external spatio-temporal control of specific events [1,2]. This important feature makes photo-switchable molecules potentially useful in a wide-range of applications ranging from molecular electronics [3,4,5] to pharmacology [6,7,8], and molecular model for visualizing interactions between biomolecules [9,10,11,12]. Azobenzenes are the most studied class of photo-switchable molecules, in view of their ability to undergo, under appropriate irradiation, a quantitative and reversible trans-cis isomerization [3,13]. Furthermore, depending on the intended use, azobenzenes can be easily functionalized with different chemical groups enabling a fine modulation of their photochromic responses [3,13,14,15,16]. More recently, azoheteroarenes, in which one or both the benzene rings of the azobenzene structure are replaced with one or two hetero-aromatic five-membered ring(s) have shown interesting photo-responsive properties [17,18,19].
In this context, we have recently described the synthesis of some benzodiazopyrrole derivatives with photo-responsive antiproliferative activity against HCT 116 p53-/- cancer cells (Figure 1) [20]. In particular, results of the 3-(4,5-dimethylthiazol-2-yl)-2,5-diphenyltetrazolium bromide (MTT) test performed on this cancer cell line treated with the synthesized molecules and kept in the dark or under irradiation with pulsed LED at 435 nm, showed that the occurrence of the trans-cis isomerization is correlated with the degree of cell growth inhibition [20]. The obtained data suggested that the cis isomers showed the greatest antiproliferative activities. Two of these molecules forming the diastereomeric mixture named 1a (Figure 1), exhibited the most interesting biological properties. Indeed, under irradiation, the inhibition of HCT 116 p53-/- cell growth treated with 1a was greater than those treated with its pure components, 1RR or 1RS, thus, suggesting that the biological activity of 1a could be associated with different mechanisms of action from those induced by 1RR and 1RS [20]. In addition, an in vitro tubulin polymerization test also evidenced that, under LED irradiation, the two stereomers differently inhibited the tubulin aggregation into microtubules [20].
With the aim to acquire more detailed information on the physico-chemical properties that can confer to 1a its specific biological properties, and considering that the tumor aggressiveness is correlated with the lowering of the pH around the membrane of cancer cells [21,22,23,24], we have performed more in depth investigations on the photo-responsive behavior of d1RR and d1RS (the free carboxylic acids of 1RR and 1RS, Figure 1) in the pH range 8.0–5.7. To this purpose, we carried out UV and fast UV spectroscopy, and computational analyses. Furthermore, we have also explored the photo-transformation of d1RR in acidic condition under prolonged LED irradiation using Liquid Chromatography High Resolution Mass Spectrometry (LC-HRMS), 1D and 2D NMR and UV techniques.

2. Results and Discussion

2.1. The Behavior of Trans/Cis Isomers of d1RR/d1RS in Differently Buffered Water-Based Solutions

In order to characterize the photo-responsive properties of d1RR/d1RS in phosphate buffered solutions, the UV spectra of the two stereomers at different pH (8.0, 7.5, 7.0, 6.7, 6.5, 5.7) were acquired, in the dark and under LED irradiation at 435 nm. In the dark, the UV spectra of d1RR/d1RS showed two main, partially overlapped, UV bands centred at 394 and 424 nm (Figure 2A and Figure S1A). At pH = 8.0 and 7.0, after the irradiation of the samples, the UV profiles underwent some changes. At pH = 8.0 (Figure 2B and Figure S1B) the comparison of the two UV spectra, acquired before and after the irradiation, mostly showed a strong decreasing in the intensity of the UV bands at 394 and 424 nm and the appearance of a new band centred at 343 nm. This band, in the corresponding methyl ester derivatives 1RR/1RS, has been attributed to the presence of the cis stereomer [20], which, according to the literature, was responsible for the differences of the light absorption before and after irradiation, due to the non-planar configuration of cis stereomers [13,14,15,16,17,18,19]. At pH = 7.0 only a slight decrease of the two main bands was observed in the UV spectra before and after the irradiation. A similar, but not equivalent behavior was observed for 1RR/1RS in water-based solutions at pH 7.0. Indeed, in the case of d1RR and d1RS, the relative intensity between the band at 340 nm (cis isomer) and those centred around 400 nm (trans isomer) was significantly reduced with respect to that previously observed for 1RR/1RS, possibly because an increasing of the rate of the cistrans isomerization caused a change of the relative ratio between the concentration of the cis/trans isomers, because other species are present in solution, or both. Furthermore, this phenomenon was emphasized by increasing the pH of the buffered solution. Indeed, at pH < 7.0, there was no change in the UV band (Figure 2C,D and Figure S1C,D). Despite this, the cis→trans isomerization could still happen at this pH value, although it could not be monitored with normal UV spectroscopy.
To better explore this phenomenon, we monitored the trans→cis conversion of d1RR/d1RS under laser irradiation at 435 nm and the cis→trans thermal decay in the dark in buffered solutions (20 mM of phosphate buffer solutions at pH values of 5.7, 6.5, 6.7, 7.0, 7.5 and 8.0) by means of fast UV spectroscopy (a picture of this experimental set-up of the instrument is reported in Figure S2). The acquisition of time-dependent absorption spectra in the 220–430 nm range gave rise to the 2D graphical representation of time-dependent changes in absorption bands (Figure 3A,B and Figure S3A,B). Data coming from each set of measurements were processed at two wavelengths, 340 and 400 nm (Figure 3C,D and Figure S3C,D), from which the apparent rate constants for d1RR/d1RS trans→cis photo-conversions and those for the corresponding thermal relaxations were calculated (Table 1). As an example, the analysis of d1RR trans→cis photo-conversion at pH = 8.0, and of the corresponding thermal decay in the dark, as well as those of d1RR/d1RS at pH 7.0 and 5.7, are shown in Figure 3 and Figures S3–S5. Under irradiation at 435 nm, a time-dependent decrease of the UV band around 400 nm (trans isomer) and an increase of that around 340 nm (cis isomer) occurred (Figure 3). As above mentioned, this observation should account for a trans-to-cis photo-isomerization. Conversely, turning off the laser irradiation, caused a time-dependent increase of the UV band at 400 nm (trans isomer) and a decrease of that at ≈ 340 nm (cis isomer) (Figure S3), due to the cis thermal decay. Noteworthy, the data reported in the Figures S4 and S5, showing the changes in the absorption bands centered at 340 and 400 nm for both d1RR/d1RS under laser irradiation and in the dark (i.e., with laser off), suggest that the cis-trans isomerizations always occurred at the lower pH value.
All the calculated values of the apparent rate constants increase by decreasing the pH of the solutions, or also decreases by increasing the concentration of OH ions (Table 1 and Figure 3 and Figure 4). These trends showed that the trans↔cis d1RR/d1RS conversions exhibited the general effects of acidic catalysis, suggesting that, in water-based solutions, both the isomerizations could be affected by the acid-base ionizations [25,26,27,28,29].
At least in principle, we can consider that at very low pH both trans/cis isomers of d1RR/d1RS exist only in the corresponding protonated species provoking the highest possible rate for the transcis conversion. In contrast, in alkaline condition, the concentration of the totally unprotonated species reaches its maximum value making lowest the rate of the transcis conversions. Around the pH corresponding to the pKa value of the diazonium ions, the protonated and unprotonated species of d1RR/d1RS trans/cis isomers should coexist in the solution, and the apparent rate constant of the transcis isomerization strongly depends on the relative abundance of the two species. Accordingly, a small variation of pH in the range containing the pKa, inducing an inversion in the relative abundance of protonated and unprotonated species, should allow a strong variation of the transcis conversion rates [25,26,27,28,29]. Thus, plots of the apparent rate constants versus pH should give titration curves, from which the pKa of the diazo group in each species could be obtained. However, our data gave rise to only partial titration curves (Figure 4A,B and Figure S6A,B) since, we explored the pH/rate combinations around the physiological pH value. Despite this, the data reported in Table 1 were plotted and tentatively interpolated (Figure 4 and Figure S6) according to the method developed by Dunn et al. [27] to analyze the transcis isomerization of diazobenzenes in acidic medium. From the parameters of the corresponding curves (Table S1) pKa values in the range of 5.1–6.0 were obtained.
Interestingly, for both the two stereomers, d1RR/d1RS, the two trends of the apparent rate constants calculated from the measurements performed at 400 (a band of the trans isomers) and 340 nm (a band of the cis stereomers), as well as the trend of each absorption band measured under irradiation or during the thermal decay showed some differences (Figure 4 and Figure S6), possibly because of the differences in pKa values of the d1RR/d1RS cis and trans isomers (Table S1).
At lower pHs, the trend of the apparent rate constants, obtained from the measures performed at 400 and 340 nm, were also reversed comparing the two stereomers d1RR (Figure 4) and d1RS (Figure S6). Indeed, for d1RS at pH <6.5, the apparent rate constants obtained at 400 nm increased faster than that measured at 340 nm, and the opposite trend was observed for d1RR.
Accordingly, the measured absorptions at 340 and 400 nm at different pH should contain also the contribution of the UV bands of at least one specie, that is the zwitterionic form of d1RR/d1RS. (see the computational analyses below). The final amplitude of a specific absorption band should depend on the molar extinction coefficient and on the concentration of each species, cis, trans or the zwitterionic form, at a specific wavelength.
To further explore this issue, we performed further UV versus pH titrations on the aqueous samples of d1RR and d1RS buffered at pH = 8.0. At each pH variation, the UV/vis spectra of the trans isomers were measured (Figure S7). The obtained data showed that an additional UV band centred at about 500 nm appeared in the UV spectra of both species at pH lower than 4.5. According to literature data [25,26,27,28,29], this absorption band should be related to the corresponding diazonium ions of d1RR/d1RS. Each titration curve obtained plotting the absorptions measured at 400 or 495 nm versus pH supported the presence of an inflection point attributable to a pKa around 2.0-2.5 for each specie (Figure 4C and Figure S6C).

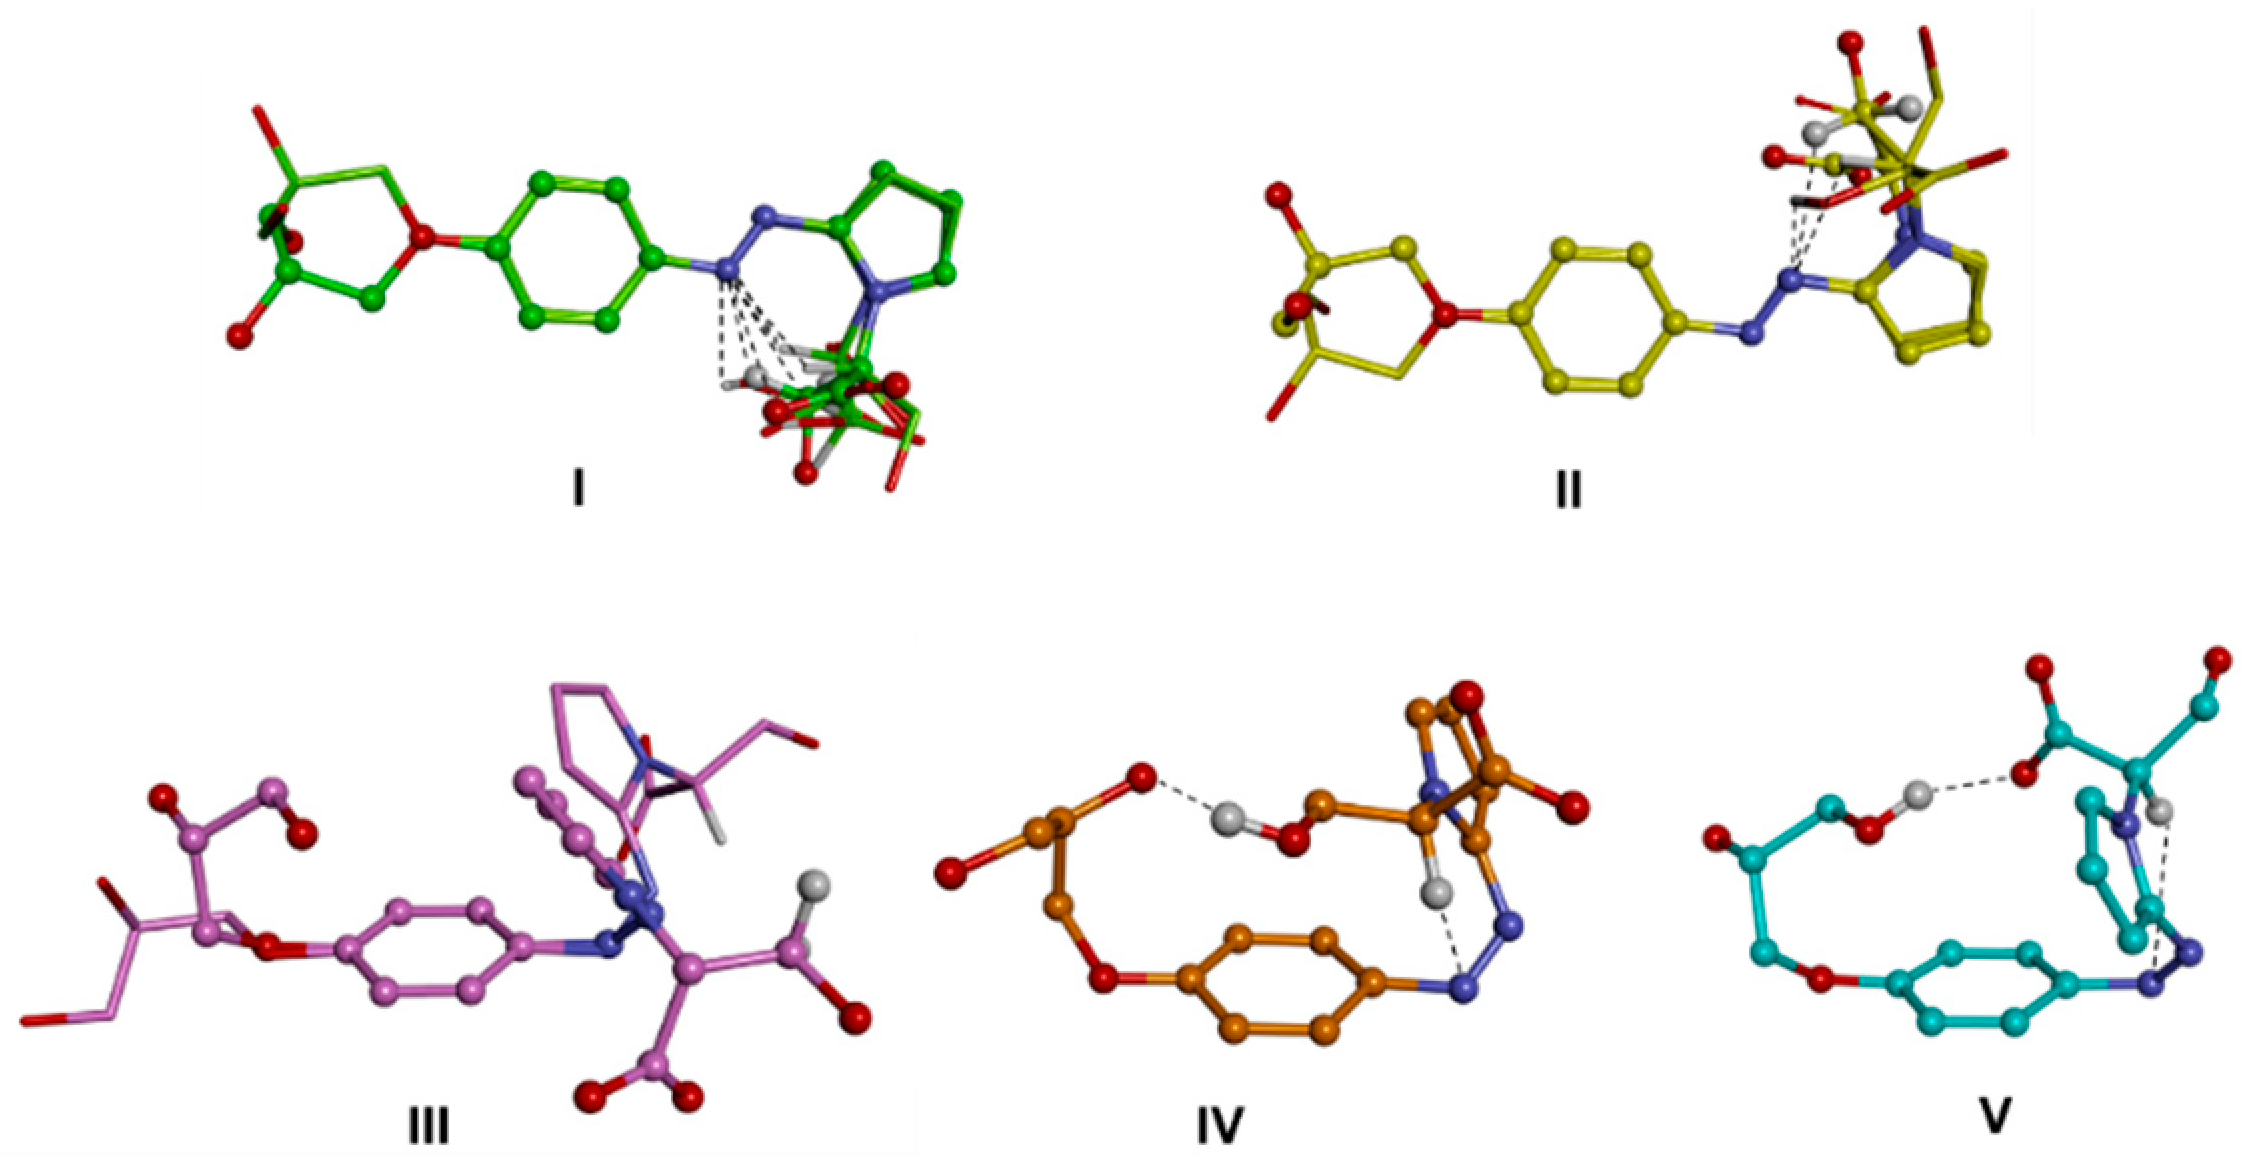
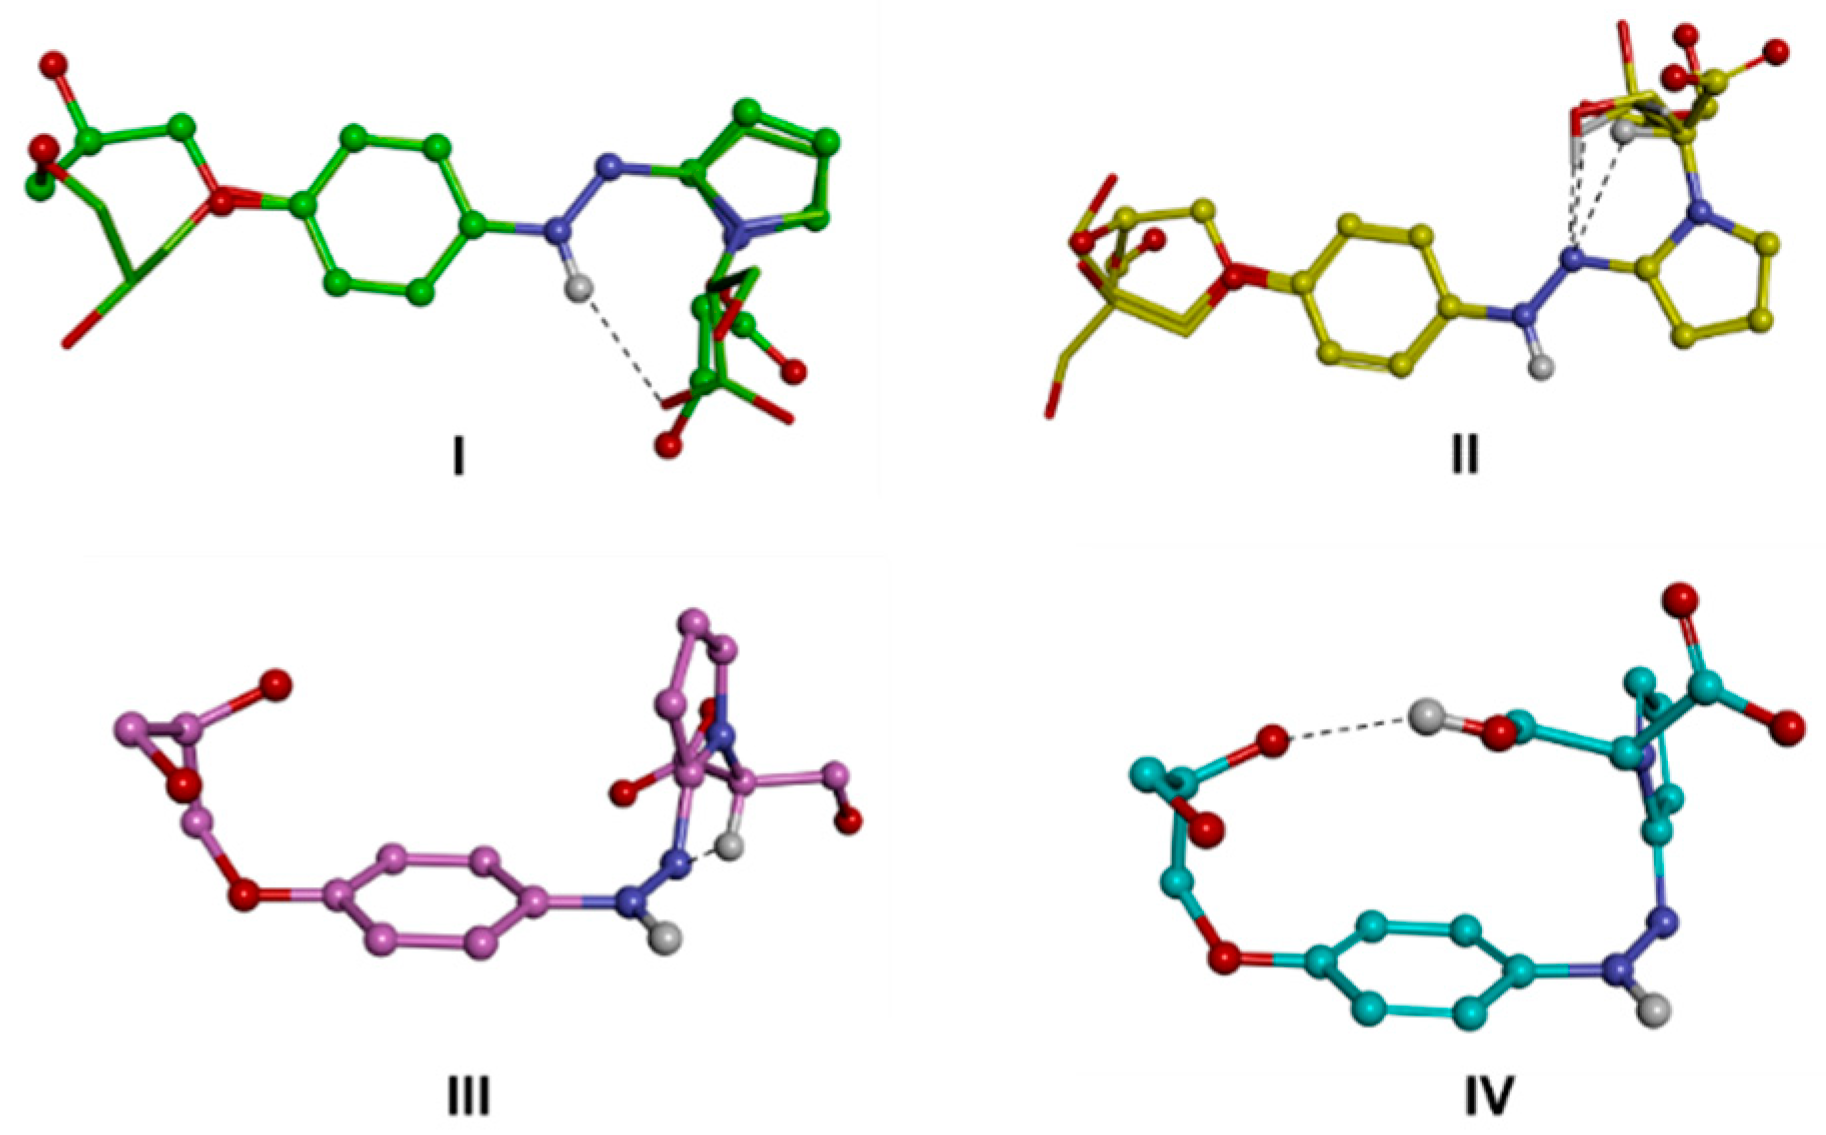
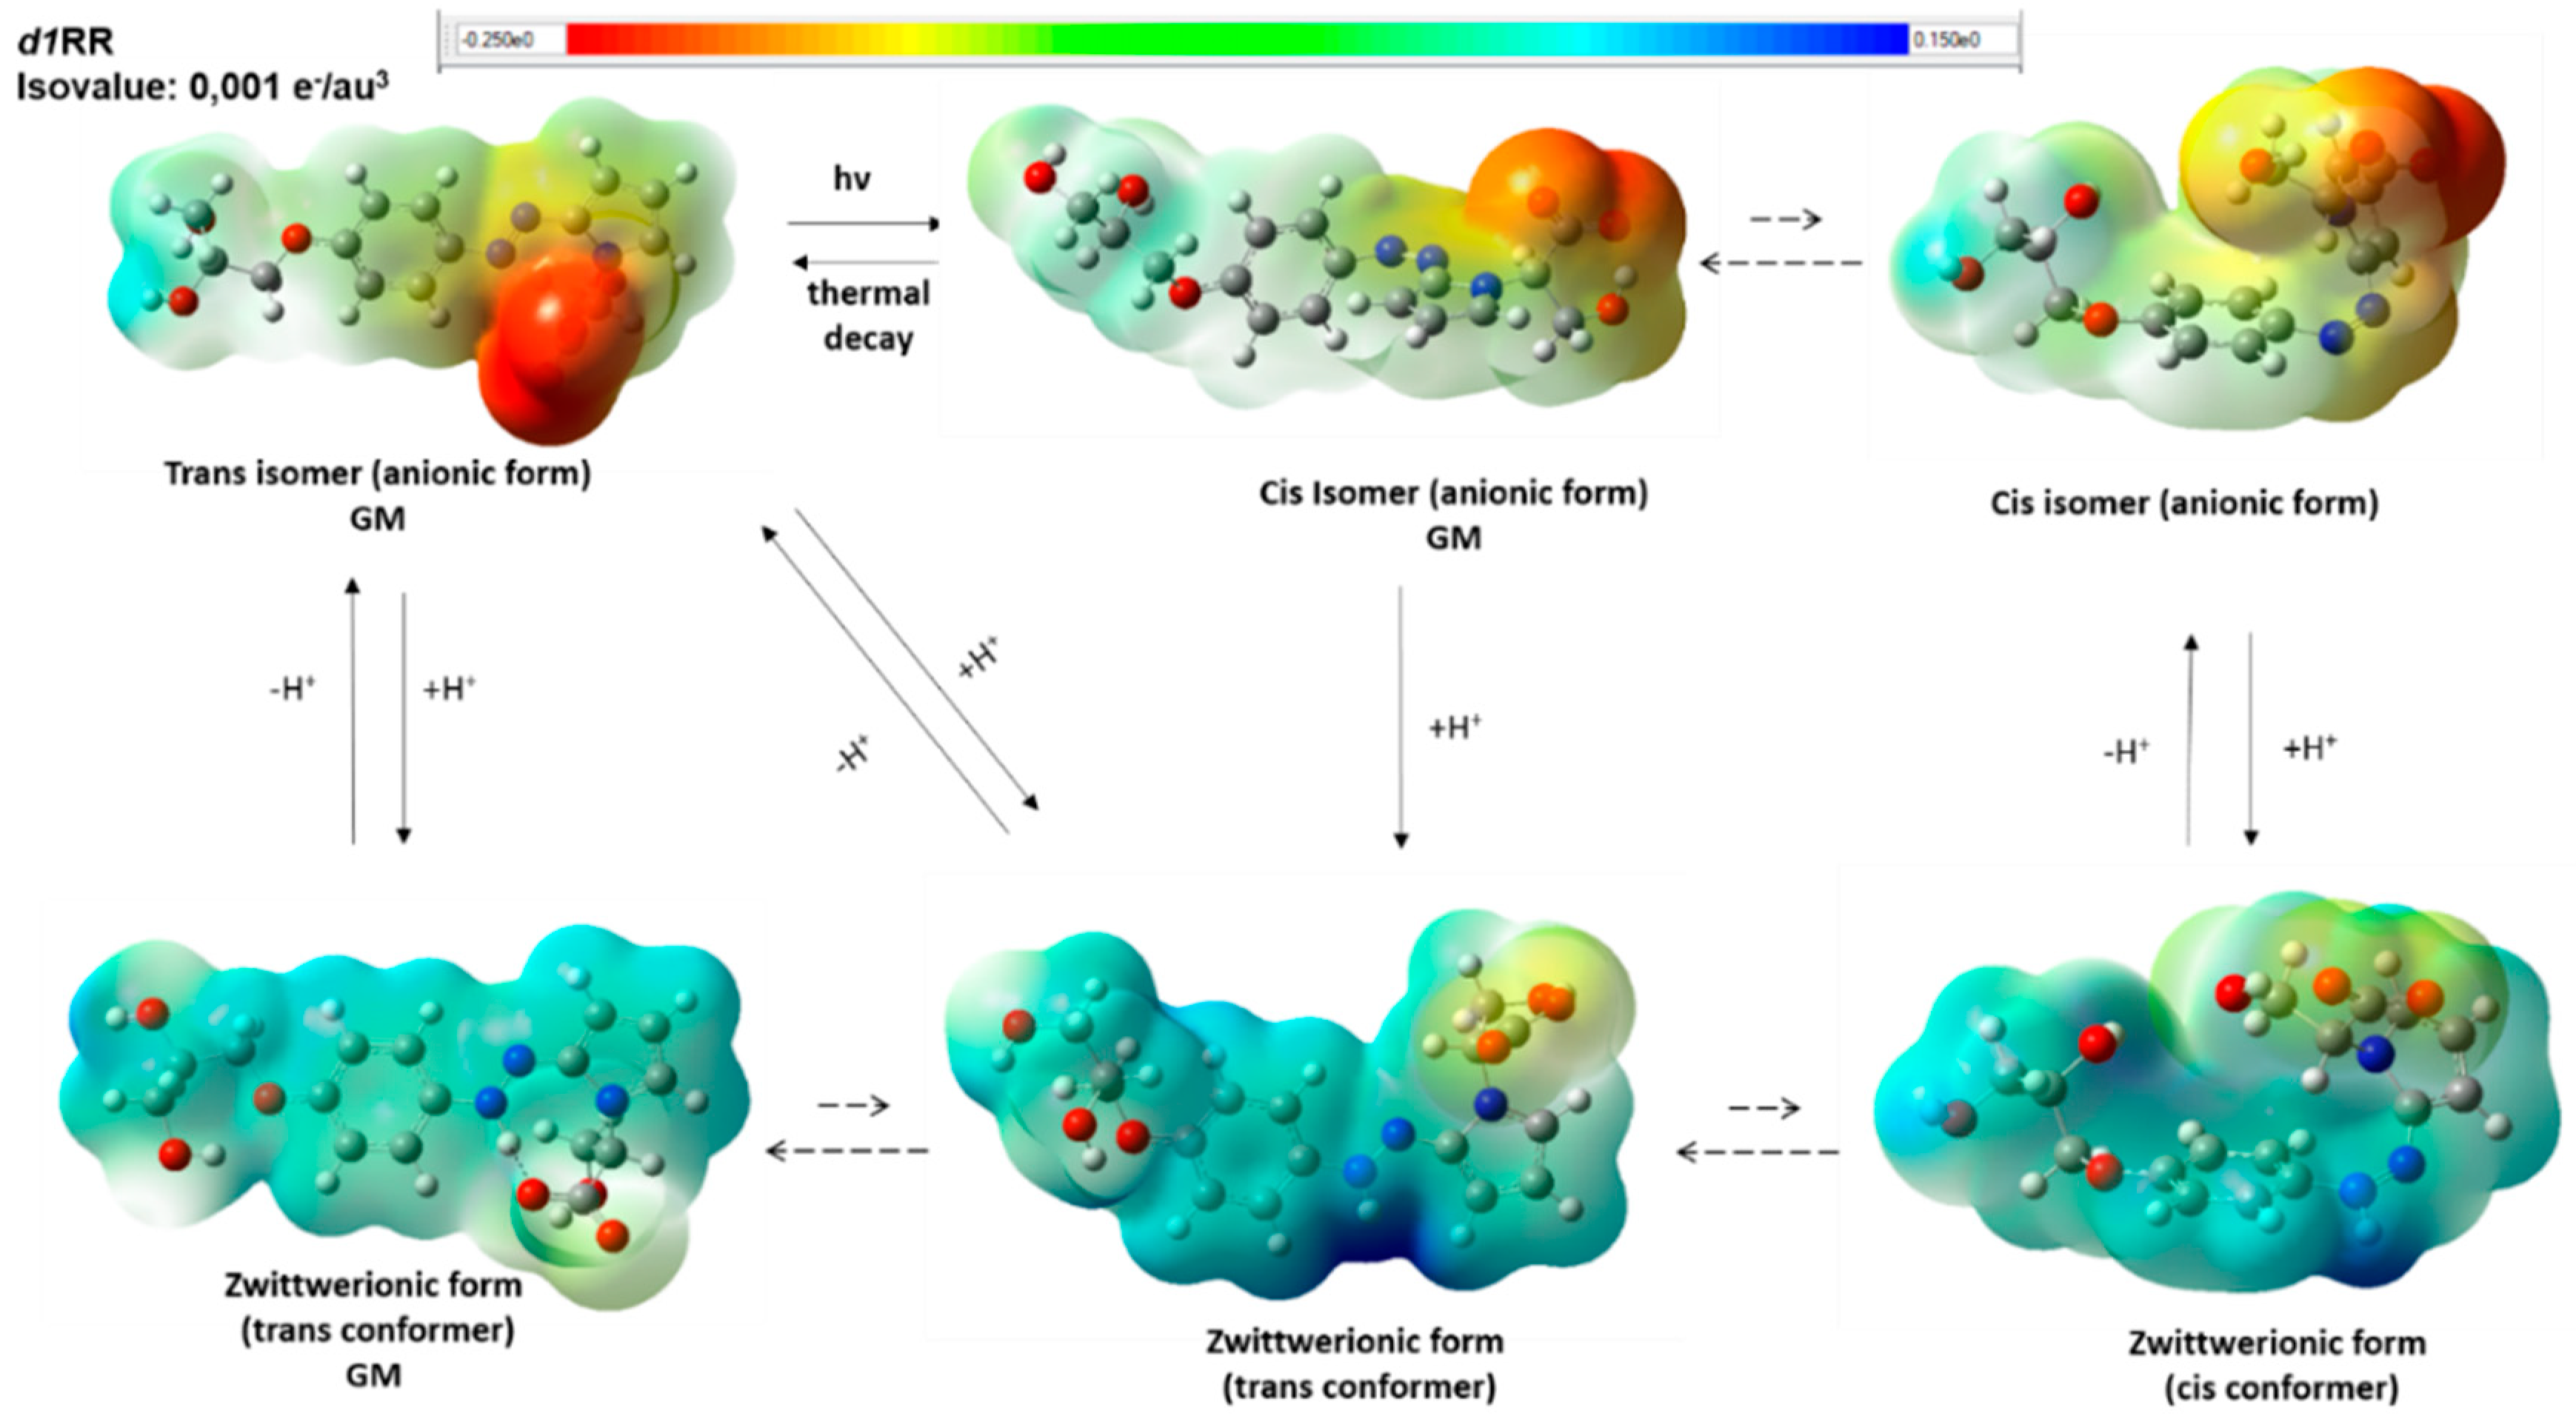
Computational Studies

Computational studies were performed in order to model the ionic species (ground states) of the trans and cis isomers of d1RR and d1RS present in solution in the pH range of 5.7–8.0.
At first, the apparent pKa values of d1RR and d1RS were calculated (ACD/Percepta, Advanced Chemistry Development, Inc., Toronto, ON, Canada, 2017, http://www.acdlabs.com). Results are reported in Scheme 1. By using the obtained pKa values, the different ratios of d1RR/d1RS ionic species present at the pH values considered in the UV experiments reported in Table 1, were calculated too (Table S2).
Then, the molecular models of the putative ionic species of d1RR and d1RS present in solution in the pH range 5.7–8.0 (i.e., the anionic forms of the trans and cis isomers and the zwitterionic form; Scheme 1; Table S2), were built and their conformational space was systematically sampled by means of molecular mechanics (MM) calculations (see the experimental section for details). The global minimum energy conformer (GM) for each species was identified, and all the other minima were ranked by their energy difference from the GM (ΔEGM). The conformers were grouped into conformational families according to the relative positioning of the phenyl- and pyrrole-substituted rings with respect to the diazo group (torsional angles τ1 and τ2), and further divided into sub-families according to the intramolecular interactions present within the structure (Tables S3–S8, Figure 5 and Figure 6, Figures S8 and S9). It resulted that the conformers of the trans isomers always presented the N=N bond and the two adjacent aromatic rings lying on the same plane (Figure 5, I–II; Figure S8, I–II; Tables S3 and S5). On the contrary, the conformers obtained for the cis isomers presented the phenyl- and the pyrrole-substituted rings never lying on the N=N bond plane, mostly, including the GM (sub-family IVj), presenting a gauche (twisted) conformation with respect to the N=N bond (Figure 5, III–V; Figure S8, III–V; Tables S4 and S6). In some minima (sub-family VL) the pyrrole ring is almost orthogonal with respect to the N=N bond plane. In any case, the conformers of both the trans and the cis isomers are all characterized by the presence of an intramolecular H-bond involving a nitrogen atom of the diazo group and a hydrogen atom of the substituent on the pyrrole ring.
The minima resulting from the conformational analysis on the zwitterionic form obtained after protonation (Scheme 1; Figure 6, Figure S9) assumed both the trans (families I and II) or cis (families III and IV) conformation of the NH-N bond, although with a ΔEGM value about 4 kcal/mol in favour of the former. Moreover, in this case, the conformational families were characterized by different intramolecular interactions and were accordingly divided into sub-families (Tables S7 and S8). The GM of the two diastereomers resulted in the same sub-family (IId), presenting an intramolecular H-bond between the unprotonated nitrogen atom of the diazo group and the hydrogen atom on the tertiary carbon of the pyrrole substituent. Surprisingly, the conformers characterized by the ionic interaction between the two charged groups of the molecule, resulted about 4 kcal/mol from the GM in both diastereomers, likely due to the value of τ2 (Tables S7 and S8, family Im) forcing the relative positioning of the pyrrole ring with respect to the N=N bond.
Thus, to properly take into account electronic delocalization in such a conjugated system, the low energy conformers (within 5 kcal/mol from the GM) of d1RR and d1RS obtained by MM calculations, were, then, subjected to DFT full geometry optimization (Gaussian 09 package). The conductor-like polarizable continuum model (C-PCM) was used to mimic the presence of an aqueous solvent (see the experimental part for details). The resulting DFT structures were analyzed and ΔGGM values calculated (Tables S9–S11), in addition, the length of the bonds mostly involved in electron delocalization were measured in the GM conformers (Table S12). Overall, the bond length analysis of the GM conformers indicated a higher conjugation of the diazo group with the pyrrole ring (with the bond length N-Cpyr closes to the double bond values) than with the phenyl-substituted ring.
The DFT GM conformers of the trans isomers (anionic form) resulted similar to those obtained by MM calculations (Tables S3 and S5 vs. Table S9), presenting the N=N bond and the two aromatic rings lying on the same plane, thus, allowing full electron delocalization through the π orbitals (Table S12), and an intramolecular H-bond between a nitrogen atom of the diazo group and the hydrogen atom of the secondary carbon of the substituent of the pyrrole ring. On the other contrary, the structures of the DFT conformers of the cis isomers resulted in significatively different from those obtained by MM calculations. As previously mentioned, overall, DFT results indicated a higher electronic conjugation with the pyrrole moiety than with the phenyl ring, contrarily to what observed for MM results (Tables S4 and S6 vs. Table S10). In particular, in the GM conformer, the substituted-pyrrole ring lays on the same plane of the N=N bond, while the substituted-benzyl ring is almost orthogonal to it, differently to what resulted from MM calculations (Tables S4 and S6 vs. Table S10). The resulting T-shaped conformation, characterized by the presence of a CH-π interaction between the pyrrole and the phenyl rings, is consistent with that obtained by previous studies [19] on azoheteroarenes where one of the aromatic moieties is an ortho mono-substituted five-membered heteroaromatic ring. Importantly, it has been observed [19] that compounds adopting a T-shaped ground state of the cis isomer proceed through a T-shaped isomerization pathway, increasing the stability of the cis isomer and its isomerization half-life.
The protonation of the anionic species was simulated by adding the proton to the anionic conformers and then performing DFT optimization of the resulting zwitterionic structure. The conformers obtained were again classified according to our families/sub-families, and the ΔG from the GM conformer was calculated (Table S11).
Interestingly, when we added the proton to the T-shaped GM conformer of the cis isomer, the DFT optimized structure turned in to the zwitterionic form of the trans isomer (Figure 7 and Figure S10; Table S11). Thus, protonation of the cis anionic form in its putative prevalent T-shaped conformation led to a low energy trans zwitterionic conformer, which could be, then, deprotonated to the trans isomer (Figure 7 and Figure S10). This is in line with the disappearance of the cis isomer signal (345 nm) in the UV spectra when the pH is decreased from 8 to 7 (Figure 2; Table S2) and for the overall increasing of the rate of the cistrans conversion by decreasing the pH in the fast UV experiments (Figure 4 and Figure S6).
On the other hand, the protonation of the DFT GM conformers of the trans anionic forms led to the GM conformer of the zwitterionic form, preserving the trans conformation of the parent isomer.
Taken together, our results suggest that, upon protonation (which depends on the considered pH conditions), either the trans and the cis isomers may convert into zwitterionic forms presenting a trans and planar conformation of the N-N bond with respect to the two aromatic substituents (Figure 7 and Figure S10). Importantly, contrarily to what resulted from MM calculations, the DFT GM conformer of the zwitterionic form is characterized by the presence of an ionic intramolecular interaction involving the two charged groups of the molecule (the protonated nitrogen atom and the carboxylate group; Figure 7 and Figure S10). It is reasonable to hypothesize that the activation energy necessary to break this intramolecular ionic interaction represents a factor strongly favoring the presence of the GM conformer of the (protonated) zwitterionic form.
In Figure 7 (d1RR) and Figure S10 (d1RS) a schematic representation of the putative equilibria involving the calculated DFT conformers of the ionic species possibly present in solutions in the 5.7–8.0 pH range, is reported.
Considering the GM structure of the zwitterionic form showed in Figure 7, it is likely that, upon carboxylate protonation, a significant amount of azonium ions would be “released” in solution. Accordingly, at pH values < 3.5, the UV data showed the appearance of an additional UV band centered at about 500 nm (Figure S7) corresponding to diazonium ions [25,26,27,28,29].

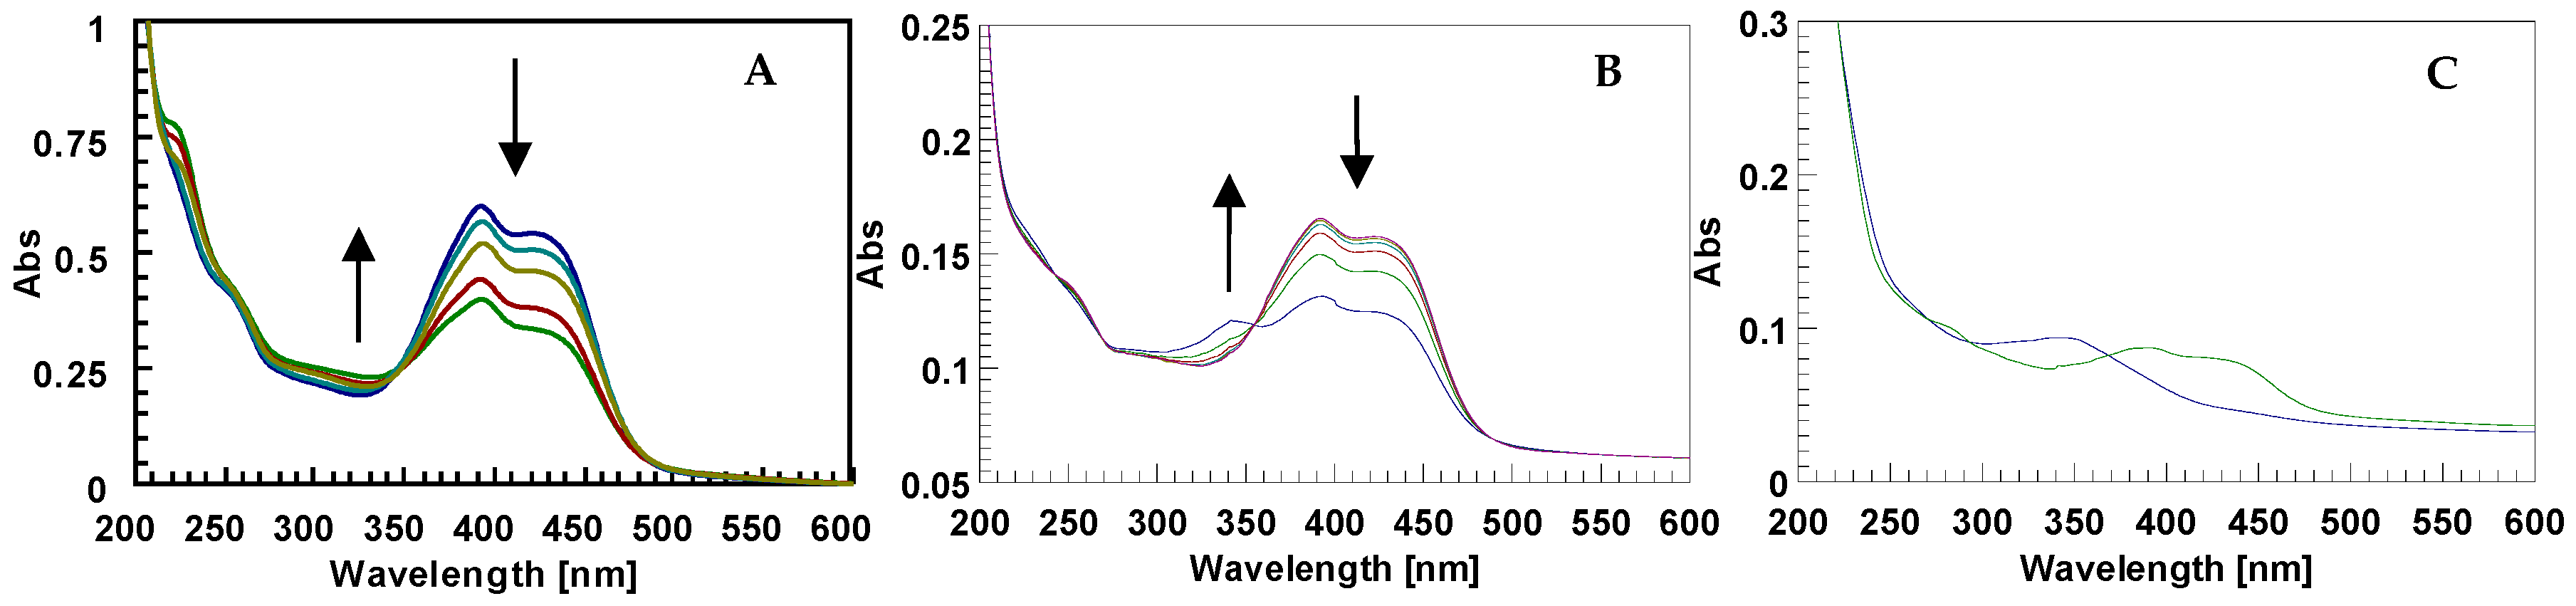
2.2. Photo-Induced Rearrangement of d1RR in a Pyridazinium Ion in Acidic Buffered Solutions: The Role of the Irradiation Exposure Time

We observed that increasing the irradiation exposure time (LED 435 nm) of d1RR in solution at pH = 5.7 led to an irreversible structural change of d1RR. Indeed, after 36–48 h of pulsed (50 ms ON/500 ms OFF) or 18 h of continuous LED irradiation a strong change in the d1RR UV profile appeared. In particular, the UV bands centred at 430 nm decreased in their intensity, whereas, new bands appeared in the UV 220–380 nm range (Figure 8A). Interestingly, the UV spectra acquired for d1RR at different irradiation exposure times lacked the isosbestic points typical of d1RR trans→cis conversion occurring in methanolic or alkaline conditions (Figure 8B). Furthermore, the UV spectrum of the irradiated d1RR was not restored also taking the sample two months in the dark, thus, suggesting that the observed UV spectral changes were not attributable to d1RR trans→cis conversion. In order to explore the photo-reactivity of d1RR in acidic medium, the final solution was chromatographed by solid phase extraction. The column eluted with 9:1 water/methanol firstly gave two different fractions: (i) Sample 1, that showed a UV spectrum with a main band centred at about 340 nm; and (ii) sample 2 that showed a UV spectrum similar to that of d1RR (Figure 8C). Both sample 1 and 2 were further analyzed by LC-HRMS.
Preliminary experiments on an LTQ Orbitrap XL™ Hybrid FT Mass Spectrometer system was carried out by the direct infusion of sample 1, sample 2 and d1RR, with d1RR used as a reference. HR full MS spectra of d1RR and sample 2 appeared similar, both dominated by the [M + H]+ ion at m/z 350.1344 (C16H20N3O6+ Figure 9A) suggesting that sample 2 contained the unreacted d1RR. On the other hand, a [M + H]+ ion at m/z 306.1453 (C15H20N3O4+, Figure 9B) emerged in the HR full MS spectrum of sample 1 indicating the presence of a new compound, differing from d1RR for a CO2 portion less, that we named compound 1. Structural features of d1RR (Figure 1) reasonably lead to hypothesize that compound 1 was originated through a photo-chemical decarboxylation reaction from d1RR [30].
Successively, an LC-HRMSn (n = 1, 2) method was implemented by using a reverse-phase column and acidic mobile phases. Under the used experimental conditions, a chromatographic peak at 15.5 min. in the Extracted Ion Chromatogram (XIC) for the ion at m/z 350.1344 emerged for both d1RR and sample 2 (Figure S11), so confirming the identity of the unmodified d1RR in sample 2. Further confirmation was also obtained by the fragmentation pattern contained in the LC-HRMS2 spectra of m/z 350.1 of both d1RR and sample 2 (Figures S11 and S12) that turned out to be superimposable the one to the other in containing two main diagnostic fragment ions at m/z 195.0770 and m/z 154.0503, deriving from the cleavage of the bond between diazo group and the pyrrole ring (Figure S13).
A different fragmentation pattern was observed in the LC-HRMS2 spectrum of compound 1 (precursor ion at m/z 306.1, retention time = 12.7 min) dominated by a main fragment ion at m/z 232.1084 (C12H14N3O2+, Table 2) reasonably due to the cleavage of the diol linker from the phenol oxygen (neutral loss of C3H6O2 part structure) (Figures S14 and S15). Basing on those results, pointing out a different fragmentation behavior between compound 1 and d1RR, the structural hypothesis for compound 1 being a simple decarboxylation derivative of d1RR, appeared not likely. Thus, the ex-novo synthesis of the derivative of d1RR lacking of the carboxylic group (compound 2) was accomplished (Figure 10).
HRMS and HRMS2 experiments acquired for compound 2 (Figure S16) highlighted a fragmentation pattern similar to that observed for d1RR (Figure S12), dominated by a main fragment ion at m/z 195.0773, suggesting that compound 1, although sharing the same elemental composition with compound 2, should be a constitutional isomer.
In order to clarify the structure of compound 1, we performed 1D and 2D NMR spectroscopy (Figures S17–S21).
Figure 11B shows the two patterns of aromatic proton signals in d1RR. The two doublets at 7.20 and 7.55 ppm are attributable to the resonances of protons on benzene ring, whereas, the three signals at 6.31, 6.65, 7.29 ppm to that on the pyrrole ring (for more detailed information see reference [20]). Only a little shift of the proton signal at 7.29 was observed in the 1H spectrum of compound 2 (Figure 11A and Figure S20). On the other hand, comparing 1H NMR data acquired on d1RR with that obtained on compound 1 (Figure 11C) three main differences were observed: (i) A down-field shift of the proton resonances on benzene ring (7.98 and 7.20 ppm); (ii) the loss of the signals of the protons on pyrrole ring; (iii) a new set of three proton signals at 9.26, 8.02, and 7.62 ppm. As in the case of d1RR, in the aromatic region of the 1H-1H COSY spectrum three scalar couplings (7.98 and 7.20; 9.26 and 8.02, and 8.02 and 7.62 ppm) were observed (Figure S18). These data suggested that in compound 1, a new, deshielding, chemical environmental surrounded most of the aromatic protons.
Hence, the UV profiles, the fragmentation pattern (Table 2) and the aromatic proton resonances of compound 1 strongly suggested that the prolonging in LED irradiation time of d1RR in acidic conditions promotes a rearrangement of the diazo-aromatic core of the molecule that also involves a decarboxylation reaction.
We hypothesized that the diazo group and the pyrrole ring could rearrange, under irradiation, in a pyridazinium salt (Figure 12). This type of structure well fit with: (i) The blue shift of the UV band observed for compound 1 [31] respect to d1RR; (ii) the fragmentation pattern contained in HRMS2 spectrum (Figure S11C) and; (iii) the Δδ between the aromatic proton signals in d1RR and compound 1 [32]. Despite more detailed studies should be performed to clarify better the exact reaction pathway, based on recently published data [32,33], we hypothesized that in acidic conditions a reaction similar to that described by Fehler et al. [32] could occur. Studies on the exact mechanism are currently in progress.

3. Materials and Methods

3.1. General

Commercial reagents, all organic solvents and water (HPLC grade), formic acid (95–97%, Laboratory grade), and ammonium formate (AR grade) were purchased from Sigma–Aldrich (Steinheim, Germany).
TLCs were run on Merck silica gel 60 F254 plates (Kenilworth, NJ, USA) and the spots were visualized by means of a UV lamp (Vilber Lourmat VL-4LC, 365 and 254 nm). Silica gel chromatography was performed using Merck silica gel 60 (0.063–0.200 mm). UV experiments were performed on a JASCO V-530 spectrophotometer, equipped with a PTC-348 temperature controller. 1H (500 MHz and 400 MHz) and 13C (125 MHz and 100 MHz). NMR spectra were recorded on an Agilent INOVA spectrometer (Agilent Technology, Cernusco sul Naviglio, Italy) [34,35,36]; chemical shifts were referenced to the residual solvent signal (CD3OD: δH = 3.31, δC = 49.0 ppm, CDCl3: δH = 7.26, δC = 77.0 ppm). For an accurate measurement of the coupling constants, the one-dimensional 1H NMR spectra were transformed at 64 K points (digital resolution: 0.09 Hz). 1H connectivities were determined by COSY (mixing time 100 ms).

3.2. Chemistry

Compounds d1RR and d1RS were obtained by hydrolysis of the corresponding methyl esters 1RR and 1RS [20] respectively (scheme S1). The synthesis of compound 2 was performed according to Scheme S1. The pyrrole derivative VI used in the diazo-coupling reaction was obtained from acetylation of the 2-pyrrol-1-yl-ethanol (V) [37]. The 1H and 13C NMR spectra of compound 2 was reported in Figures S20 and S21.
2-Pyrrol-1-yl-ethanol (V). A stirred solution of 2,5-dimethoxytetrahydrofuran (2.04 g, 15.4 mmol) in H2O (20 mL) was heated at reflux under N2. After 2h the reaction mixture was cooled to room temperature, and then a solution of ethanolamine (1.13 g, 18.5 mmol) in dichloromethane (30 mL) was added. The reaction mixture was stirred vigorously in the dark overnight, and then the organic phase was separated. The aqueous phase was re-extracted with dichloromethane (3 × 20 mL), and the combined organic layers were dried over sodium sulfate, filtered and concentrated under reduced pressure. The resulting residue was purified by flash chromatography (SiO2, eluted with dichloromethane) to give the title compound as a colourless oil. Yield: 62%.
1H NMR (400 MHz, CDCl3) δ: 3.86 (t, 2H, J = 5.2 Hz), 4.03 (t, 2H, J = 5.2 Hz), 6.18 (t, 2H, J = 2.2 Hz), 6.71 (t, 2H, J = 2.2 Hz). 13C NMR (CDCl3, 100 MHz) δ: 51.9, 62.9, 108.6, 120.8.
Acetic acid 2-pyrrol-1-yl-ethyl ester (VI). N,N-Diispropylethylamine (1.57 g, 12.1 mmol) and acetic anhydride (1.65 g, 16.2 mmol) was added to a solution of V (0.90 g, 8.10 mmol) in dichloromethane (10 mL), and the resulting reaction mixture was stirred at room temperature. After 15h the reaction mixture was washed with brine (2 × 20 mL), and the organic phase was dried over sodium sulfate, filtered and concentrated in vacuo. Then, the resulting residue was purified by flash chromatography (SiO2, dichloromethane/n-hexanes 4:1 as eluent) to give VI as a colourless oil. Yield 73%.
1H NMR (400 MHz, CDCl3) δ: 2.06 (s, 3H), 4.13 (t, 2H, J = 5.6 Hz), 4.32 (t, 2H, J = 5.6 Hz), 6.17 (t, 2H, J = 2.2 Hz), 6.68 (t, 2H, J = 2.2 Hz). 13C NMR (CDCl3, 100 MHz) δ: 20.8, 48.2, 64.0, 108.5, 120.8, 170.6.
Compound1. A phosphate buffered solution of d1RR at pH = 5.7 (8.0 × 10⁻³ mg/L) was irradiated for 18 h with pulse-program (50 ms-ON/1.0 min-OFF by means of an Arduino module to manage the LED plate at 435 nm). Then the solution was chromatographed on RP-18 cartridge (Oasis HLB) by means of Manifold vacuum system (Phenomenex). The cartridge was washed with water, loaded with the reaction mixture and eluted with a gradient of methanol in water. The collected fractions were analyzed by UV spectroscopy, and those containing compound 1 subjected to MS, MS2 spectrometry and NMR spectroscopy (Figures S14–S15, and Figures S17–S19). The same experiment was also performed using two phosphate buffered solutions of d1RR at pH = 7.0 and 8.0. In these cases, no significant changes in the UV spectrum of d1RR were obtained.

3.3. UV Spectroscopy

UV experiments were performed in phosphate buffer (0.1 M) at pH = 8.0, 7.5, 7.0, 6.7, 6.5, 6.0 and 5.7. All samples of d1RR or d1RS were used at a final concentration of 80 μM. o.l. cuvette 0.5 cm. In order to acquire the UV spectra before the LED irradiation, the samples were kept in the dark for 24 h. UV spectra of the cis isomers were acquired after irradiation of the samples at 435 nm (1 min, 1 LED 435 nm Roithner Lasertechnik). The cis thermal decay was monitored by the further sequential acquisition of spectra (every 1.0 min) until the UV profile became that of the initial trans isomer.

3.4. Fast UV Spectroscopy

Figure S2 reports a sketch of the experimental setup for the fast UV spectroscopy. The light source was a Deuterium arc lamp, delivering a board emission band down to about 200 nm. This acted as the probe to monitor the transient absorption spectra of the sample.
Several optical filters were used to adjust the spectrum and the average power of the probe, preventing any perturbation of the sample by the probe light. A couple of UV-grade convex lenses were used to collimate diverging output light of the lamp, and finally, it was coupled to an optical fiber that carried the light to the detector. The cuvette was kept between the two lenses, and collimated probe light passed through the sample. The detector was a spectrograph combined with an intensified CCD (ICCD), which was recording the transmitted light at a repetition rate of 10 or 25 Hz; the latter being used for the faster processes in acidic solutions.
A portion of the same samples analyzed by UV spectroscopy was used in the experiments. 1.8 mL of the sample was held in a quartz cuvette, and stirred by a magnetic stirrer. The absorption spectrum of the sample in 10 mm optical path was monitored in the 220–430 nm spectral range; resulting 2D plots of changes in absorption spectrum versus time.
Kinetic measurements were performed by means of fast UV spectroscopy for photo-conversion of the trans to the cis isomers, together with those for the reverse reactions in the dark.

3.5. Liquid Chromatography—High Resolution Mass Spectrometry

LC-HRMS experiments were carried out on Dionex Ultimate 3000 system which included a solvent reservoir, in-line degasser, quaternary pump and refrigerated autosampler and column oven, coupled to a hybrid linear ion trap LTQ Orbitrap XLTM Fourier Transform MS (FTMS) equipped with an ESI ION MAXTM source (Thermo-Fisher, San Josè, CA, USA). Chromatographic separation was accomplished by using a Poroshell 120 EC-C18, 2.7 μm, 2.1 × 100 mm column (Agilent, Santa Clara, CA, USA) maintained at room temperature and eluted at 0.2 mL/min with water (eluent A) and 95% acetonitrile/water (eluent B), both containing 2 mM ammonium formate and 50 mM formic acid. A gradient elution was used—3% B hold for the first 5 min, 3–30% B over 5 min, 30–70% B over 5 min, 70–100% B in further 5 min and hold for 4 min. Injection volume was 5 μL in all cases.
HR full MS experiments (positive ions) were carried out in the mass ranges m/z 100–1000 at a resolving power of 30,000 (m/z 400). Source settings were optimized by using d1RR as reference standard and used in all the experiments: A spray voltage of 4.8 kV, a capillary temperature of 275 °C, a capillary voltage of 13 V, a sheath gas and an auxiliary gas flow of 51 and 1 (arbitrary units), respectively, and a tube lens voltage of 80 V.
HRMS2 data were acquired by selecting the [M + H]+ ion at m/z 350.1 and m/z 306.1 and fragmenting them through collision-induced dissociation (CID) with collision energy (CE) of 30% and 42%, respectively. Activation Q was set at 0.250, and an activation time of 30 msec was used.
Elemental formulae of ions contained in HRMS and HRMS2 spectra were assigned by using the mono-isotopic ion peak of each ion cluster and the Xcalibur 2.2 software setting a mass tolerance of 5 ppm.

3.6. Molecular Modeling

Molecular modeling calculations were performed on E4 Server Twin 2 × Dual Xeon-5520, equipped with two nodes. Each node: 2 × Intel® Xeon® QuadCore E5520-2.26Ghz, 36 GB RAM. The molecular modeling graphics were carried out on a personal computer equipped with Intel(R) Core(TM) i7-4790 processor and SGI Octane 2 workstations.
The apparent pKa values of d1RR and d1RS were calculated by using the ACD/Percepta software (ACD/Percepta, Advanced Chemistry Development, Inc., Toronto, ON, Canada, 2017, http://www.acdlabs.com). The percentage of neutral/ionized forms present at the pH values used in the experimental studies (i.e., range 5.7–8.0) were computed using the Handerson-Hasselbach equation. The resulting species were built and subjected to molecular mechanic (MM) energy minimization (ε = 80 × r) until the maximum RMS derivative was less than 0.001 kcal/Å, using Conjugate Gradient as minimization algorithm (Discovery Studio 2017; Dassault Systèmes BIOVIA, San Diego, 2017) [38]. Atomic potentials and charges were assigned using the CFF forcefield [39]. The conformers obtained for each compound were used as the starting structure for the subsequent systematic conformational analysis (Search Small Molecule Conformations; Discovery Studio 2017).
All the generated structures were then subjected to a systematic conformational search procedure. The conformational space was sampled by systematically varying the single bonds with an increment of 60°, as well as the double bonds with an increment of 180°. The RMSD cutoff for structure selection was set to 0.01 Å. Finally, to ensure a wide variance of the input structures to be successively fully minimized, an energy threshold value of 106 kcal/mol was used as selection criteria. The generated structures were then subjected to MM energy minimization both in a vacuum and aqueous environment (ε = 1 and ε = 80 × r, respectively) until the maximum RMS derivative was less than 0.001 kcal/Å, using Conjugate Gradient as minimization algorithm. Finally, the resulting conformers were ranked by their potential energy values (i.e., ΔE from the global energy minimum (GM)). All MM conformers (ε = 80 × r) within 5 kcal/mol from the global minimum (ΔEGM ≤ 5 kcal/mol) were analyzed and grouped into families, named I–V, according to the values of the dihedral angles τ1 and τ2. The resulting families were then divided into subfamilies (named a-n) on the basis of the observed intramolecular interactions.
The global minimum conformers (ε = 1 and ε = 80 × r) of each species, as well as the lowest energy conformers of the families presenting the highest number of conformers (ε = 80 × r) have been subjected to DFT full geometry optimization. The calculations were carried out using the Gaussian 09 package [40]. All structures were fully optimized at the B3LYP/6-31+G(d,p) level [41,42] using the conductor-like polarizable continuum (C-PCM) model, which allows the calculation of the energy in the presence of a solvent [43]. In this case, all structures were optimized as a solute in an aqueous solution. In order to characterize every structure as minimum and to calculate the Gibbs free energy, a vibrational analysis was carried out at the same level of theory using the keyword freq. The RMS force criterion was set to 3 × 10⁻⁴ a.u. Partial charges have been calculated using the natural bond orbital (NBO) method [44].

4. Conclusions

Through the use of UV and UV fast spectroscopy the kinetic behavior of the transcis isomerizations of two azoheteroarenes, named d1RR/d1RS has been studied, using phosphate (0.1M) solutions buffered at different pH (from 8.0 to 5.7). The results evidenced at least two important features.
First of all, the increasing of the proton concentration provoked a general increase in the rates of both the photo-conversions of trans d1RR/d1RS into the corresponding cis forms and of the thermal decay of cis d1RR/d1RS. According to literature data, the protonation of the diazo group of d1RR/d1RS should occur in the solution [25,26,27,28,29].
The computational analysis of the conformational preference of the calculated species present in solution in the pH range 5.7–8.0 highlighted that while the trans isomer preferentially adopts a fully planar and conjugated conformation, the cis isomer is characterized by a T-shaped conformation. Importantly, it has been reported that azoheteroarene photoswitches able to adopt a T-shaped ground state conformation of the cis isomer are characterized by longer half-lives [19]. Noteworthy, upon protonation both the trans and the cis isomers resulted in the formation of a zwitterionic form characterized by a trans and planar conformation and stabilized by ionic intramolecular interaction between the two charged groups. Thus, our results indicate that protonation of d1RR/d1RS can strongly affect their ground state conformation increasing the rate of transcis isomerizations. Second, the results of fast UV experiments also showed that for both of the two stereomers, d1RR/d1RS, the pKa values of the cis and trans isomers should be slightly different. Indeed, the kinetic measurements performed at 400 (a band of the trans isomers) and 340 nm (a band of the cis stereomers) gave rise to two different trends of the apparent rate constants versus pH.
The investigation on d1RR/d1RS photo-responsive properties also showed that d1RR, but not d1RS underwent to a photo-transformation under prolonged irradiation. The characterization of the final molecule produced in this condition led to the identification of a new pyridazinium salt. Interestingly, the pyridazinium salt is formed only from highly diluted solution buffered at pH = 5.7, thus, suggesting that the mechanism of the reaction should be monomolecular and that the reaction should be promoted by the presence of d1RR diazonium ions in solution. Despite further studies are necessary to establish the exact way of this reaction, the different behavior of d1RR and d1RS under prolonged reaction herein reported could be the reason of the previously reported different dose-response antiproliferative action of 1RR, 1RS and their mixture [20].

Supplementary Materials

Supplementary materials can be found at https://www.mdpi.com/1422-0067/21/4/1246/s1. Figure S1. UV spectra of d1RS in the dark at different pH, Figure S2. A schematic representation of the instrument employed for fast UV spectroscopy, Figure S3. Cis to trans thermal conversion for d1RR, Figure S4. Cis to trans and trans to cis conversion for d1RR at pH 5.7 and 7.0, Figure S5. Cis to trans and trans to cis conversion for d1RS at pH 5.7 and 7.0, Figure S6. Changes in apparent rate constant (kobs) in the pH range 5.7–8.0, Figure S7. UV-vis spectra of d1RR and d1RS in the pH range 7.0–1.5, Figure S8. Conformational families of trans (I-II) and cis (III-V) isomers of d1RS, Figure S9. Conformational families of the zwitterionic form of d1RS, Figure S10. Putative d1RS ionic species present in solution, Figure S11. LC-HRMS of sample 2: (A) Extracted ion Chromatogram at m/z 350.1344, (B) associated HRMS spectrum and (C) associated HRMS2 spectra, Figure S12. HRMS2 spectrum of d1RR obtained by using the ion at m/z 350.1 as precursor, Figure S13. The cleavage occurring for d1RR in HRMS2 experiments giving rise to two main fragment ions, Figure S14. LC-HRMS of compound 1: (A) Extracted ion Chromatogram at m/z 306.1453 (B) associated HRMS and (C) HRMS2 spectra, Figure S15. Enlargement range of the LC-HRMS2 spectrum of the precursor ion of compound 1, Figure S16. HRMS and HRMS2 spectra of compound 2, Figure S17. 1H NMR spectrum of compound 1 in CD3OD, Figure S18. Low-field enlargement of 1H-1H COSY NMR spectrum of compound 1 in CD3OD, Figure S19. High-field enlargement of 1H-1H COSY NMR spectrum of compound 1 in CD3OD, Figure S20. 1H NMR spectrum of compound 2 in CD3OD. Figure S21, 13C NMR spectrum of compound 2 in CD3OD, Table S1. Data coming from the interpolation of the apparent rate constants versus [H+], Table S2. Calculated percentages of ionic species of d1RR and d1RS in the pH range 1.0-8.0, Table S3. ΔEGM values and torsion angle values of the MM conformers of trans isomer of d1RR, Table S4. ΔEGM values and torsion angle values of the MM conformers of cis isomer d1RR, Table S5. ΔEGM values and torsion angle values of the MM conformers of trans isomer of d1RS, Table S6. ΔEGM values and torsion angle values of the MM conformers of cis isomer d1RS, Table S7. ΔEGM values and torsion angle values of the MM conformers of d1RR in the zwitterionic form, Table S8. ΔEGM values and torsion angle values of the MM conformers of d1RS in the zwitterionic form, Table S9. ΔGGM values and torsion angle values of the DFT trans isomers of d1RS and d1RR in the anionic form, Table S10. ΔGGM values and torsion angle values of the DFT cis isomer of d1RS and d1RR in the anionic form, Table S11. ΔGGM values and torsion angle values of the DFT conformers of d1RS and d1RR in the zwitterionic form, Table S12. Bond length values (Å) of the DFT conformers of d1RR and d1RS, Scheme S1. Synthesis of compound 2.

Author Contributions

Conceptualization, C.F., C.A. and M.V. (Michela Varra); Data curation, C.I., M.V. (Mohammadhassan Valadan), L.T., M.P., M.S., F.B., M.C., M.L.d.G., A.R., E.M. and M.V. (Michela Varra); Formal analysis, C.D., M.M., C.F., C.A. and M.V. (Michela Varra); Funding acquisition, M.M., C.D., C.A., M.V. (Michela Varra) and A.R.; Investigation, C.I., M.V. (Mohammadhassan Valadan), L.T., M.P., A.R., M.C., M.S., F.B., M.L.d.G. and E.M.; Methodology, C.F., M.M., C.D., C.A. and M.V. (Michela Varra); Supervision, C.F., C.D., A.R., M.M., C.A. and M.V. (Michela Varra); Writing—original draft, C.I., M.V. (Mohammadhassan Valadan), C.F., C.A. and M.V. (Michela Varra); Writing—review and editing, all authors contributed to the review & editing of the final manuscript version. All authors have read and agreed to the published version of the manuscript.

Funding

This work was supported by a grant from Regione Campania-POR Campania FESR 2014/2020 “Combattere la resistenza tumorale: piattaforma integrata multidisciplinare per un approccio tecnologico innovativo alle oncoterapie-Campania Oncoterapie” (Project N. B61G18000470007), and by the Italian Minister for Research under the Project PRIN—Predicting and controlling the fate of bio-molecules driven by extreme-ultraviolet radiation (Prot. N. 20173B72NB).

Acknowledgments

The authors are greateful to “Istituto Tecnico Industriale Statale Francesco Giordani of Caserta” (I.T.I.S. Giordani) for their technical assistance on the LED system construction.

Conflicts of Interest

The authors declare no conflict of interest.

References

  1. Pianowski, Z.L. Recent Implementations of Molecular Photoswitches into Smart Materials and Biological Systems. Chem. Eur. J. 2019, 25, 5128–5144. [Google Scholar] [CrossRef] [PubMed]
  2. Kathan, M.; Hecht, S. Photoswitchable molecules as key ingredients to drive systems away from the global thermodynamic minimum. Chem. Soc. Rev. 2017, 46, 5536–5550. [Google Scholar] [CrossRef] [PubMed]
  3. Qin, C.-G.; Lu, C.-X.; Ouyang, G.-W.; Qin, K.; Zhang, F.; Shi, H.-T.; Wang, X.-H. Progress of Azobenzene-based Photoswitchable Molecular Probes and Sensory Chips for Chemical and Biological Analysis. Chin. J. Anal. Chem. 2015, 43, 433–443. [Google Scholar] [CrossRef]
  4. Harrisa, J.D.; Morana, M.J.; Aprahamiana, I. New molecular switch architectures. Proc. Natl. Acad. Sci. USA 2018, 115, 9414–9422. [Google Scholar] [CrossRef] [PubMed] [Green Version]
  5. Whalley, A.C.; Steigerwald, M.L.; Guo, X.; Nuckolls, C. Reversible Switching in Molecular Electronic Devices. J. Am. Chem. Soc. 2007, 129, 12590–12591. [Google Scholar] [CrossRef]
  6. Hüll, K.; Morstein, J.; Trauner, D. In Vivo Photopharmacology. Chem. Rev. 2018, 118, 10710–10747. [Google Scholar] [CrossRef]
  7. Jia, S.; Fong, W.-K.; Graham, B.; Boyd, B.J. Photoswitchable Molecules in Long-Wavelength Light-Responsive Drug Delivery: From Molecular Design to Applications. Chem. Mater. 2018, 30, 2873–2887. [Google Scholar] [CrossRef]
  8. Tochitsky, I.; Kienzler, M.A.; Isacoff, E.; Kramer, R.H. Restoring Vision to the Blind with Chemical Photoswitches. Chem. Rev. 2018, 118, 10748–10773. [Google Scholar] [CrossRef]
  9. Micciarelli, M.; Altucci, C.; Della Ventura, B.; Velotta, R.; Tosa, V.; Gònzalez Pérez, A.B.; Pérez Rodrìguez, M.; de Lera, Á.R.; Bende, A. Low-lying excited-states of 5-benzyluracil. Phys. Chem. Chem. Phys. 2013, 15, 7161–7173. [Google Scholar] [CrossRef] [Green Version]
  10. Micciarelli, M.; Valadan, M.; Della Ventura, B.; Di Fabio, F.; De Napoli, L.; Bonella, S.; Röthlisberger, U.; Tavernelli, I.; Altucci, C.; Velotta, R. Photophysics and Photochemistry of a DNA-Protein Cross-Linking Model: A Synergistic Approach Combining Experiments and Theory. J. Phys. Chem. B. 2014, 118, 4983–4992. [Google Scholar] [CrossRef]
  11. Micciarelli, M.; Curchod, B.F.E.; Bonella, S.; Altucci, C.; Valadan, M.; Röthlisberger, U.; Tavernelli, I. Characterization of the Photochemical Properties of 5-Benzyluracil via Time-Dependent Density Functional Theory. J. Phys. Chem. A. 2017, 121, 3909–3917. [Google Scholar] [CrossRef]
  12. Valadan, M.; Pomarico, E.; Della Ventura, B.; Gesuele, F.; Velotta, R.; Amoresano, A.; Pinto, G.; Chergui, M.; Improta, R.; Altucci, C. A multi-scale time-resolved study of photoactivated dynamics in 5-benzyl uracil, a model for DNA/protein interactions. Phys. Chem. Chem. Phys. 2019, 21, 26301–26310. [Google Scholar] [CrossRef]
  13. Dhammika Bandarab, H.M.; Burdette, S.C. Photoisomerization in different classes of azobenzene. Chem. Soc. Rev. 2012, 41, 1809–1825. [Google Scholar]
  14. Zhu, M.; Zhou, H. Azobenzene-based small molecular photoswitches for protein modulation. Org. Biomol. Chem. 2018, 16, 8434–8445. [Google Scholar] [CrossRef]
  15. Merino, E.; Ribagorda, M. Control over molecular motion using the cis–trans photoisomerization of the azo group. Beilstein J. Org. Chem. 2012, 8, 1071–1090. [Google Scholar] [CrossRef] [Green Version]
  16. Ankenbruck, N.; Courtney, T.; Naro, Y.; Deiters, A. Optochemical control of biological processes in cells and animals. Angew. Chem. Int. Ed. 2018, 57, 2768–2798. [Google Scholar] [CrossRef]
  17. Garcia-Amorós, J.; Castro, M.C.R.; Coelho, P.; Raposo, M.M.M.; Velasco, D. New heterocyclic systems to afford microsecond green-light isomerisable azo dyes and their use as fast molecular photochromic switches. Chem. Comm. 2013, 49, 11427–11429. [Google Scholar] [CrossRef] [Green Version]
  18. Yin, T.T.; Zhao, Z.X.; Zhang, H.X. A theoretical study on the thermal cis–trans isomerization of azoheteroarene photoswitches. New J. Chem. 2017, 41, 1659–1669. [Google Scholar] [CrossRef]
  19. Calbo, J.; Weston, C.E.; White, A.J.P.; Rzepa, H.S.; Contreras-García, J.; Fuchter, M.J. Tuning Azoheteroarene Photoswitch Performance through Heteroaryl Design. J. Am. Chem. Soc. 2017, 139, 1261–1274. [Google Scholar] [CrossRef] [Green Version]
  20. Imperatore, C.; Scuotto, M.; Valadan, M.; Rivieccio, E.; Saide, A.; Russo, A.; Altucci, C.; Menna, M.; Ramunno, A.; Mayol, L.; et al. Photo-control of cancer cell growth by benzodiazo N-substituted pyrrole derivatives. J. Photochem. Photobiol. A Chem. 2019, 377, 109–118. [Google Scholar] [CrossRef]
  21. Alfarouk, K.O.; Muddathir, K.A.; Shayoub, M.E. Tumor Acidity as Evolutionary Spite. Cancers 2011, 3, 408–414. [Google Scholar] [CrossRef] [PubMed] [Green Version]
  22. Swietach, P.; Vaughan-Jones, R.D.; Harris, A.L.; Hulikova, A. The chemistry, physiology and pathology of pH in cancer. Phil. Trans. R. Soc. B. 2014, 369. [Google Scholar] [CrossRef] [PubMed] [Green Version]
  23. White, K.A.; Grillo-Hill, B.K.; Barber, D.L. Cancer cell behaviors mediated by dysregulated pH dynamics at a glance. J. Cell Sci. 2017, 130, 663–669. [Google Scholar] [CrossRef] [PubMed] [Green Version]
  24. Anderson, M.; Moshnikova, A.; Engelman, D.M.; Reshetnyak, Y.K.; Andreev, O.A. Probe for the measurement of cell surface pH in vivo and ex vivo. Proc. Natl. Acad. Sci. USA 2016, 113, 8177–8181. [Google Scholar] [CrossRef] [PubMed] [Green Version]
  25. Emond, M.; Le Saux, T.; Maurin, S.; Baudin, J.-B.; Plasson, R.; Jullien, L. 2-Hydroxyazobenzenes to Tailor pH Pulses and Oscillations with Light. Chem. Eur. J. 2010, 16, 8822–8831. [Google Scholar] [CrossRef] [PubMed]
  26. Samanta, S.; Babalhavaeji, A.; Dong, M.-X.; Woolley, G.A. Photoswitching of ortho-Substituted Azonium Ions by Red Light in Whole Blood. Angew. Chem. Int. Ed. 2013, 52, 14127–14130. [Google Scholar] [CrossRef] [Green Version]
  27. Dunn, N.J.; Humphries, W.H., 4th; Offenbacher, A.R.; King, T.L.; Gray, J.A. pH-Dependent cis f trans Isomerization Rates for Azobenzene Dyes in Aqueous Solution. J. Phys. Chem. A 2009, 113, 13144–13151. [Google Scholar] [CrossRef]
  28. Dong, M.; Babalhavaeji, A.; Hansen, M.J.; Kalmanb, L.; Woolley, G.A. Red, far-red, and near infrared photoswitches based on azonium ions. Chem. Commun. 2015, 51, 12981–12984. [Google Scholar] [CrossRef] [Green Version]
  29. Emond, M.; Sun, J.; Gregoire, J.; Maurin, S.; Tribet, C.; Jullien, L. Photoinduced pH drops in water. Phys. Chem. Chem. Phys. 2011, 13, 6493–6499. [Google Scholar] [CrossRef]
  30. Budac, D.; Want, P. Photodecarboxylation: Mechanism and synthetic utility. J. Photochem. Photobiol. A Chem. 1992, 67, 135–166. [Google Scholar] [CrossRef]
  31. Blaise, E.; Kummerle, A.E.; Hammoud, H.; de Araujo-Junior, J.X.; Bihel, F.; Bourguignon, J.-J.; Schmitt, M. Access to 4-Alkylaminopyridazine Derivatives via Nitrogen-Assisted Regioselective Pd-Catalyzed Reactions. J. Org. Chem. 2014, 79, 10311–10322. [Google Scholar] [CrossRef] [PubMed]
  32. Fehler, S.K.; Pratsch, G.; Heinrich, M.R. The Trapping of Phenyldiazenes in Cycloaddition Reactions. Angew. Chem. Int. Ed. 2014, 53, 11361–11365. [Google Scholar] [CrossRef] [PubMed]
  33. Jurberg, I.D.; Davies, H.M.L. Blue light-promoted photolysis of aryldiazoacetates. Chem. Sci. 2018, 9, 5112–5118. [Google Scholar] [CrossRef] [PubMed] [Green Version]
  34. Menna, M.; Aiello, A.; D’Aniello, F.; Fattorusso, E.; Imperatore, C.; Luciano, P.; Vitalone, R. Further investigation of the mediterranean sponge Axinella polypoides: Isolation of a new cyclonucleoside and a new betaine. Mar. Drugs 2012, 10, 2509–2518. [Google Scholar] [CrossRef] [Green Version]
  35. Imperatore, C.; D’Aniello, F.; Aiello, A.; Fiorucci, S.; D’Amore, C.; Sepe, V.; Menna, M. Phallusiasterols A and B: Two new sulfated sterols from the mediterranean tunicate Phallusia fumigata and their effects as modulators of the PXR receptor. Mar. Drugs 2014, 12, 2066–2078. [Google Scholar] [CrossRef] [Green Version]
  36. Casertano, M.; Imperatore, C.; Luciano, P.; Aiello, A.; Menna, M.; Putra, M.Y.; Gimmelli, R.; Ruberti, G. Chemical Investigation of the Indonesian Tunicate Polycarpa aurata and Evaluation of the Effects Against Schistosoma mansoni of the Novel Alkaloids Polyaurines A and B. Mar. Drugs 2019, 17, 278. [Google Scholar] [CrossRef] [Green Version]
  37. Gourlay, B.S.; Molesworth, P.P.; Ryan, J.H.; Smith, J.A. A new and high yielding synthesis of unstable pyrroles via a modified Clauson-Kaas reaction. Tetrahedron Lett. 2006, 47, 799–801. [Google Scholar] [CrossRef] [Green Version]
  38. Fletcher, R. Unconstrained optimization. In Practical Methods of Optimization, 1st ed.; John Wiley & Sons Ltd.: New York, NY, USA, 1980; Volume 1, pp. 1–128. ISBN 978-0471277118. [Google Scholar]
  39. Ewig, C.S.; Berry, R.; Dinur, U.; Hill, J.R.; Hwang, M.J.; Li, H.; Liang, C.; Maple, J.; Peng, Z.; Stockfisch, T.P.; et al. Derivation of class II force fields. VIII. Derivation of a general quantum mechanical force field for organic compounds. J. Comput. Chem. 2001, 22, 1782–1800. [Google Scholar] [CrossRef]
  40. Frisch, M.J.; Trucks, G.W.; Schlegel, H.B.; Scuseria, G.E.; Robb, M.A.; Cheeseman, J.R.; Scalmani, G.; Barone, V.; Mennucci, B.; Petersson, G.A.; et al. Gaussian 09; Revision A.1; Gaussian Inc.: Wallingford, CT, USA, 2009. [Google Scholar]
  41. Becke, D. Density-functional thermochemistry. III. The role of exact exchange. J. Chem. Phys. 1993, 98, 5648–5652. [Google Scholar] [CrossRef] [Green Version]
  42. Lee, C.; Yang, W.; Parr, R.G. Development of the Colle-Salvetti correlation-energy formula into a functional of the electron density. Phys. Rev. B Condens. Matter Mater. Phys. 1988, 37, 785–789. [Google Scholar] [CrossRef] [Green Version]
  43. Cossi, M.; Rega, N.; Scalmani, G.; Barone, V. Energies, structures, and electronic properties of molecules in solution with the C-PCM solvation model. J. Comp. Chem. 2003, 24, 669–681. [Google Scholar] [CrossRef] [PubMed]
  44. Reed, E.; Weinstock, R.B.; Weinhold, F. Natural Population Analysis. J. Chem. Phys. 1985, 83, 735–746. [Google Scholar] [CrossRef]
Figure 1. The benzodiazopyrrole derivatives previously described (the diastereomeric mixture and its pure stereomers 1RR and 1RS) that have shown photo-responsive antiproliferative activity against HCT 116 p53-/- cancer cells [20], and the water soluble deprotected d1RR and d1RS herein explored for their photo-responsive properties.
Ijms 21 01246 g001
Figure 2. (A) UV spectra of d1RR in the dark at different pH: Red pH = 5.7; blue pH = 7.0; green pH = 8.0. (BD) UV spectra before (blue line) and after (green line) irradiation with LED at 435 nm (1 min, 1 LED), at pH = 8.0, 7.0, and 5.7, respectively.
Ijms 21 01246 g002
Figure 3. (AD) d1RR trans to cis conversion (pH = 8.0) under 5 mW laser irradiation at 435 nm. (A) Time-dependent absorption spectra of d1RR. (B) 2D graphical representation of the changes of absorbance of d1RR plotted as a function of time. (C,D) The changes of absorbance at specific wavelengths, 340 and 400 nm, together with their best fit (red solid lines). Reaction half-lives and apparent rate constants are deduced on these fittings.
Ijms 21 01246 g003
Figure 4. Changes in the apparent rate constants versus pH in the 5.7–8.0 range. (A) d1RR trans→cis (irradiated at 435 nm). (B) d1RR cis→trans (thermal decay). Both the transitions were monitored at 400 nm (circle) and 340 nm (square). Data coming from interpolations of the data are reported in Table S1. (C) Titration curve of d1RR in phosphate buffered solution obtained plotting the absorptions at 400 and 495 nm versus pH.
Ijms 21 01246 g004
Scheme 1. Structures of ionic forms, and pka values calculated for d1RR/d1RS using the ACD/Percepta software (ACD/Percepta, Advanced Chemistry Development, Inc., Toronto, ON, Canada, 2017, http://www.acdlabs.com).
Ijms 21 01246 sch001
Figure 5. Conformational families of the trans (up; I,II) and cis (down; IIIV) isomers of d1RR in their anionic form. The lowest energy conformer of each family is displayed as a ball and sticks. Conformers belonging to subfamilies are superimposed by phenyl ring atoms and displayed as a stick. Heteroatoms are coloured by atom type: O, red; N, blue. Hydrogens are omitted for clarity with the exception of those involved in intramolecular interactions (evidenced with a black dashed line).
Ijms 21 01246 g005
Figure 6. (IIV) conformational families of the zwitterionic form of d1RR. The lowest energy conformer of each family is displayed as a ball and sticks. Conformers belonging to subfamilies are superimposed by phenyl ring atoms and displayed as a stick. Heteroatoms are coloured by atom type: O, red; N, blue. Hydrogens are omitted for clarity with the exception of those involved in intramolecular interactions (evidenced with a black dashed line).
Ijms 21 01246 g006
Figure 7. Putative d1RR ionic species present in solution in the pH range considered during the fast UV experiments according to DFT calculations. Dashed arrows indicate conformational equilibria between the different conformers and GM indicate the structure of the global minimum conformer. Structures are relative to the obtained DFT minima and are displayed as a ball and sticks. Heteroatoms are coloured by atom type: O, red; N, blue. The molecular electrostatic potential surface is displayed.
Ijms 21 01246 g007
Figure 8. (A) Conversion of d1RR spectrum under continuous LED irradiation at 435 nm at different exposure time (blue t = 0; light blue t = 6 h; yellow t = 12 h; red t = 15h; green t = 18 h). (B) Cis-to-trans conversion of d1RR dissolved in phosphate buffered solution at pH = 8.0 after LED irradiation (12 h) at 435 nm. The arrows show the time-evolution of the UV profile in the dark, after LED irradiation. The spectra were acquired in the dark, (red line) immediately upon irradiation (blue line) and at consecutive 2-min intervals. (C) UV spectra of sample 1 (blue line) and of sample 2 (green line).
Ijms 21 01246 g008
Figure 9. HRMS spectrum obtained by direct infusion of (a) d1RR and (b) sample 1 on an LTQ Orbitrap XL™ Hybrid FT Mass Spectrometer.
Ijms 21 01246 g009
Figure 10. Chemical structure of d1RR and of the synthesized decarboxylate derivative, named compound 2.
Ijms 21 01246 g010
Figure 11. The aromatic region of 1H NMR spectra of compound 2 (A), d1RR (B), compound 1 (C). Full circles show the proton on phenyl ring in all species, whereas, the triangles in (A,B) indicate the proton resonances attributable to the hydrogen on pyrrole ring and the triangles in (C) the pattern of new proton signals in compound 1.
Ijms 21 01246 g011
Figure 12. Hypothesized chemical structure of compound 1.
Ijms 21 01246 g012
Table 1. Apparent rate constants calculated in s−1 from kinetic data by means of fast UV spectroscopy. The reported values have about 10% uncertainty.
1RR1RS
pHtranscis
cistrans
Δ
transcis
cistrans
Δ
340 nm400 nm340 nm400 nm340 nm400 nm340 nm400 nm
8.06.30 × 1024.95 × 10−24.18 × 10−36.19 × 10−36.86 × 10−25.64 × 10−23.69 × 10−35.10 × 10−3
7.56.54 × 10−25.21 × 10−26.08 × 10−31.03 × 10−27.38 × 10−25.97 × 10−26.66 × 10−39.22 × 10⁻³
7.08.35 × 10−27.30 × 10−21.57 × 10−21.93 × 10−27.79 × 10−26.48 × 10−21.48 × 10−22.10 × 10⁻²
6.79.00 × 10−27.22 × 10−23.65 × 10−25.77 × 10−29.50 × 10−27.70 × 10−23.85 × 10−25.33 × 10⁻²
6.50.1008.06 × 10−24.95 × 10−26.30 × 10−29.00 × 10−27.96 × 10−24.95 × 10−26.03 × 10−2
6.00.1878.89 × 10−20.1480.2390.1160.2100.1310.148
5.70.2240.2770.5780.1690.2240.3850.2100.347
Table 2. Assignment of fragment ions contained in the HR CID MS2 spectrum of compound 1. Elemental formulae of the mono-isotopic ion peaks (m/z) are reported with double bond/ring equivalents (RDB) and errors (Δ, ppm).
Exp. MS (m/z)Δ ppm, RDBFormulaStructural hypothesis
Precursor ion
306.14572.833, 7.5C15H20N3O4+ Ijms 21 01246 i001
Fragment ions
288.13512.888, 8.5C15H18N3O3+ Ijms 21 01246 i002
275.12743.479, 8.0C14H17N3O3•+ Ijms 21 01246 i003
232.10841.494, 7.5C12H14N3O2+ Ijms 21 01246 i004
262.11932.602, 7.5C13H16N3O3+ Ijms 21 01246 i005
247.10832.352, 7.05C13H15N2O3+ Ijms 21 01246 i006
220.09753.090, 6.5C12H14NO3+ Ijms 21 01246 i007
214.09812.856, 8.5C12H12N3O+ Ijms 21 01246 i008
204.11383.240, 6.5C11H14N3O+ Ijms 21 01246 i009
188.08242.985, 7.5C10H10N3O+ Ijms 21 01246 i010
173.07142.661, 7.5C10H9N2O+ Ijms 21 01246 i011
159.06832.732, 7.0C10H9NO•+ Ijms 21 01246 i012
146.06042.462, 6.5C9H8NO+ Ijms 21 01246 i013
108.04451.015, 4.5C6H6NO+ Ijms 21 01246 i014

