Abstract
Proton pump inhibitor use is associated with an increased risk of gastric cancer, which may be mediated by hypergastrinemia. Spasmolytic polypeptide-expression metaplasia (SPEM) has been proposed as a precursor of gastric cancer. We have examined the effects of the gastrin receptor antagonist netazepide (NTZ) or vehicle on the gastric corpus mucosa of H+/K+ATPase beta subunit knockout (KO) and wild-type (WT) mice. The gastric corpus was evaluated by histopathology, immunohistochemistry (IHC), in situ hybridization (ISH) and whole-genome gene expression analysis, focusing on markers of SPEM and neuroendocrine (NE) cells. KO mice had pronounced hypertrophy, intra- and submucosal cysts and extensive expression of SPEM and NE cell markers in the gastric corpus, but not in the antrum. Numerous SPEM-related genes were upregulated in KO mice compared to WT mice. NTZ reduced hypertrophia, cysts, inflammation and NE hyperplasia. However, NTZ neither affected expression of SPEM markers nor of SPEM-related genes. In conclusion, NTZ prevented mucosal hypertrophy, cyst formation and NE cell hyperplasia but did not affect SPEM. The presence of SPEM seems unrelated to the changes caused by hypergastrinemia in this animal model.
1. Introduction
Proton pump inhibitors (PPIs) are widely used in the management of acid-related gastrointestinal diseases such as peptic ulcers and gastro-esophageal reflux. The increase in PPI use has been well described in many countries in recent decades [1,2]. The consequences of long-term acid inhibition, however, are not fully known. In humans, the first accepted gastric side effects of PPI use was development of fundic gland polyps [3,4]. Based on animal studies, an increased risk of gastric neuroendocrine (NE) tumors developing from enterochromaffin-like (ECL) cells and carcinomas has been predicted since the 1980s, and more recently several epidemiological studies have found that patients using PPIs have an increased risk of gastric cancer [5,6,7]. Numerous studies suggest that hypergastrinemia, which is a common factor found in many conditions with increased cancer risk, is a key element in gastric carcinogenesis of the corpus and fundus [8,9]. In response to gastric luminal contents and hypoacidity, gastrin is released from antral G cells and stimulates function and proliferation of ECL cells where the gastrin receptor is located [10]. Gastrin release is also regulated by gastrin-releasing peptide (GRP) and GRP receptor (GRP-R) expression in the gastrointestinal tract has been located to the antrum [11]. The GRP-R is also expressed in a range of tissues outside the gastrointestinal tract [12] as well as in various types of cancer [13,14].
One proposed precursor lesion to gastric cancer, in addition to the more established intestinal metaplasia (IM), is spasmolytic polypeptide-expression metaplasia (SPEM). It has been postulated that chief cells may dedifferentiate or transdifferentiate into SPEM [15], which is characterized by the expression of glands with mucous-containing trefoil factor 2 (TFF2), also named spasmolytic polypeptide. MUC6 and clusterin are markers of SPEM and numerous other genes are differentially expressed in tissue containing SPEM. SPEM has been studied extensively in mice given an agent causing parietal cell atrophy (DMP-777, L-635 or tamoxifen) [16]. The role of gastrin in SPEM development is not completely understood. In gastrin knockout (KO) mice given DMP-777, development of SPEM is accelerated [17], but remarkably, gastrin receptor KO mice develop SPEM after DMP-777 administration following a similar timeline compared to wild-type (WT) controls [18]. The role of histamine has also been investigated and a proportion of histidine decarboxylase (HDC) KO mice develop SPEM spontaneously and have accelerated development of SPEM after DMP-777 administration [19]. Histamine 2 receptor KO mice given DMP-777 develop SPEM similar to WT controls [18].
The H+/K+ATPase beta subunit KO mouse is a model of long-term PPI use, gastric hypoacidity and secondary hypergastrinemia [20,21,22]. KO mice develop marked hyperplasia of the oxyntic mucosa with intramucosal cystic changes and ECL cell hyperplasia, but only a few develop gastric carcinoma [21].
In the present study, we have examined the effects of the gastrin receptor antagonist netazepide (NTZ) in KO and WT mice, with particular focus on NE hyperplasia and SPEM markers.
2. Results
During the study period, two animals died—one in the WT/NTZ group and one in the KO/PEG group—leaving 11 mice in the WT/PEG and KO/NTZ groups and nine in the two other groups. No differences were observed in animal welfare between the different groups.
2.1. KO Mice Had Elevated Intragastric pH and Plasma Gastrin
The mice in both KO groups had significantly higher intragastric pH than WT/PEG (P = 0.001) and WT/NTZ (P = 0.003) mice. WT/NTZ mice had higher intragastric pH than WT/PEG (P = 0.044). Both KO groups had high median gastric pH, but lower pH levels were observed in the group receiving NTZ compared to vehicle (P = 0.001) (Figure 1A). Gastrin levels were higher in the KO groups compared to the WT groups (P < 0.001), and the levels were also higher in WT/NTZ mice compared to WT/PEG (P = 0.005). No significant differences between the two KO groups were observed (Figure 1B).
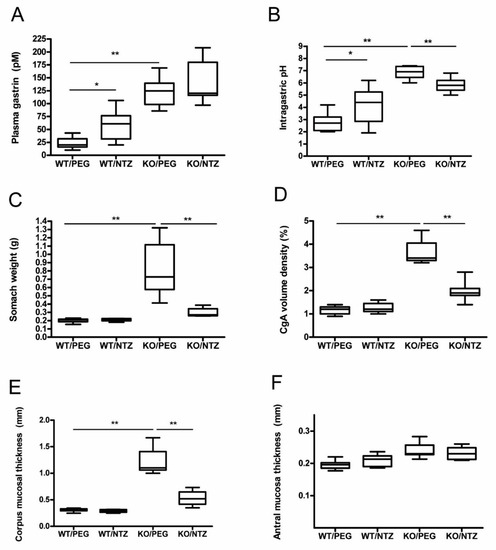
Figure 1.
Intragastric pH (A), plasma gastrin (B), stomach weight at termination (C), chromogranin A (CgA) volume density (D), corpus (E) and antral (F) mucosal thickness in H+/K+ ATPase beta subunit knockout (KO) mice and wild-type (WT) controls given netazepide (NTZ) or polyethylene glycol (PEG) as vehicle.
2.2. NTZ Reduced Stomach Weight and Oxyntic Mucosal Thickness in KO Mice
Stomach weight was higher in the KO/PEG group than in all other groups (p = 0.001), as expected from the known effects of hypergastrinemia. KO/NTZ mice had lower stomach weight than KO/PEG mice, reflecting the effects of gastrin receptor antagonism, but still higher than both WT groups (p = 0.001) (Figure 1C). Oxyntic mucosal thickness was lower in KO/NTZ mice compared to KO/PEG, whereas there was no difference between the WT/NTZ and WT/PEG groups (Figure 1D). Antral mucosal thickness did not differ between the groups (Figure 1F).
2.3. NTZ Reduced Intramucosal Cysts and Invasions below the Muscularis Mucosae in KO Mice
In addition to pronounced hyperplasia of the oxyntic mucosa, KO mice had intramucosal cysts and half of the animals had invasions of the muscularis mucosae with benign appearance, often in the proximity of vascular structures also penetrating the muscularis mucosae. The histopathological changes are presented in Table 1. NTZ reduced the number of intramucosal cysts as well as submucosal invasions in KO mice. NTZ also reduced inflammation in KO mice. Representative HE histologic appearance of oxyntic mucosa in the two KO groups compared to WT/PEG are presented in Figure 2.

Table 1.
Quantification of histopathological changes. Histopathological changes of the gastric corpus mucosa in KO mice given PEG (KO/PEG) or NTZ (KO/NTZ) and WT controls given PEG (WT/PEG) or NTZ (WT/NTZ).
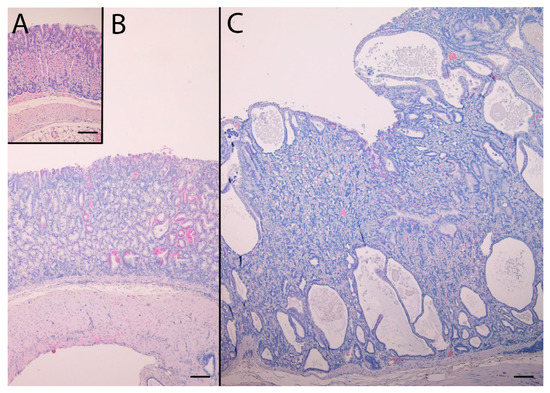
Figure 2.
Hematoxylin and eosin stained sections of the oxyntic mucosae from WT/PEG mice (A), KO/NTZ mice (B) and KO/PEG mice (C). There is marked hyperplasia and intramucosal cysts in KO mice that are reduced by NTZ. Scare Bar = 100 µm.
2.4. NTZ Reduced NE Cell Hyperplasia, Whereas SPEM Was Unaffected in KO Mice
Gene expression analysis was performed to examine the relative expression of NE and SPEM related genes. This showed that numerous genes previously reported to be associated with SPEM were overexpressed in KO/PEG versus WT/PEG mice, including tff2, clu, muc6, cd44 and wfdc2, with no significant change in KO mice receiving NTZ (Table 2). It was confirmed by both IHC and ISH that KO/PEG mice had pronounced expression of the SPEM markers TFF2 and clusterin in the gastric corpus [23] (Figure 3 and Figure 4), and that the SPEM did not seem to be affected by NTZ. There was also overexpression of markers of intestinalizing transcripts such as cftr and muc4. Only two (muc13 and muc5b) of the SPEM associated genes overexpressed in KO/PEG mice compared to WT/PEG mice were reduced by NTZ. Expression of the mouse chief cell markers pgc (pepcinogen C), gif (intrinsic factor), anpep (Alanyl Aminopeptidase) and Bhlha15 (MIST1) was substantially lower in KO/PEG than WT/PEG mice but was also not affected by NTZ with the exception of anpep.
Table 2.
Expression of spasmolytic polypeptide-expressing metaplasia (SPEM)-related genes in the gastric corpus mucosa of KO/PEG versus WT/PEG mice and in KO/NTZ versus KO/PEG mice. Numerous of these genes were overexpressed in KO/PEG mice, but most of these genes were not affected by NTZ. Green: significant change (adjusted p-value (q-value) < 0.05); red: non-significant change (q-value > 0.05).
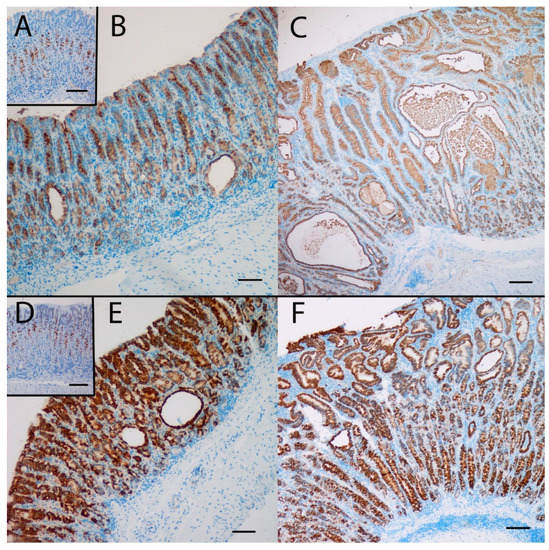
Figure 3.
The SPEM marker clusterin was highly expressed at the protein (A,B,C) and the mRNA (D,E,F) level in the oxyntic mucosa of KO/PEG mice (C and F), compared to WT/PEG mice (A and D). Clusterin expression in KO mice was not affected by NTZ (B and E). Scare Bar = 100 µm.
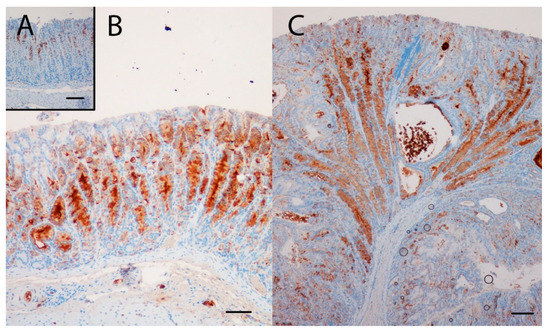
Figure 4.
The SPEM marker TFF2 was highly expressed in the oxyntic mucosa of KO/PEG (C) and KO/NTZ mice compared to WT/PEG mice (A). TFF2 expression in KO mice was not affected by NTZ administration (B). Scare Bar = 100µm..
Conversely, NTZ significantly reduced the volume density of CgA-positive cells in KO mice (Figure 1F and Figure 5), demonstrating the effect of NTZ on NE cells. Gene expression analysis demonstrated that NTZ reduced expression of the general NE marker chga (CgA) as well as the ECL cell markers hdc (HDC), slcl18a2 (VMAT-2) and cckbr (CCKBR) in KO mice, whereas expression of the D cell marker sst (somatostatin) was increased (Table 3). Expression of the general NE markers eno2 (NSE) and uchl1 (PGP9.5) and the enterochromaffin (EC) cell marker tph1 (tryptophan hydroxylase) were, however, not affected by NTZ in KO mice.
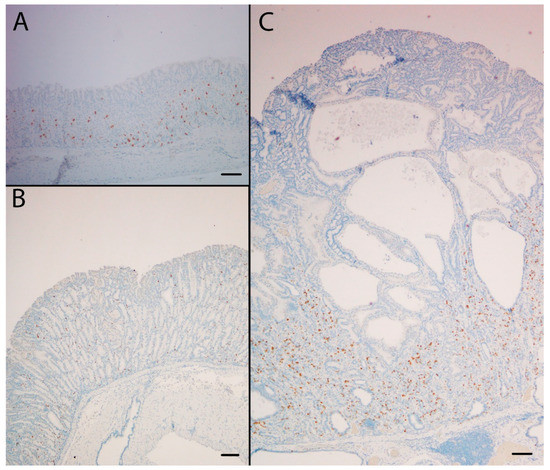
Figure 5.
The NE marker CgA was highly expressed in the oxyntic mucosa of KO/PEG mice (C) compared to WT/PEG mice (A). Hyperplasia of NE cells in KO mice was reduced by NTZ in KO/NTZ mice (B). Scare Bar = 100 µm.
Table 3.
Expression of NE markers in gastric corpus mucosa of WT/PEG versus KO/PEG mice and KO/ NTZ versus KO/PEG mice. General NE and ECL cell markers were overexpressed in KO mice and downregulated by NTZ. Green: significant change (adjusted p-value (q-value) < 0.05); red: non-significant change (q-value > 0.05).
2.5. Global Gene Expression Profiles Were Influenced More by Genotype Than Administration of NTZ
The global gene expression illustrated by a principal component analysis (Figure 6) displayed separation of both KO groups from the WT groups, with only minor separation between the NTZ and PEG groups. Thus, the global gene expression was influenced by genotype to a larger extent than by NTZ. The 20 most differentially expressed genes are shown in Table 4. Only three genes were differentially expressed in WT/PEG mice versus WT/NTZ mice (Supplementary Table S1).
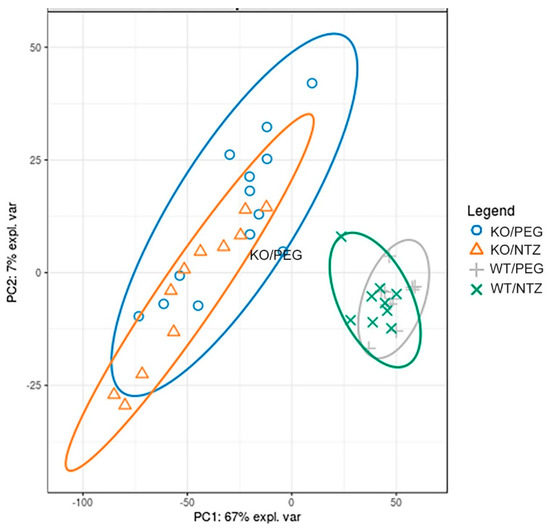
Figure 6.
Global gene expression analysis of KO and WT mice given NTZ or PEG illustrated by at principal component analysis plot. Genotype affects global gene expression more than NTZ.
Table 4.
Global gene expression analysis in KO/PEG versus KO/NTZ and KO/PEG versus WT/PEG mice illustrating the effect of NTZ in KO mice. Differentially expressed genes in the gastric corpus mucosa of KO/NTZ mice in comparison with KO/PEG mice sorted by ascending adjusted p-value (q-value). Green: significant change (adjusted p-value (q-value) < 0.05); red: non-significant change (q-value > 0.05).
3. Discussion
Various animal models with gastric hypoacidity and/or hypergastrinemia have been used to study carcinogenesis of the human gastric corpus and fundus [24]. Animal models have the potential to delineate disease mechanisms and numerous rodent models have also been used to study presumed premalignant changes of gastric corpus [16]. In the current study, we have examined the effects of the gastrin receptor antagonist NTZ on the oxyntic mucosa of anacidic and hypergastrinemic H+/K+ATPase beta subunit KO mice with particular focus on NE cell hyperplasia and SPEM. We found that NTZ reduced the pronounced hypertrophy of the oxyntic mucosa as well as intramucosal cysts and invasions below the muscularis mucosae. An antral gastrin receptor has been reported [25], but a trophic effect of hypergastrinemia or effects of gastrin receptor blockade with NTZ on antral mucosal thickness was not seen. NTZ reduced the volume density of NE cells as well as gene expression of several NE markers in the oxyntic mucosa of KO mice. Gene expression of the ECL cell markers HDC (gene hdc), VMAT-2 (gene slcl18a2) and CCKBR (gene cckbr) were reduced, as expected from studies localizing the CCKB-R on the ECL cell [26]. The expression of tryptophan hydroxylase (gene Tph1), which is expressed in EC cells, was not affected by NTZ in agreement with previous studies showing that EC cells are not stimulated by gastrin [27]. Interestingly, the expression of the D cell marker somatostatin (gene sst) was increased by NTZ in KO mice. This is in concordance with gastrin having a negative trophic effect on the D cells in the stomach [27,28] and may reflect simultaneous augmentation of a compensatory mechanism. Previously, we have found that NTZ prevents development of neoplasia in the gastric corpus in hypergastrinemic cotton rats [29]. Similarly, carcinogenesis in M. natalensis is enhanced by the histamine 2 receptor antagonist (H2RA) loxtidine [30], but inhibited by NTZ [31] and likewise gastric carcinogenesis in hypergastrinemic transgenic INS-GAS mice is inhibited by NTZ [32]. In patients with hypergastrinemia due to chronic atrophic gastritis, we have reported that NTZ can eradicate (type 1) ECL cell NE tumors (NETs) [33,34,35]. Interestingly, patients with chronic atrophic gastritis have an increased risk of both gastric adenocarcinomas and NETs [36,37,38]. Hypergastrinemia has also been found to be a risk factor for subsequent development of gastric cancer [8]. More recently, several epidemiological studies reported that patients using PPIs area at increased risk of gastric adenocarcinoma [5,6,7,39], whereas H2RA users did not. The studies combined therefore suggest that hypergastrinemia, a common factor in the mentioned animal models and human conditions with increased cancer risk, is pivotal in carcinogenesis of the gastric corpus and fundus [8,9].
Adenocarcinomas of the intestinal type after Lauréns classification [40] decline in Western populations [41] and the incidence is closely related to the prevalence of Helicobacter pylori (H. pylori) infection. IM is a proposed precursor lesion of intestinal type adenocarcinomas [42] and there is considerable interest for IM in risk stratification of patients undergoing gastroscopy, as well as in animal models to study mechanisms in the premalignant mucosa. More recently, SPEM has also been suggested to be a precursor lesion of gastric adenocarcinomas of intestinal type [43], which may be viewed as either an alternative or a supplementary hypothesis to the previously proposed Correa cascade [42]. In epidemiologic studies, antral H. pylori infection protects against gastric cancer [44] and it therefore seems paradoxical that H. pylori-induced IM in the antrum could be a precursor lesion of cancer. However, H. pylori infection of the oxyntic mucosa with atrophy, which leads to hypoacidity and pronounced hypergastrinemia, increases the risk of cancer considerably [45]. A corresponding risk consideration concerning isolated antral IM has gained acceptance and endoscopic surveillance is not recommended in the most recent clinical guidelines in Europe [46,47].
Within the described context, it was of particular interest to further examine the role of gastrin in SPEM development. We have previously found that the SPEM marker clusterin is highly expressed in ECL cells of normogastrinemic rats, but in rats with hypergastrinemia due to PPI administration, clusterin expression was considerably increased, through a dominant shift in the expression towards cells of the mucous neck-chief cell lineages. [23]. Moreover, clusterin was found to be highly upregulated in mucus neck and SPEM cells of the H+/K+ATPase beta subunit KO mice of different ages [23]. However, the finding of accelerated SPEM development in gastrin KO mice given DMP-777 [17] demonstrates that SPEM development in mice cannot depend entirely on gastrin. In the current study, KO/PEG mice had pronounced expression of SPEM in the gastric corpus and numerous genes previously reported to be associated with SPEM were differentially overexpressed compared to WT/PEG mice. The genes overexpressed included SPEM-defining clu, tff2 and muc6, as well as wfdc2 [48] and cd44 [49] which also have been identified as markers of SPEM and do not occur in the normal gastric corpus. However, when comparing KO/PEG and KO/NTZ groups NTZ neither affected the existence of SPEM nor the expression of previously reported SPEM associated genes, as assessed both histologically and on protein and transcriptional level.
We have previously described SPEM in oxyntic mucosa of 3-month-old H+/K+ATPase beta subunit KO mice [23]. Others have reported mice of age 35 days to be depleted of mature chief cells based on morphological criteria in HE stained sections [50]. The phenomenon was independent of hypergastrinemia since the same was found in mice double KO for gastrin and H+/K+ATPase beta subunit [50]. Loss of morphologically normal mature chief cells is one of the characteristics of SPEM, which might indicate that SPEM is present very early in oxyntic mucosa of this mouse model. Exactly when this occurs, and whether it is distinguishable from glands of the embryonic and juvenile stomach described by others [51,52], has not been investigated. In the current study, we found that the KO/PEG mice (at age 13 months) expressed only negligible amounts of several chief cell markers compared to WT/PEG mice, and the expression was unaffected by NTZ. Since KO mice depleted of mature chief cells still develop SPEM, mature chief cells may not be the origin of SPEM in the current mouse model. Expressions of Xbp1 and Mist1 (gene Bhlha15) were low in KO mice and these are important for chief cells to form zymogen-containing vesicles [53,54]. In the current mouse model, one could speculate that SPEM develops from the large proportion of cells previously described as immature cells in young KO mice [50], possibly represented chief cells devoid of granules. Alternatively, the observations could support the theory that SPEM is derived from isthmus stem cells [55].
The term SPEM is viewed by many as synonymous with the older terms “pyloric metaplasia”, “pseudopyloric metaplasia” or “antralization” and the actual alterations may be considered a common response to glandular injury observed in both mice and humans. Furthermore, ulcer-associated cell linage (UACL) has also been viewed as similar reparative linages and is observed in reparative processes along the gastrointestinal tract, including at the edges of gastric ulcers [56] and also in inflammatory bowel disease [57,58]. Also, one of the highly expressed markers of gastric SPEM, clusterin, seems to have subtle protective roles on oxyntic mucosa [59]. These observations combined suggest that SPEM should not be considered merely a preneoplastic lesion. Accordingly, it has been argued that SPEM could be an phenomenon associated with carcinogenesis, as a form of mucosal injury, not a precursor of cancer [60], and that SPEM and IM could be commensals for a neoplastic process rather than true direct precursors [43]. Reported findings from animal models of IM and SPEM have led to conflicting hypotheses of the cellular origin of the lesions, which may be either chief cells [61] or isthmus stem cells [55]. It is notable that the ability of gastric metaplasia to progress to invasive cancer seems to be lacking in the more than 20 mouse models utilized to study this, which also questions the validity of studies aiming to examine premalignant changes [16]. We propose that further studies of dysplasia and SPEM in patients with chronic atrophic gastritis treated long-term with NTZ [33,35] could provide more information about the roles of SPEM and hypergastrinemia in human carcinogenesis.
In conclusion, the gastrin receptor antagonist NTZ prevented mucosal hypertrophy, intramucosal cysts, invasions of the muscularis mucosae as well as NE cell hyperplasia in the gastric corpus of H+/K+ATPase beta subunit KO mice. However, SPEM is found in oxyntic mucosa independently of gastrin signaling and the presence of SPEM seems unrelated to the presumed premalignant changes caused by hypergastrinemia in this animal model. The clinical implications of the current findings could be clarified through further studies of patients treated with NTZ.
4. Materials and Methods
4.1. Animals and Genotyping
H+/K+ATPase beta subunit KO mice, originally with a BalbC/black6 [22] background and later BalbC [62], were back-crossed 8 times onto BalbC mice (Møllegaard, Skensved, Denmark) before study start. DNA was isolated from tail samples using the high pure PCR template preparation kit, according to the manufacturer’s instruction (11796828001, Roche Diagnostics, Indianapolis, IN, USA). A PCR assay was set up to genotype mice and was used to distinguish between homozygous KO mice (-/-), heterozygous mice (+/-) and homozygous WT mice (+/+). For detection of H+/K+ATPase WT alleles, specific primers (forward primer: GGACCAACTGACTTCTGGGA and reverse primer: ACCTGCATGGCAGTCTCTCT, product length: 472 bp) were based on H+/K+ATPase beta subunit (Atp4b) sequence (Ensembl: ENSMUSG00000031449) and located approximately 100 bp upstream and downstream of exon 1 (the target for the homologous recombination). A PCR product with size of 472 bp would appear only if the WT allele was present. Inserted construct (PKG-neo) alleles were detected using specific primers selected from the PKG-neo sequence [22] (forward primer: AGACAATCGGCTGCTCTGAT and reverse primer: ATACTTTCTCGGCAGGAGCA, product length: 261 bp) and a PCR product with the size 261 bp would only appear if the KO allele was present. All variants were genotyped by combining these two PCR reactions using the FastStart PCR Master kit according to the manufacturer´s instruction (Roche Diagnostics), and visually inspected after gel electrophoresis separation and ethidium bromide staining.
For the experiments, we used female H+/K+ATPase KO mice (n = 21) and WT controls (n = 21) 1 month of age. They were housed in cages with aspen woodchip bedding (B&K Universal Ltd., Hull, UK). The room temperature was 24 ± 1 °C with a relative humidity of 40-50% and a 12h light/dark cycle. RM1 (E) diet (SDS, Essex, UK) and tap water were provided ad libitum. The study was approved by the Norwegian National Animal Research Authority.
4.2. Study Design
The drug netazepide (NTZ), previously named YF476 (Hammersmith Medicines Research, London, UK), has been shown to be a potent and highly selective competitive antagonist of the gastrin/CCKB receptor (CCKBR) [63]. It was dissolved to a concentration of 12 mg/mL in polyethylene glycol 300 (PEG) and given as subcutaneous injections at a dose of 40 mg/kg (80 µmol/kg) to n = 11 KO mice (KO/NTZ) and n = 10 WT mice (WT/NTZ) from age 1 month, once every two weeks for 12 months. Animals in the two control groups received an equivalent volume of PEG (KO/PEG, n = 10 mice and WT/PEG, n = 11 mice). The toxic dose of NTZ have been studied by Ferring and in 13-week studies, the no-observable-adverse-effect level was 100 mg/kg/day in rats and in dogs [64].
4.3. Intragastric pH and Plasma Gastrin at Termination
The intragastric pH was measured by using a pediatric pH catheter with the stomach in situ. The lowest pH obtained after searching the entire corpus and antral mucosa was recorded for each animal. The animals were killed by exsanguination from the inferior cava while anesthetized with 5% isoflurane with O2 and N2 in a ratio of 3:2 as carrier gas with total gas flow of 1 L/min. Plasma was separated and kept at −20 °C until gastrin analysis by radioimmunoassay as previously described [65].
4.4. Histopathology, Immunohistochemistry (IHC) and in situ Hybridization (ISH)
After measuring intragastric pH, the stomach was removed, rinsed in saline, weighed, opened along the greater curvature and inspected macroscopically. Tissue samples for histopathology were taken longitudinally from the rumen to the pylorus on the major curvature and fixed in 4% formaldehyde before processing and paraffin embedding. Sections (4 μm) were cut and stained with hematoxylin and eosin (HE) and examined microscopically. Dysplasia was graded as none, mild, moderate or severe, and inflammation was graded according to the Updated Sydney Classification [66]. To assess trophic changes, mucosal thickness was determined using an ocular grid. Measurements were performed in areas without macroscopic abnormalities and where gastric crypts were visible in their full length. Corpus and antral mucosal thickness were measured at five locations in each animal and the means recorded. The number of cystic dilations and invasions through the muscularis mucosa per mm horizontal mucosa was counted in areas where the gastric glands were cut longitudinally and visible in their whole length.
Tissue sections used for IHC were processed through standard pretreatment, including de-paraffinization, rehydration and quenching of endogenous peroxidase. Antigen retrieval was achieved by 15 min boiling in buffer (pH 6.0 for clusterin and TFF2, pH 9 for CgA). The following primary antibodies and conditions were used: anti-chromogranin A (CgA) (ImmunoStar 20080, dilution 1:2000, incubation for 1h at room temperature), goat anti-clusterin (C-18, sc-6419, Santa Cruz Biotechnology Inc., TX, USA; dilution 1:1300, incubation overnight at 4 °C) and rabbit anti-Trefoil Factor 2 (TFF2) (13681-1-AP, Proteintech Europe, dilution 1:900, incubation overnight at 4 °C). The clusterin immunoreaction was visualized using incubation with biotinylated anti-goat immunoglobulins (BA-5000, Vector Laboratories Inc., CA, USA) (1:200) for 30 min at room temperature, followed by the Vectastain Elite ABC HRP kit (PK-6100 Standard, Vector Laboratories Inc., CA). The TFF2 and CgA immunoreactions were visualized using the rabbit/mouse EnVision-HRP/DAB+ kit (K5007, DAKO, Glostrup, Denmark). All dilutions were done with Tris Buffered Saline (TBS) (50 mM, pH 7.4) with 0.025% Tween and 1% Bovine Serum Albumin (BSA). Omitting the primary antibody or incubation with matching isotype immunoglobulin were negative controls. The volume densities of CgA-immunoreactive cells were calculated in all mice using a point counting method as described previously [67].
ISH for clusterin mRNA was done using the RNAscope 2.0 HD Reagent Kit (Brown) for FFPE tissue (310035, Advanced Cell Diagnostics Inc, CA, USA) and a custom probe (427891, Mm-Clu) for clusterin, according to the manufacturer’s protocol. All IHC and ISH sections were counterstained with hematoxylin. Images were captured using Nikon E400 microscope, DS-Fil U2 camera and NIS-Elements BR imaging software (Nikon, Melville, NY, USA), and further processed using ImageJ.
4.5. Whole-Genome Gene Expression Analysis
Biopsies from the ventral part of the gastric corpus mucosa were frozen in liquid N2 and then homogenized in lysis buffer using an Ultra-Turrax rotating knife homogenizer. The RNeasy Mini kit (Qiagen, Germantown, MD, USA) was used for total RNA extraction, according to the manufacturer’s instructions. RNA concentration was measured using Qubit® RNA HS Assay Kit on a Qubit® 3.0 Fluorometer (Thermo Fisher Scientific Inc., Waltham, MA, USA). Integrity was assessed using Agilent RNA 6000 Pico Kit on a 2100 Bioanalyzer instrument (Agilent Technologies, Santa Clara, CA, USA).
RNA sequencing libraries were prepared using TruSeq Stranded mRNA kit (Illumina, San Diego, CA, USA) according to the manufacturer’s instructions. In brief, 2 µg total RNA was used as starting material. First, mRNA was purified from the total RNA using poly-T oligo-attached magnetic beads, follows by random fragmentation using divalent cations at 94 °C for 4 min. First and second strand cDNAs were synthesized using random oligonucleotides and SuperScript II, followed by DNA polymerase I and RNase H. Exonuclease/polymerase was used to produce blunted overhangs. Illumina duel index adapter oligonucleotides were ligated to the cDNA after 3’ end adenylation. DNA fragments were enriched by 15 cycles of PCR reaction. The libraries were purified using the AMPure XP (Beckman Coulter, Inc., Indianapolis, IN, USA), quantitated by qPCR using KAPA Library Quantification Kit (Kapa Biosystems, Inc., Wilmington, MA, USA) and validated using Agilent High Sensitivity DNA Kit on a Bioanalyzer (Agilent Technologies, Santa Clara, CA, USA). The size range of the DNA fragments were measured to be in the range of app. 200–1000 bp and peaked around 285 bp.
Libraries were normalized and pooled to 2.0 pM and subjected to clustering on two NextSeq 500 high output flow cells. Finally, single read sequencing was performed for 75 cycles on a NextSeq 500 instrument (Illumina, Inc. San Diego, CA, USA), according to the manufacturer’s instructions.
Base calling was done on the NextSeq 500 instrument by RTA 2.4.6. FASTQ files were generated using bcl2fastq2 Conversion Software v2.17 (Illumina, Inc. San Diego, CA, USA). For each sample, kallisto (v0.42.4) was used to quantify GRCm38 transcripts and Sleuth was used for differential expression analysis [68]. Statistical significance was defined with a Wald test and Benjamini-Hochberg false discovery rate adjusted P-value < 0.05. The microarray experiments are Minimum Information About a Microarray Experiment (MIAME) compliant and have been deposited in the Gene Expression Omnibus (GEO) repository and assigned the GEO accession number GSE142513. The expressions of genes reported to be associated with SPEM [69,70] and NE cells [26,71,72,73,74] in previous publications were manually identified in the gene expression analysis.
Supplementary Materials
Supplementary materials can be found at https://www.mdpi.com/1422-0067/21/3/927/s1.
Author Contributions
Conceptualization, H.L.W. and R.F.; methodology, K.M.A., A.K.S. (Astrid Kamilla Stunes), A.K.S. (Arne Kristian Sandvik), A.F., I.B. and R.F.; formal analysis, A.K.S. (Arne Kristian Sandvik), A.F., P.M., U.S. and I.B.; data curation, K.M.A.; writing—original draft preparation, K.M.A.; writing—review and editing, A.K.S. (Astrid Kamilla Stunes), A.K.S. (Arne Kristian Sandvik), H.L.W., U.S., A.F., I.B. and R.F.; visualization, R.F. and I.B.; project administration, R.F.; funding acquisition, H.L.W. and R.F. All authors have read and agreed to the published version of the manuscript.
Funding
This research was funded by the Norwegian Gastroenterologists Association and the Department of Clinical and Molecular Medicine, Faculty of Medicine and Health Sciences, NTNU – Norwegian University of Science and Technology, Trondheim, Norway.
Acknowledgments
The authors thank Bjørn Munkvold for preparation of histopathological specimens, Britt Schulze for gastrin RIA, and staff at the Comparative Medicine Core facility (CoMed) at NTNU for assistance with drug administration and animal caretaking. The RNA library prep, sequencing and bioinformatics analysis were performed in close collaboration with the Genomics Core Facility (GCF), Norwegian University of Science and Technology (NTNU). GCF is funded by the Faculty of Medicine and Health Sciences at NTNU and Central Norway Regional Health Authority.
Conflicts of Interest
The authors declare no conflict of interest.
Abbreviations
| CgA | Chromogranin A |
| EC | Enterochromaffin |
| ECL | Enterochromaffin-like |
| GEO | Gene Expression Omnibus |
| GRP | Gastrin-releasing peptide |
| GRP-R | Gastrin-releasing peptide receptor |
| HDC | Histidine decarboxylase |
| IHC | Immunohistochemistry |
| IM | Intestinal metaplasia |
| ISH | In-situ hybridization |
| KO | Knockout |
| MIAME | Minimum Information About a Microarray Experiment |
| NE | Neuroendocrine |
| NET | Neuroendocrine tumour |
| NTZ | Netazepide |
| PEG | Polyethylene glycol |
| PPI | Proton pump inhibitor |
| SPEM | Spasmolytic polypeptide-expression metaplasia |
| WT | Wild-type |
References
- De la Coba Ortiz, C.; Arguelles Arias, F.; Martin de Argila de Prados, C.; Judez Gutierrez, J.; Linares Rodriguez, A.; Ortega Alonso, A.; Rodriguez de Santiago, E.; Rodriguez-Tellez, M.; Vera Mendoza, M.I.; Aguilera Castro, L.; et al. Proton-pump inhibitors adverse effects: a review of the evidence and position statement by the Sociedad Espanola de Patologia Digestiva. Rev. Esp. Enferm. Dig. 2016, 108, 207–224. [Google Scholar] [CrossRef] [PubMed]
- Pottegard, A.; Broe, A.; Hallas, J.; de Muckadell, O.B.; Lassen, A.T.; Lodrup, A.B. Use of proton-pump inhibitors among adults: a Danish nationwide drug utilization study. Therap. Adv. Gastroenterol. 2016, 9, 671–678. [Google Scholar] [CrossRef] [PubMed]
- el-Zimaity, H.M.; Jackson, F.W.; Graham, D.Y. Fundic gland polyps developing during omeprazole therapy. Am. J. Gastroenterol. 1997, 92, 1858–1860. [Google Scholar] [PubMed]
- Jalving, M.; Koornstra, J.J.; Wesseling, J.; Boezen, H.M.; De Jong, S.; Kleibeuker, J.H. Increased risk of fundic gland polyps during long-term proton pump inhibitor therapy. Aliment. Pharmacol. Ther. 2006, 24, 1341–1348. [Google Scholar] [CrossRef] [PubMed]
- Brusselaers, N.; Wahlin, K.; Engstrand, L.; Lagergren, J. Maintenance therapy with proton pump inhibitors and risk of gastric cancer: a nationwide population-based cohort study in Sweden. BMJ Open 2017, 7, e017739. [Google Scholar] [CrossRef]
- Niikura, R.; Hayakawa, Y.; Hirata, Y.; Yamada, A.; Fujishiro, M.; Koike, K. Long-term proton pump inhibitor use is a risk factor of gastric cancer after treatment for Helicobacter pylori: a retrospective cohort analysis. Gut 2018, 67, 1908–1910. [Google Scholar] [CrossRef]
- Cheung, K.S.; Chan, E.W.; Wong, A.Y.S.; Chen, L.; Wong, I.C.K.; Leung, W.K. Long-term proton pump inhibitors and risk of gastric cancer development after treatment for Helicobacter pylori: a population-based study. Gut 2018, 67, 28–35. [Google Scholar] [CrossRef]
- Murphy, G.; Abnet, C.C.; Choo-Wosoba, H.; Vogtmann, E.; Weinstein, S.J.; Taylor, P.R.; Mannisto, S.; Albanes, D.; Dawsey, S.M.; Rehfeld, J.F.; et al. Serum gastrin and cholecystokinin are associated with subsequent development of gastric cancer in a prospective cohort of Finnish smokers. Int. J. Epidemiol. 2017, 46, 914–923. [Google Scholar] [CrossRef]
- Fossmark, R.; Sagatun, L.; Nordrum, I.S.; Sandvik, A.K.; Waldum, H.L. Hypergastrinemia is associated with adenocarcinomas in the gastric corpus and shorter patient survival. APMIS 2015, 123, 509–514. [Google Scholar] [CrossRef]
- Waldum, H.L.; Sandvik, A.K.; Brenna, E.; Petersen, H. Gastrin-histamine sequence in the regulation of gastric acid secretion. Gut 1991, 32, 698–701. [Google Scholar] [CrossRef]
- Ferris, H.A.; Carroll, R.E.; Lorimer, D.L.; Benya, R.V. Location and characterization of the human GRP receptor expressed by gastrointestinal epithelial cells. Peptides 1997, 18, 663–672. [Google Scholar] [CrossRef]
- Kim, M.K.; Park, H.J.; Kim, Y.; Bae, S.K.; Kim, H.J.; Bae, M.K. Involvement of Gastrin-Releasing Peptide Receptor in the Regulation of Adipocyte Differentiation in 3T3-L1 Cells. Int. J. Mol. Sci. 2018, 19, 3971. [Google Scholar] [CrossRef] [PubMed]
- Ghosh, A.; Woolum, K.; Kothandaraman, S.; Tweedle, M.F.; Kumar, K. Stability Evaluation and Stabilization of a Gastrin-Releasing Peptide Receptor (GRPR) Targeting Imaging Pharmaceutical. Molecules 2019, 24, 2878. [Google Scholar] [CrossRef] [PubMed]
- Patel, O.; Shulkes, A.; Baldwin, G.S. Gastrin-releasing peptide and cancer. Biochim. Biophys. Acta 2006, 1766, 23–41. [Google Scholar] [CrossRef]
- Goldenring, J.R.; Nam, K.T.; Mills, J.C. The origin of pre-neoplastic metaplasia in the stomach: chief cells emerge from the Mist. Exp. Cell Res. 2011, 317, 2759–2764. [Google Scholar] [CrossRef]
- Petersen, C.P.; Mills, J.C.; Goldenring, J.R. Murine Models of Gastric Corpus Preneoplasia. Cell. Mol. Gastroenterol. Hepatol 2017, 3, 11–26. [Google Scholar] [CrossRef]
- Nomura, S.; Yamaguchi, H.; Ogawa, M.; Wang, T.C.; Lee, J.R.; Goldenring, J.R. Alterations in gastric mucosal lineages induced by acute oxyntic atrophy in wild-type and gastrin-deficient mice. Am. J. Physiol. Gastrointest. Liver Physiol. 2005, 288, G362–G375. [Google Scholar] [CrossRef]
- Aikou, S.; Fukushima, Y.; Ogawa, M.; Nozaki, K.; Saito, T.; Matsui, T.; Goldenring, J.R.; Kaminishi, M.; Nomura, S. Alterations in gastric mucosal lineages before or after acute oxyntic atrophy in gastrin receptor and H2 histamine receptor-deficient mice. Dig. Dis. Sci. 2009, 54, 1625–1635. [Google Scholar] [CrossRef]
- Nozaki, K.; Weis, V.; Wang, T.C.; Falus, A.; Goldenring, J.R. Altered gastric chief cell lineage differentiation in histamine-deficient mice. Am. J. Physiol. Gastrointest. Liver Physiol. 2009, 296, G1211–G1220. [Google Scholar] [CrossRef]
- Aasarod, K.M.; Ramezanzadehkoldeh, M.; Shabestari, M.; Mosti, M.P.; Stunes, A.K.; Reseland, J.E.; Beisvag, V.; Eriksen, E.F.; Sandvik, A.K.; Erben, R.G.; et al. Skeletal effects of a gastrin receptor antagonist in H+/K+ATPase beta subunit KO mice. J. Endocrinol. 2016, 230, 251–262. [Google Scholar] [CrossRef]
- Bakkelund, K.E.; Waldum, H.L.; Nordrum, I.S.; Hauso, O.; Fossmark, R. Long-term gastric changes in achlorhydric H(+)/K(+)-ATPase beta subunit deficient mice. Scand. J. Gastroenterol. 2010, 45, 1042–1047. [Google Scholar] [CrossRef] [PubMed]
- Scarff, K.L.; Judd, L.M.; Toh, B.H.; Gleeson, P.A.; Van Driel, I.R. Gastric H(+),K(+)-adenosine triphosphatase beta subunit is required for normal function, development, and membrane structure of mouse parietal cells. Gastroenterology 1999, 117, 605–618. [Google Scholar] [CrossRef]
- Vange, P.; Bruland, T.; Doseth, B.; Fossmark, R.; Sousa, M.M.L.; Beisvag, V.; Sordal, O.; Qvigstad, G.; Waldum, H.L.; Sandvik, A.K.; et al. The cytoprotective protein clusterin is overexpressed in hypergastrinemic rodent models of oxyntic preneoplasia and promotes gastric cancer cell survival. PloS ONE 2017, 12, e0184514. [Google Scholar] [CrossRef]
- Fossmark, R.; Qvigstad, G.; Martinsen, T.C.; Hauso, O.; Waldum, H.L. Animal models to study the role of long-term hypergastrinemia in gastric carcinogenesis. J. Biomed. Biotech. 2011, 2011, 975479. [Google Scholar] [CrossRef]
- Hayakawa, Y.; Jin, G.; Wang, H.; Chen, X.; Westphalen, C.B.; Asfaha, S.; Renz, B.W.; Ariyama, H.; Dubeykovskaya, Z.A.; Takemoto, Y.; et al. CCK2R identifies and regulates gastric antral stem cell states and carcinogenesis. Gut 2015, 64, 544–553. [Google Scholar] [CrossRef]
- Bakke, I.; Qvigstad, G.; Sandvik, A.K.; Waldum, H.L. The CCK-2 receptor is located on the ECL cell, but not on the parietal cell. Scand. J. Gastroenterol. 2001, 36, 1128–1133. [Google Scholar] [CrossRef]
- D’Adda, T.; Corleto, V.; Pilato, F.P.; Baggi, M.T.; Robutti, F.; Delle Fave, G.; Bordi, C. Quantitative ultrastructure of endocrine cells of oxyntic mucosa in Zollinger-Ellison syndrome. Correspondence with light microscopic findings. Gastroenterology 1990, 99, 17–26. [Google Scholar] [CrossRef]
- Chen, D.; Uribe, A.; Håkanson, R.; Sundler, F. Somatostatin cells in the oxyntic mucosa of hypo- or hypergastrinemic rats. Scand. J. Gastroenterol. 1992, 27, 479–482. [Google Scholar] [CrossRef]
- Martinsen, T.C.; Kawase, S.; Hakanson, R.; Torp, S.H.; Fossmark, R.; Qvigstad, G.; Sandvik, A.K.; Waldum, H.L. Spontaneous ECL cell carcinomas in cotton rats: natural course and prevention by a gastrin receptor antagonist. Carcinogenesis 2003, 24, 1887–1896. [Google Scholar] [CrossRef]
- Nilsson, O.; Wangberg, B.; Johansson, L.; Theodorsson, E.; Dahlstrom, A.; Modlin, I.M.; Ahlman, H. Rapid induction of enterochromaffinlike cell tumors by histamine2-receptor blockade. Am. J. Pathol. 1993, 142, 1173–1185. [Google Scholar]
- Kidd, M.; Siddique, Z.L.; Drozdov, I.; Gustafsson, B.I.; Camp, R.L.; Black, J.W.; Boyce, M.; Modlin, I.M. The CCK(2) receptor antagonist, YF476, inhibits Mastomys ECL cell hyperplasia and gastric carcinoid tumor development. Regul. Pept. 2010, 162, 52–60. [Google Scholar] [CrossRef]
- Takaishi, S.; Cui, G.; Frederick, D.M.; Carlson, J.E.; Houghton, J.; Varro, A.; Dockray, G.J.; Ge, Z.; Whary, M.T.; Rogers, A.B.; et al. Synergistic inhibitory effects of gastrin and histamine receptor antagonists on Helicobacter-induced gastric cancer. Gastroenterology 2005, 128, 1965–1983. [Google Scholar] [CrossRef] [PubMed]
- Sagatun, L.; Mjones, P.; Jianu, C.S.; Boyce, M.; Waldum, H.L.; Fossmark, R. The gastrin receptor antagonist netazepide (YF476) in patients with type 1 gastric enterochromaffin-like cell neuroendocrine tumours: Review of long-term treatment. Eur. J. Gastroenterol. Hepatol. 2016, 28, 1345–1352. [Google Scholar] [CrossRef]
- Moore, A.R.; Boyce, M.; Steele, I.A.; Campbell, F.; Varro, A.; Pritchard, D.M. Netazepide, a gastrin receptor antagonist, normalises tumour biomarkers and causes regression of type 1 gastric neuroendocrine tumours in a nonrandomised trial of patients with chronic atrophic gastritis. PLoS ONE 2013, 8, e76462. [Google Scholar] [CrossRef]
- Fossmark, R.; Sordal, O.; Jianu, C.S.; Qvigstad, G.; Nordrum, I.S.; Boyce, M.; Waldum, H.L. Treatment of gastric carcinoids type 1 with the gastrin receptor antagonist netazepide (YF476) results in regression of tumours and normalisation of serum chromogranin A. Aliment. Pharmacol. Ther. 2012, 36, 1067–1075. [Google Scholar] [CrossRef] [PubMed]
- Elsborg, L.; Mosbech, J. Pernicious anaemia as a risk factor in gastric cancer. Acta Med. Scand. 1979, 206, 315–318. [Google Scholar] [CrossRef] [PubMed]
- Sjoblom, S.M.; Sipponen, P.; Karonen, S.L.; Jarvinen, H.J. Mucosal argyrophil endocrine cells in pernicious anaemia and upper gastrointestinal carcinoid tumours. J. Clin. Pathol. 1989, 42, 371–377. [Google Scholar] [CrossRef] [PubMed]
- Sjöblom, S.M.; Sipponen, P.; Karonen, S.L.; Jarvinen, H.J. Argyrophilic cell hyperplasia and carcinoid tumours in oxyntic mucosa of the stomach. Dependence on duration of pernicious aniaemia. Eur. J. Gastroenterol. Hepatol. 1991, 31, 153–157. [Google Scholar]
- Brusselaers, N.; Lagergren, J.; Engstrand, L. Duration of use of proton pump inhibitors and the risk of gastric and oesophageal cancer. Cancer Epidemiol. 2019, 62, 101585. [Google Scholar] [CrossRef]
- Laurén, P. The two histological main types of gastric carcinoma: diffuse and so-called intestinal-type carcinoma. APMIS 6: 209–222. Acta Pathol. Microbiol. Scand. 1965, 6, 31–49. [Google Scholar] [CrossRef]
- Henson, D.E.; Dittus, C.; Younes, M.; Nguyen, H.; Albores-Saavedra, J. Differential trends in the intestinal and diffuse types of gastric carcinoma in the United States, 1973-2000: increase in the signet ring cell type. Arch. Pathol. Lab. Med. 2004, 128, 765–770. [Google Scholar] [PubMed]
- Correa, P. Precursors of gastric and esophageal cancer. Cancer 1982, 50, 2554–2565. [Google Scholar] [PubMed]
- Goldenring, J.R.; Nam, K.T.; Wang, T.C.; Mills, J.C.; Wright, N.A. Spasmolytic polypeptide-expressing metaplasia and intestinal metaplasia: time for reevaluation of metaplasias and the origins of gastric cancer. Gastroenterology 2010, 138, 2207–2210. [Google Scholar] [CrossRef] [PubMed]
- Hansson, L.E.; Nyren, O.; Hsing, A.W.; Bergstrom, R.; Josefsson, S.; Chow, W.H.; Fraumeni Jr, J.F.; Adami, H.O. The risk of stomach cancer in patients with gastric or duodenal ulcer disease. N. Engl. J. Med. 1996, 335, 242–249. [Google Scholar] [CrossRef] [PubMed]
- Uemura, N.; Okamoto, S.; Yamamoto, S.; Matsumura, N.; Yamaguchi, S.; Yamakido, M.; Taniyama, K.; Sasaki, N.; Schlemper, R.J. Helicobacter pylori infection and the development of gastric cancer. N. Engl. J. Med. 2001, 345, 784–789. [Google Scholar] [CrossRef] [PubMed]
- Banks, M.; Graham, D.; Jansen, M.; Gotoda, T.; Coda, S.; di Pietro, M.; Uedo, N.; Bhandari, P.; Pritchard, D.M.; Kuipers, E.J.; et al. British Society of Gastroenterology guidelines on the diagnosis and management of patients at risk of gastric adenocarcinoma. Gut 2019, 68, 1545–1575. [Google Scholar] [CrossRef]
- Pimentel-Nunes, P.; Libanio, D.; Marcos-Pinto, R.; Areia, M.; Leja, M.; Esposito, G.; Garrido, M.; Kikuste, I.; Megraud, F.; Matysiak-Budnik, T.; et al. Management of epithelial precancerous conditions and lesions in the stomach (MAPS II): European Society of Gastrointestinal Endoscopy (ESGE), European Helicobacter and Microbiota Study Group (EHMSG), European Society of Pathology (ESP), and Sociedade Portuguesa de Endoscopia Digestiva (SPED) guideline update 2019. Endoscopy 2019, 51, 365–388. [Google Scholar]
- Nozaki, K.; Ogawa, M.; Williams, J.A.; Lafleur, B.J.; Ng, V.; Drapkin, R.I.; Mills, J.C.; Konieczny, S.F.; Nomura, S.; Goldenring, J.R. A molecular signature of gastric metaplasia arising in response to acute parietal cell loss. Gastroenterology 2008, 134, 511–522. [Google Scholar] [CrossRef]
- Wada, T.; Ishimoto, T.; Seishima, R.; Tsuchihashi, K.; Yoshikawa, M.; Oshima, H.; Oshima, M.; Masuko, T.; Wright, N.A.; Furuhashi, S.; et al. Functional role of CD44v-xCT system in the development of spasmolytic polypeptide-expressing metaplasia. Cancer Sci. 2013, 104, 1323–1329. [Google Scholar] [CrossRef]
- Franic, T.V.; Judd, L.M.; Robinson, D.; Barrett, S.P.; Scarff, K.L.; Gleeson, P.A.; Samuelson, L.C.; Van Driel, I.R. Regulation of gastric epithelial cell development revealed in H(+)/K(+)-ATPase beta-subunit- and gastrin-deficient mice. Am. J. Physiol. Gastrointest. Liver Physiol. 2001, 281, G1502–G1511. [Google Scholar] [CrossRef]
- Keeley, T.M.; Samuelson, L.C. Cytodifferentiation of the postnatal mouse stomach in normal and Huntingtin-interacting protein 1-related-deficient mice. Am. J. Physiol. Gastrointest. Liver Physiol. 2010, 299, G1241–G1251. [Google Scholar] [CrossRef]
- Karam, S.M.; Li, Q.; Gordon, J.I. Gastric epithelial morphogenesis in normal and transgenic mice. Am. J. Physiol. 1997, 272, G1209–G1220. [Google Scholar] [CrossRef] [PubMed]
- Willet, S.G.; Mills, J.C. Stomach Organ and Cell Lineage Differentiation: from Embryogenesis to Adult Homeostasis. Cell. Mol. Gastroenterol. Hepatol. 2016, 2, 546–559. [Google Scholar] [CrossRef] [PubMed]
- Huh, W.J.; Esen, E.; Geahlen, J.H.; Bredemeyer, A.J.; Lee, A.H.; Shi, G.; Konieczny, S.F.; Glimcher, L.H.; Mills, J.C. XBP1 controls maturation of gastric zymogenic cells by induction of MIST1 and expansion of the rough endoplasmic reticulum. Gastroenterology 2010, 139, 2038–2049. [Google Scholar] [CrossRef]
- Hayakawa, Y.; Ariyama, H.; Stancikova, J.; Sakitani, K.; Asfaha, S.; Renz, B.W.; Dubeykovskaya, Z.A.; Shibata, W.; Wang, H.; Westphalen, C.B.; et al. Mist1 Expressing Gastric Stem Cells Maintain the Normal and Neoplastic Gastric Epithelium and Are Supported by a Perivascular Stem Cell Niche. Cancer Cell 2015, 28, 800–814. [Google Scholar] [CrossRef] [PubMed]
- Aihara, E.; Matthis, A.L.; Karns, R.A.; Engevik, K.M.A.; Jiang, P.; Wang, J.; Yacyshyn, B.R.; Montrose, M.H. Epithelial Regeneration After Gastric Ulceration Causes Prolonged Cell-Type Alterations. Cell. Mol. Gastroenterol. Hepatol. 2016, 2, 625–647. [Google Scholar] [CrossRef]
- Goldenring, J.R. Pyloric metaplasia, pseudopyloric metaplasia, ulcer-associated cell lineage and spasmolytic polypeptide-expressing metaplasia: reparative lineages in the gastrointestinal mucosa. J. Pathol. 2018, 245, 132–137. [Google Scholar] [CrossRef]
- Thorsvik, S.; van Beelen Granlund, A.; Svendsen, T.D.; Bakke, I.; Royset, E.S.; Flo, T.H.; Damas, J.K.; Ostvik, A.E.; Bruland, T.; Sandvik, A.K. Ulcer-associated cell lineage expresses genes involved in regeneration and is hallmarked by high neutrophil gelatinase-associated lipocalin (NGAL) levels. J. Pathol. 2019, 248, 316–325. [Google Scholar] [CrossRef]
- Vange, P.; Bruland, T.; Munkvold, B.; Royset, E.S.; Gleave, M.; Bakke, I. Subtle Protective Roles of Clusterin in Gastric Metaplasia After Acute Oxyntic Atrophy. Cell. Mol. Gastroenterol. Hepatol. 2019, 7, 246–250. [Google Scholar] [CrossRef]
- Graham, D.Y.; Zou, W.Y. Guilt by association: intestinal metaplasia does not progress to gastric cancer. Curr. Opin. Gastroenterol. 2018, 34, 458–464. [Google Scholar] [CrossRef]
- Nam, K.T.; Lee, H.J.; Sousa, J.F.; Weis, V.G.; O’Neal, R.L.; Finke, P.E.; Romero-Gallo, J.; Shi, G.; Mills, J.C.; Peek, R.M., Jr.; et al. Mature chief cells are cryptic progenitors for metaplasia in the stomach. Gastroenterology 2010, 139, 2028–2037. [Google Scholar] [CrossRef]
- Tennant, S.M.; Hartland, E.L.; Phumoonna, T.; Lyras, D.; Rood, J.I.; Robins-Browne, R.M.; van Driel, I.R. Influence of gastric acid on susceptibility to infection with ingested bacterial pathogens. Infect. Immun. 2008, 76, 639–645. [Google Scholar] [CrossRef] [PubMed]
- Takinami, Y.; Yuki, H.; Nishida, A.; Akuzawa, S.; Uchida, A.; Takemoto, Y.; Ohta, M.; Satoh, M.; Semple, G.; Miyata, K. YF476 is a new potent and selective gastrin/cholecystokinin-B receptor antagonist in vitro and in vivo. Aliment. Pharmacol. Ther. 1997, 11, 113–120. [Google Scholar] [CrossRef] [PubMed]
- Boyce, M.; David, O.; Darwin, K.; Mitchell, T.; Johnston, A.; Warrington, S. Single oral doses of netazepide (YF476), a gastrin receptor antagonist, cause dose-dependent, sustained increases in gastric pH compared with placebo and ranitidine in healthy subjects. Aliment. Pharmacol. Ther. 2012, 36, 181–189. [Google Scholar] [CrossRef]
- Kleveland, P.M.; Haugen, S.E.; Waldum, H.L. The preparation of bioactive 125I-gastrin, using Iodo-gen as oxidizing agent, and the use of this tracer in receptor studies. Scand. J. Gastroenterol. 1985, 20, 569–576. [Google Scholar] [CrossRef] [PubMed]
- Dixon, M.F.; Genta, R.M.; Yardley, J.H.; Correa, P. Classification and grading of gastritis. The updated Sydney System. International Workshop on the Histopathology of Gastritis, Houston 1994. Am. J. Surg. Pathol. 1996, 20, 1161–1181. [Google Scholar] [CrossRef] [PubMed]
- Weibel, E.R. Stereological principles for morphometry in electron microscopic cytology. Int. Rev. Cytol. 1969, 26, 235–302. [Google Scholar]
- Bray, N.L.; Pimentel, H.; Melsted, P.; Pachter, L. Near-optimal probabilistic RNA-seq quantification. Nat. Biotechnol. 2016, 34, 525–527. [Google Scholar] [CrossRef]
- Weis, V.G.; Sousa, J.F.; Lafleur, B.J.; Nam, K.T.; Weis, J.A.; Finke, P.E.; Ameen, N.A.; Fox, J.G.; Goldenring, J.R. Heterogeneity in mouse spasmolytic polypeptide-expressing metaplasia lineages identifies markers of metaplastic progression. Gut 2013, 62, 1270–1279. [Google Scholar] [CrossRef]
- Lee, H.J.; Nam, K.T.; Park, H.S.; Kim, M.A.; Lafleur, B.J.; Aburatani, H.; Yang, H.K.; Kim, W.H.; Goldenring, J.R. Gene expression profiling of metaplastic lineages identifies CDH17 as a prognostic marker in early stage gastric cancer. Gastroenterology 2010, 139, 213–225. [Google Scholar] [CrossRef]
- O’Connor, D.T. Chromogranin: widespread immunoreactivity in polypeptide hormone producing tissues and in serum. Regul. Pept. 1983, 6, 263–280. [Google Scholar] [CrossRef]
- Wiedenmann, B.; Franke, W.W. Identification and localization of synaptophysin, an integral membrane glycoprotein of Mr 38,000 characteristic of presynaptic vesicles. Cell 1985, 41, 1017–1028. [Google Scholar] [CrossRef]
- Schmechel, D.; Marangos, P.J.; Brightman, M. Neurone-specific enolase is a molecular marker for peripheral and central neuroendocrine cells. Nature 1978, 276, 834–836. [Google Scholar] [CrossRef]
- Day, I.N. Enolases and PGP9.5 as tissue-specific markers. Biochem. Soc. Trans. 1992, 20, 637–642. [Google Scholar] [CrossRef]


© 2020 by the authors. Licensee MDPI, Basel, Switzerland. This article is an open access article distributed under the terms and conditions of the Creative Commons Attribution (CC BY) license (http://creativecommons.org/licenses/by/4.0/).