1. Introduction
Sepsis is a life-threating condition with dysregulated systemic host response to microbial pathogens, while the septic shock is a subset of sepsis with circulatory, metabolic, and cellular abnormalities [
1]. As a consequence, multi-organ failure may rapidly develop, resulting in early death. Altered platelet count and function are critical in this disease that contributes to sepsis-associated mortality [
2]. However, platelet function in sepsis has yielded conflicting data based on previous studies. Human septic platelets have shown increased surface P-selectin expression causing high soluble P-selectin plasma levels [
3], elevated thrombospondin exposure [
4], and augmented platelet reactivity at early time points of the disease [
5]. In contrast, hyporeactive platelets with decreased ex vivo aggregability have been reported in sepsis by others [
6,
7]. Whereas, an elevated level of platelet activation status in sepsis is not questioned that is associated with the upregulation of several platelet receptors [
8]. P-selectin is involved in the formation of heterotypic aggregates [
9], and their increased expression is associated with a higher risk for mortality, especially in older septic patients [
10]. Elevated soluble P-selectin levels show a strong correlation with infection and disease severity in sepsis with coagulation disorders [
11].
Based on the etiology of insults of sepsis, the pathogen-associated molecular patterns and damage-associated molecular patterns can be distinguished [
1]. Among both conditions, similar mediators are released that react primarily with toll-like receptors (TLRs). Most TLR members, e.g., TLR4, are expressed on both platelets and megakaryocytes (MKs) [
12]. Therefore, platelets participate in the amplified inflammatory and immune response during sepsis [
13], while infection can also modulate thrombopoiesis via the TLR2 receptor [
14]. Platelet hyperactivity may turn into thrombocytopenia because of neutrophil-dependent sequestration of activated platelets into the lungs in a TLR4-dependent manner [
12].
Platelets carry a large number of microRNAs (miRNAs), messenger RNAs (mRNAs), and several proteins involved in miRNA processing (e.g., Dicer), which are delivered from MKs [
15,
16]. Expression of altered miRNAs correlates with platelet reactivity [
17], while Dicer1-mediated miRNAs are able to regulate target mRNAs and de novo synthesis of proteins being important for the hemostatic function of platelets [
18]. Accordingly, the expression of RNAs and related proteins are not static in platelets and can be modulated upon platelet activation [
19]. Among in vitro septic conditions, mRNA levels of
IL1B (interleukin-1β, IL-1β) and
F3 (tissue factor) are increased, and resulting proteins are translated and accumulated in human platelets in response to TLR4 agonist lipopolysaccharide (LPS) [
20,
21]. Based on recent in vivo experiments, transcriptional and translational properties of human and murine platelets are significantly affected by sepsis, causing de novo synthesis of αIIb protein with integrin αIIbβ3 activation [
22]. However, there is no available data about how the platelet miRNA profile is altered in sepsis that, in turn, modulates target mRNA levels and platelet function.
In this study, the miRNA profile was characterized for the first time in platelets of septic patients in comparison to healthy controls. We then validated the expression of miR-26b in septic platelets with target
SELP mRNA level that encodes P-selectin, a receptor for P-selectin glycoprotein ligand-1 [
9]. This platelet miRNA was further analyzed in relation to disease severity and sepsis-related mortality. The functional relationship between miR-26b and
SELP expression was proved among septic conditions using specific miRNA mimics. In parallel, the transcriptome of MKs in sepsis was also investigated by RNA-seq using MEG-01 cell cultures in response to LPS. Changes in the Dicer1 level were analyzed in septic platelets and LPS-induced MEG-01 cells for its contribution to altered miRNA levels. For this purpose, two experimental approaches were also applied in MEG-01 cells among septic conditions: i) downregulation of
DICER1 expression by siRNA and ii) administration of specific calpain inhibitor (calpeptin) during LPS treatment. Finally, a gene ontology (GO) analysis was performed to study the role of upregulated
SELP expression in MK function in sepsis.
3. Discussion
TLR4 receptor is functional on both platelets and MKs [
12]. In sepsis, platelets can be stimulated by LPS via TLR4, resulting in primed platelet activation elicited by other agonists [
29,
30]. Hence, there is a key role of the TLR4 receptor in the modulation of platelet phenotype in sepsis [
13,
27]. On the other hand, severe inflammation via TLR2 also regulates MK function that affects platelet production and function with enhanced GPIb and COX-2 protein expression [
14]; however, no data has been published about TLR4 in this context. In former animal models, when mice were exposed to a sublethal/low dose of LPS for up to 1 week, platelets became gradually activated, showing high P-selectin surface positivity and a larger sensitivity to aggregation as a reflection to the action of LPS on MKs [
31,
32]. Very recently,
ITGA2B (integrin subunit αIIb) expression has been found to be upregulated in circulating platelets during sepsis via dynamic trafficking of specific mRNA from MKs, and this was accompanied by increased production of integrin subunit αIIb and activation of integrin αIIbβ3 [
22]. All these changes in MKs may provide a pro-thrombotic phenotype of platelets in sepsis that could affect the procoagulant activity of the blood with increased risk for thrombosis [
27]. Of note, there was no former data on how platelet P-selectin expression can be regulated via the MK-platelet axis during sepsis.
Recently, the potential role of miRNAs in platelet and MK function has also got in focus [
25,
33]. For instance, platelet miR-27b can regulate platelet synthesis of trombospondin-1 [
19], or miR-15a modulates GPVI-mediated αIIbβ3 activation and α-granule release in MKs [
34]. In sepsis, there was only one former publication, which reported impaired miRNA levels in exosomes and pooled human blood cells but not in platelets [
35]. Since leukocytes and platelets consist of the different repertoire of miRNAs [
36], here we sought to investigate the miRNA profile of purified platelets of septic patients.
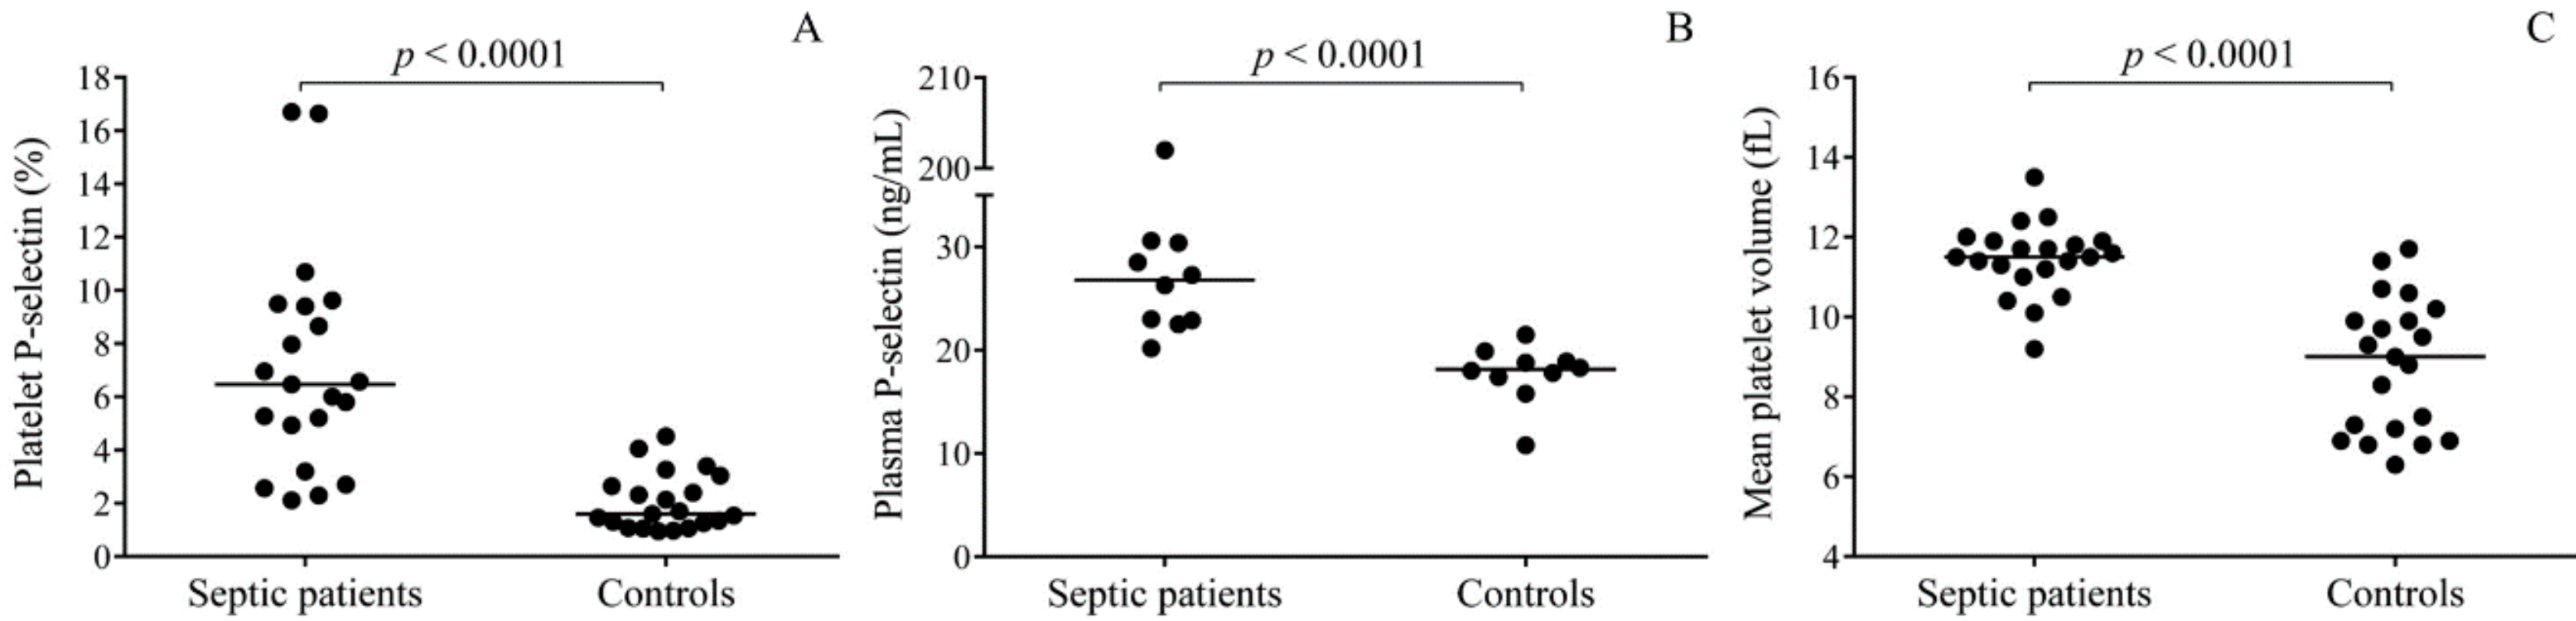
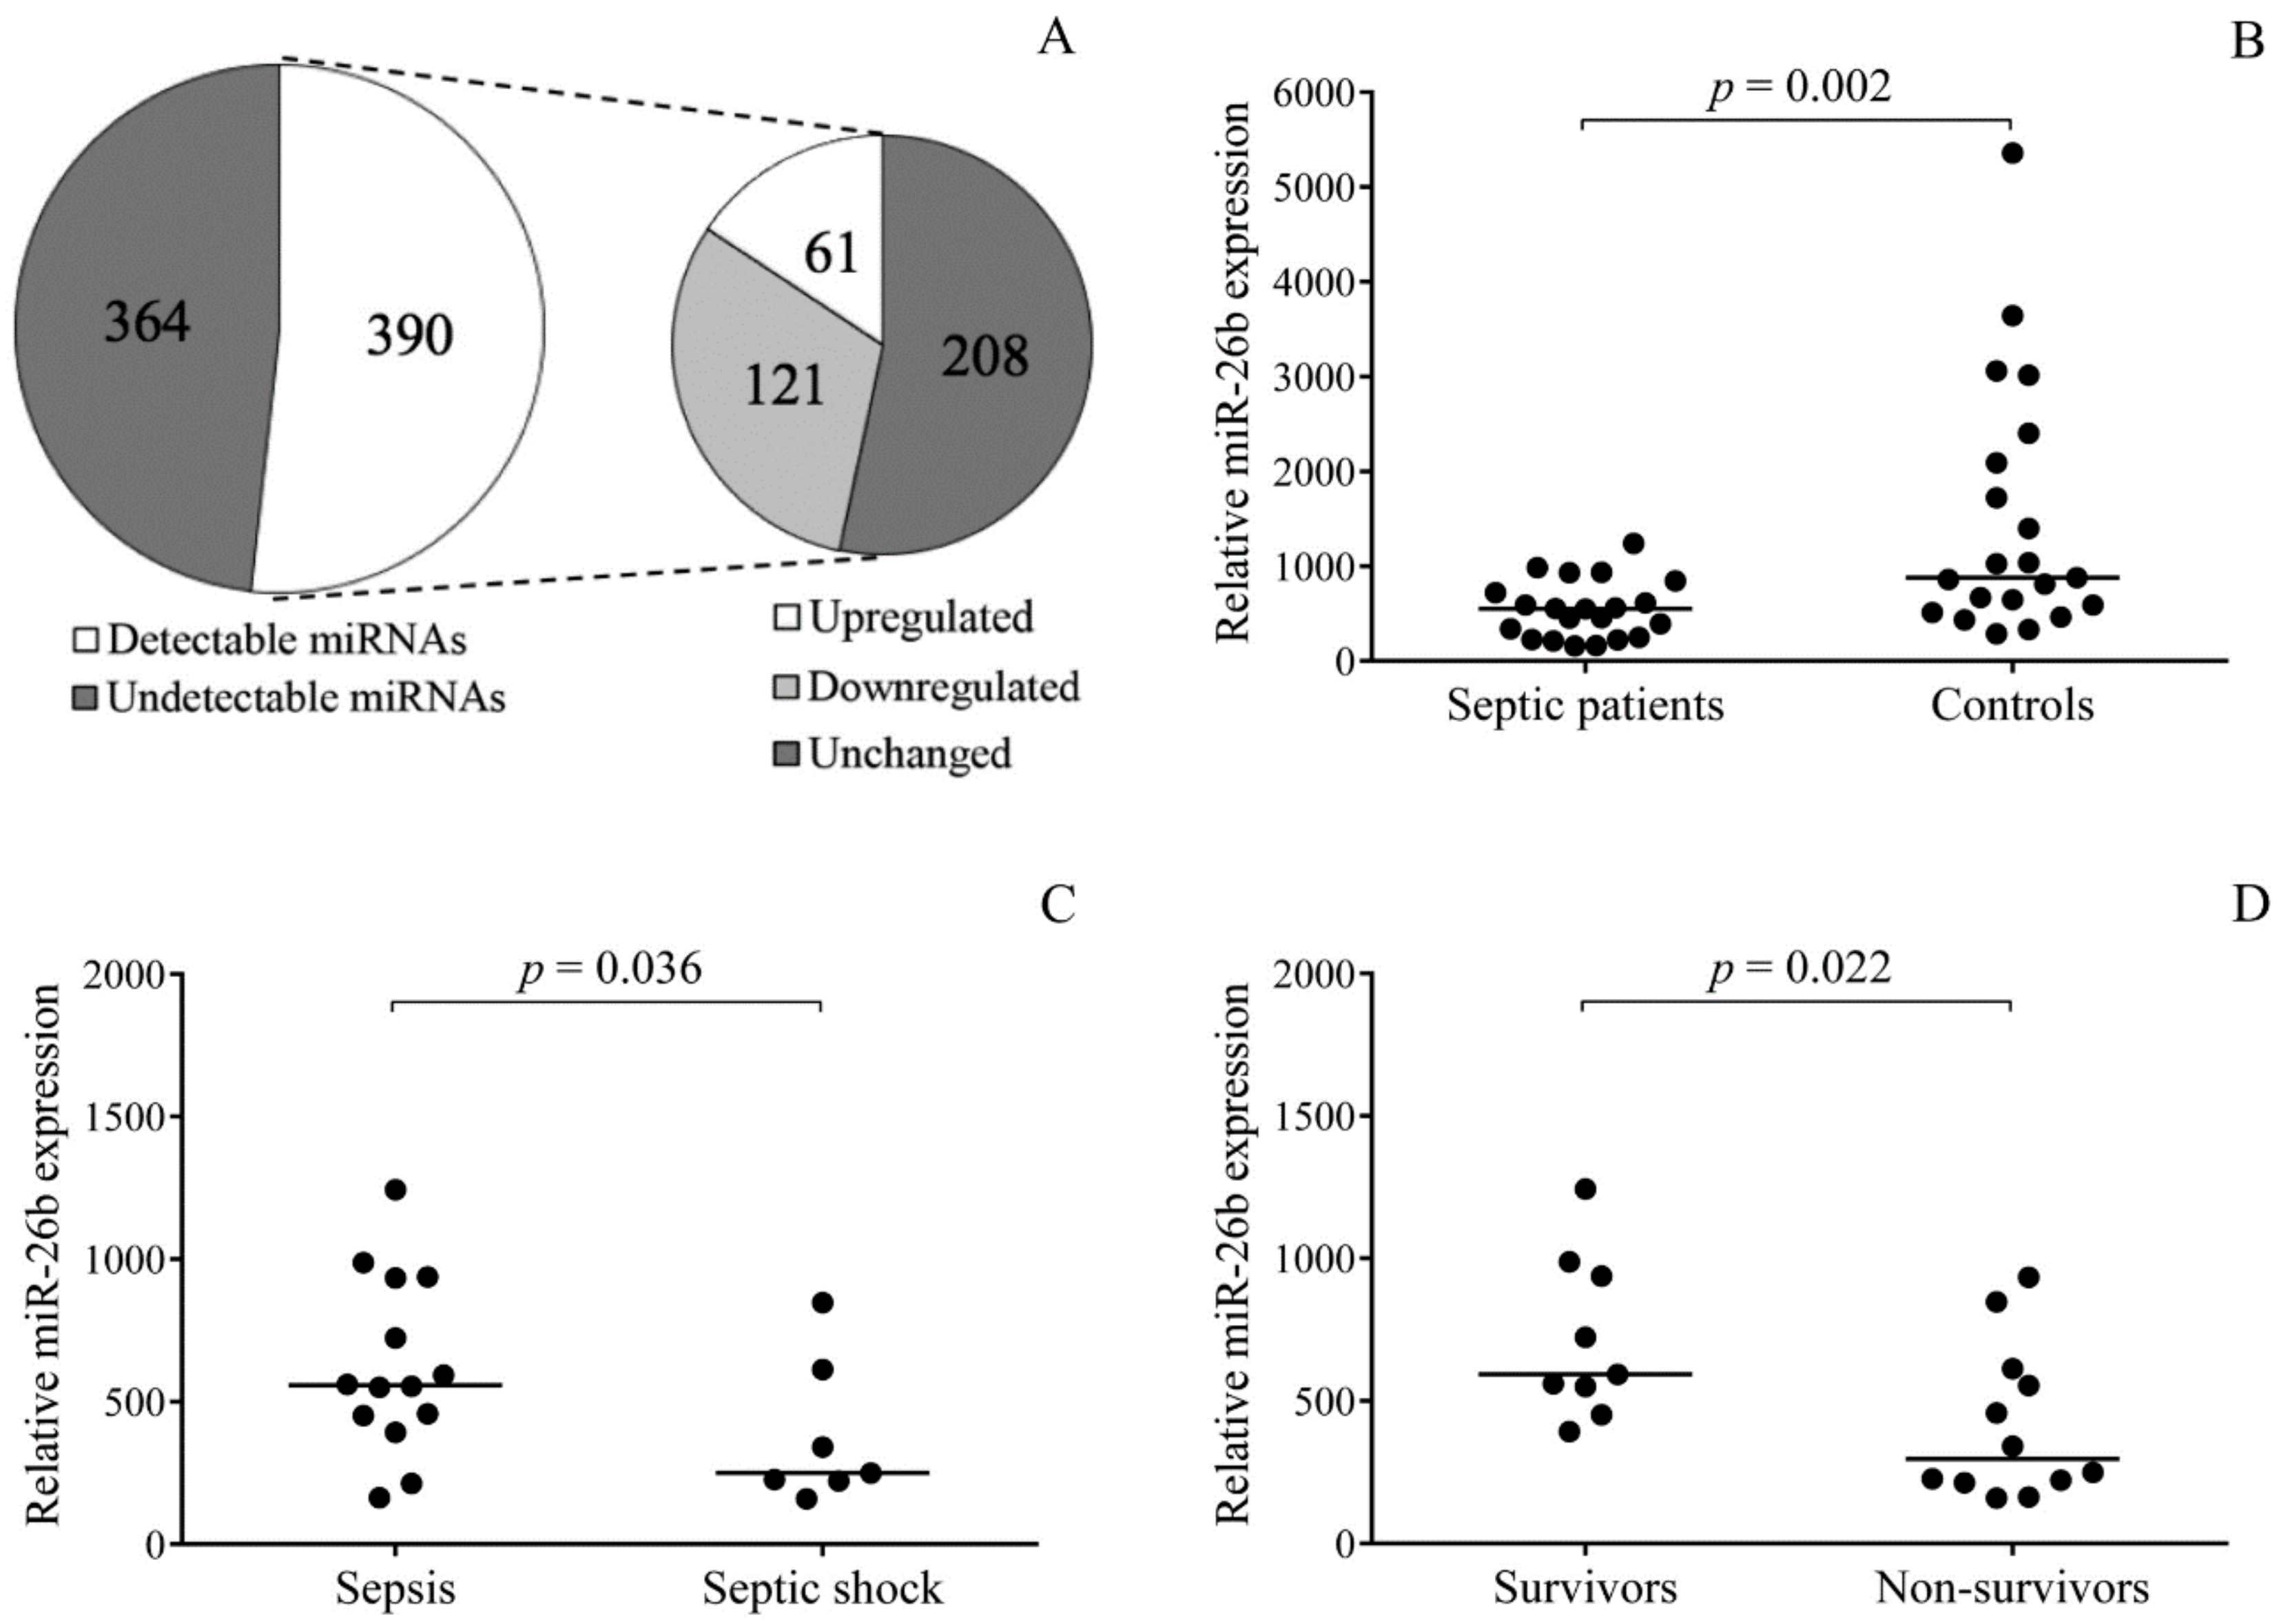
First, we profiled miRNA expression in randomly selected platelet samples from three septic patients by TaqMan Open Array. In comparison to normal individuals, 121 downregulated and 61 upregulated miRNAs were found in the septic platelets vs. controls. In the entire sepsis group consisting of 21 patients showing an increased level of platelet activation, we validated the expression of platelet miR-26b that regulates
SELP expression [
26]. This platelet miRNA showed significantly reduced levels than normal. Highly attenuated levels of platelet miR-26b were associated with the development of septic shock and early death. Accordingly, this platelet miRNA might act as a reliable biomarker for indicating platelet reactivity in this disease, as miRNAs have been recently suggested for such clinical reasons [
37,
38]. Similar to intracellular miRNA expression, reduced levels of its circulating form have been effectively used as laboratory biomarkers in serum samples of septic shock subjects [
35]. In addition, the level of miR-199b in peripheral blood cells correlates with disease severity, while exosomal miR-125b predicts survival in sepsis [
35].
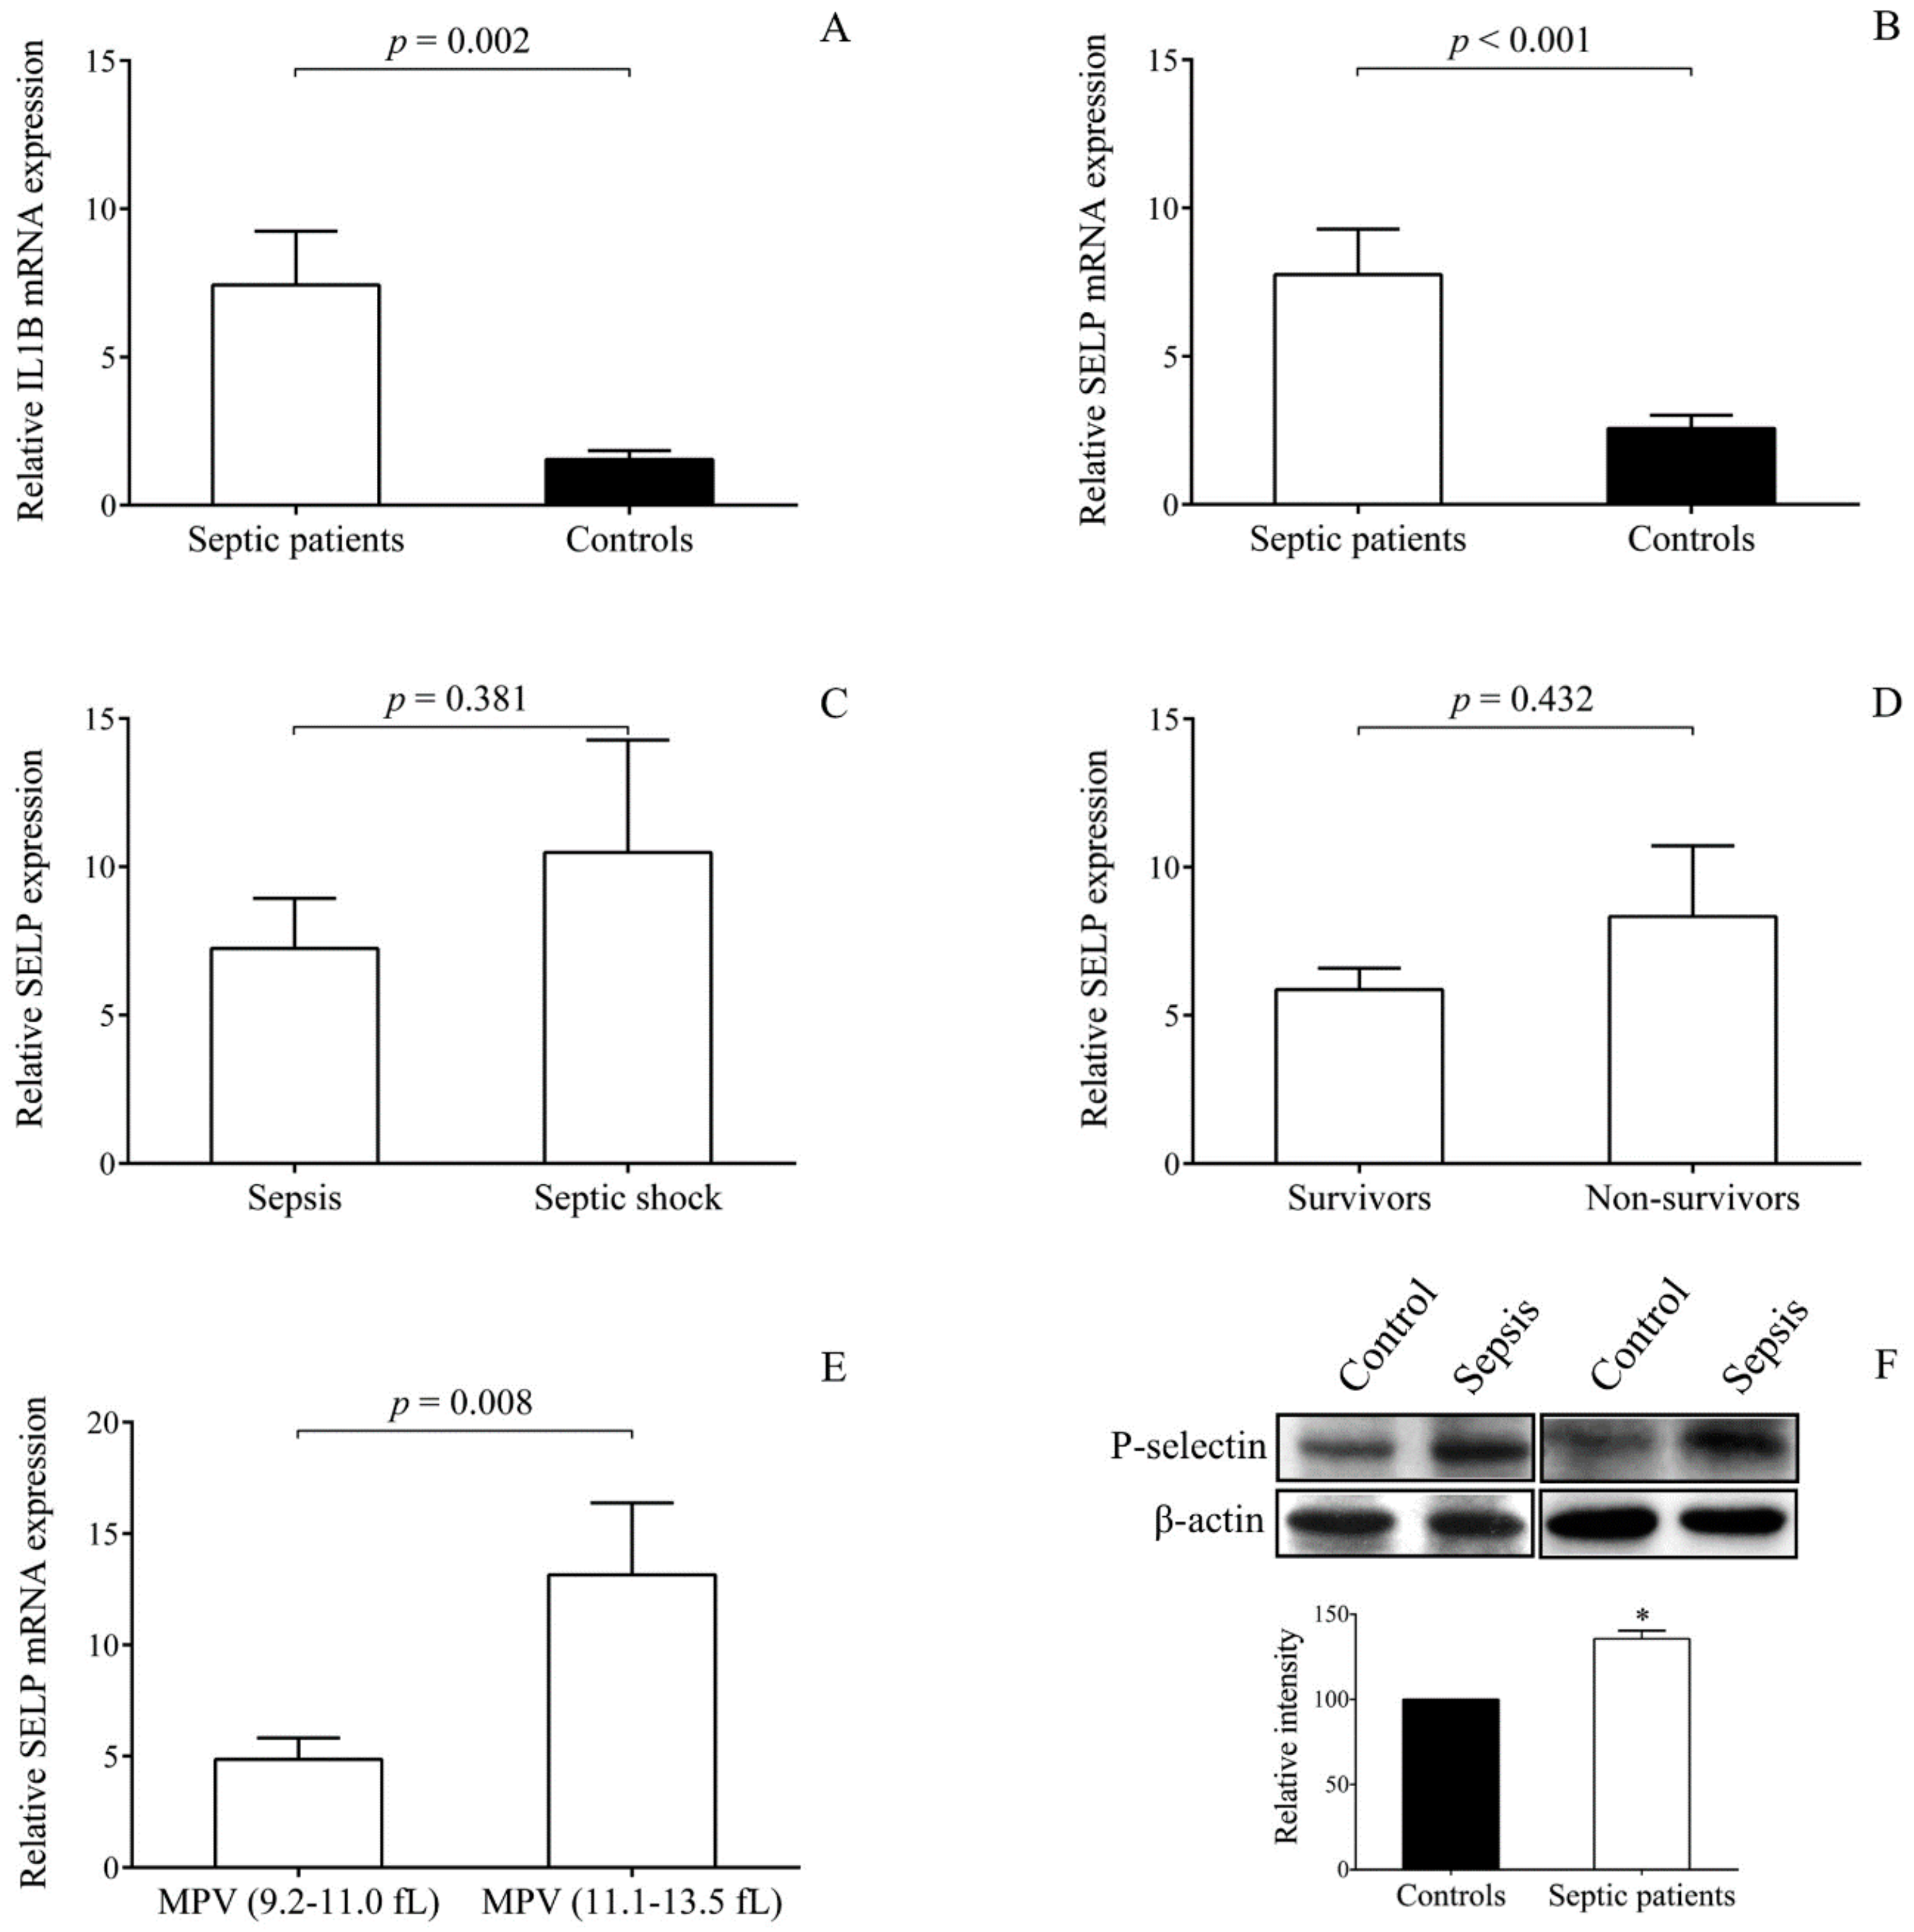
Septic platelets demonstrated augmented
SELP mRNA level compared to controls in the presence of elevated
IL1B expression that was earlier described in septic platelets [
20]. Importantly, when we further analyzed
SELP expression based on the values of MPV, higher
SELP mRNA levels were found in those with platelets having larger MPV values (≥ 11.1 fL). There is a large number of papers reporting MPV as a measure of platelet size and activity as well [
24]. Higher MPV has been associated with various disease conditions, for example, in patients with acute coronary syndrome [
24]. Larger platelets usually contain more secretory granules, more RNA, and thus become more reactive than their smaller counterparts [
39]. Although
SELP expression did not significantly correlate with the outcome of sepsis in these patients, increased MPV values also predicted disease prognosis, as reported by others in sepsis with pneumonia [
40]. In the presence of an augmented mRNA level that predicts changes in protein expression, higher P-selectin concentration was detected in platelet lysates after 72 h of sepsis onset that could be a result of altered miRNA and mRNA levels in platelets and MKs. Based on a recent animal model with peritoneal sepsis, mice showed increased P-selectin positivity at 48 h as a part of the prothrombotic phenotype of platelets developed in sepsis [
41]. Increased P-selectin expression on activated platelets is highly involved in the formation of heterotypic aggregates, resulting in microvascular thrombosis [
9]. The blockade of platelet P-selectin, in combination with simultaneous inhibition of CD11b receptor, on neutrophils effectively attenuates platelet-neutrophil interactions in septic shock [
42]. Thus, enhanced
SELP expression in platelets might contribute to a higher risk for cellular interactions and might represent a new therapeutic target in those with sepsis.
We started from some evidence that MKs are also affected by sepsis that results in altered mRNA levels in circulating platelets [
22,
43]. Hence, we thoroughly investigated LPS-induced transcriptional changes in MEG-01 cell cultures since increased
ITGA2B mRNA content has been observed in MKs to be invested in platelets during sepsis [
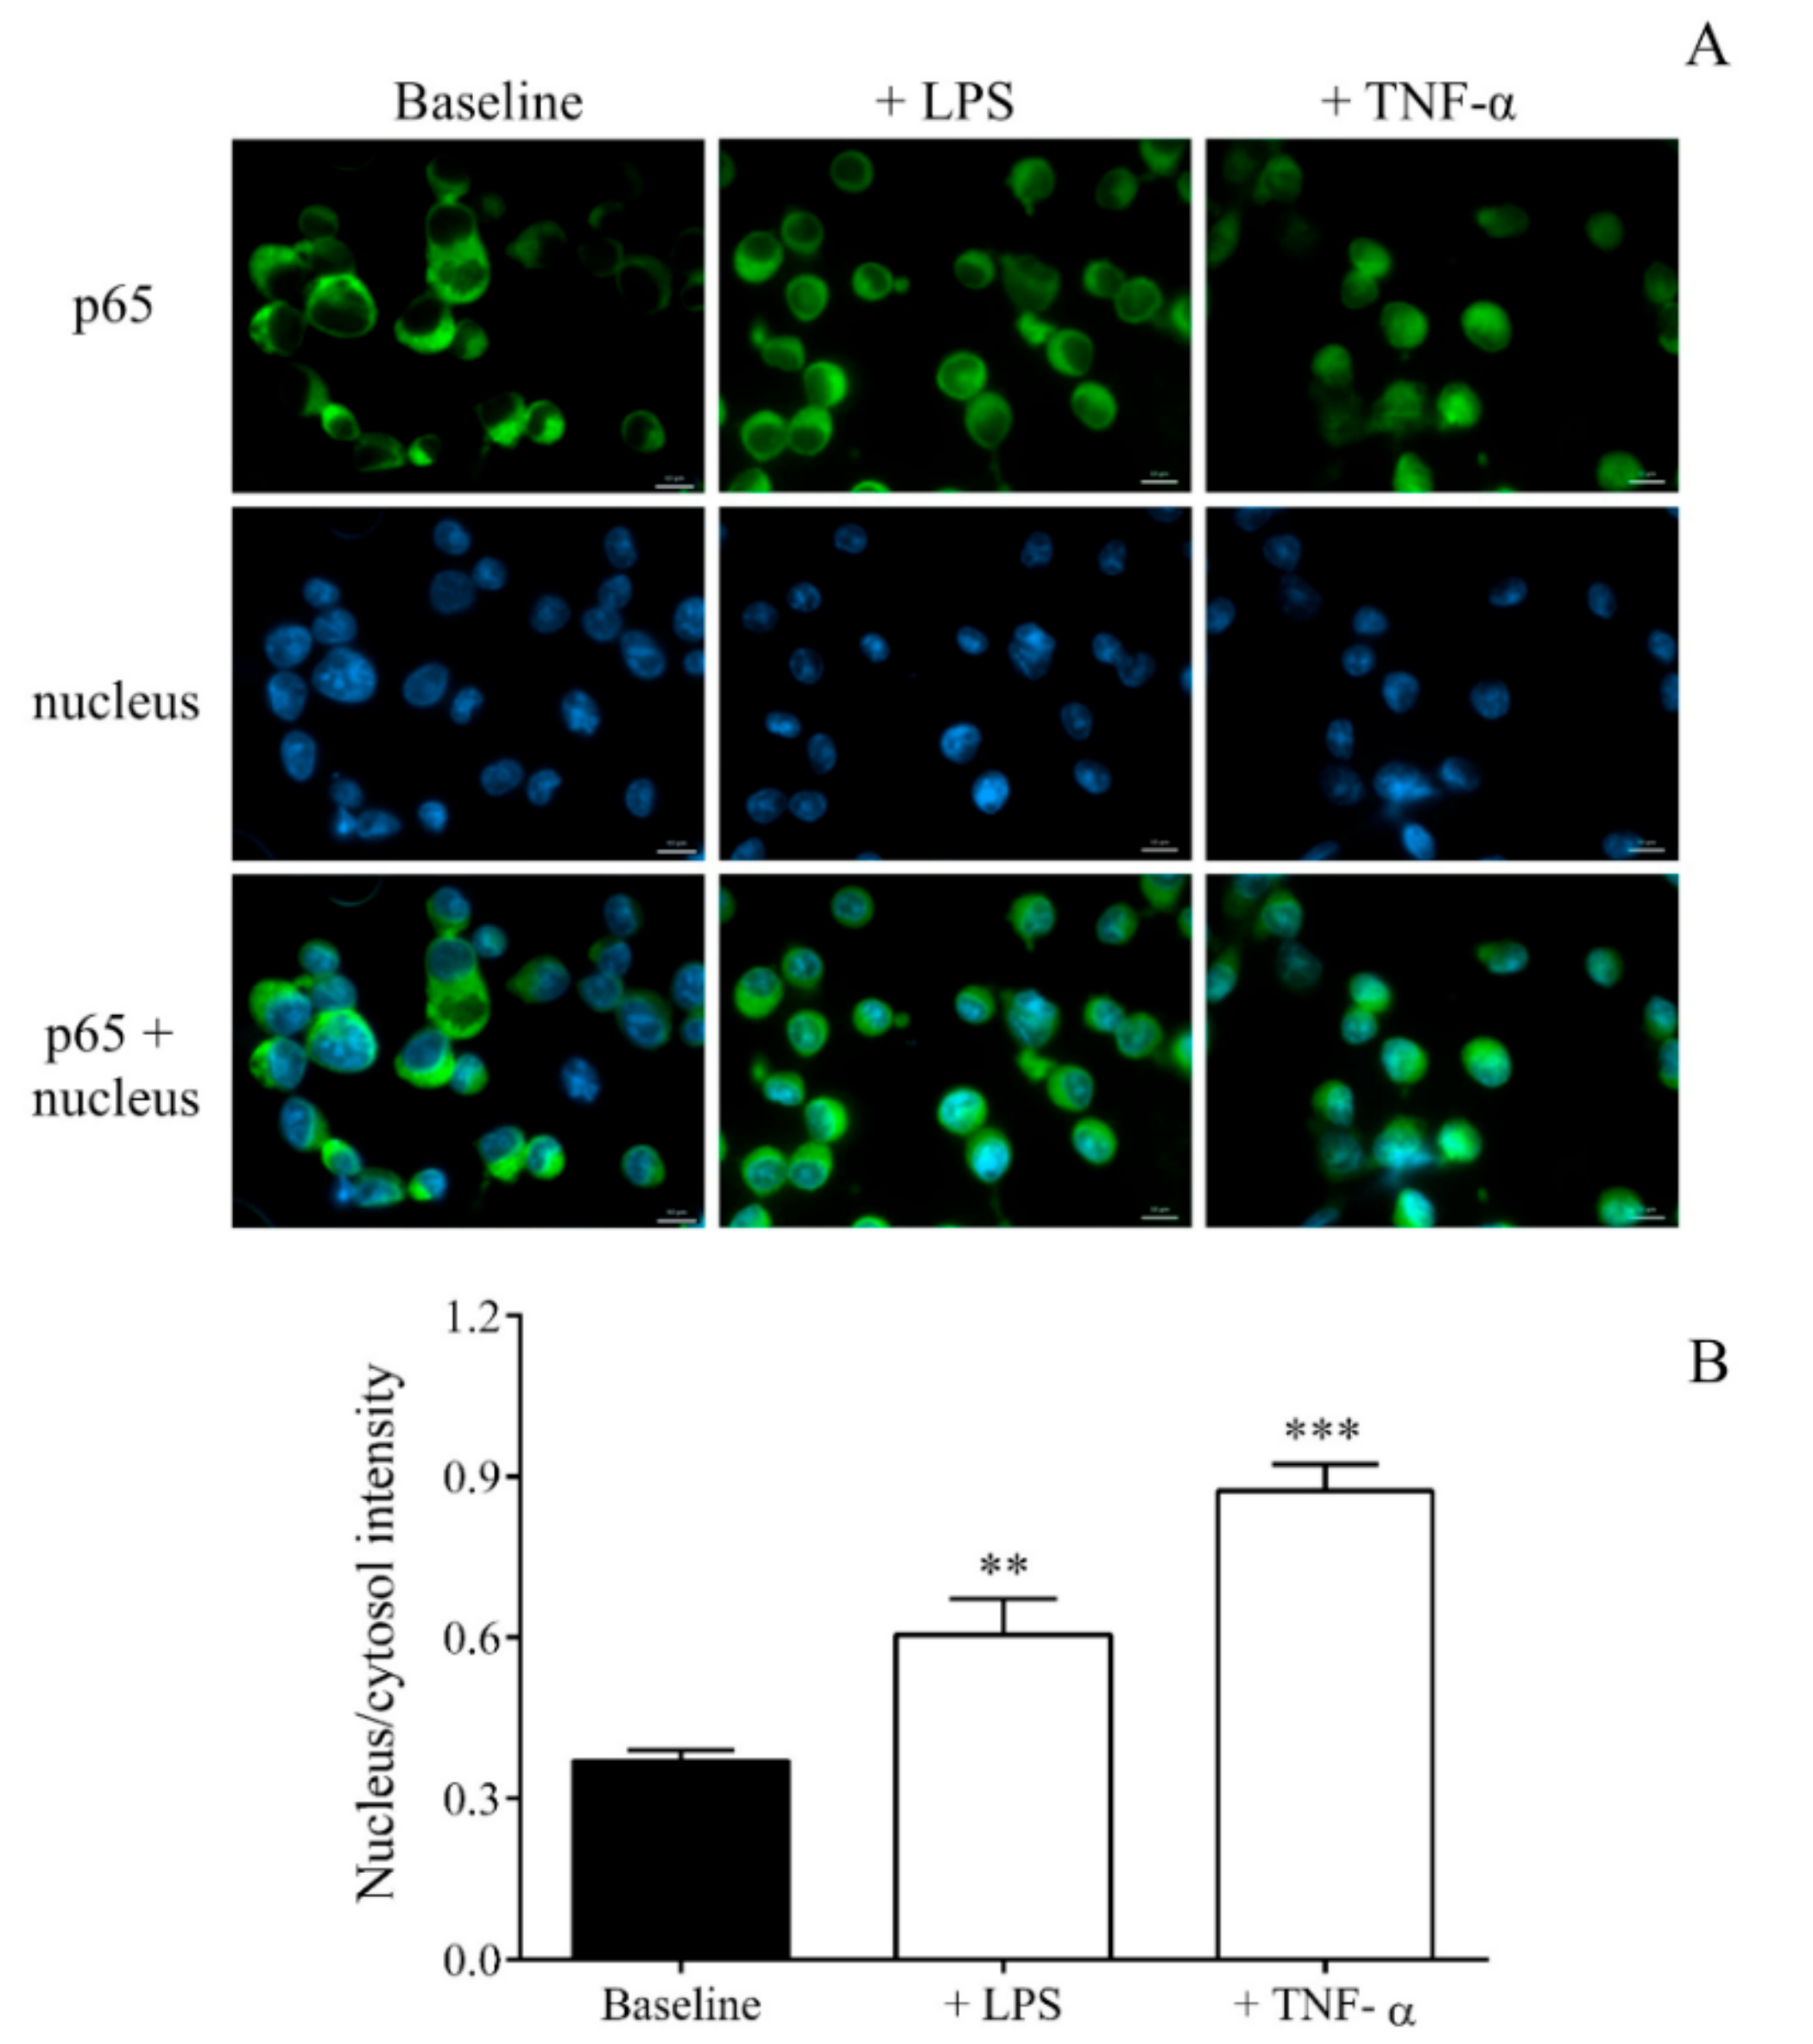
22]. For this purpose, we stimulated MEG-01 cell cultures with LPS for 4 h to analyze the transcriptome of MKs. LPS could induce the activation of the NF-κB pathway in MEG-01 cells, as earlier observed via TLR2 signaling [
14], that we visualized with the enhanced nuclear translocation of p65 by fluorescence microscopy. Using RNA-seq, 1060 significantly downregulated and 354 upregulated transcripts were detected in LPS-activated MKs. Based on this analysis,
SELP was identified among the top 25 most upregulated genes. We then validated the expression of
SELP in LPS-stimulated MEG-01 cells, showing a significant elevation. To compare our data with recently published results in sepsis [
22], the expression of
ITGA2B was also analyzed in our septic platelets and LPS-activated MK cell cultures by RT-qPCR, which were upregulated vs. controls (not shown). These results revealed that there must occur substantial alterations in the MK transcriptome after the onset of sepsis. Modulated RNA expression might result in transcriptional and translational events via the trafficking of RNA content through the MK-platelet axis that was found in the background of increased integrin subunit αIIb and granzyme B production in septic platelets [
22,
43].
In LPS-stimulated MEG-01 cell samples, miR-26b was downregulated, similar to ex vivo septic platelets. In type 2 diabetes mellitus, decreased platelet miR-26b has been associated with elevated
SELP expression, resulting in higher platelet reactivity [
26]. In contrast, after cardiopulmonary bypass, overexpression of platelet miR-10b and miR-96 decreases mRNAs of GPIb and VAMP8, as well as their protein levels, causing defected platelet function [
44]. The modulatory effect of miR-26b on
SELP expression was confirmed in MEG-01 cells under these inflammatory conditions using a specific miRNA mimic, suggesting that sepsis-reduced miR-26b caused increased
SELP expression in sepsis.
Abnormal Dicer1 activity has been found to be an important factor in dysregulated miRNAs that have been revealed in Dicer1-deficient murine platelets [
18] and in diabetic platelets, showing decreased Dicer function [
26,
45]. Dicer enzyme is a substrate of calpain 1 (μ-calpain) and calpain 2 (m-calpain), which can be found in platelets [
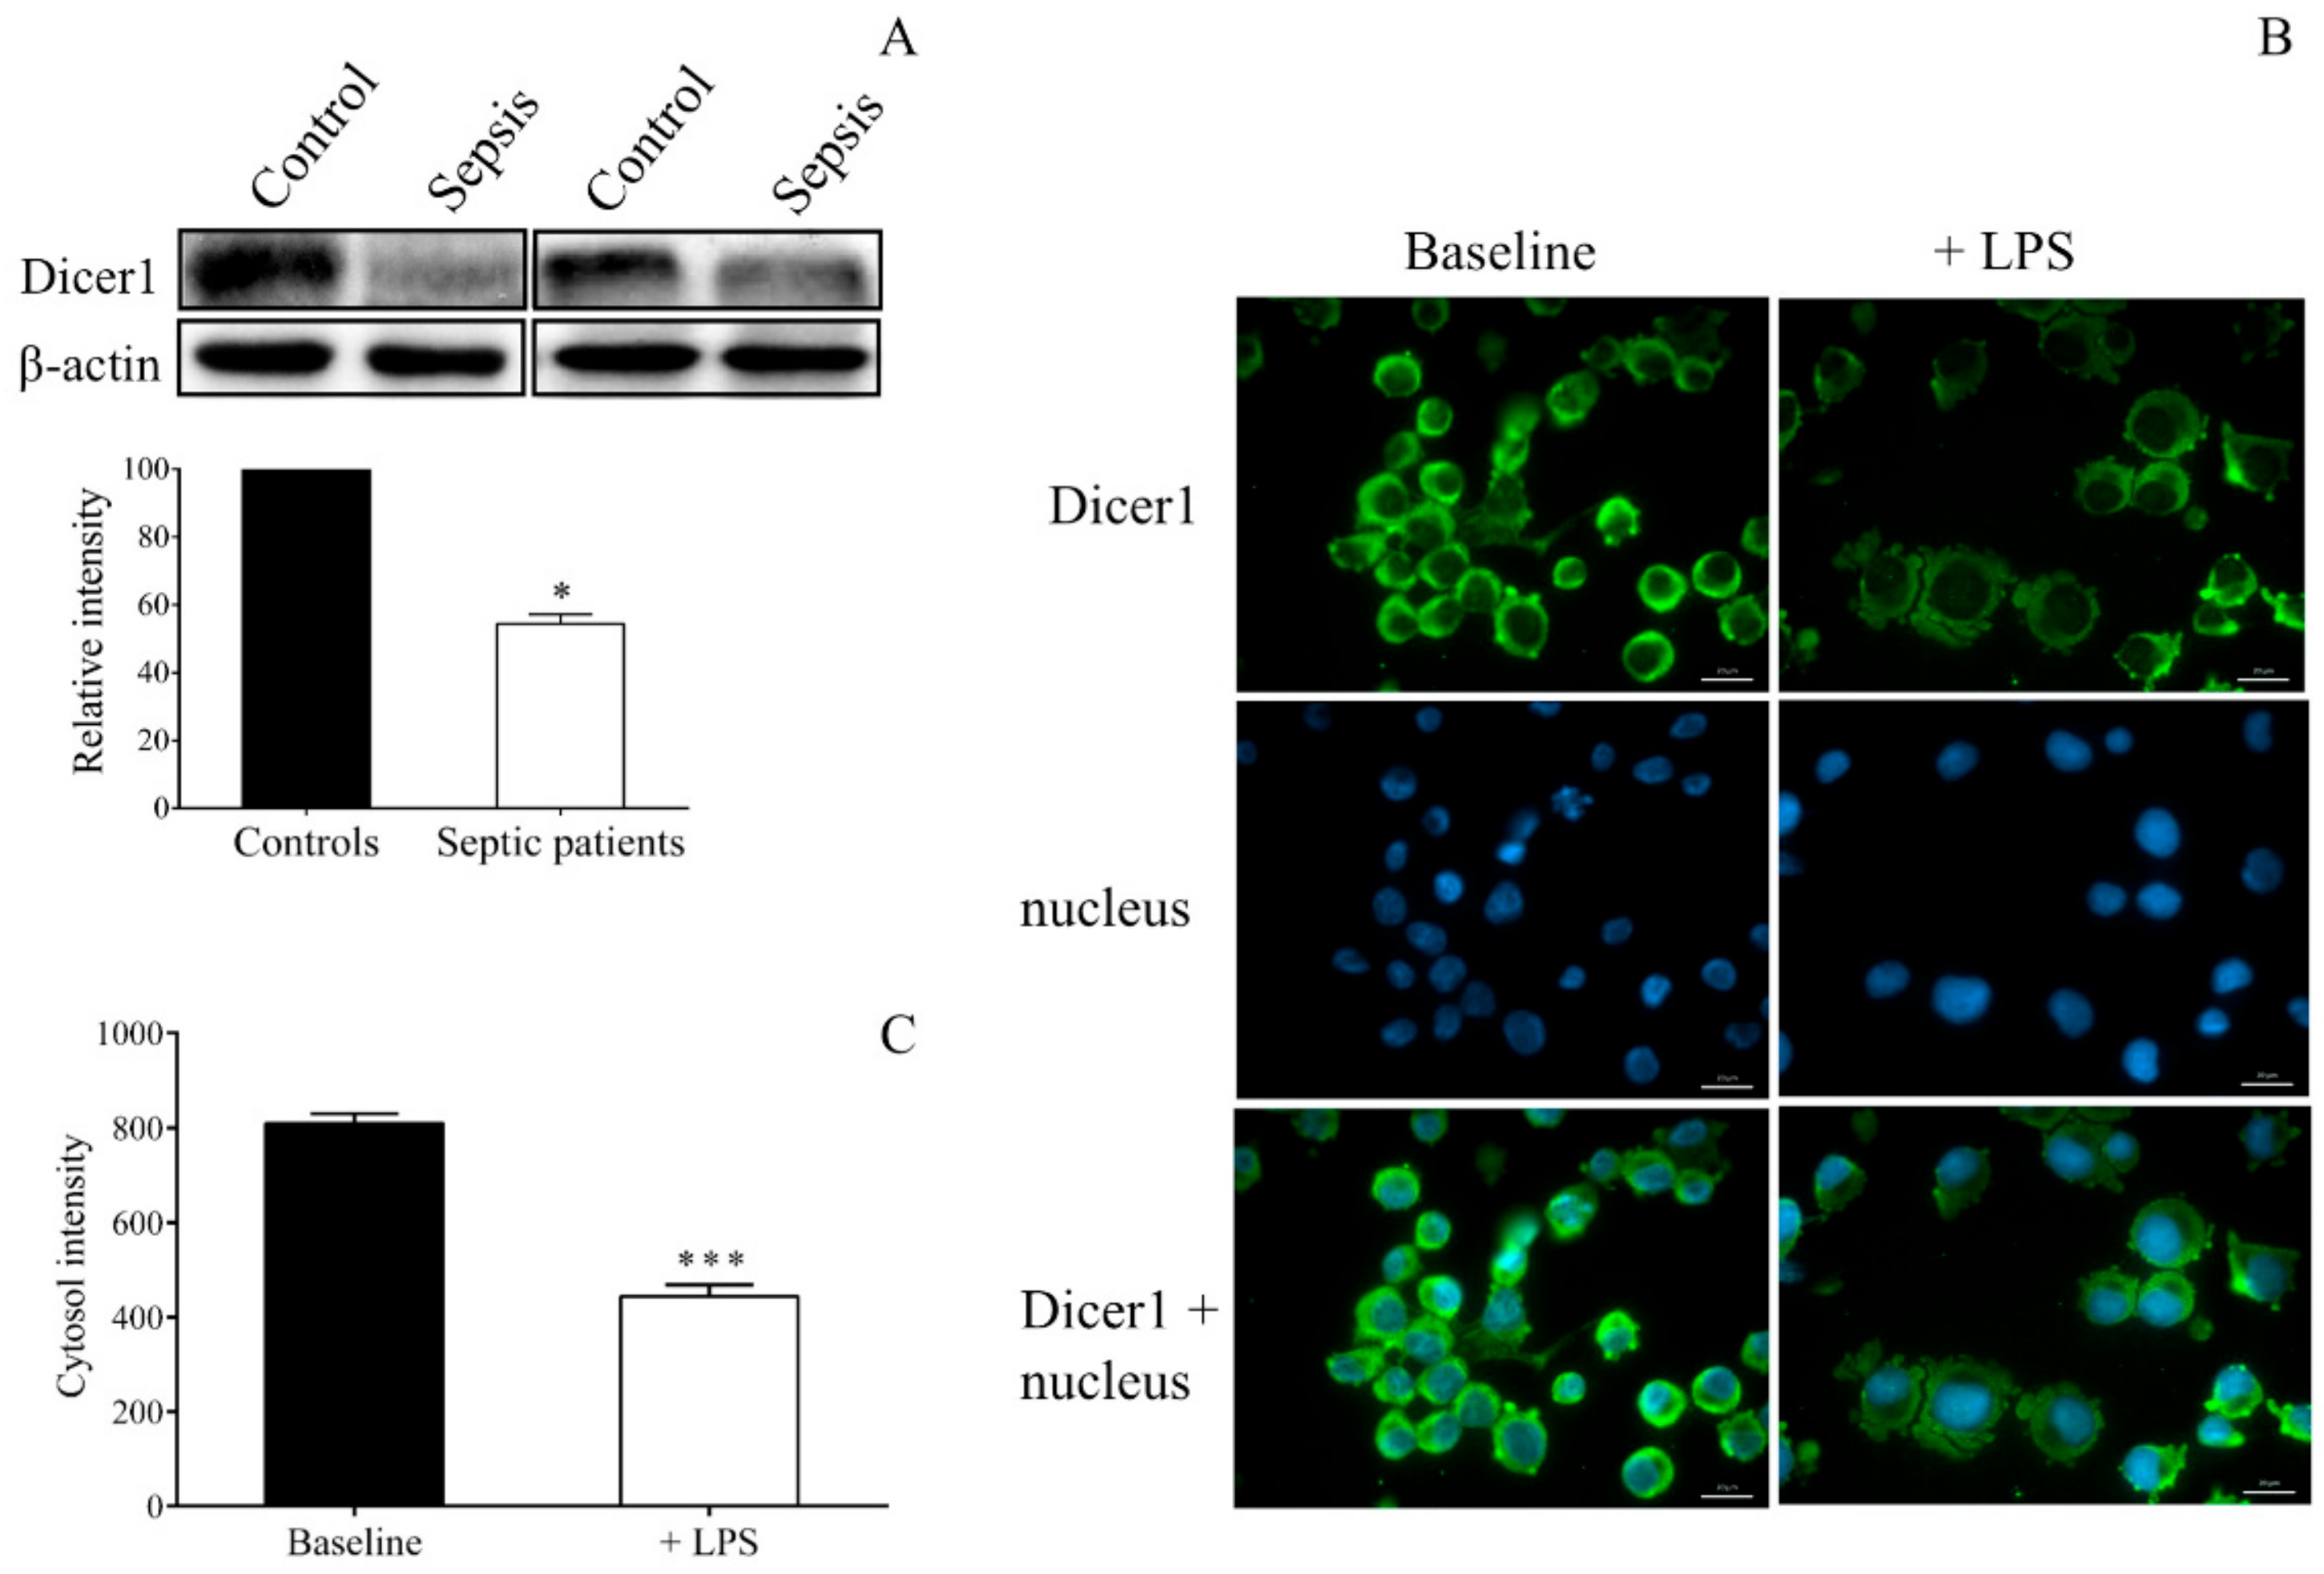
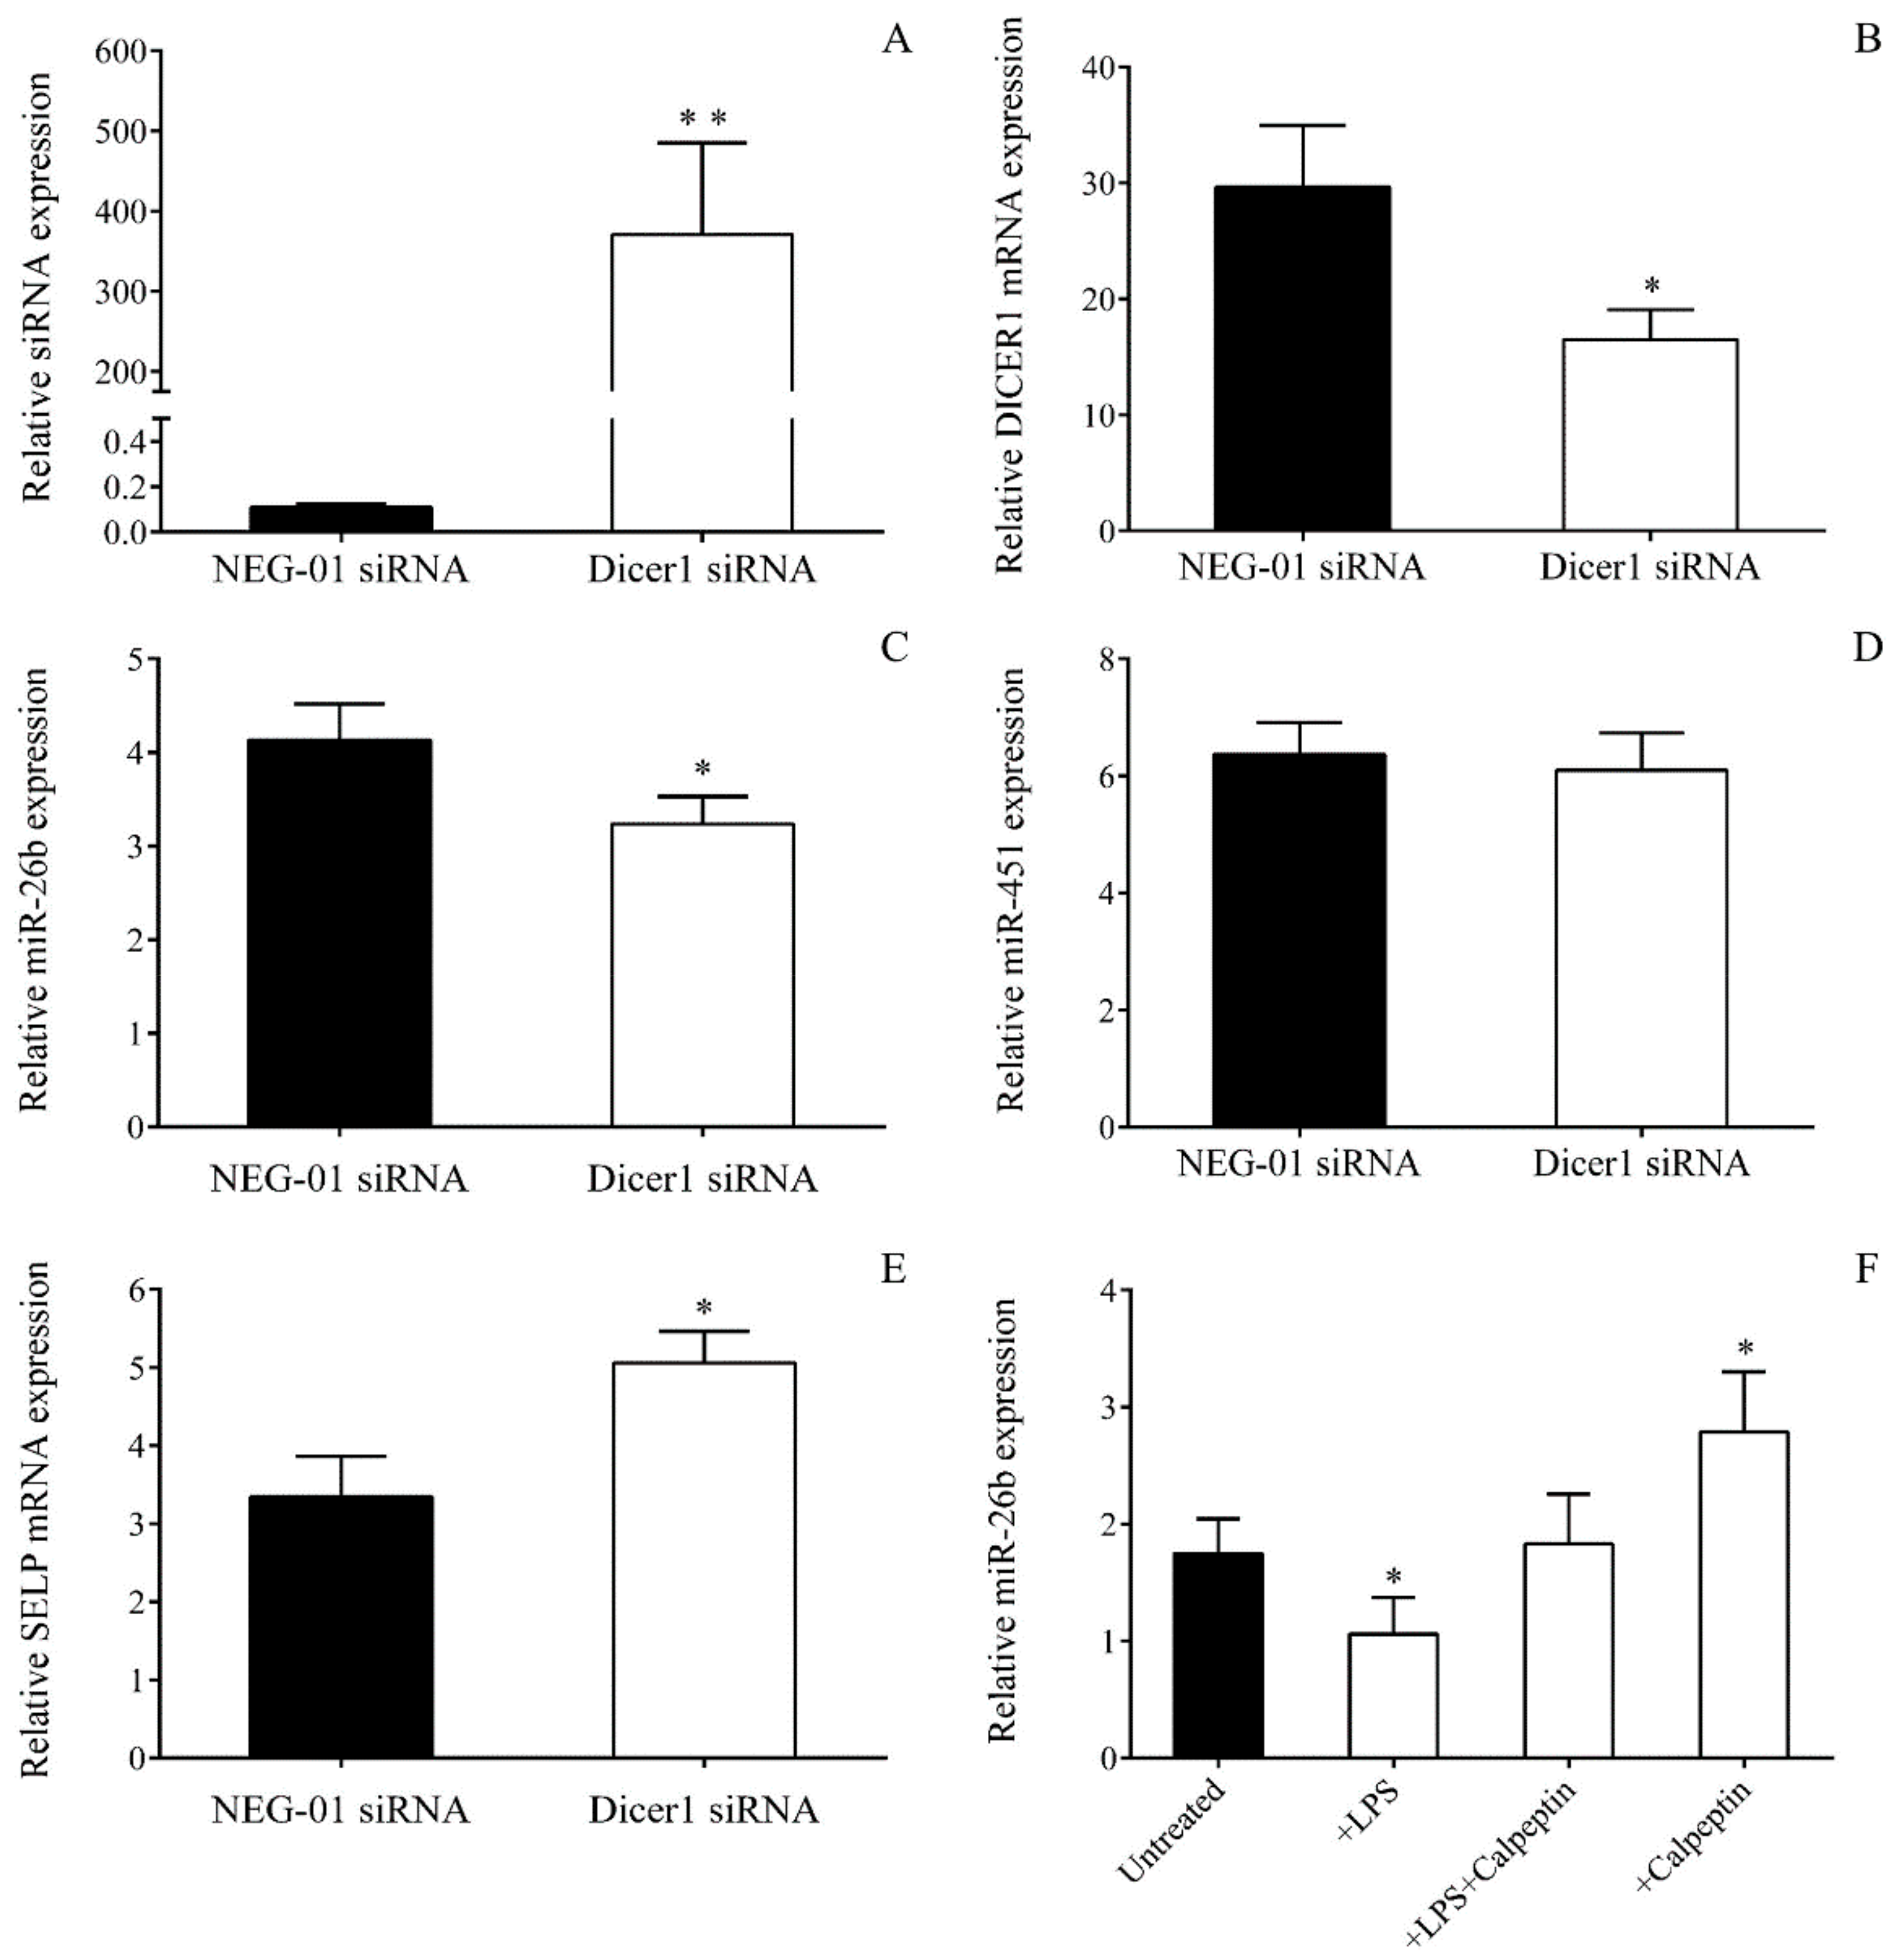
45]. In sepsis, there was no data about how the Dicer function modulates miRNA expression. We here observed decreased Dicer1 levels in platelet lysates of septic individuals. Similarly, LPS-stimulated MEG-01 cells showed decreased Dicer1 expression. Direct investigation of Dicer1 function with its gene silencing by siRNA and through specific inhibition of calpain 1 and calpain 2 with calpeptin to modulate miRNAs in MEG-01 cells revealed that abnormal Dicer1 activity was generated in sepsis that could reduce miR-26b and, in turn, to elevate
SELP expression in both platelets and MKs. Accordingly, elevated intracellular Ca
2+ concentration in response to LPS or TNF-α induces calpain function that cleaves the Dicer enzyme, causing less mature miRNAs [
28]. When the function of calpain 1 and 2 was blocked, and the cleavage of Dicer was prevented by calpeptin in the presence of any of these inflammatory mediators, mature miR-26b levels were restored in MEG-01 cells. Accordingly, changes in Dicer activity due to sepsis might occur in both platelets and MKs, shaping the profile of miRNAs. Based on these current results, we proposed a signaling axis in MKs and platelets upon sepsis when lower Dicer level resulted in decreased miR-26b with elevated target
SELP expression that could contribute to the elevated level of platelet activation status.
Finally, we extended our study with a GO analysis. Upregulated
SELP seemed to be involved in seven different pathways of MKs in TLR4 involvement, such as in the regulation of inflammatory response. High
SELP expression in peripheral blood cells has been investigated as a new risk factor in rheumatoid arthritis [
46], and some specific haplotypes of
SELP gene have been related to a higher risk for myocardial infarction [
47], but no former data of altered
SELP expression were available in regard to platelet/MK function in sepsis. According to these current data,
SELP might play a central role via inflammatory signaling of MKs by LPS apart from encoding a key cellular adhesion molecule P-selectin.
There were some limitations to this study. First, a limited number of septic patients could be involved in this study due to the strict criteria of enrollment. Second, we did not investigate the role of other LPS-independent mechanisms of altered platelet miRNA expression upon sepsis. Hence, further studies are required to examine the details of this complex mechanism.
In conclusion, septic platelets showed an altered miRNA profile with 182 abnormally expressed miRNAs via TLR4. Reduced platelet miR-26b correlated with sepsis severity and mortality; thus, it might become a useful biomarker for indicating elevated platelet activation status in this disease. Upregulated SELP expression in MKs through TLR4 resulted in enhanced P-selectin expression in platelets and might be also involved in shaping inflammatory responses of MKs.
4. Materials and Methods
4.1. Study Design, Participants, and Blood Sample Preparation
In this analyst-blinded, case-control study 21 patients with a primary diagnosis of sepsis (16 males, 5 females, aged 64 (51–70) years) were prospectively included into this study within 24 h of admission to the intensive care unit (ICU) of one of the three clinical departments (
Table 1). Sepsis was diagnosed based on the criteria of the American College of Chest Physicians/Society of Critical Care Medicine Consensus, which defined systemic infection and 2 of the following: (a) temperature >38 °C or <36 °C; (b) heart rate >90 beats/min; (c) respiratory rate >20 breaths/min or PaCO
2 <32 mm Hg; (d) WBC count >12,000/mm
3, <4000/mm
3, or >10% bands [
48]. The sequential organ failure assessment (SOFA) score was determined by the clinicians, and the administration of any antiplatelet agents was recorded in each case. Exclusion criteria for enrollment included malignancy, autoimmune disease, pregnancy, severe thrombocytopenia, and acute myocardial infarction or acute ischemic stroke within 1 month. All-cause 28-day mortality was recorded prospectively.
To investigate platelet miRNAs and mRNA levels in sepsis, venous blood samples were obtained from patients by atraumatic venipuncture into Vacutainer® tubes containing 0.105 M sodium citrate (Becton Dickinson, San Jose, CA, USA). Samples were prepared within 60 min after sampling and were centrifuged at 170 × g for 15 min at room temperature (RT) to obtain platelet-rich plasma (PRP). The upper layer of PRP was carefully transferred to a plastic tube to avoid any leukocyte contamination. In the case of 7 septic patients, follow-up samples were also obtained after 72 h of sepsis onset.
In parallel, 21 age- and gender-matched controls (14 males, 7 females, aged 58 (42–65) years) were enrolled among volunteers or staff members from the Departments of Laboratory Medicine and Internal Medicine who underwent a detailed medical history, physical examination, and routine laboratory tests and were free of acute cardiovascular, metabolic, inflammatory diseases, or cancer (
Table 1). All participants gave written informed consent. The study was approved by the Ethics Committee of the University of Debrecen (permit number: 4780-2017) in accordance with the Declaration of Helsinki.
4.2. Leukocyte-Depleted Platelet Preparation
Leukocyte-depleted platelet samples (LDP) were purified by anti-CD45-conjugated magnetic microbeads (Dynabeads
®, Invitrogen, Oslo, Norway) within 30 min of blood sampling, as we previously described from our laboratory [
26]. Briefly, after the incubation of 2 mL PRP with the beads for 30 min at RT, samples were inserted into a magnetic separator (Becton Dickinson, San Jose, CA, USA) for 2 × 2 min, and LDP was then transferred into a fresh tube for additional centrifugation (1500×
g, 15 min, RT). Platelet pellet was lysed with 750 μL TRI reagent (Molecular Research Center Inc, Cincinnati, OH, USA) and stored at −20 °C before RNA isolation.
4.3. Total RNA Extraction
Total RNA from LDP and MK cell culture samples was isolated by TRI reagent according to the manufacturer’s recommendations. The purity and the concentration of separated RNA samples were verified by a NanoDrop 2000 spectrophotometer (Thermo Scientific, Wilmington, DE, USA). Total RNA samples were stored at −80 °C.
4.4. TaqMan Open Array-Based miRNA Profiling in Septic Platelets
First, we randomly selected 3 total RNA samples from the septic and control groups, and we analyzed 754 types of miRNA using a TaqMan Open Array technology (Applied Biosystems, Foster City, CA, USA) following the manufacturer’s protocol. Briefly, 100 ng of total RNA was used for reverse transcription with TaqMan MicroRNA Reverse Transcription Kit (Applied Biosystems, Foster City, CA, USA) and Megaplex RT Primers Human Pool Set v3.0 (Applied Biosystems, Foster City, CA, USA). The reactions were performed for 40 cycles of 16 °C for 2 min, 42 °C for 1 min, 50 °C for 1 s, and 1 cycle of 85 °C for 5 min. Then, specific complementary DNA (cDNA) samples were pre-amplified with Megaplex PreAmp Primers Human Pool Set v3.0, as well as TaqMan PreAmp Master Mix (Applied Biosystems, Foster City, CA, USA), to increase the quantity of the desired cDNA. PCR reactions were run at the following conditions: 95 °C for 10 min, 55 °C for 2 min, 72 °C for 2 min, and 12 cycles of 95 °C for 15 s and 60 °C for 4 min. Diluted pre-amplification products (1:40) and PCR reaction mix containing TaqMan Open Array Real-Time PCR Master Mix (Applied Biosystems, Foster City, CA, USA) were transferred into a 384-well plate, and the Open Array AccuFill system loaded the samples to the prepared TaqMan Open Array Human MicroRNA panels (Applied Biosystems, Foster City, CA, USA). Finally, plates were run on a QuantStudio 12 K Flex qPCR instrument (Applied Biosystems, Foster City, CA, USA). For data normalization, the RNU-48 control assay was used in this experiment. Data were analyzed with Thermo Fisher Cloud System (Thermo Fischer Scientific, Waltham, MA USA) and Expression Suite Software v1.0.3 (Applied Biosystems, Foster City, CA, USA).
4.5. miRNA Specific Stem-Loop RT-qPCR Analysis
The expression of selected platelet miRNAs in the entire study groups was validated by miRNA specific Universal ProbeLibrary (UPL)-probe based stem-loop RT-qPCR method [
26]. Briefly, this quantification technique included two steps: (1) miRNAs (input total RNA: 10 ng) were transcribed into cDNA via reverse transcription using miRNA-specific stem loop-RT primer (500 nM, Integrated DNA Technologies, Leuven, Belgium) and TaqMan
® MicroRNA Reverse Transcription Kit (Applied Biosystems, Foster City, CA, USA) and (2) miRNA quantification was performed by RT-qPCR using designed universal reverse primer (100 μM, Sigma-Aldrich, St. Louis, MO, USA), miRNA-specific forward primer (100 μM, Integrated DNA Technologies, Leuven, Belgium), and UPL probe #21 (10 μM, Roche Diagnostics, Mannheim, Germany) with Taq polymerase (5 U/μL, Thermo Scientific, Wilmington, DE, USA) and dNTPs (2.5 mM, Thermo Scientific). The reactions were pre-incubated at 95 °C for 1 min, followed by 40 cycles of 95 °C for 15 s and 60 °C for 30 s. All the measurements were conducted in triplicate on a QuantStudio 12 K Flex qPCR instrument (Applied Biosystems, Foster City, CA, USA). For normalization, the small-nucleolar RNU-43 was measured as a reference gene, similarly used in our former study [
26]. Primers and qPCR assays were designed by the software developed by Czimmerer et al. [
49], and oligonucleotides that were used in this study are listed in
Supplementary Table S3.
4.6. mRNA Specific RT-qPCR Analysis
Complementary DNA (cDNA) synthesis was performed with a High Capacity cDNA Reverse Transcription kit (Applied Biosystems, Foster City, CA, USA) according to the manufacturer’s recommendation. The initial amount of RNA in LDP was 200 ng per reaction, while 1000 ng per reaction was used in the MK experiments. Quantitative PCR was performed on a QuantStudio 12 K Flex qPCR instrument (Applied Biosystems, Foster City, CA, USA) with Light Cycler 480 SYBR Green I Master mix (Roche Diagnostics, Mannheim, Germany) and gene-specific primers (10 μM, Integrated DNA Technologies, Leuven, Belgium). The reactions were incubated at 95 °C for 10 min, followed by 40 cycles of 95 °C for 10 sec and 60 °C for 1 min. For normalization, we used the reference gene RPLP0 (36B4). Sequences of the primers for mRNAs are also listed in
Supplementary Table S3.
4.7. In Vitro Activation of Normal Human Platelets by LPS
LDP samples prepared from specimens of 5 healthy volunteers were treated with vehicle (PBS) or LPS (O55:B5, 100 ng/mL, Sigma-Aldrich, St. Louis, MO, USA) in the presence of lipoprotein binding protein (LBP, 100 ng/mL, Sigma-Aldrich, St. Louis, MO, USA) and soluble CD14 (150 ng/mL, Sigma-Aldrich, St. Louis, MO, USA) at 37 °C for 4 h, as formerly described by others [
20]. For positive control, tumor necrosis factor-α (TNF-α) (100 ng/mL, Gibco, Grand Island, NY, USA) was used as a key pro-inflammatory mediator expressed upon TLR4 activation. Platelets were then centrifuged (1500 g, 15 min, RT), and platelet pellet was lysed with 750 μL TRI reagent and stored at −20 °C before RNA isolation. To evidence the activation of the TLR4 pathway in platelets by LPS,
IL1B mRNA level was quantified in parallel to
SELP expression by RT-qPCR.
4.8. Culturing of MEG-01 Cells Mimicking Septic Conditions
Human megakaryoblastic leukemia cell line MEG-01 cells (Sigma-Aldrich, St. Louis, MO, USA) were cultured in RPMI-1640 medium (Sigma-Aldrich, St. Louis, MO, USA) with 10% fetal bovine serum (FBS, Sigma-Aldrich, St. Louis, MO, USA), 100 U/mL Penicillin, and 100 μg/mL Streptomycin (Sigma-Aldrich, St. Louis, MO, USA) at 37 °C, 5% CO
2. The cell count was set to 0.3 × 10
6/mL, similar to our recent study [
26]. MKs were stimulated with LPS (O55:B5, 100 ng/mL, Sigma-Aldrich, St. Louis, MO, USA) in the presence of LBP (100 ng/mL, Sigma-Aldrich, St. Louis, MO, USA) and soluble CD14 (150 ng/mL, Sigma-Aldrich, St. Louis, MO, USA) for 4–24 h to maintain them under in vitro ‘septic’ conditions as applied for the analysis of sepsis-induced platelet activation [
20]. In positive control samples, MEG-01 cells were treated with TNF-α (100 ng/mL, Gibco, Grand Island, NY, USA), while negative control samples were cultured with vehicle (PBS). After treatment, cells were washed once with sterile PBS, then lysed in 750 μL TRI reagent, and stored at −20 °C before RNA isolation. To demonstrate the inflammation specific activation of MEG-01 cells via the NF-κB pathway,
IL1B expression was analyzed by RT-qPCR.
4.9. RNA-Sequencing
To obtain global transcriptome data of LPS-stimulated MKs, high throughput mRNA sequencing analysis was performed on Illumina Sequencing Platform (Illumina, San Diego, CA, USA). For this purpose, 3 sets of MEG-01 cells (0.3 × 10⁶ cell/mL) were cultured in the presence of LPS or vehicle for 4 h, as described above. Total RNA was extracted and quantified, and RNA sample quality was checked on Agilent BioAnalyzer using Eukaryotic Total RNA Nano Kit (Agilent Technologies, Santa Clara, CA, USA) according to the manufacturer’s protocol. Samples with RNA integrity number (RIN) value > 7 were accepted for the library preparation process.
RNA-Seq libraries were prepared from total RNA (200 ng) using NEBNext® Ultra II RNA Sample Preparation Kit for Illumina (New England BioLabs, Ipswich, MA, USA) according to the manufacturer’s protocol. Briefly, poly-A tailed RNAs were purified by oligodT-conjugated magnetic beads and fragmented at 94 °C for 15 min. First-strand cDNA was generated by random priming reverse transcription, and the second strand synthesis step was performed to generate double-stranded cDNA. After the repairing ends and adapter ligation steps, adapter-ligated fragments were amplified in enrichment PCR, and, finally, sequencing libraries were generated. The sequencing run was executed on Illumina NextSeq500 instrument (Illumina) using single-end 75 cycles sequencing. Aligned sequencing data were deposited into the NCBI SRA database under accession no. PRJNA587604.
4.10. Analysis of RNA-Seq Data
Raw sequencing data (fastq) was aligned to the human reference genome version GRCh37 using the HISAT2 algorithm, and BAM files were generated. Downstream analysis was performed using StrandNGS software (
www.strand-ngs.com). BAM files were imported into the software, and the DESeq1 algorithm was used for normalization. To identify differentially expressed genes between untreated and LPS-stimulated conditions, ANOVA with Tukey
post hoc test was used. Heatmaps and dot plots were drawn using R packages
pheatmap and
ggplot2.
4.11. Gene Ontology Analysis
Lists of differentially expressed genes were analyzed using the Panther tool (
http://www.geneontology.org/) and the GO enrichment analysis function to create a GO. GOs with fold enrichment ≥ 2 and
p-value < 0.05 were selected, and results were presented according to their -log
10 p-value. The bar graph was drawn using the R package
ggplot2. 4.12. Transfection of MEG-01 Cells with miR-26b Mimic
MEG-01 cells pretreated with LPS or TNF-α (100 ng/mL) for 4 h were centrifuged and resuspended in Opti-MEM I Reduced Serum Medium (Gibco, Grand Island, NY, USA) with 3% FBS, 100 U/mL Penicillin, and 100 μg/mL Streptomycin. The overexpression of miRNAs was performed using mirVana® miR-26b mimic (40 pmol, Ambion, Austin, TX, USA) with Lipofectamine RNAiMAX® Transfection Reagent (Invitrogen, Carlsbad, CA, USA) for 24 h at 37 °C and 5% CO2. In parallel, the negative control sample was treated with mirVana® miRNA mimic negative control (NEG-01, 40 pmol, Ambion, Austin, TX, USA). After transfection, total RNA was extracted, miR-26b expression was quantified with SELP mRNA, as described above.
4.13. Western Blot
Isolated platelets obtained from septic and control individuals were lysed in RIPA buffer containing a protease inhibitor mix (Sigma-Aldrich, St. Louis, MO, USA). Proteins were separated by electrophoresis using 7.5% polyacrylamide gel and then transferred onto a nitrocellulose membrane (Bio-Rad, Hercules, CA, USA). After blocking with Tris-buffered saline/Tween (TBST; 20 mM Tris, 140 mM NaCl, 0.1% (vol/vol) Tween 20) containing 5% bovine serum albumin (BSA, Sigma-Aldrich, St. Louis, MO, USA) for 90 min at RT, membranes were incubated with monoclonal mouse anti-human Dicer1 (ab14601, 1:100, Abcam, Cambridge, UK) or monoclonal mouse anti-human P-selectin (sc-19672, 1:100, Santa Cruz Biotechnology, Dallas, TX, USA) antibody in TBST with 5% BSA at 4 °C for overnight with gentle agitation, respectively. Anti-β-actin antibody (ab8227, 1:1000, Abcam, Cambridge, UK) was used to ensure equal protein concentrations in all lanes. Membranes were labeled with HRP-conjugated goat anti-mouse secondary antibody (1:100,000, Bio-Rad, Hercules, CA, USA) for 1 h at RT, and immunoreactivity was visualized by Immobilon Western Chemiluminescent HRP Substrate (Millipore, Billerica, MA, USA). The relative intensity of P-selectin or Dicer1 bands was determined in both septic and control samples by normalization to β-actin.
4.14. Flow Cytometry
Investigation of platelet activation level via surface P-selectin expression on platelets was performed, as previously reported [
26]. Briefly, 40 μL of whole blood samples were fixed in 1 mL 1% PFA and kept at RT for 1 h. Platelets were identified by a FITC-conjugated monoclonal antibody to GPIX (CD42a-FITC, Becton Dickinson, San Jose, CA, USA). Platelet activation was detected by phycoerythrin (PE)-labeled anti-P-selectin (CD62-PE, Becton Dickinson, San Jose, CA, USA). Fixed platelets were incubated with saturating concentrations of antibodies for 20 min in the dark at RT. As a control for immunolabeling with anti-CD62 antibody, platelets were incubated with PE-coupled non-immune mouse IgG
1 antibody (Becton Dickinson, San Jose, CA, USA). A total of 10,000 dual-color labeled platelet events were acquired on an FC-500 flow cytometer (Beckman Coulter, Pasadena, CA, USA). Results were expressed as the percentage of double-positive platelets.
4.15. Fluorescence Microscopy
Detection of NF-κB activation in MEG-01 cells was visualized via p65 nuclear staining based on our previous study [
50] with some minor modifications. MEG-01 cells were cultured on 6-well plates for 2 days, were then treated with LPS or vehicle (PBS) for 4 h, and were fixed with ice-cold methanol-acetone (50
v/
v%) for 10 min. These cells were transferred onto sterile uncoated microscope slides at a density of 5 × 10
4 cells/slide. Non-specific antibody binding sites were blocked with FBS (Sigma-Aldrich, St. Louis, MO, USA) for 15 min. For primary labeling of NF-κB p65 subunit, polyclonal rabbit anti-human p65 antibody (100 μg/mL, Sigma-Aldrich, St. Louis, MO, USA) was used for 1 h followed by secondary staining with Alexa Fluor 488-conjugated goat-anti-rabbit IgG (5 µg/mL, Sigma-Aldrich, St. Louis, MO, USA) for 1 h.
The protein level of Dicer1 in MEG-01 cells was also studied by fluorescence microscopy. MEG-01 cells were treated with LPS or PBS for 24 h, and fixed cells were stained by mouse anti-human Dicer1 antibody (2 µg/mL, Abcam, Cambridge, UK) followed by secondary staining with Alexa Fluor 488-conjugated goat anti-mouse IgG (5 µg/mL, Invitrogen, Carlsbad, CA, USA).
During both analyses, cell nuclei were labeled with Hoechst 33,342 (Invitrogen, Carlsbad, CA, USA), and samples were observed by Zeiss Axio Scope.A1 fluorescent microscope (HBO 100 lamp) (Carl Zeiss Microimaging GmbH, Goettingen, Germany). DAPI: excitation 365 nm, emission BP 445/50 nm; fluorescein: excitation BP 470/40 nm, emission BP525/50 nm. Images were analyzed with ZEN 2012 v.1.1.0.0. software (Carl Zeiss Microscopy GmbH, Goettingen, Germany). The ratio of nuclear and perinuclear fluorescence intensity was calculated for NF-κB p65 staining, while fluorescence intensity in the cytoplasm was determined for Dicer1 positivity. The specificity of immunostaining was checked by incubating the cells with the secondary antibody only, and no background staining was found.
4.16. Downregulation of DICER1 Expression by siRNA Transfection in MEG-01 Cells
To investigate whether abnormal Dicer1 function could markedly affect miR-26b levels of MKs in sepsis, DICER1 expression was first silenced by specific siRNA (40–80 pmoL, ID: S23756, Invitrogen, Carlsbad, CA, USA) in MEG-01 cells (0.3 × 10⁶/mL) for 24–48 h in comparison to control samples with NEG-01 siRNA (Silencer Select Negative control No.1, Invitrogen, Carlsbad, CA, USA) according to the manufacturer’s recommendations. Total RNA was then isolated, and the efficacy of transfection was monitored via the quantification of the Dicer1 siRNA level by TaqMan siRNA assay (ID: S23756_asy, Invitrogen, Carlsbad, CA, USA). Expressions of miR-26b with Dicer-independent miR-451 and DICER1 with SELP mRNAs were subsequently measured by RT-qPCR after transfection.
4.17. Analysis of Dicer Function on miRNA Level Through Calpain Inhibition in MEG-01 Cells Among Inflammatory Conditions
To examine the contribution of calpain substrate Dicer enzyme in the generation of altered miRNA levels in sepsis, we applied a MK model for sepsis-induced Dicer dysfunction in which 0.3 × 10
6/mL MEG-01 cells were treated by a specific exogenous calpain 1 and 2 inhibitor, calpeptin (40 μmol/L, Sigma-Aldrich, St. Louis, MO, USA) for 24 h in a similar way as it was performed previously [
21,
40]. The effect of calpeptin on miRNA expression was assessed in the following settings: vehicle (DMSO); LPS or TNF-α; LPS or TNF-α, together with calpeptin; calpeptin alone as a positive control. After treatment, total RNA was extracted, and miR-26b levels were measured by RT-qPCR, as described above.
4.18. Other Laboratory Assays
White blood cell (WBC) count and platelet count with MPV were determined by Advia 2120 Hematology System (Bayer Diagnostics, Tarrytown, NJ, USA). Serum C-reactive protein (CRP) and procalcitonin (PCT) levels were measured by electro-chemiluminescent immunoassay using a Cobas 8000 analyzer (Roche Diagnostics, Mannheim, Germany). Soluble P-selectin concentrations were determined in 10 randomly selected plasma samples from each study cohort by commercially available ELISA kit (R&D Systems, Minneapolis, MN, USA) according to the manufacturer’s instructions. Before performing this analysis, samples were thawed and then centrifuged at 10,000 g for 1 min.
4.19. Data Presentation and Statistical Analyses
Data were expressed in the median with (IQR, interquartile range), or mean ± standard deviation (SD), or standard error of the mean (SEM), as appropriate. A comparison of multiple groups was performed using ANOVA or Kruskal–Wallis with post hoc test, while t-test or Mann–Whitney U test and Chi-squared test were performed to compare two groups of data. The Kolmogorov–Smirnov test was used for the evaluation of the normality of the data. p < 0.05 probability level was regarded as statistically significant. Analyses were performed using GraphPad Prism, version 6.01 (GraphPad Software, La Jolla, CA, USA).

 ,
, 


