Bringing New Methods to the Seed Proteomics Platform: Challenges and Perspectives

 ,
,  , , , ,
  , and
, and 
Abstract
1. Introduction
2. Seed Proteomics: General Methodology and Applications
3. Gel-Based Bottom-Up Proteomics
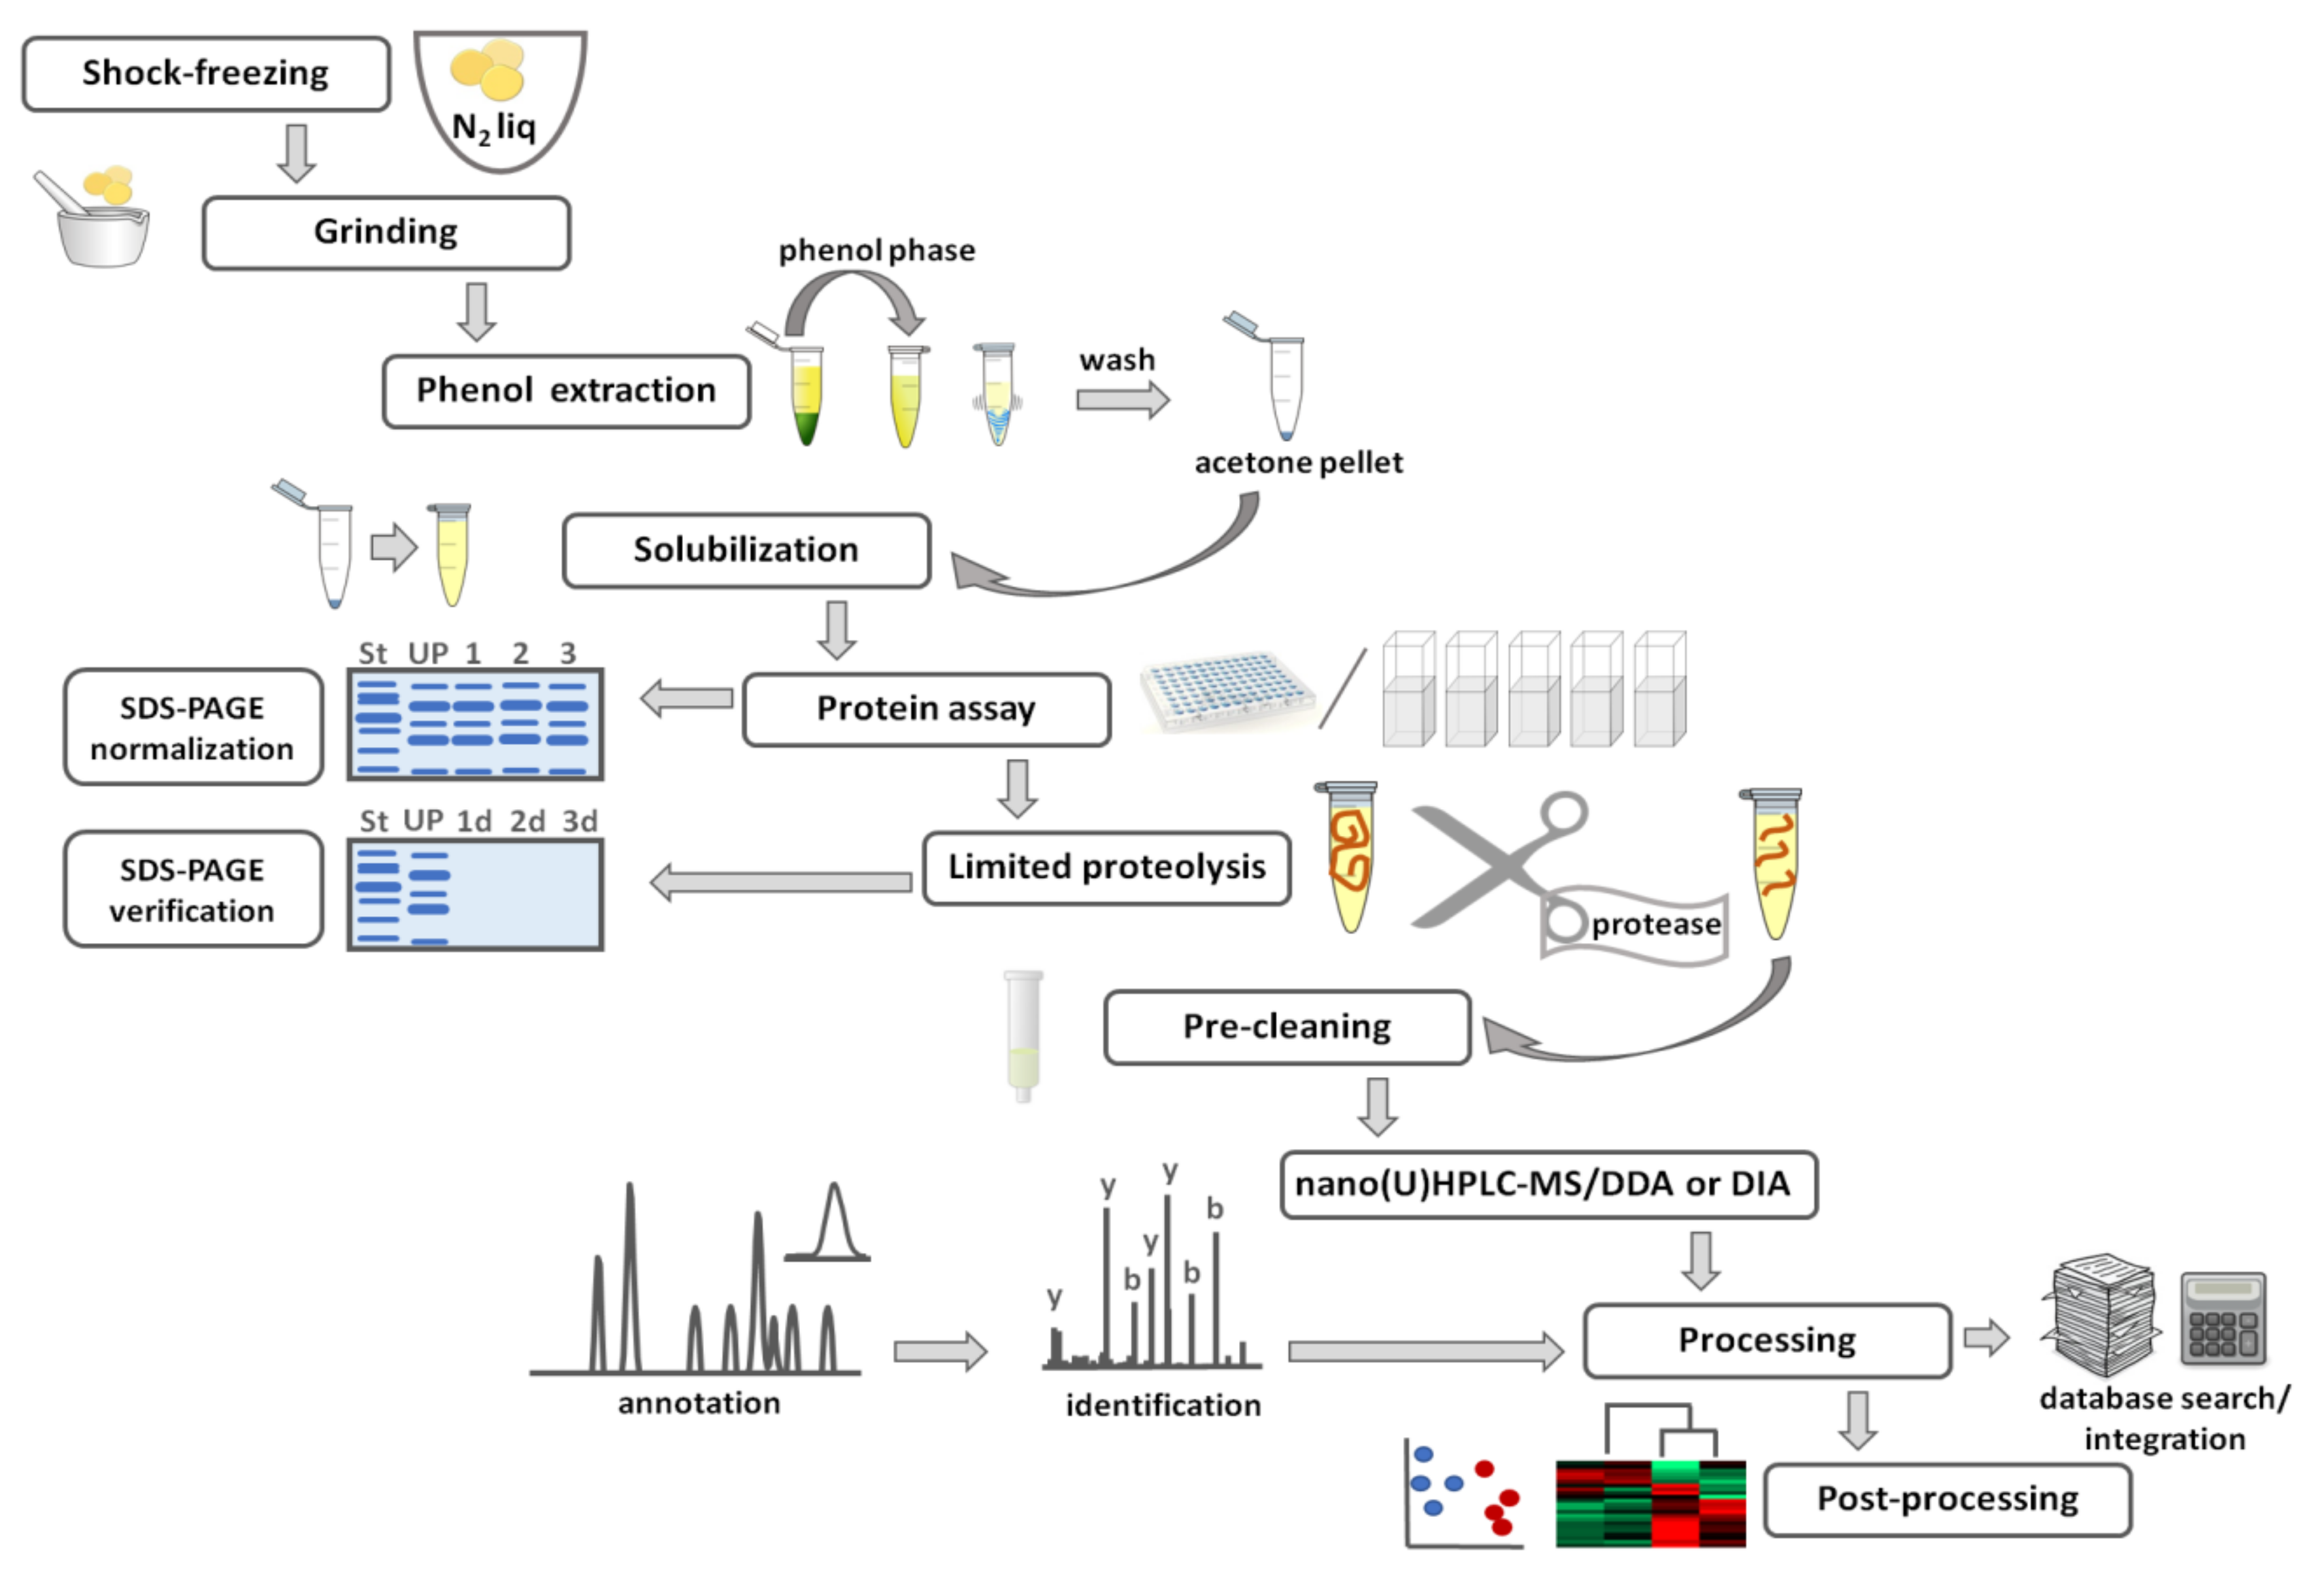
3.1. Sample Preparation for Gel-Based Proteomics
3.2. Visualization of Electrophoretic Zones in Gel-Based Proteomics
3.3. Identification of Individual Proteins by Mass Spectrometry
4. Gel-Free Bottom-Up Proteomics
5. Post-Translational Modifications
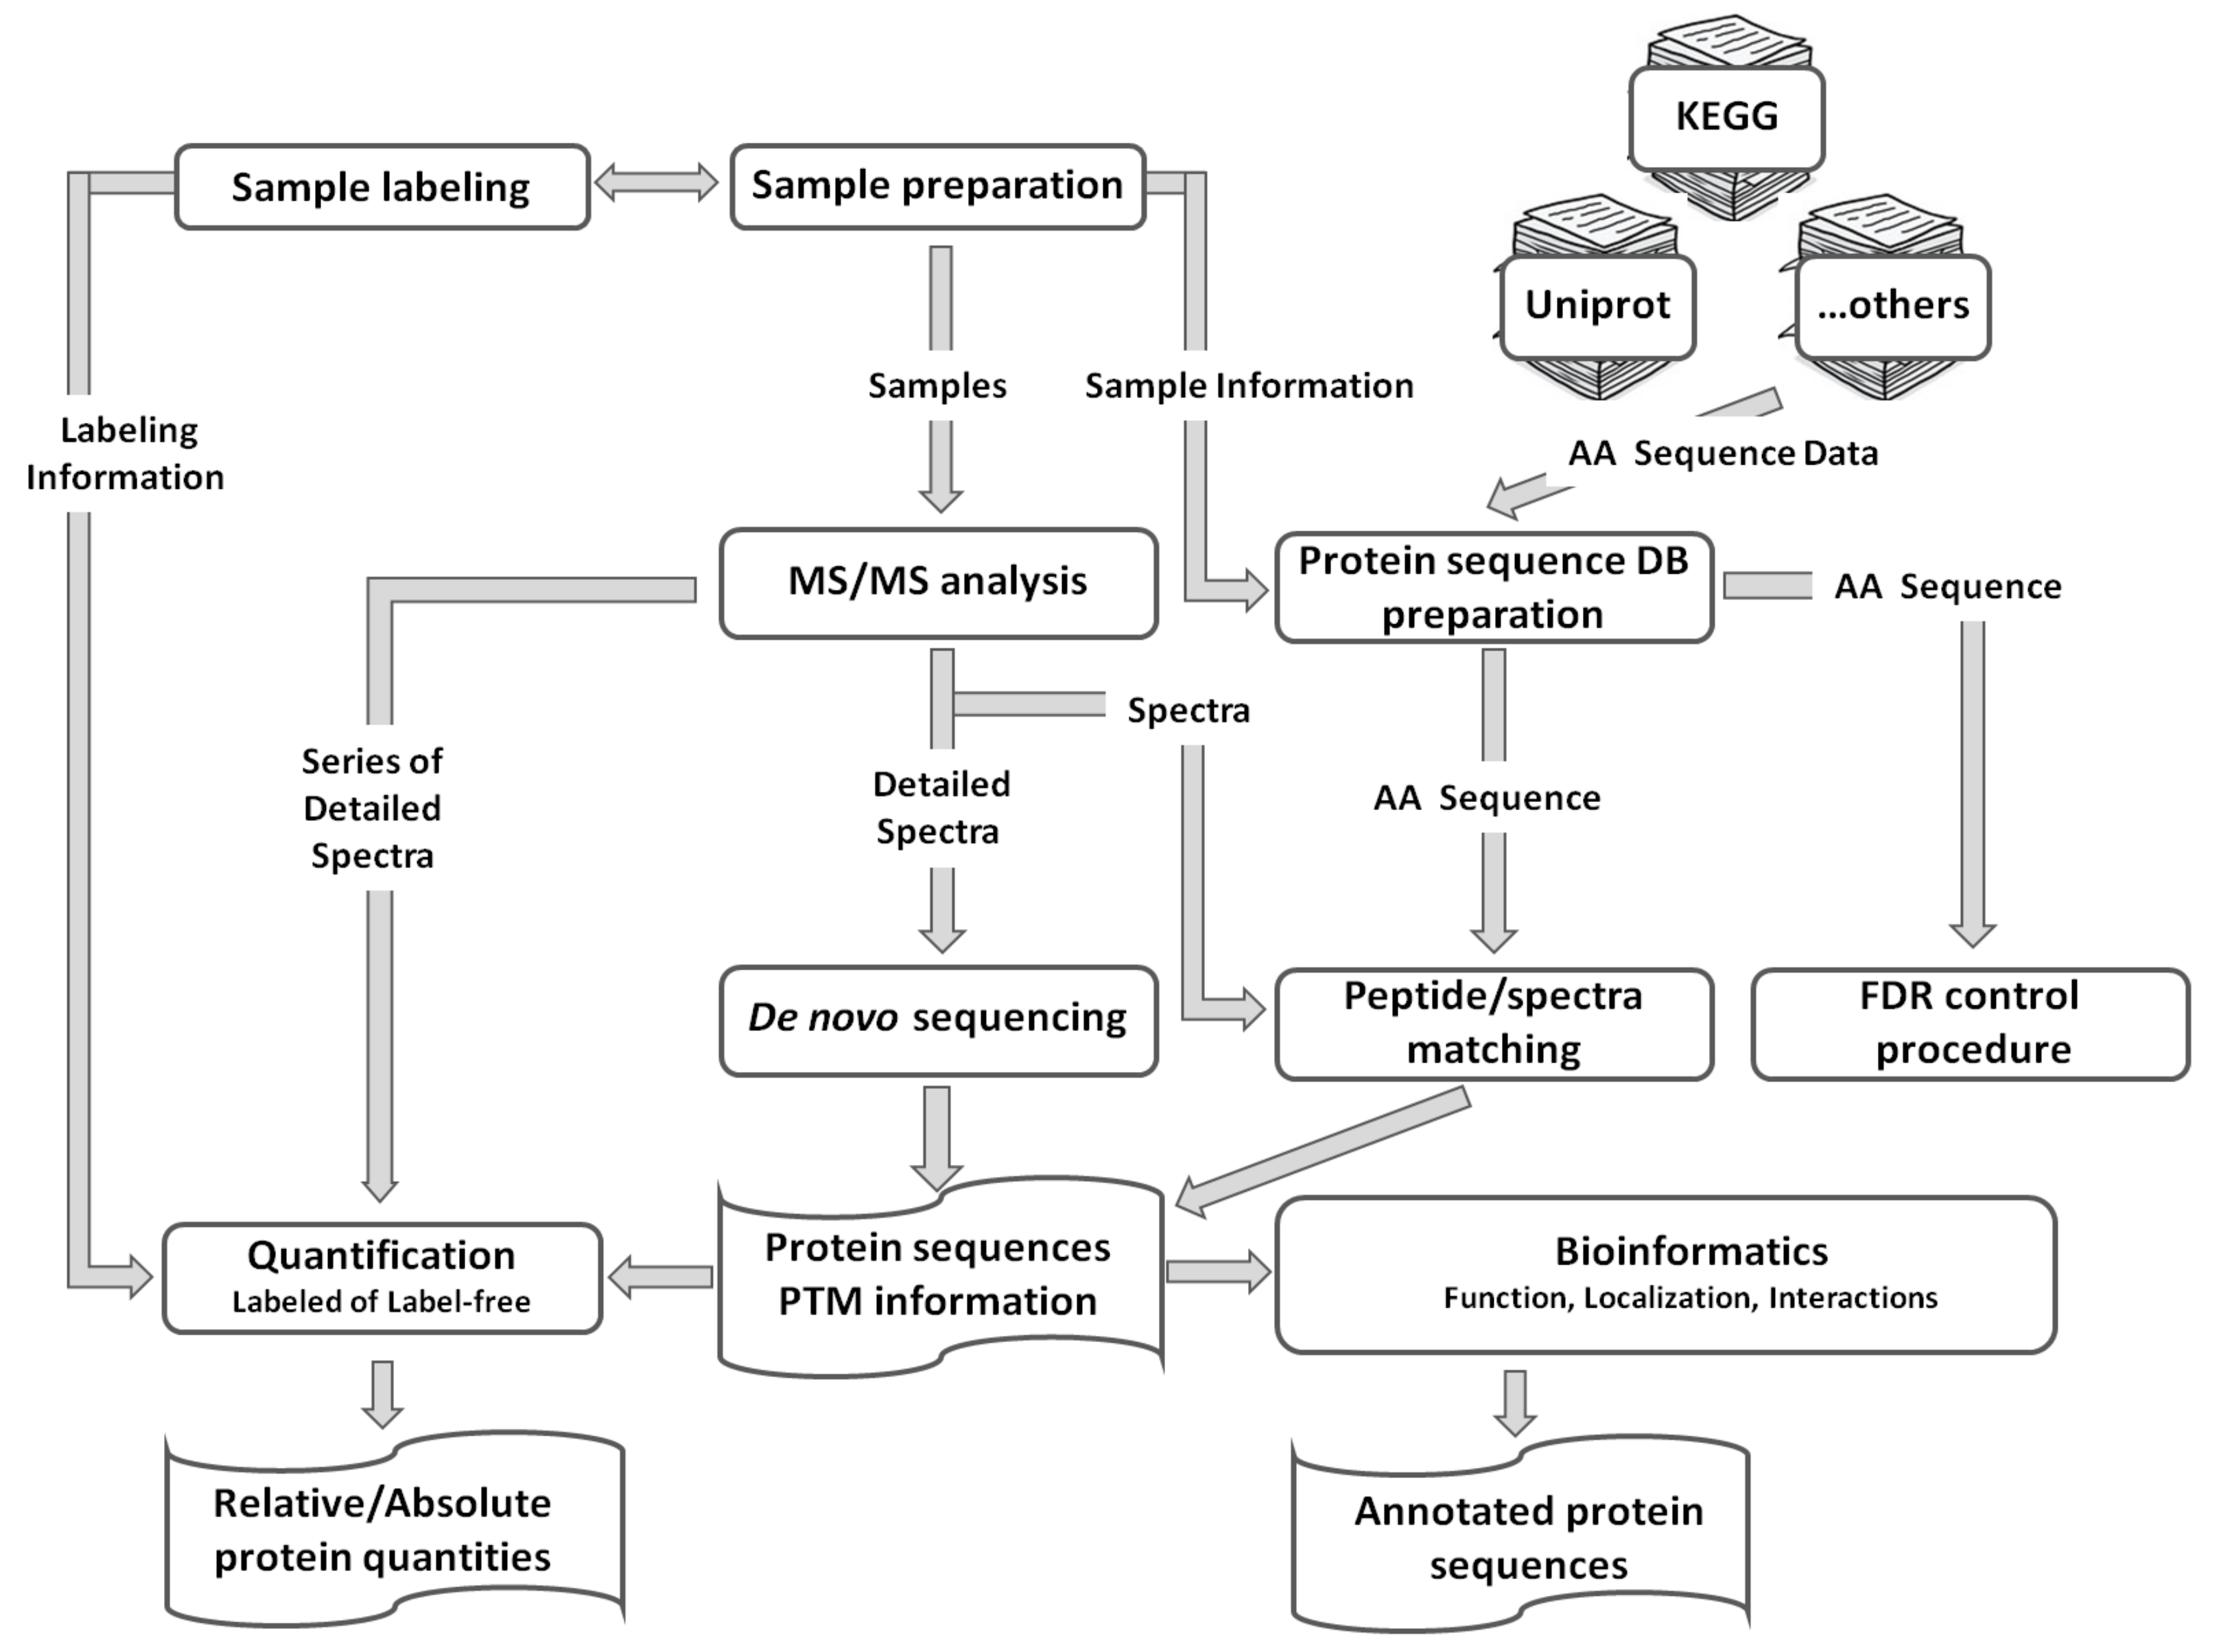
6. Data Processing and Post-Processing
7. Future Perspectives
8. Conclusions
Author Contributions
Funding
Conflicts of Interest
Abbreviations
| 2D-GE | Two-dimensional gel electrophoresis |
| AALS I/II | Anionic acid labile surfactant I/II |
| ABA | Abscisic acid |
| AGEs | Advanced glycoxidation end products |
| ALEs | Advanced lipoxidation end products |
| BAC | Boronic acid chromatography |
| CALS I/II | Cationic acid labile surfactant I/II |
| CHAPS | 3-(3-cholamidopropyl)dimethylammonio)-1-propanesulfonate |
| CMC | Critical micelle concentration |
| DCM | Dichloromethane |
| DDA | Data-dependent acquisition |
| DIA | Data-independent acquisition |
| DIGE | Difference gel electrophoresis |
| DTT | Dithiothreitol |
| ESI | Electrospray ionization |
| FASP | Filter-aided sample preparation |
| FDR | False discovery rate |
| GASP | Gel-aided sample preparation |
| GPF | Gas-phase fractionation |
| HILIC | Hydrophilic interaction liquid chromatography |
| HiT-Gel | High-throughput in-gel digestion technique |
| IEF | Isoelectrofocusing |
| IPG | Immobilized pH gradient |
| KDS | Potassium dodecyl sulfate |
| LC | Liquid chromatography |
| LIT | Linear ion trap |
| LODs | Limits of detection |
| MALDI | Matrix-assisted laser desorption-ionization |
| MRM | Multiple reaction monitoring |
| MS | Mass spectrometry |
| MS/MS | Tandem mass spectrometry |
| PMF | Peptide mass fingerprinting |
| PPI | Protein-protein interactions |
| PQPs | Peptide query parameters |
| PRM | Parallel reaction monitoring |
| PTMs | Post-translational modifications |
| PVP | Polyvinylpyrollidone |
| RCCs | Reactive carbonyl compounds |
| RPC | Reversed phase chromatography |
| SDC | Sodium deoxycholate |
| SDS | Sodium dodecyl sulfate |
| SDS-PAGE | Polyacrylamide gel electrophoresis in sodium dodecyl sulfate |
| SPE | Solid phase extraction |
| SPPS | Solid phase peptide synthesis |
| SRM | Selected reaction monitoring |
| TCA | Trichloroacetic acid |
| TOF | Time of flight |
| UHPLC | Ultra-high performance liquid chromatography |
| XIC | Extracted ion chromatogram |
| ZALSI/II | Zwitterionic acid labile surfactant I/II |
Appendix A

| # | Extraction Technique | Extraction Buffer | Chaotropic Agents | Detergents | Reducing and Chelating Additives | Further Additives | Precipitation (Vprecipitant: Vextract) | Isolate Cleaning | Reconstitution | Ref |
|---|---|---|---|---|---|---|---|---|---|---|
| 1 | Phenol extraction | 0.5 mol/L Tris-HCl (pH 7.5) | none | none | 2% (v/v) ME, 50 mmol/L EDTA | 1–15% (w/v) PVPP, PIC | 0.1 mol/L AmAc/MeOH (5:1) | MeOH (3×), acetone (3×) | SDS-PAGE SB, IEF buffer, SB for LC-MS | [89,177] |
| 2 | TCA/acetone extraction | 10% (w/v) TCA in acetone | none | none | 2% (v/v) ME | 1–15% (w/v) PVPP, PIC | precipitation at the extraction step | acetone (3×) | SDS-PAGE SB, IEF buffer | [89,94,426] |
| 3 | Extraction with urea/thiourea buffer | 14 mmol/L Tris-HCl | 7 mmol/L urea, 2 mmol/L thiourea | 2% (v/v) Triton X-100, 58 mmol/L CHAPS | none | PIC, 18 mmol/L ampholytes | none | none | solubilization at the extraction step | [82] |
| 4 | Acetone precipitation | 20 mmol/L Tris-HCl (pH 7.5) | none | 1% (v/v) Triton X-100 | 10 mmol/L EGTA, 1 mmol/L DTT | 1 mmol/L PMSF, 250 mmol/L sucrose | precipitation at the extraction step | acetone (3×) | SDS-PAGE SB | [108] |
| 5 | Extraction with SDS-Tris buffer | 125 mmol/L Tris-HCl | none | 4% (w/v) SDS | 2% (v/v) ME | 20% (v/v) glycerol | none | none | solubilization at the extraction step | [110] |
| 6 | Extraction HEPES buffer/delipidation (DCM) | 50 mmol/L HEPES buffer | none | none | 1 mmol/L EDTA | 1 mmol/L PMSF, 0.1 mmol/L nDHGA | acetone (1:5) | none | SDS-PAGE SB, IEF buffer | [113] |
| 7 | Extraction with urea/thiourea buffer | 6 mmol/L Tris-HCl,4.2 mmol/L Trizma R | 7 mmol/L urea, 2 mmol/L thiourea | 4% (w/v) CHAPS | 3% (w/v) DTT | PIC, DNAse I, RNAse A | none | none | solubilization at the extraction step | [427] |
| 8 | MeOH/CHCl3 precipitation, delipidation (PE) | 50 mmol/L Tris-HCl (pH 8.8) | none | 1% (w/v) SDS | 0.07% (v/v) ME, 1.5 mmol/L KCl | PIC, delipidation (PE) | MeOH/CHCl3/ddH2O (4:1:3) | SPE | 8 mol/L urea in 50 mmol/L ABC | [95] |
| 9 | TCA/acetone precipitation, delipidation (PE) | 50 mmol/L Tris-HCl (pH 8.8) | none | 1% (w/v) SDS | 0.07% (v/v) ME, 1.5 mmol/L KCl | PIC, delipidation (PE) | acetone (1:4) | SPE | 8 mol/L urea in 50 mmol/L ABC | [95] |
| 10 | Acetone precipitation, delipidation (PE) | 50 mmol/L Tris-HCl (pH 8.8) | none | 1% (w/v) SDS | 0.07% (v/v) ME, 1.5 mmol/L KCl | PIC, delipidation (PE) | acetone/10% (w/v) TCA (1:4) | SPE | 8 mol/L urea in 50 mmol/L ABC | [95] |
| 11 | Urea solubilization buffer | 8 mol/L urea, 2% (w/v) ampholyte (pH 3–10) | 8 mol/L urea | 4% (w/v) CHAPS | none | none | none | 2D cleanup kit (GE Healthcare) | solubilization at the extraction step | [96] |
| 12 | Thiourea/urea solubilization buffer delipidation (hexane) | 5 mol/L urea, 2 mol/L thiourea, 0.8% (w/v) ampholytes (pH 3–10) | 5 mol/L urea, 2 mol/L thiourea | 4% (w/v) CHAPS | 65 mmol/L DTT | delipidation (hexane) | none | none | solubilization at the extraction step | [96] |
| 13 | Phenol extraction | 0.1 mol/L Tris–HCl (pH 8.8) | none | none | 10 mmol/L EDTA, 0.4% (v/v) ME | none | AmAc/MeOH (5:1) | 0.1mol/L AmAc/MeOH (2×) acetone (2×) MeOH (1×) | 8 mol/L urea, 2 mol/L thiourea, 2% (w/v) CHAPS, 2% (v/v) Triton X-100, 50 mmol/L DTT, 0.5% (w/v) ampholytes (pH 3–10) | [96] |
| 14 | Modified TCA/acetone precipitation/Urea solubilization extraction | 10% (w/v) TCA in acetone | none | none | 0.07% (v/v) ME | none | precipitation at the extraction step | acetone (2–3×) | 9 mol/L urea, 1% (w/v) CHAPS, 1% (w/v) ampholytes pH (3–10), 1% (w/v) DTT | [96] |
| 15 | Phenol extraction | 0.5 mol/L Tris-HCl, (pH 7.5) | none | none | 2% (v/v) ME, 50 mmol/L EDTA | 10% (w/v) PVPP, 1 mmol/L PMSF | 0.1 mol/L AmAc/MeOH (2x) | none | IEF buffer, SDS-PAGE SB | [426] |
| 16 | Tris/TCA extraction | 100 mmol/L Tris, TCA in acetone (pH 8.5) | none | none | 5 mmol/L DTT, 1 mmol/L EDTA, 0.07% (v/v) ME | 1 mmol/L PMSF | Precipitation at the extraction step | 0.07% (v/v) ME in acetone | IEF buffer, SDS-PAGE SB | [426] |
| 17 | Tris-base extraction | 40 mmol/L Tris | 5 mol/L urea, 2 mol/L thiourea | 2% (w/v) CHAPS | 2% (v/v) ME | 5% (w/v) PVP | Precipitation at the extraction step | 0.07% (v/v) ME in acetone | IEF buffer, SDS-PAGE SB | [426] |
| 18 | TCA/acetone extraction | 10% (v/v) TCA in acetone | none | none | 20 mmol/L DTT | none | Precipitation at the extraction step | Acetone or 20 mmol/L DTT in acetone, or 10% ddH2O in acetone or 20 mmol/L DTT, 10% ddH2O in acetone | IEF SB | [100] |
| 19 | Phenol extraction | 50 mmol/L Tris-HCl (pH 7.5) | none | none | 5 mmol/L EDTA, 5 mmol/L DTT | 1% (w/v) PVPP, 1 mmol/L PMSF | Acetone: supernatant (5:1) | none | Urea buffer (50 mmol/L HEPES (pH 7.8), 8 mol/L urea) SB for LC-MS | [103] |
| 20 | TCA/acetone extraction | 10% (v/v) TCA in acetone | none | none | 10 mmol/L DTT | 10% (w/v) PVPP, 55 mmol/L iodoacetamide, 0.5 mol/L TEAB | Precipitation at the extraction step | Acetone (3×) | TEAB buffer, IEF SB, SB for LC-MS | [102] |
| 21 | TCA/acetone and methanol washes and phenol extraction | Phenol (pH 8.0): SDS (1:1) | none | none | none | none | 0.1 mol/L AmAc/MeOH | 10% (v/v) TCA/acetone 0.1 MAmAc 80% MeOH 80% acetone | SDS-PAGE SB, IEF buffer | [111] |
| 22 | Tris–HC l/ TCA/acetone extraction | 0.1 mol/L Tris–HCl (pH 6.8), 10% (v/v) TCA/acetone | none | 1% (w/v) SDS | 0.1 mol/L DTT | none | 10% (v/v) TCA/acetone | 10% (v/v) TCA/acetone aqueous 10% TCA (2x) dH2O (1x) acetone (1x) | SDS-PAGE SB | [111] |
| # | Object/Tissue | Methodology | ||||||
|---|---|---|---|---|---|---|---|---|
| Protein Isolation | Detergent/Chaotropic Agent | Reduction/Alkylation | Protease | Chromatographic System | MS | Ref | ||
| Plant Objects | ||||||||
| 1 | Brassica napus L., seeds | detergent extraction, phenol extraction | none (in-gel digest) | DTT/IA | trypsin | none | MALDI-TOF/TOF-MS | [428] |
| 2 | Lupinus luteus L, Seeds | delipidation with hexane, acetone precipitation | none (in-gel digest) | DTT/IA | trypsin | RP C18, L-column water-ACN grad., 0.1% (v/v) FA | ESI-IT-MS | [138] |
| 3 | Cicer arietinum L., plasma membrane aerial parts | chloroform/methanol (5:4) extraction | none (in-gel digest) | DTT/IA | trypsin | RP C18, water-ACN grad., 0.1% (v/v) FA | ESI-LTQ-Orbitrap-MS | [31] |
| 4% (w/v) SDS/none | DTT/IA | trypsin | ||||||
| 4 | Glycine max L., seeds | delipidation with hexane, extraction with SDS-PAGE SB | none (in-gel digest) | DTT/IA | trypsin | none | MALDI-TOF/TOF-MS | [139] |
| DTT/none | RP, BEH130C18, water-ACN grad. 0.1% (v/v) FA | ESI-QqTOF-MS | ||||||
| 5 | Glycine max L.,seeds | 2 steps extraction: protamine sulfate precipitationTCA/acetone precipitation | none (in-gel digest) | DTT/IA | trypsin | none | MALDI-TOF/TOF-MS | [140,186] |
| 4% (w/v) SDS/ 8 mol/L urea | DTT/IA | trypsin | RP, C18. water-ACN grad. 0.1% (v/v) FA | ESI-Q-Orbitrap-MS | ||||
| 6 | Arabidopsis thaliana, aerial parts | 1) detergent extraction 2) aq. buffer extraction | none (in-gel digest) | DTT/IA | trypsin | RP, C18 PepMap water-ACN grad. 0.1% (v/v) FA | ESI-Q-Orbitrap-MS | [141] |
| 7 | A. thaliana, leaves | phenol extraction | 0.5% (w/v) AALS/ 7 mol/L urea | TCEP/IA | trypsin | RP, water-ACN grad. 0.1% (v/v) FA | ESI-LIT-Orbitrap ESI-QqTOF-MS | [169] |
| 8 | G. max, seeds | 1) detergent extractionacetone precipitation | none (in-gel digest) | none | trypsin | RP, C18 PepMap column water-ACN grad. 0.1% (v/v) FA | ESI-LIT-MS | [108] |
| 9 | Chenopodium quinoa W., seeds | 1) detergent extraction 2) methanol/chloroform or acetone precipitation | none/8 mol/L urea | DTT/IA | trypsin | RP, Acclaim-C18 column water-ACN grad. 0.1% (v/v) FA | ESI-LIT-Orbitrap-MS | [95] |
| 10 | Solanum esculentum L. roots, | detergent extraction for isolation of cell microsomal fractions by centrifugation | 1) methanol ** 2) 0.2% PPS SilentSurfactant/none 3) 0.2% RGS/none 4) none/6 mol/L GdnCl | TCEP/IA | trypsin | RP, BEH C18 water-ACN grad. 0.1% (v/v) FA | ESI-QqTOF-MS | [29] |
| 11 | Vitisriparia, leaves | 1) detergent extraction 2) methanol-chloroform extraction | none (in-gel digest) | DTT/IA | trypsin | RP, Magic C18AQ resin water-ACN grad. 0.1% (v/v) FA | ESI-LIT-Orbitrap-MS | [187] |
| 50% TFE ** | DTT/IA | Lys-C, trypsin | ||||||
| 12 | Cucumis sativus L., seeds | TCA/acetone (1:9 w/v) precipitation | none/8 mol/L urea | DTT/IA | trypsin | RP, C18. water-ACN grad. 0.1% (v/v) FA | ESI-Q-Orbitrap-MS | [188] |
| 13 | Hordeum vulgare L., leaves | detergent extraction | 1) none/8 mol/L urea 2) 2% (w/v) SDS/8 mol/L urea 3) 1% SDC/none 4) 2% SDC/none | DTT/IA | trypsin | RP, Reprosilpur 120 C18 water-ACN grad. 0.1% (v/v) FA | ESI-Q-Orbitrap-MS | [194] |
| 14 | Zea mays L., seeds | 1) detergent extraction 2) TCA/acetone (1:9w/v) extraction | none (in-geldigest) | DTT/IA | trypsin | RP, Eksigent C8-CL-120 column water-ACN grad. 0.1% (v/v) FA | ESI-QqQ-MS | [429] |
| 15 | Solanum tuberosum L. leaves, | 2 steps: 1) detergent extraction 2) co-immunoprecipitation | 0.1% ProteaseMAX™ surfactant/none | TCEP/MMTS | trypsin | RP, Reprosil C18-AQ, water-ACN grad. 0.1% (v/v) FA | ESI-Q-LIT-Orbitrap-MS | [430] |
| 16 | H. vulgare caryopses, | 10% TCA, 0.07% (w/v) β-mercaptoethanol in acetone | 0.1% RGS/none | DTT/IA | trypsin | RP, C18 water-ACN grad. 0.1% (v/v) FA | ESI-QqTOF-MS | [203] |
| 17 | B. napus, seedling | 1) aq. buffer extraction 2) phenol extraction | 0.02% (w/v) AALS/8 mol/L urea, 2 mol/L thiourea | TCEP/IA | trypsin | RP, Acclaim PepMap 100 C18 column water-ACN grad. 0.1% (v/v) FA | ESI-Q-LIT—Orbitrap-MS | [26] |
| Non-plant objects | ||||||||
| 18 | Myoglobin, bacteriorhodopsin, BSA * | none | 1) 0.1–1.0% RGS/none 2) 1.0% SDC/none 3) 0.1–1.0% SL/none | none | trypsin | none | MALDI-TOF/TOF-MS | [196] |
| Rat, liver * | isolation of cell membranes by centrifugation in the gradient of sucrose | 1) 1.0% SDS/none 2) 1.0% SL/none 3) 1.0% RGS/none 4) 1.0% SDC/none | DTT/IA | trypsin | RP, C18 PepMap column water-ACN grad. 0.1% (v/v) FA | ESI-IT-MS | ||
| 19 | Rat, liver * | membrane isolation, centrifugation in sucrose gradient | 1) 1%(w/v) SDS/none 2) 1%(w/v)RGS/none 3) none/8mol/L urea 4) 60% (v/v) methanol ** | DTT/IA | trypsin | RP, C18PepMap column water-ACN grad. 0.1% (v/v) FA | ESI-IT-MS | [168] |
| 20 | BSA, ubiquitin, myoglobin, PC3 cells * | cell lysis, isolation of cell membranes by centrifugation | none | DTT/IA | trypsin | RP, C18. water-ACN grad. 0.1% (v/v) FA | ESI-QqTOF-MS | [189] |
| 21 | Rhodopseudomona spalustris * | acid extraction and sucrose density fractionation | 0, 60 or 80% acetonitrile ** in 50 mmol Tris-HCl, 10 mmol/L CaCl2 | DTT/none | trypsin | RP, Vydac C18 water-ACN grad. 0.1% (v/v) FA | ESI-IT-MS ESI-FT-ICR-MS | [192] |
| Mixture of protein standards * | none | none/6 mol/LGdnHCl | ||||||
| # | Tool | Version | Supported Platform | GUI/CMD | Open Source | Input Formats | Quantification Technique | Ref |
|---|---|---|---|---|---|---|---|---|
| 1 | MaxQuant | v1.6.3.3 | Windows, Linux | +/+ | + | AB SCIEX (*.wiff), mzXML, Thermo (*.raw), Agilent & Bruker Daltinics (*.d), Uimf (*.uimf) | LFQ/label-based | [431] |
| 2 | Peaks | v2.0 | Windows, Linux | +/+ | − | CID/CAD/HCD/ETD/ECD/EThCD | LFQ/label-based | [432] |
| 3 | OpenMS/TOPP | v2.0 | Windows, Linux, Mac OS | +/+ | + | mzML, mzXML, mzData | LFQ/label-based | [433] |
| 4 | Progenesis QI | v2.3 | Windows | Agilent & Bruker Daltinics (*.d), AB SCIEX (*.wiff), mzML, mzXML, Thermo& Agilent (*.raw) | LFQ/label-based | [434] | ||
| 5 | Proteome discoverer | v2.2 | Windows | +/− | − | mzXML, mzDATA, mzML, MSF | LFQ/label-based | [435] |
| 6 | Census | v2.3 | Windows, Linux, Mac OS | +/− | − | mzXML | LFQ/label-based possibility to self-define mass tags | [436] |
| 7 | SILVER | V3.0 | Windows | +/− | + | mzXML, *.raw | SILAC | [437] |
| 8 | msInspect | v3.1 | Windows, Linux, Mac OS | +/+ | + | mzXML | LFQ/label-based | [313,438] |
| 9 | mzMine2 | v2.6 | Windows, Linux, Mac OS | +/− | + | mzML, mzXML, mzData, NetCDF, RAW (Thermo) | LFQ | [326] |
| 10 | MassChroQ | v2.2.12 | Windows, Linux | −/+ | + | mzXML, mzML | LFQ/label-based | [439] |
| 11 | Skyline | v4.1 | Windows, Linux | +/+ | + | .sky, .skyd, mzML, mzXML, major vendor formats | LFQ | [440] |
| 12 | DIA-Umpire | v2.0 | Windows, Linux | −/+ | + | mzXML | ICAT, 18O | [441] |
| 13 | Viper | v3.49 | Windows, Linux | +/− | + | PEK, .CSV (Decon2LS), .mzXML,.mzData | ICAT, 18O | [325] |
| 14 | OpenSWATH | v2.2 | Windows, Linux, Mac OS | −/+ | + | mzML, mzXML, TraML | LFQ/label-based | [215] |
| 15 | TPP | v5.1.0 | Windows, Linux, Mac OS | +/+ | + | mzXML, .RAW (Thermo), wiff, baf (Brucker), pepXML | LFQ | [319,442] |
| 16 | moFF | v2.0 | Windows, Linux, Mac OS | +/+ | + | Thermo (.raw), mzML | LFQ | [443] |
| 17 | Mascot Distiller | v2.7 | Windows | +/+ | − | mzML, mzXML, mzData, major vendors | LFQ/label-based | [444] |
| 18 | Corra | v3.1 | Linux | mzML, pepXML | LFQ/label-based | [313,445] | ||
| 19 | FlashLFQ | v0.1.61 | Windows | −/+ | + | MzML, raw | LFQ | [446] |
| 20 | Thermo Scientific ProSightPC/ProSightPD | v4.0/v2.0 | Windows | +/− | − | Thermo (*.raw), .PUF, UniProt XML, FASTA, UniProKB | LFQ/abel-based | [447] |
| 21 | MassHunter | v10.0 | Windows | +/− | − | Agilent (d) | LFQ/label-based | [448] |
| 22 | Mercator4.0 | v2.0 | Web tool, Windows, Linux | +/− | + | FASTA | On-line functional annotation tool sequences | [449] |
| 23 | BlastKOALA | - | Web tool | −/− | − | FASTA | Automatic annotation server for genome and metagenome sequences | [341] |
| 24 | WoLF PSORT | - | Web tool | −/− | − | FASTA | Prediction of sub-cellular localization | [331] |
| 25 | BUSCA (Bologna Unified Subcellular Component Annotator) | - | Web tool | −/− | − | FASTA | Prediction of sub-cellular localization | [331,333] |
| 26 | eggNOG-mapper | v2 | Web tool | −/− | + | FASTA | Functional annotation of large sets of sequences * | [450] |
| 27 | PANTHER | v.14.0 | Web server | −/− | − | FASTA, gene ID(.txt) | Large-scale genome-wide experimental data ** | [343] |
| 28 | STRING | v11.0 | Web server | −/− | − | protein name (.txt), gene ID (.txt) | Protein-protein association networks | [451] |
References
- FAO. Seeds Toolkit—Module 5: Seed Marketing; Food and Agriculture Organization of the United Nations: Rome, Italy, 2018; ISBN 9789251309537. [Google Scholar]
- FAO. Statistical Book. Part 3. Feeding the World; Food and Agriculture Organization of the United Nations: Rome, Italy, 2013; ISBN 978-92-5-107396-4. [Google Scholar]
- FAO; IFAD; UNICEF; WFP; WHO. The State of Food Security and Nutrition in the World 2019. Building Climate Resilience for Food Security and Nutrition; Food and Agriculture Organization of the United Nations: Rome, Italy, 2018; ISBN 9789251305713. [Google Scholar]
- Bradford, K.J.; Dahal, P.; Van Asbrouck, J.; Kunusoth, K.; Bello, P.; Thompson, J.; Wu, F. The dry chain: Reducing postharvest losses and improving food safety in humid climates. Trends Food Sci. Technol. 2018, 71, 84–93. [Google Scholar] [CrossRef]
- Miller, J.K.; Herman, E.M.; Jahn, M.; Bradford, K.J. Strategic research, education and policy goals for seed science and crop improvement. Plant Sci. 2010, 179, 645–652. [Google Scholar] [CrossRef]
- Bewley, J.D.; Bradford, K.J.; Hilhorst, H.W.M.; Nonogaki, H. Seeds: Physiology of Development, Germination and Dormancy, 3rd ed.; Springer: New York, NY, USA, 2013; ISBN 978-1-4614-4692-7. [Google Scholar]
- Leprince, O.; Pellizzaro, A.; Berriri, S.; Buitink, J. Late seed maturation: Drying without dying. J. Exp. Bot. 2017, 68, 827–841. [Google Scholar] [CrossRef] [PubMed]
- Finch-Savage, W.E.; Bassel, G.W. Seed vigour and crop establishment: Extending performance beyond adaptation. J. Exp. Bot. 2016, 67, 567–591. [Google Scholar] [CrossRef]
- Marques, A.; Buijs, G.; Ligterink, W.; Hilhorst, H. Evolutionary ecophysiology of seed desiccation sensitivity. Funct. Plant Biol. 2018, 45, 1083. [Google Scholar] [CrossRef]
- Szarka, A.; Tomasskovics, B.; Bánhegyi, G. The Ascorbate-glutathione-α-tocopherol. Triad in Abiotic Stress Response. Int. J. Mol. Sci. 2012, 13, 4458–4483. [Google Scholar] [CrossRef]
- Frolov, A.; Mamontova, T.; Ihling, C.; Lukasheva, E.; Bankin, M.; Chantseva, V.; Vikhnina, M.; Soboleva, A.; Shumilina, J.; Mavropolo-Stolyarenko, G.; et al. Mining seed proteome: From protein dynamics to modification profiles. Biol. Commun. 2018, 63, 43–58. [Google Scholar] [CrossRef]
- Aguirre, M.; Kiegle, E.; Leo, G.; Ezquer, I. Carbohydrate reserves and seed development: An overview. Plant Reprod. 2018, 31, 263–290. [Google Scholar] [CrossRef]
- Baud, S. Seeds as oil factories. Plant Reprod. 2018, 31, 213–235. [Google Scholar] [CrossRef]
- Gallardo, K.; Thompson, R.; Burstin, J. Reserve accumulation in legume seeds. Comptes Rendus Biol. 2008, 331, 755–762. [Google Scholar] [CrossRef]
- Wang, W.-Q.Q.; Liu, S.-J.J.; Song, S.-Q.Q.; Møller, I.M. Proteomics of seed development, desiccation tolerance, germination and vigor. Plant Physiol. Biochem. 2015, 86, 1–15. [Google Scholar] [CrossRef] [PubMed]
- Miernyk, J.A.; Hajduch, M. Seed proteomics. J. Proteomics 2011, 74, 389–400. [Google Scholar] [CrossRef] [PubMed]
- Copeland, L.O.; McDonald, M.B. The chemistry of seeds. Princ. Seed Sci. Technol. 1999, 40–58. [Google Scholar] [CrossRef]
- Robić, G.; Farinas, C.S.; Rech, E.L.; Miranda, E.A. Transgenic soybean seed as protein expression system: Aqueous extraction of recombinant β-glucuronidase. Appl. Biochem. Biotechnol. 2010, 160, 1157–1167. [Google Scholar] [CrossRef]
- Schmidt, M.A.; Herman, E.M. Proteome rebalancing in soybean seeds can be exploited to enhance foreign protein accumulation. Plant Biotechnol. J. 2008, 6, 832–842. [Google Scholar] [CrossRef]
- Rathi, D.; Gayen, D.; Gayali, S.; Chakraborty, S.; Chakraborty, N. Legume proteomics: Progress, prospects, and challenges. Proteomics 2016, 16, 310–327. [Google Scholar] [CrossRef]
- Shewry, P.R.; Casey, R. Seed Proteins. In Seed Proteins; Shewry, P.R., Casey, R., Eds.; Springer: Dordrecht, The Netherlands, 1999; pp. 1–10. ISBN 978-94-010-5904-6. [Google Scholar]
- Gallardo, K.; Job, C.; Groot, S.P.C.; Puype, M.; Demol, H.; Vandekerckhove, J.; Job, D. Proteomic analysis of arabidopsis seed germination and priming. Plant Physiol. 2001, 126, 835–848. [Google Scholar] [CrossRef]
- Gallardo, K.; Le Signor, C.; Vandekerckhove, J.; Thompson, R.D.; Burstin, J. Proteomics of medicago truncatula seed development establishes the time frame of diverse metabolic processes related to reserve accumulation. Plant Physiol. 2003, 133, 664–682. [Google Scholar] [CrossRef]
- Catusse, J.; Job, C.; Job, D. Transcriptome- and proteome-wide analyses of seed germination. Comptes Rendus Biol. 2008, 331, 815–822. [Google Scholar] [CrossRef]
- Rajjou, L.; Lovigny, Y.; Groot, S.P.C.; Belghazi, M.; Job, C.; Job, D. Proteome-wide characterization of seed aging in Arabidopsis: A comparison between artificial and natural aging protocols. Plant Physiol. 2008, 148, 620–641. [Google Scholar] [CrossRef]
- Frolov, A.; Didio, A.; Ihling, C.; Chantzeva, V.; Grishina, T.; Hoehenwarter, W.; Sinz, A.; Smolikova, G.; Bilova, T.; Medvedev, S. The effect of simulated microgravity on the Brassica napus seedling proteome. Funct. Plant Biol. 2018, 45, 440. [Google Scholar] [CrossRef]
- Vanderschuren, H.; Lentz, E.; Zainuddin, I.; Gruissem, W. Proteomics of model and crop plant species: Status, current limitations and strategic advances for crop improvement. J. Proteomics 2013, 93, 5–19. [Google Scholar] [CrossRef] [PubMed]
- Miernyk, J.A. Seed proteomics. In Plant Proteomics. Methods in Molecular Biology (Methods and Protocols); Humana Press: Totowa, NJ, USA, 2014; Volume 1072, pp. 361–377. [Google Scholar]
- Mbeunkui, F.; Goshe, M.B. Investigation of solubilization and digestion methods for microsomal membrane proteome analysis using data-independent LC-MSE. Proteomics 2011, 11, 898–911. [Google Scholar] [CrossRef] [PubMed]
- Balmer, Y.; Vensel, W.H.; DuPont, F.M.; Buchanan, B.B.; Hurkman, W.J. Proteome of amyloplasts isolated from developing wheat endosperm presents evidence of broad metabolic capability. J. Exp. Bot. 2006, 57, 1591–1602. [Google Scholar] [CrossRef] [PubMed]
- Barua, P.; Subba, P.; Lande, N.V.; Mangalaparthi, K.K.; Prasad, T.S.K.; Chakraborty, S.; Chakraborty, N. Gel-based and gel-free search for plasma membrane proteins in chickpea (Cicer arietinum L.) augments the comprehensive data sets of membrane protein repertoire. J. Proteomics 2016, 143, 199–208. [Google Scholar] [CrossRef] [PubMed]
- Yadeta, K.A.; Elmore, J.M.; Coaker, G. Advancements in the analysis of the Arabidopsis plasma membrane proteome. Front Plant Sci 2013, 4, 86. [Google Scholar] [CrossRef] [PubMed]
- Komatsu, S.; Wang, X.; Yin, X.; Nanjo, Y.; Ohyanagi, H.; Sakata, K. Integration of gel-based and gel-free proteomic data for functional analysis of proteins through Soybean Proteome Database. J. Proteomics 2017, 163, 52–66. [Google Scholar] [CrossRef]
- Bourgeois, M.; Jacquin, F.; Savois, V.; Sommerer, N.; Labas, V.; Henry, C.; Burstin, J. Dissecting the proteome of pea mature seeds reveals the phenotypic plasticity of seed protein composition. Proteomics 2009, 9, 254–271. [Google Scholar] [CrossRef]
- Komatsu, S.; Hashiguchi, A. Subcellular proteomics: Application to elucidation of flooding-response mechanisms in soybean. Proteomes 2018, 6, 13. [Google Scholar] [CrossRef]
- Wang, W.Q.; Møller, I.M.; Song, S.Q. Proteomic analysis of embryonic axis of Pisum sativum seeds during germination and identification of proteins associated with loss of desiccation tolerance. J. Proteomics 2012, 77, 68–86. [Google Scholar] [CrossRef]
- Hajduch, M.; Casteel, J.E.; Hurrelmeyer, K.E.; Song, Z.; Agrawal, G.K.; Thelen, J.J. Proteomic analysis of seed filling in Brassica napus developmental characterization of metabolic isozymes using high-resolution. Plant Physiol. 2006, 141, 32–46. [Google Scholar] [CrossRef] [PubMed]
- Zhang, H.; Wang, W.Q.; Liu, S.J.; Møller, I.M.; Song, S.Q. Proteome analysis of poplar seed vigor. PLoS ONE 2015, 10, e0132509. [Google Scholar] [CrossRef] [PubMed]
- Ventura, L.; Donà, M.; Macovei, A.; Carbonera, D.; Buttafava, A.; Mondoni, A.; Rossi, G.; Balestrazzi, A. Understanding the molecular pathways associated with seed vigor. Plant Physiol. Biochem. 2012, 60, 196–206. [Google Scholar] [CrossRef] [PubMed]
- Catusse, J.; Meinhard, J.; Job, C.; Strub, J.M.; Fischer, U.; Pestsova, E.; Westhoff, P.; Van Dorsselaer, A.; Job, D. Proteomics reveals potential biomarkers of seed vigor in sugarbeet. Proteomics 2011, 11, 1569–1580. [Google Scholar] [CrossRef]
- Rajjou, L.; Duval, M.; Gallardo, K.; Catusse, J.; Bally, J.; Job, C.; Job, D. Seed germination and vigor. Annu. Rev. Plant Biol. 2012, 63, 507–533. [Google Scholar] [CrossRef]
- Hatzig, S.V.; Frisch, M.; Breuer, F.; Nesi, N.; Ducournau, S.; Wagner, M.-H.; Leckband, G.; Abbadi, A.; Snowdon, R.J. Genome-wide association mapping unravels the genetic control of seed germination and vigor in Brassica napus. Front. Plant Sci. 2015, 6, 221. [Google Scholar] [CrossRef]
- Xin, X.; Lin, X.-H.; Zhou, Y.-C.; Chen, X.-L.; Liu, X.; Lu, X.-X. Proteome analysis of maize seeds: The effect of artificial ageing. Physiol. Plant. 2011, 143, 126–138. [Google Scholar] [CrossRef]
- Smolikova, G.N.; Shavarda, A.L.; Alekseichuk, I.V.; Chantseva, V.V.; Medvedev, S.S. The metabolomic approach to the assessment of cultivar specificity of Brassica napus L. seeds. Russ. J. Genet. Appl. Res. 2016, 6, 78–83. [Google Scholar] [CrossRef]
- Narula, K.; Sinha, A.; Haider, T.; Chakraborty, N.; Chakraborty, S. Seed Proteomics: An overview. In Agricultural Proteomics Volume 1; Salekdeh, G.H., Ed.; Springer International Publishing: Cham, Switzerland, 2016; Volume 1, pp. 31–52. ISBN 978-3-319-43273-1. [Google Scholar]
- Min, C.W.; Gupta, R.; Kim, S.W.; Lee, S.E.; Kim, Y.C.; Bae, D.W.; Han, W.Y.; Lee, B.W.; Ko, J.M.; Agrawal, G.K.; et al. Comparative biochemical and proteomic analyses of soybean seed cultivars differing in protein and oil content. J. Agric. Food Chem. 2015, 63, 7134–7142. [Google Scholar] [CrossRef]
- Meyer, L.J.; Gao, J.; Xu, D.; Thelen, J.J. Phosphoproteomic analysis of seed maturation in arabidopsis, rapeseed, and soybean. Plant Physiol. 2012, 159, 517–528. [Google Scholar] [CrossRef]
- Larance, M.; Lamond, A.I. Multidimensional proteomics for cell biology. Nat. Rev. Mol. Cell Biol. 2015, 16, 269–280. [Google Scholar] [CrossRef]
- Plomion, C.; Meddour, H.; Kohler, A.; Jacob, D.; Bastien, C.; Dreyer, E.; De Daruvar, A.; Guehl, J.; Schmitter, J.; Martin, F.; et al. Mapping the proteome of poplar and application to the discovery of drought-stress responsive proteins. Proteomics 2006, 6, 6509–6527. [Google Scholar] [CrossRef] [PubMed]
- Bantscheff, M.; Schirle, M. Quantitative mass spectrometry in proteomics: A critical review. Anal. Bioanal. Chem. 2007, 389, 1017–1031. [Google Scholar] [CrossRef] [PubMed]
- Jimenez-lopez, J.C.; Foley, R.C.; Brear, E.; Clarke, V.C.; Lima-cabello, E.; Florido, J.F.; Singh, K.B.; Alché, J.D.; Smith, P.M.C. Characterization of narrow-leaf lupin (Lupinus angustifolius L.) recombinant major allergen IgE-binding proteins and the natural β -conglutin counterparts in sweet lupin seed species. Food Chem. 2018, 244, 60–70. [Google Scholar] [CrossRef] [PubMed]
- Luthria, D.L.; Maria John, K.M.; Marupaka, R.; Natarajan, S. Recent update on methodologies for extraction and analysis of soybean seed proteins. J. Sci. Food Agric. 2018, 98, 5572–5580. [Google Scholar] [CrossRef]
- Alvarez, S.; Roy Choudhury, S.; Sivagnanam, K.; Hicks, L.M.; Pandey, S. Quantitative proteomics analysis of Camelina sativa seeds overexpressing the AGG3 gene to identify the proteomic basis of increased yield and stress tolerance. J. Proteome Res. 2015, 14, 2606–2616. [Google Scholar] [CrossRef]
- Hart-Smith, G.; Reis, R.S.; Waterhouse, P.M.; Wilkins, M.R. Improved quantitative plant proteomics via the combination of targeted and untargeted data acquisition. Front. Plant Sci. 2017, 8, 1669. [Google Scholar] [CrossRef]
- Mamontova, T.; Afonin, A.M.; Ihling, C.; Soboleva, A.; Lukasheva, E.; Sulima, A.S.; Shtark, O.Y.; Akhtemova, G.A.; Povydysh, M.N.; Sinz, A.; et al. Profiling of seed proteome in pea (Pisum sativum L.) lines characterized with high and low responsivity to combined inoculation with nodule bacteria and arbuscular mycorrhizal fungi. Molecules 2019, 24, 1603. [Google Scholar] [CrossRef]
- Soboleva, A.; Schmidt, R.; Vikhnina, M.; Grishina, T.; Frolov, A. Maillard Proteomics: Opening new pages. Int. J. Mol. Sci. 2017, 18, 2677. [Google Scholar] [CrossRef]
- Jorrín-Novo, J.V.; Pascual, J.; Sánchez-Lucas, R.; Romero-Rodríguez, M.C.; Rodríguez-Ortega, M.J.; Lenz, C.; Valledor, L. Fourteen years of plant proteomics reflected in proteomics: Moving from model species and 2DE-based approaches to orphan species and gel-free platforms. Proteomics 2015, 15, 1089–1112. [Google Scholar] [CrossRef]
- Catherman, A.D.; Skinner, O.S.; Kelleher, N.L. Top down proteomics: Facts and perspectives. Biochem. Biophys. Res. Commun. 2014, 445, 683–693. [Google Scholar] [CrossRef] [PubMed]
- Chmelik, J.; Zidkova, J.; Rehulka, P.; Petry-Podgorska, I.; Bobalova, J. Influence of different proteomic protocols on degree of high-coverage identification of nonspecific lipid transfer protein 1 modified during malting. Electrophoresis 2009, 30, 560–567. [Google Scholar] [CrossRef] [PubMed]
- Gillet, L.C.; Leitner, A.; Aebersold, R. Mass spectrometry applied to bottom-up proteomics: Entering the high-throughput era for hypothesis testing. Annu. Rev. Anal. Chem. 2016, 9, 449–472. [Google Scholar] [CrossRef] [PubMed]
- Mørtz, E.; O’Connor, P.B.; Roepstorff, P.; Kelleher, N.L.; Wood, T.D.; McLafferty, F.W.; Mann, M. Sequence tag identification of intact proteins by matching tanden mass spectral data against sequence data bases. Proc. Natl. Acad. Sci. USA 1996, 93, 8264–8267. [Google Scholar] [CrossRef]
- Hummel, M.; Wigger, T.; Brockmeyer, J. Characterization of mustard 2S albumin allergens by bottom-up, middle-down and top-down proteomics: A consensus set of isoforms of Sin a 1. J. Proteome Res. 2015, 14, 1547–1556. [Google Scholar] [CrossRef]
- Mamontova, T.; Lukasheva, E.; Mavropolo-Stolyarenko, G.; Proksch, C.; Bilova, T.; Kim, A.; Babakov, V.; Grishina, T.; Hoehenwarter, W.; Medvedev, S.; et al. Proteome map of pea (Pisum sativum L.) embryos containing different amounts of residual chlorophylls. Int. J. Mol. Sci. 2018, 19, 4066. [Google Scholar] [CrossRef]
- Bose, U.; Broadbent, J.A.; Byrne, K.; Hasan, S.; Howitt, C.A.; Colgrave, M.L. Optimisation of protein extraction for in-depth profiling of the cereal grain proteome. J. Proteomics 2019, 197, 23–33. [Google Scholar] [CrossRef]
- Nilsen, T.W.; Graveley, B.R. Expansion of the eukaryotic proteome by alternative splicing. Nature 2010, 463, 457–463. [Google Scholar] [CrossRef]
- Bourgeois, M.; Jacquin, F.; Cassecuelle, F.; Savois, V.; Belghazi, M.; Aubert, G.; Quillien, L.; Huart, M.; Marget, P.; Burstin, J. A PQL (protein quantity loci) analysis of mature pea seed proteins identifies loci determining seed protein composition. Proteomics 2011, 11, 1581–1594. [Google Scholar] [CrossRef]
- Natarajan, S.S.; Krishnan, H.B.; Lakshman, S.; Garrett, W.M. An efficient extraction method to enhance analysis of low abundant proteins from soybean seed. Anal. Biochem. 2009, 394, 259–268. [Google Scholar] [CrossRef]
- Kim, Y.J.Y.C.; Wang, Y.; Gupta, R.; Kim, S.T.S.W.; Min, C.W.; Kim, Y.J.Y.C.; Park, K.H.; Agrawal, G.K.; Rakwal, R.; Choung, M.-G.G.; et al. Protamine sulfate precipitation method depletes abundant plant seed-storage proteins: A case study on legume plants. Proteomics 2015, 15, 1760–1764. [Google Scholar] [CrossRef]
- Min, C.W.; Park, J.; Bae, J.W.; Agrawal, G.K.; Rakwal, R.; Kim, Y.; Yang, P.; Kim, S.T.; Gupta, R. In-Depth Investigation of low-abundance proteins in matured and filling stages seeds of glycine max employing a combination of protamine sulfate precipitation and TMT-Based quantitative proteomic analysis. Cells 2020, 9, 1517. [Google Scholar] [CrossRef] [PubMed]
- Krishnan, H.B.; Oehrle, N.W.; Natarajan, S.S. A rapid and simple procedure for the depletion of abundant storage proteins from legume seeds to advance proteome analysis: A case study using Glycine max. Proteomics 2009, 9, 3174–3188. [Google Scholar] [CrossRef] [PubMed]
- Righetti, P.G.; Boschetti, E. Low-abundance plant protein enrichment with peptide libraries to enlarge proteome coverage and related applications. Plant Sci. 2020, 290, 110302. [Google Scholar] [CrossRef] [PubMed]
- Kretzschmar, F.K.; Doner, N.M.; Krawczyk, H.E.; Scholz, P.; Schmitt, K.; Valerius, O.; Braus, G.H.; Mullen, R.T.; Ischebeck, T. Identification of low-abundance lipid droplet proteins in seeds and seedlings. Plant Physiol. 2020, 182, 1326–1345. [Google Scholar] [CrossRef]
- Du, C.; Liu, A.; Niu, L.; Cao, D.; Liu, H.; Wu, X.; Wang, W. Proteomic identification of lipid-bodies-associated proteins in maize seeds. Acta Physiol. Plant. 2019, 41, 70. [Google Scholar] [CrossRef]
- Tan, B.C.; Lim, Y.S.; Lau, S. Proteomics in commercial crops: An overview. J. Proteomics 2017, 169, 176–188. [Google Scholar] [CrossRef]
- Dawod, M.; Arvin, N.E.; Kennedy, R.T. Recent advances in protein analysis by capillary and microchip electrophoresis. Analyst 2017, 142, 1847–1866. [Google Scholar] [CrossRef]
- Kota, U.; Goshe, M.B. Advances in qualitative and quantitative plant membrane proteomics. Phytochemistry 2011, 72, 1040–1060. [Google Scholar] [CrossRef]
- Rogowska-Wrzesinska, A.; Le Bihan, M.-C.; Thaysen-Andersen, M.; Roepstorff, P. 2D gels still have a niche in proteomics. J. Proteomics 2013, 88, 4–13. [Google Scholar] [CrossRef]
- Ostergaard, O.; Finnie, C.; Laugesen, S.; Roepstorff, P.; Svennson, B. Proteome analysis of barley seeds: Identification of major proteins from two-dimensional gels (pI 4-7). Proteomics 2004, 4, 2437–2447. [Google Scholar] [CrossRef] [PubMed]
- Rabilloud, T.; Lelong, C. Two-dimensional gel electrophoresis in proteomics: A tutorial. J. Proteomics 2011, 74, 1829–1841. [Google Scholar] [CrossRef] [PubMed]
- Xu, X.; Fan, R.; Zheng, R.; Li, C.; Yu, D. Proteomic analysis of seed germination under salt stress in soybeans. J. Zhejiang Univ. Sci. B 2011, 12, 507–517. [Google Scholar] [CrossRef] [PubMed]
- Rabilloud, T.; Chevallet, M.; Luche, S.; Lelong, C. Two-dimensional gel electrophoresis in proteomics: Past, present and future. J. Proteomics 2010, 73, 2064–2077. [Google Scholar] [CrossRef] [PubMed]
- Gallardo, K.; Kurt, C.; Thompson, R.; Ochatt, S. In vitro culture of immature M. truncatula grains under conditions permitting embryo development comparable to that observed in vivo. Plant Sci. 2006, 170, 1052–1058. [Google Scholar] [CrossRef]
- Magdeldin, S.; Enany, S.; Yoshida, Y.; Xu, B.; Zhang, Y.; Zureena, Z.; Lokamani, I.; Yaoita, E.; Yamamoto, T. Basics and recent advances of two dimensional- polyacrylamide gel electrophoresis. Clin. Proteomics 2014, 11, 16. [Google Scholar] [CrossRef]
- Rune, M. Mass Spectrometry Data Analysis in Proteomics; Humana Press: Totowa, NJ, USA, 2006; Volume 367, ISBN 1-59745-275-0. [Google Scholar]
- Friedman, D.B.; Hoving, S.; Westermeier, R. Chapter 30 isoelectric focusing and two-dimensional gel electrophoresis. In Methods in Enzymology; Elsevier Inc.: Amsterdam, The Netherlands, 2009; pp. 515–540. [Google Scholar]
- Lee, P.Y.; Saraygord-Afshari, N.; Low, T.Y. The evolution of two-dimensional gel electrophoresis—From proteomics to emerging alternative applications. J. Chromatogr. A 2020, 1615, 460763. [Google Scholar] [CrossRef]
- Jorrin-Novo, J.V.; Komatsu, S.; Sanchez-Lucas, R.; Rodríguez de Francisco, L.E. Gel electrophoresis-based plant proteomics: Past, present, and future. Happy 10th anniversary Journal of Proteomics! J. Proteomics 2019, 198, 1–10. [Google Scholar] [CrossRef]
- Meleady, P. Two-Dimensional gel electrophoresis and 2D-DIGE. In Difference Gel Electrophoresis. Methods in Molecular Biology; Humana Press: New York, NY, USA, 2018; pp. 3–14. [Google Scholar]
- Isaacson, T.; Damasceno, C.M.B.; Saravanan, R.S.; He, Y.; Catalá, C.; Saladié, M.; Rose, J.K.C. Sample extraction techniques for enhanced proteomic analysis of plant tissues. Nat. Protoc. 2006, 1, 769–774. [Google Scholar] [CrossRef]
- Wang, W.; Vignani, R.; Scali, M.; Cresti, M. A universal and rapid protocol for protein extraction from recalcitrant plant tissues for proteomic analysis. Electrophoresis 2006, 27, 2782–2786. [Google Scholar] [CrossRef]
- Wang, X.; Li, X.; Deng, X.; Han, H.; Shi, W.; Li, Y. A protein extraction method compatible with proteomic analysis for the euhalophyte Salicornia europaea. Electrophoresis 2007, 28, 3976–3987. [Google Scholar] [CrossRef] [PubMed]
- Soboleva, A.; Vikhnina, M.; Grishina, T.; Frolov, A. Probing protein glycation by chromatography and mass spectrometry: Analysis of glycation adducts. Int. J. Mol. Sci. 2017, 18, 2557. [Google Scholar] [CrossRef] [PubMed]
- Antonova, K.; Vikhnina, M.; Soboleva, A.; Mehmood, T.; Heymich, M.; Leonova, T.; Bankin, M.; Lukasheva, E.; Gensberger-Reigl, S.; Medvedev, S.; et al. Analysis of chemically labile glycation adducts in seed proteins: Case study of methylglyoxal-derived hydroimidazolone 1 (MG-H1). Int. J. Mol. Sci. 2019, 20, 3659. [Google Scholar] [CrossRef] [PubMed]
- Damerval, C.; de Dominique, V.; Zivy, M.; Thiellement, H. Technical improvements in two-dimensional electrophoresis increase the level of genetic variation detected in wheat-seedling proteins. Electrophoresis 1986, 7, 52–54. [Google Scholar] [CrossRef]
- Capriotti, A.L.; Cavaliere, C.; Piovesana, S.; Stampachiacchiere, S.; Ventura, S.; Zenezini Chiozzi, R.; Laganà, A. Characterization of quinoa seed proteome combining different protein precipitation techniques: Improvement of knowledge of nonmodel plant proteomics. J. Sep. Sci. 2015, 38, 1017–1025. [Google Scholar] [CrossRef]
- Natarajan, S.; Xu, C.; Caperna, T.J.; Garrett, W.M. Comparison of protein solubilization methods suitable for proteomic analysis of soybean seed proteins. Anal. Biochem. 2005, 342, 214–220. [Google Scholar] [CrossRef]
- Fu, Y.; Zhang, H.; Mandal, S.N.; Wang, C.; Chen, C.; Ji, W. Quantitative proteomics reveals the central changes of wheat in response to powdery mildew. J. Proteomics 2016, 130, 108–119. [Google Scholar] [CrossRef]
- Baslam, M.; Kaneko, K.; Mitsui, T. iTRAQ-based proteomic analysis of rice grains. In Plant Proteomics: Methods and Protocols, Methods in Molecular Biology; Jorrin-Novo, J.V., Valledor, L., Castillejo, M.A., Rey, M.-D., Eds.; Springer: Berlin/Heidelberg, Germany, 2020; Volume 213, pp. 405–414. [Google Scholar]
- Görg, A.; Weiss, W. Two-dimensional electrophoresis with immobilized pH gradients. In Proteome Research: Two-Dimensional Gel Electrophoresis and Identification Methods; Springer-Verlag: Berlin/Heidelberg, Germany, 2000; pp. 57–106. [Google Scholar]
- Vâlcu, C.-M.; Schlink, K. Reduction of proteins during sample preparation and two-dimensional gel electrophoresis of woody plant samples. Proteomics 2006, 6, 1599–1605. [Google Scholar] [CrossRef]
- Negri, A.S.; Prinsi, B.; Scienza, A.; Morgutti, S.; Cocucci, M.; Espen, L. Analysis of grape berry cell wall proteome: A comparative evaluation of extraction methods. J. Plant Physiol. 2008, 165, 1379–1389. [Google Scholar] [CrossRef]
- Dong, Y.; Wang, Q.; Zhang, L.; Du, C.; Xiong, W. Dynamic Proteomic characteristics and network integration revealing key proteins for two kernel tissue developments in popcorn. PLoS ONE 2015, 10, e0143181. [Google Scholar] [CrossRef]
- Ranjbar Sistani, N.; Kaul, H.; Desalegn, G.; Wienkoop, S. Rhizobium impacts on seed productivity, quality, and protection of Pisum sativum upon disease stress caused by didymella pinodes: Phenotypic, proteomic, and metabolomic traits. Front. Plant Sci. 2017, 8, 1961. [Google Scholar] [CrossRef] [PubMed]
- Cremer, F.; van de Walle, C. Method for extraction of proteins from green plant tissues for two-dimensional polyacrylamide gel electrophoresis. Anal. Biochem. 1985, 147, 22–26. [Google Scholar] [CrossRef]
- Milkovska-Stamenova, S.; Schmidt, R.; Frolov, A.; Birkemeyer, C. GC-MS method for the quantitation of carbohydrate intermediates in glycation systems. J. Agric. Food Chem. 2015, 63, 5911–5919. [Google Scholar] [CrossRef]
- Frolov, A.; Schmidt, R.; Spiller, S.; Greifenhagen, U.; Hoffmann, R. Arginine-derived advanced glycation end products generated in peptide–glucose mixtures during boiling. J. Agric. Food Chem. 2014, 62, 3626–3635. [Google Scholar] [CrossRef] [PubMed]
- Greifenhagen, U.; Frolov, A.; Blüher, M.; Hoffmann, R. Plasma Proteins modified by advanced glycation end products (AGEs) reveal site-specific susceptibilities to glycemic control in patients with type 2 diabetes. J. Biol. Chem. 2016, 291, 9610–9616. [Google Scholar] [CrossRef] [PubMed]
- Han, C.; Yin, X.; He, D.; Yang, P. Analysis of Proteome profile in germinating soybean seed, and its comparison with rice showing the styles of reserves mobilization in different crops. PLoS ONE 2013, 8, e56947. [Google Scholar] [CrossRef]
- Nishimura, N.; Tsuchiya, W.; Moresco, J.J.; Hayashi, Y.; Satoh, K.; Kaiwa, N.; Irisa, T.; Kinoshita, T.; Schroeder, J.I.; Yates, J.R.; et al. Control of seed dormancy and germination by DOG1-AHG1 PP2C phosphatase complex via binding to heme. Nat. Commun. 2018, 9, 1–14. [Google Scholar] [CrossRef]
- Lorenz, C.; Brandt, S.; Borisjuk, L.; Rolletschek, H.; Heinzel, N.; Tohge, T.; Fernie, A.R.; Braun, H.-P.; Hildebrandt, T.M. The role of persulfide metabolism during Arabidopsis seed development under light and dark conditions. Front. Plant Sci. 2018, 9, 1381. [Google Scholar] [CrossRef]
- Wang, W.; Vignani, R.; Scali, M.; Sensi, E.; Tiberi, P.; Cresti, M. Removal of lipid contaminants by organic solvents from oilseed protein extract prior to electrophoresis. Anal. Biochem. 2004, 329, 139–141. [Google Scholar] [CrossRef]
- Murad, A.M.; Rech, E.L. NanoUPLC-MSE proteomic data assessment of soybean seeds using the Uniprot database. BMC Biotechnol. 2012, 12, 82. [Google Scholar] [CrossRef]
- Satour, P.; Youssef, C.; Châtelain, E.; Vu, B.L.; Teulat, B.; Job, C.; Job, D.; Montrichard, F. Patterns of protein carbonylation during Medicago truncatula seed maturation. Plant. Cell Environ. 2018, 41, 2183–2194. [Google Scholar] [CrossRef] [PubMed]
- Tang, H.; Ming, Z.; Liu, R.; Xiong, T.; Grevelding, C.G.; Dong, H.; Jiang, M. Development of Adult worms and granulomatous pathology are collectively regulated by t- and b-cells in mice infected with Schistosoma japonicum. PLoS ONE 2013, 8, e54432. [Google Scholar]
- Rakwal, R.; Hayashi, G.; Shibato, J.; Deepak, S.A.; Gundimeda, S.; Simha, U.; Padmanaban, A.; Gupta, R.; Han, S.; Kim, S.T.; et al. Progress toward rice seed OMICS in Low-level gamma radiation environment in iitate Village, Fukushima. J. Hered. 2018, 109, 206–211. [Google Scholar] [CrossRef] [PubMed]
- Pinheiro, C.; Sergeant, K.; Machado, C.M.; Renaut, J.; Ricardo, C.P. Two Traditional maize inbred lines of contrasting technological abilities are discriminated by the seed flour proteome. J. Proteome Res. 2013, 12, 3152–3165. [Google Scholar] [CrossRef]
- Niu, L.; Ding, H.; Zhang, J.; Wang, W. Proteomic analysis of starch biosynthesis in maize seeds. Starch - Stärke 2019, 71, 1800294. [Google Scholar] [CrossRef]
- Neuhoff, V.; Arold, N.; Taube, D.; Ehrhardt, W. Dependence of Particle and fiber properties. Electrophoresis 1988, 9, 255–262. [Google Scholar] [CrossRef]
- Frolov, A.; Blüher, M.; Hoffmann, R. Glycation sites of human plasma proteins are affected to different extents by hyperglycemic conditions in type 2 diabetes mellitus. Anal. Bioanal. Chem. 2014, 406, 5755–5763. [Google Scholar] [CrossRef]
- Romero-Rodríguez, M.C.; Jorrín-Novo, J.V.; Castillejo, M.A. Toward characterizing germination and early growth in the non-orthodox forest tree species Quercus ilex through complementary gel and gel-free proteomic analysis of embryo and seedlings. J. Proteomics 2019, 197, 60–70. [Google Scholar] [CrossRef]
- Chevalier, F. Standard dyes for total protein staining in gel-based proteomic analysis. Materials 2010, 3, 4784–4792. [Google Scholar] [CrossRef]
- Mortz, E.; Krogh, T.N.; Vorum, H.; Görg, A. Improved silver staining protocols for high sensitivity protein identification using matrix-assisted laser desorption/ionization-time of flight analysis. Proteomics 2001, 1, 1359–1363. [Google Scholar] [CrossRef]
- Chevallet, M.; Luche, S.; Strub, J.; Van Dorsselaer, A.; Rabilloud, T. Sweet silver: A formaldehyde-free silver staining using aldoses as developing agents, with enhanced compatibility with mass spectrometry. Proteomics 2008, 8, 4853–4861. [Google Scholar] [CrossRef] [PubMed]
- Puumalainen, T.J.; Puustinen, A.; Poikonen, S.; Turjanmaa, K.; Palosuo, T.; Vaali, K. Proteomic identification of allergenic seed proteins, napin and cruciferin, from cold-pressed rapeseed oils. Food Chem. 2015, 175, 381–385. [Google Scholar] [CrossRef] [PubMed]
- Berggren, K.; Chernokalskaya, E.; Steinberg, T.H.; Kemper, C.; Lopez, M.F.; Diwu, Z.; Haugland, R.P.; Patton, W.F. Background-free, high sensitivity staining of proteins in one- and two-dimensional sodium dodecyl sulfate-polyacrylamide gels using a luminescent ruthenium complex. Electrophoresis 2000, 21, 2509–2521. [Google Scholar] [CrossRef]
- Rabilloud, T.; Strub, J.; Luche, S.; Van Dorsselaer, A.; Lunardi, J. A comparison between Sypro Ruby and ruthenium II tris (bathophenanthroline disulfonate) as. Proteomics 2001, 1, 699–704. [Google Scholar] [CrossRef]
- Zhou, G.; Li, H.; DeCamp, D.; Chen, S.; Shu, H.; Gong, Y.; Flaig, M.; Gillespie, J.W.; Hu, N.; Taylor, P.R.; et al. 2D Differential In-gel electrophoresis for the identification of esophageal scans cell cancer-specific protein markers. Mol. Cell. Proteomics 2002, 1, 117–123. [Google Scholar] [CrossRef]
- Romero-Rodriguez, M.; Abril, N.; Sánchez-Lucas, R.; Jorrin Novo, J. V Multiplex staining of 2-DE gels for an initial phosphoproteome analysis of germinating seeds and early grown seedlings from a non-orthodox specie: Quercus ilex L. subsp. ballota [Desf.] Samp. Front. Plant Sci. 2015, 6, 620. [Google Scholar] [CrossRef]
- Klose, J.; Kobalz, U. Two-dimensional electrophoresis of proteins: An updated protocol and implications for a functional analysis of the genome. Electrophoresis 1995, 16, 1034–1059. [Google Scholar] [CrossRef]
- Gygi, S.P.; Corthals, G.L.; Zhang, Y.; Rochon, Y.; Aebersold, R. Evaluation of two-dimensional gel electrophoresis-based proteome analysis technology. Proc. Natl. Acad. Sci. USA 2000, 97, 9390–9395. [Google Scholar] [CrossRef]
- Chassaigne, H.; Trégoat, V.; Nørgaard, J.V.; Maleki, S.J.; van Hengel, A.J. Resolution and identification of major peanut allergens using a combination of fluorescence two-dimensional differential gel electrophoresis, Western blotting and Q-TOF mass spectrometry. J. Proteomics 2009, 72, 511–526. [Google Scholar] [CrossRef]
- Jorrin-Novo, J.V. Plant proteomics methods and protocols. In Plant Proteomics; Jorrin-Novo, J.V., Komatsu, S., Weckwerth, W., Wienkoop, S., Eds.; Humana Press: Totowa, NJ, USA, 2014; Volume 1072, ISBN 978-1-62703-630-6. [Google Scholar]
- Scippa, G.S.; Rocco, M.; Ialicicco, M.; Trupiano, D.; Viscosi, V.; Di Michele, M.; Arena, S.; Chiatante, D.; Scaloni, A. The proteome of lentil (Lens culinaris Medik.) seeds: Discriminating between landraces. Electrophoresis 2010, 31, 497–506. [Google Scholar] [CrossRef]
- Talamo, F.; D’Ambrosio, C.; Arena, S.; Del Vecchio, P.; Ledda, L.; Zehender, G.; Ferrara, L.; Scaloni, A. Proteins from bovine tissues and biological fluids: Defining a reference electrophoresis map for liver, kidney, muscle, plasma and red blood cells. Proteomics 2003, 3, 440–460. [Google Scholar] [CrossRef] [PubMed]
- Schönberg, A.; Rödiger, A.; Mehwald, W.; Galonska, J.; Christ, G.; Helm, S.; Thieme, D.; Majovsky, P.; Hoehenwarter, W.; Baginsky, S. Identification of STN7/STN8 kinase targets reveals connections between electron transport, metabolism and gene expression. Plant J. 2017, 90, 1176–1186. [Google Scholar] [CrossRef] [PubMed]
- Rosenfeld, J.; Capdevielle, J.; Guillemot, J.C.; Ferrara, P. In-gel digestion of proteins for internal analysis after one- or two-dimensional gel electrophoresis. Anal. Biochem. 1992, 203, 173–179. [Google Scholar] [CrossRef]
- Blum, H.; Beier, H.; Gross, H.J. Improved silver staining of plant proteins, RNA and DNA in polyacrylamide gels. Electrophoresis 1987, 8, 93–99. [Google Scholar] [CrossRef]
- Ogura, T.; Ogihara, J.; Sunairi, M.; Takeishi, H.; Aizawa, T.; Olivos-Trujillo, M.R.; Maureira-Butler, I.J.; Salvo-Garrido, H.E. Proteomic characterization of seeds from yellow lupin (Lupinus luteus L.). Proteomics 2014, 14, 1543–1546. [Google Scholar] [CrossRef] [PubMed]
- Gomes, L.S.; Senna, R.; Sandim, V.; Silva-Neto, M.A.C.; Perales, J.E.A.; Zingali, R.B.; Soares, M.R.; Fialho, E. Four conventional soybean [Glycine max (L.) Merrill] seeds exhibit different protein profiles as revealed by proteomic analysis. J. Agric. Food Chem. 2014, 62, 1283–1293. [Google Scholar] [CrossRef] [PubMed]
- Min, C.W.; Lee, S.H.; Cheon, Y.E.; Han, W.Y.; Ko, J.M.; Kang, H.W.; Kim, Y.C.; Agrawal, G.K.; Rakwal, R.; Gupta, R.; et al. In-depth proteomic analysis of Glycine max seeds during controlled deterioration treatment reveals a shift in seed metabolism. J. Proteomics 2017, 169, 125–135. [Google Scholar] [CrossRef]
- Swart, C.; Martínez-Jaime, S.; Gorka, M.; Zander, K.; Graf, A. Hit-gel: Streamlining in-gel protein digestion for high-throughput proteomics experiments. Sci. Rep. 2018, 8, 8582. [Google Scholar] [CrossRef]
- Mallick, P.; Schirle, M.; Chen, S.S.; Flory, M.R.; Lee, H.; Martin, D.; Ranish, J.; Raught, B.; Schmitt, R.; Werner, T.; et al. Computational prediction of proteotypic peptides for quantitative proteomics. Nat. Biotechnol. 2007, 25, 125–131. [Google Scholar] [CrossRef]
- Vandemoortele, G.; Staes, A.; Gonnelli, G.; Samyn, N.; De Sutter, D.; Vandermarliere, E.; Timmerman, E.; Gevaert, K.; Martens, L.; Eyckerman, S. An extra dimension in protein tagging by quantifying universal proteotypic peptides using targeted proteomics. Sci. Rep. 2016, 6, 27220. [Google Scholar] [CrossRef]
- Keerthikumar, S.; Mathivanan, S. Proteotypic Peptides and Their Applications. In Methods in Molecular Biology; Humana Press: New York, NY, USA, 2017; Volume 1549, pp. 101–107. [Google Scholar]
- Bhattacharya, A. Proteotypic Peptides. In Encyclopedia of Systems Biology; Dubitzky, W., Wolkenhauer, O., Cho, K.-H., Yokota, H., Eds.; Springer: New York, NY, USA, 2013; p. 1800. ISBN 978-1-4419-9863-7. [Google Scholar]
- Clauser, K.R.; Baker, P.; Burlingame, A.L. Role of accurate mass measurement (10 ppm ) in protein identification strategies employing MS or MS/MS and database searching. Anal. Chem. 1999, 71, 2871–2882. [Google Scholar] [CrossRef] [PubMed]
- Çakir, B.; Gülseren, İ. Identification of novel proteins from black cumin seed meals based on 2D gel electrophoresis and MALDI-TOF/TOF-MS analysis. Plant Foods Hum. Nutr. 2019, 74, 414–420. [Google Scholar] [CrossRef] [PubMed]
- Wu, W.W.; Wang, G.; Baek, S.J.; Shen, R.-F. Comparative study of three proteomic quantitative methods, DIGE, cICAT, and iTRAQ, using 2D gel- or LC−MALDI TOF/TOF. J. Proteome Res. 2006, 5, 651–658. [Google Scholar] [CrossRef] [PubMed]
- Wu, W.; Dai, R.-T.; Bendixen, E. Comparing SRM and SWATH methods for quantitation of bovine muscle proteomes. J. Agric. Food Chem. 2019, 67, 1608–1618. [Google Scholar] [CrossRef]
- Que, Y.; Xu, L.; Lin, J.; Ruan, M.; Zhang, M.; Chen, R. Differential protein expression in sugarcane during sugarcane- sporisorium scitamineum interaction revealed by 2-DE and MALDI-TOF-TOF/MS. Comp. Funct. Genomics 2011, 2011, 1–10. [Google Scholar] [CrossRef]
- Vadivel, A.K.A. Gel-based proteomics in plants: Time to move on from the tradition. Front. Plant Sci. 2015, 6, 369. [Google Scholar]
- Maaß, S.; Becher, D. Methods and applications of absolute protein quantification in microbial systems. J. Proteomics 2016, 136, 222–233. [Google Scholar] [CrossRef]
- Nedenskov Jensen, K.; Jessen, F.; Jørgensen, B.M. Multivariate Data analysis of two-dimensional gel electrophoresis protein patterns from few samples. J. Proteome Res. 2008, 7, 1288–1296. [Google Scholar] [CrossRef]
- Marengo, E.; Robotti, E.; Antonucci, F.; Cecconi, D.; Campostrini, N.; Righetti, P.G. Numerical approaches for quantitative analysis of two-dimensional maps: A review of commercial software and home-made systems. Proteome Sci. 2005, 5, 654–666. [Google Scholar] [CrossRef]
- Voss, T.; Haberl, P. Observations on the reproducibility and matching efficiency of two-dimensional electrophoresis gels: Consequences for comprehensive data analysis. Electrophoresis 2000, 21, 3345–3350. [Google Scholar] [CrossRef]
- Arentz, G.; Weiland, F.; Oehler, M.K.; Hoffmann, P. State of the art of 2D DIGE. Proteomics Clin. Appl. 2015, 9, 277–288. [Google Scholar] [CrossRef] [PubMed]
- Beckett, P. The Basics of 2D DIGE. In Difference Gel Electrophoresis (DIGE). Methods in Molecular Biology (Methods and Protocols); Humana Press: New York, NY, USA, 2012; Volume 854, pp. 9–19. [Google Scholar]
- Morgan, M.E.; Minden, J.S. Difference gel electrophoresis: A single gel method for detecting changes in protein extracts. Electrophoresis 1997, 18, 2071–2077. [Google Scholar]
- TripleTOF® 6600 System. Available online: https://sciex.com/products/mass-spectrometers/qtof-systems/tripletof-systems/tripletof-6600-system (accessed on 29 November 2020).
- Krokhin, O.V.; Ens, W.; Standing, K.G. MALDI QqTOF MS Combined with off-line HPLC for Characterization of protein primary structure and post-translational modifications. J. Biomol. Tech. 2005, 16, 427–438. [Google Scholar]
- Köcher, T.; Pichler, P.; Swart, R.; Mechtler, K. Analysis of protein mixtures from whole-cell extracts by single-run nanoLC-MS/MS using ultralong gradients. Nat. Protoc. 2012, 7, 882–890. [Google Scholar] [CrossRef] [PubMed]
- Burrieza, H.P.; Rizzo, A.J.; Moura Vale, E.; Silveira, V.; Maldonado, S. Shotgun proteomic analysis of quinoa seeds reveals novel lysine-rich seed storage globulins. Food Chem. 2019, 293, 299–306. [Google Scholar] [CrossRef]
- Frolov, A.; Henning, A.; Böttcher, C.; Tissier, A.; Strack, D.; Bo, C.; Tissier, A.; Strack, D.; Böttcher, C.; Tissier, A.; et al. An UPLC-MS/MS Method for the simultaneous identification and quantitation of cell wall phenolics in Brassica napus seeds. J. Agric. Food Chem. 2013, 61, 1219–1227. [Google Scholar] [CrossRef]
- Matthiesen, R.; Bunkenborg, J. Introduction to mass spectrometry-based proteomics. In Methods in Molecular Biology; Humana: New York, NY, USA, 2020; pp. 1–58. [Google Scholar]
- Vissers, J.P.C.; Chervet, J.P.; Salzmann, J.P. Sodium dodecyl sulphate removal from tryptic digest samples for on-line capillary liquid. J. Mass Spectrom. 1996, 31, 1021–1027. [Google Scholar] [CrossRef]
- Cole, R.B. Electrospray and MALDI Mass Spectrometry: Fundamentals, Instrumentation, Practicalities, and Biological Applications, 2nd ed; John Wiley & Sons, Inc.: Hoboken, NJ, USA, 2012; ISBN 9780471741077. [Google Scholar]
- Chen, E.I.; Cociorva, D.; Norris, J.L.; Yates, J.R. Optimization of mass spectrometry-compatible surfactants for shotgun proteomics. J. Proteome Res. 2007, 6, 2529–2538. [Google Scholar] [CrossRef]
- Lin, Y.; Jiang, H.; Yan, Y.; Peng, B.; Chen, J.; Lin, H.; Liu, Z. Shotgun analysis of membrane proteomes by an improved SDS-assisted sample preparation method coupled with liquid chromatography–tandem mass spectrometry. J. Chromatogr. B 2012, 911, 6–14. [Google Scholar] [CrossRef]
- Bilova, T.; Greifenhagen, U.; Paudel, G.; Lukasheva, E.; Brauch, D.; Osmolovskaya, N.; Tarakhovskaya, E.; Balcke, G.U.; Tissier, A.; Vogt, T.; et al. Glycation of plant proteins under environmental stress—Methodological approaches, potential mechanisms and biological role. In Abiotic and Biotic Stress in Plants—Recent Advances and Future Perspectives; InTech: London, UK, 2016. [Google Scholar] [CrossRef]
- Greifenhagen, U.; Frolov, A.; Blüher, M.; Hoffmann, R. Site-specific analysis of advanced glycation end products in plasma proteins of type 2 diabetes mellitus patients. Anal. Bioanal. Chem. 2016, 408, 5557–5566. [Google Scholar] [CrossRef]
- Bilova, T.; Lukasheva, E.; Brauch, D.; Greifenhagen, U.; Paudel, G.; Tarakhovskaya, E.; Frolova, N.; Mittasch, J.; Balcke, G.U.G.U.; Tissier, A.; et al. A Snapshot of the plant glycated proteome: Structural, functional and mechanistic aspect. J. Biol. Chem. 2016, 291, 7621–7636. [Google Scholar] [CrossRef]
- Takemori, N.; Takemori, A.; Ishizaki, J.; Hasegawa, H. Enzymatic protein digestion using a dissolvable polyacrylamide gel and its application to mass spectrometry-based proteomics. J. Chromatogr. B 2014, 967, 36–40. [Google Scholar] [CrossRef]
- Kalli, A.; Smith, T.; Sweredoski, M.J.; Hess, S. Evaluation and optimization of mass spectrometric settings during data-dependent acquisition mode: Focus on LTQ-orbitrap mass analyzers. J. Proteome Res. 2013, 12, 3071–3086. [Google Scholar] [CrossRef] [PubMed]
- Robinson, A.E.; Binek, A.; Venkatraman, V.; Searle, B.C.; Holewinski, R.J.; Rosenberger, G.; Parker, S.J.; Basisty, N.; Xie, X.; Lund, P.J.; et al. Lysine and arginine protein post-translational modifications by enhanced dia libraries: Quantification in murine liver disease. J. Proteome Res. 2020, 19, 4163–4178. [Google Scholar] [CrossRef] [PubMed]
- Majovsky, P.; Naumann, C.; Lee, C.; Lassowskat, I.; Trujillo, M.; Dissmeyer, N.; Hoehenwarter, W. Targeted Proteomics analysis of protein degradation in plant signaling on an LTQ-orbitrap mass spectrometer. J. Proteome Res. 2014, 13, 4246–4258. [Google Scholar] [CrossRef] [PubMed]
- Antonets, K.S.; Belousov, M.V.; Sulatskaya, A.I.; Belousova, M.E.; Kosolapova, A.O.; Sulatsky, M.I.; Andreeva, E.A.; Zykin, P.A.; Malovichko, Y.V.; Shtark, O.Y.; et al. Accumulation of storage proteins in plant seeds is mediated by amyloid formation. PLoS Biol. 2020, 18, e3000564. [Google Scholar] [CrossRef] [PubMed]
- Paudel, G.; Bilova, T.; Schmidt, R.; Greifenhagen, U.; Berger, R.; Tarakhovskaya, E.; Stöckhardt, S.; Balcke, G.U.; Humbeck, K.; Brandt, W.; et al. Osmotic stress is accompanied by protein glycation in Arabidopsis thaliana. J. Exp. Bot. 2016, 67, 6283–6295. [Google Scholar] [CrossRef]
- Hart-Smith, G. Combining Targeted and untargeted data acquisition to enhance quantitative plant proteomics experiments. In Plant Proteomics. Methods in Molecular Biology; Humana: New York, NY, USA, 2020; pp. 169–178. [Google Scholar]
- Juarez-Escobar, J.; Elizalde-Contreras, J.M.; Loyola-Vargas, V.M.; Ruiz-May, E. A Phosphoproteomic analysis pipeline for peels of tropical fruits. In Plant Proteomics. Methods in Molecular Biology; Humana: New York, NY, USA, 2020; pp. 179–196. [Google Scholar]
- Wilm, M. Quantitative proteomics in biological research. Proteomics 2009, 9, 4590–4605. [Google Scholar] [CrossRef]
- Ćeranić, A.; Doppler, M.; Büschl, C.; Parich, A.; Xu, K.; Koutnik, A.; Bürstmayr, H.; Lemmens, M.; Schuhmacher, R. Preparation of uniformly labelled 13C- and 15N-plants using customised growth chambers. Plant Methods 2020, 16, 46. [Google Scholar] [CrossRef]
- Liu, W.; Li, L.; Zhang, Z.; Dong, M.; Jin, W. iTRAQ-based quantitative proteomic analysis of transgenic and non-transgenic maize seeds. J. Food Compos. Anal. 2020, 92, 103564. [Google Scholar] [CrossRef]
- Chen, L.; Wang, Z.; Li, M.; Ma, X.; Tian, E.; Sun, A.; Yin, Y. Analysis of the natural dehydration mechanism during middle and late stages of wheat seeds development by some physiological traits and iTRAQ-based proteomic. J. Cereal Sci. 2018, 80, 102–110. [Google Scholar] [CrossRef]
- Nelson, C.J.; Hegeman, A.D.; Harms, A.C.; Sussman, M.R. A Quantitative analysis of arabidopsis plasma membrane using trypsin-catalyzed 18 O labeling. Mol. Cell. Proteomics 2006, 5, 1382–1395. [Google Scholar] [CrossRef] [PubMed]
- Picotti, P.; Bodenmiller, B.; Aebersold, R. Proteomics meets the scientific method. Nat. Methods 2013, 10, 24–27. [Google Scholar] [CrossRef] [PubMed]
- Wiśniewski, J.R.; Zougman, A.; Nagaraj, N.; Mann, M. Universal sample preparation method for proteome analysis. Nat. Methods 2009, 6, 359–362. [Google Scholar] [CrossRef] [PubMed]
- George, I.S.; Fennell, A.Y.; Haynes, P.A. Protein identification and quantification from riverbank grape, Vitis riparia: Comparing SDS-PAGE and FASP-GPF techniques for shotgun proteomic analysis. Proteomics 2015, 15, 3061–3065. [Google Scholar] [CrossRef]
- Zhang, N.; Zhang, H.-J.; Sun, Q.-Q.; Cao, Y.-Y.; Li, X.; Zhao, B.; Wu, P.; Guo, Y.-D. Proteomic analysis reveals a role of melatonin in promoting cucumber seed germination under high salinity by regulating energy production. Sci. Rep. 2017, 7, 503. [Google Scholar] [CrossRef]
- Lu, X.; Zhu, H. Tube-gel digestion. Mol. Cell. Proteomics 2005, 4, 1948–1958. [Google Scholar] [CrossRef]
- Fischer, R.; Kessler, B.M. Gel-aided sample preparation (GASP)—A simplified method for gel-assisted proteomic sample generation from protein extracts and intact cells. Proteomics 2015, 15, 1224–1229. [Google Scholar] [CrossRef]
- Muñoz-Talavera, A.; Gómez-Lim, M.Á.; Salazar-Olivo, L.A.; Reinders, J.; Lim, K.; Escobedo-Moratilla, A.; López-Calleja, A.C.; Islas-Carbajal, M.C.; Rincón-Sánchez, A.R. Expression of the biologically active insulin analog SCI-57 in Nicotiana benthamiana. Front. Pharmacol. 2019, 10. [Google Scholar] [CrossRef]
- Strader, M.B.; Tabb, D.L.; Hervey, W.J.; Pan, C.; Hurst, G.B. Efficient and specific trypsin digestion of microgram to nanogram quantities of proteins in organic−aqueous solvent systems. Anal. Chem. 2006, 78, 125–134. [Google Scholar] [CrossRef]
- Zhang, Y.; Fonslow, B.R.; Shan, B.; Baek, M.-C.; Yates, J.R. Protein Analysis by shotgun/bottom-up proteomics. Chem. Rev. 2013, 113, 2343–2394. [Google Scholar] [CrossRef] [PubMed]
- Wang, W.-Q.; Jensen, O.N.; Møller, I.M.; Hebelstrup, K.H.; Rogowska-Wrzesinska, A. Evaluation of sample preparation methods for mass spectrometry-based proteomic analysis of barley leaves. Plant Methods 2018, 14, 72. [Google Scholar] [CrossRef]
- Kołodziejczyk, I.; Dzitko, K.; Szewczyk, R.; Posmyk, M.M. Exogenous melatonin expediently modifies proteome of maize (Zea mays L.) embryo during seed germination. Acta Physiol. Plant. 2016, 38, 146. [Google Scholar] [CrossRef]
- Lin, Y.; Huo, L.; Liu, Z.; Li, J.; Liu, Y.; He, Q.; Wang, X.; Liang, S. Sodium laurate, a novel protease- and mass spectrometry-compatible detergent for mass spectrometry-based membrane proteomics. PLoS ONE 2013, 8, e59779. [Google Scholar] [CrossRef] [PubMed]
- Norris, J.L.; Porter, N.A.; Caprioli, R.M. Mass Spectrometry of intracellular and membrane proteins using cleavable detergents. Anal. Chem. 2003, 75, 6642–6647. [Google Scholar] [CrossRef] [PubMed]
- Zakowick, H.; Schagat, T.; Yoder, D.; Niles, A.L. Measuring cell health and viability sequentially by same-well multiplexing using the GloMax®-Multi Detection System. Promega Notes 2008, 99, 25–28. [Google Scholar]
- Technical Bulletin: ProteaseMAX(TM) Surfactant, Trypsin Enhancer; Promega Corporation: Madison, WI, USA, 2015; ISBN 6082744330.
- Li, M.; Powell, M.J.; Razunguzwa, T.T.; O’doherty, G.A. A general approach to anionic acid-labile surfactants with tunable properties. J. Org. Chem. 2010, 75, 6149–6153. [Google Scholar] [CrossRef]
- Ross, A.R.S.; Lee, P.J.; Smith, D.L.; Langridge, J.I.; Whetton, A.D.; Gaskell, S.J. Identification of proteins from two-dimensional polyacrylamide gels using a novel acid-labile surfactant. Proteomics 2002, 2, 928–936. [Google Scholar] [CrossRef]
- Jagadeeshaprasad, M.G.; Batkulwar, K.B.; Meshram, N.N.; Tiwari, S.; Korwar, A.M.; Unnikrishnan, A.G.; Kulkarni, M.J. Targeted quantification of N-1-(carboxymethyl) valine and N-1-(carboxyethyl) valine peptides of β-hemoglobin for better diagnostics in diabetes. Clin. Proteomics 2016, 13, 7. [Google Scholar] [CrossRef]
- Kaspar-Schoenefeld, S.; Merx, K.; Jozefowicz, A.M.; Hartmann, A.; Seiffert, U.; Weschke, W.; Matros, A.; Mock, H. Label-free proteome profiling reveals developmental-dependent patterns in young barley grains. J. Proteomics 2016, 143, 106–121. [Google Scholar] [CrossRef]
- Increase Analytical Accuracy LC/MS: Solvents, Blends, Standards, Surfactants; ThermoFisher Scientific, USA. Available online: https://beta-static.fishersci.com/content/dam/fishersci/en_US/documents/programs/scientific/brochures-and-catalogs/guides/lcms-solvents-guide.pdf (accessed on 29 November 2020).
- Waas, M.; Bhattacharya, S.; Chuppa, S.; Wu, X.; Jensen, D.R.R.; Omasits, U.; Wollscheid, B.; Volkman, B.F.; Noon, K.R.; Gundry, R.L. Combine and conquer: Surfactants, solvents, and chaotropes for robust mass spectrometry based analyses of membrane proteins. Anal. Chem. 2014, 86, 1551–1559. [Google Scholar] [CrossRef] [PubMed]
- Frolov, A.; Bilova, T.; Paudel, G.; Berger, R.; Balcke, G.U.G.U.; Birkemeyer, C.; Wessjohann, L.A.L.A. Early responses of mature Arabidopsis thaliana plants to reduced water potential in the agar-based polyethylene glycol infusion drought model. J. Plant Physiol. 2017, 208, 70–83. [Google Scholar] [CrossRef] [PubMed]
- Hogrebe, A.; von Stechow, L.; Bekker-Jensen, D.B.; Weinert, B.T.; Kelstrup, C.D.; Olsen, J. V Benchmarking common quantification strategies for large-scale phosphoproteomics. Nat. Commun. 2018, 9, 1045. [Google Scholar] [CrossRef] [PubMed]
- Dam, S.; Thaysen-Andersen, M.; Stenkjær, E.; Lorentzen, A.; Roepstorff, P.; Packer, N.H.; Stougaard, J. Combined N-glycome and N-glycoproteome analysis of the Lotus japonicus seed globulin fraction shows conservation of protein structure and glycosylation in legumes. J. Proteome Res. 2013, 12, 3383–3392. [Google Scholar] [CrossRef]
- Canterbury, J.D.; Merrihew, G.E.; Maccoss, M.J.; Goodlett, D.R.; Shaffer, S.A. Comparison of Data acquisition strategies on quadrupole ion trap instrumentation for shotgun proteomics. J. Am. Soc. Mass Spectrom. 2014, 25, 2048–2059. [Google Scholar] [CrossRef]
- Frolov, A.; Hoffmann, R. Analysis of Amadori peptides enriched by boronic acid affinity chromatography. Ann. N. Y. Acad. Sci. 2008, 1126, 253–256. [Google Scholar] [CrossRef]
- Manual 2D Quant Kit. Available online: https://www.gelifesciences.com/gehcls_images/GELS/RelatedContent/Files/1314729545976/litdoc28954714AE_20110830215136.pdf (accessed on 29 November 2020).
- Matamoros, M.A.; Kim, A.; Peñuelas, M.; Ihling, C.; Griesser, E.; Hoffmann, R.; Fedorova, M.; Frolov, A.; Becana, M. Protein carbonylation and glycation in legume nodules. Plant Physiol. 2018, 177, 1510–1528. [Google Scholar] [CrossRef]
- Plumb, R.S.; Johnson, K.A.; Rainville, P.; Smith, B.W.; Wilson, I.D.; Castro-Perez, J.M.; Nicholson, J.K. UPLC/MSE; a new approach for generating molecular fragment information for biomarker structure elucidation. Rapid Commun. Mass Spectrom. 2006, 20, 1989–1994. [Google Scholar] [CrossRef]
- Uvackova, L.; Skultety, L.; Bekesova, S.; McClain, S.; Hajduch, M. The MSE-proteomic analysis of gliadins and glutenins in wheat grain identifies and quantifies proteins associated with celiac disease and baker’s asthma. J. Proteomics 2013, 93, 65–73. [Google Scholar] [CrossRef]
- Ludwig, C.; Gillet, L.; Rosenberger, G.; Amon, S.; Collins, B.C.; Aebersold, R. Data-independent acquisition-based SWATH-MS for quantitative proteomics: A tutorial. Mol. Syst. Biol. 2018, 14, e8126. [Google Scholar] [CrossRef]
- Gillet, L.C.; Navarro, P.; Tate, S.; Ro, H.; Selevsek, N.; Reiter, L.; Bonner, R.; Aebersold, R.; Röst, H.; Selevsek, N.; et al. Targeted data extraction of the MS / MS spectra generated by data-independent acquisition: A new concept for consistent and accurate proteome analysis. Mol. Cell. Proteomics 2012, 11, 1–17. [Google Scholar] [CrossRef] [PubMed]
- Zhu, F.-Y.; Chen, M.-X.; Su, Y.-W.; Xu, X.; Ye, N.-H.; Cao, Y.-Y.; Lin, S.; Liu, T.-Y.; Li, H.-X.; Wang, G.-Q.; et al. SWATH-MS Quantitative analysis of proteins in the rice inferior and superior spikelets during grain filling. Front. Plant Sci. 2016, 7, 1926. [Google Scholar] [CrossRef] [PubMed]
- Bateman, N.W.; Goulding, S.P.; Shulman, N.J.; Gadok, A.K.; Szumlinski, K.K.; MacCoss, M.J.; Wu, C.C. Maximizing Peptide identification events in proteomic workflows using data-dependent acquisition (DDA). Mol. Cell. Proteomics 2014, 13, 329–338. [Google Scholar] [CrossRef] [PubMed]
- Zhu, W.; Smith, J.W.; Huang, C.-M. Mass spectrometry-based label-free quantitative proteomics. J. Biomed. Biotechnol. 2010, 2010, 1–6. [Google Scholar] [CrossRef]
- Nogueira, F.C.S.; Palmisano, G.; Soares, E.L.; Shah, M.; Soares, A.A.; Roepstorff, P.; Campos, F.A.P.; Domont, G.B. Proteomic profile of the nucellus of castor bean (Ricinus communis L.) seeds during development. J. Proteomics 2012, 75, 1933–1939. [Google Scholar] [CrossRef] [PubMed]
- Fercha, A.; Capriotti, A.L.; Caruso, G.; Cavaliere, C.; Samperi, R.; Stampachiacchiere, S.; Laganà, A. Comparative analysis of metabolic proteome variation in ascorbate-primed and unprimed wheat seeds during germination under salt stress. J. Proteomics 2014, 108, 238–257. [Google Scholar] [CrossRef]
- Gladilovich, V.; Greifenhagen, U.; Sukhodolov, N.; Selyutin, A.; Singer, D.; Thieme, D.; Majovsky, P.; Shirkin, A.; Hoehenwarter, W.; Bonitenko, E.; et al. Immobilized metal affinity chromatography on collapsed Langmuir-Blodgett iron(III) stearate films and iron(III) oxide nanoparticles for bottom-up phosphoproteomics. J. Chromatogr. A 2016, 1443, 181–190. [Google Scholar] [CrossRef]
- Kelstrup, C.D.; Bekker-jensen, D.B.; Arrey, T.N.; Hogrebe, A.; Harder, A.; Olsen, J. V Performance evaluation of the Q exactive HF - X for shotgun proteomics. J. Proteome Res. 2018, 17, 727–738. [Google Scholar] [CrossRef]
- Scheltema, R.A.; Hauschild, J.; Lange, O.; Hornburg, D.; Denisov, E.; Damoc, E.; Kuehn, A.; Makarov, A.; Mann, M.; Exactive, Q. The Q exactive HF, a benchtop mass spectrometer with a pre-filter, high-performance quadrupole and an ultra-high-field orbitrap. Mol Cell Proteomics 2014, 13, 3698–3708. [Google Scholar] [CrossRef]
- Shi, T.; Su, D.; Liu, T.; Tang, K.; Camp, D.G.; Qian, W.-J.; Smith, R.D. Advancing the sensitivity of selected reaction monitoring-based targeted quantitative proteomics. Proteomics 2012, 12, 1074–1092. [Google Scholar] [CrossRef]
- Nakamura, K.; Hirayama-Kurogi, M.; Ito, S.; Kuno, T.; Yoneyama, T.; Obuchi, W.; Terasaki, T.; Ohtsuki, S. Large-scale multiplex absolute protein quantification of drug-metabolizing enzymes and transporters in human intestine, liver, and kidney microsomes by SWATH-MS: Comparison with MRM/SRM and HR-MRM/PRM. Proteomics 2016, 16, 2106–2117. [Google Scholar] [CrossRef] [PubMed]
- Peterson, A.C.; Russell, J.D.; Bailey, D.J.; Westphall, M.S.; Coon, J.J. Parallel reaction monitoring for high resolution and high mass accuracy quantitative, targeted proteomics. Mol. Cell. Proteomics 2012, 11, 1475–1488. [Google Scholar] [CrossRef] [PubMed]
- Zargar, S.M.; Mahajan, R.; Nazir, M.; Nagar, P.; Kim, S.T.; Rai, V.; Masi, A.; Ahmad, S.M.; Shah, R.A.; Ganai, N.A.; et al. Common bean proteomics: Present status and future strategies. J. Proteomics 2017, 169, 239–248. [Google Scholar] [CrossRef] [PubMed]
- Mergner, J.; Frejno, M.; List, M.; Papacek, M.; Chen, X.; Chaudhary, A.; Samaras, P.; Richter, S.; Shikata, H.; Messerer, M.; et al. Mass-spectrometry-based draft of the Arabidopsis proteome. Nature 2020, 579, 409–414. [Google Scholar] [CrossRef] [PubMed]
- Rodríguez de Francisco, L.; Romero-Rodríguez, M.C.; Navarro-Cerrillo, R.M.; Miniño, V.; Perdomo, O.; Jorrín-Novo, J.V. Characterization of the orthodox Pinus occidentalis seed and pollen proteomes by using complementary gel-based and gel-free approaches. J. Proteomics 2016, 143, 382–389. [Google Scholar] [CrossRef] [PubMed]
- Nguyen, T.-P.; Cueff, G.; Hegedus, D.D.; Rajjou, L.; Bentsink, L. A role for seed storage proteins in Arabidopsis seed longevity. J. Exp. Bot. 2015, 66, 6399–6413. [Google Scholar] [CrossRef] [PubMed]
- Li, X.; Wang, W.; Chen, J. From pathways to networks: Connecting dots by establishing protein-protein interaction networks in signaling pathways using affinity purification and mass spectrometry. Proteomics 2015, 15, 188–202. [Google Scholar] [CrossRef]
- He, D.; Yang, P. Proteomics of rice seed germination. Front. Plant Sci. 2013, 4, 246. [Google Scholar] [CrossRef]
- Derouiche, A.; Cousin, C.; Mijakovic, I. Protein phosphorylation from the perspective of systems biology. Curr. Opin. Biotechnol. 2012, 23, 585–590. [Google Scholar] [CrossRef]
- Von Stechow, L.; Francavilla, C.; Olsen, J.V. Recent findings and technological advances in phosphoproteomics for cells and tissues. Expert Rev. Proteomics 2015, 12, 469–487. [Google Scholar] [CrossRef]
- Yin, X.; Wang, X.; Komatsu, S. Phosphoproteomics: Protein phosphorylation in regulation of seed germination and plant growth. Curr. Protein Pept. Sci. 2018, 19, 401–412. [Google Scholar] [CrossRef]
- Mouzo, D.; Bernal, J.; López-Pedrouso, M.; Franco, D.; Zapata, C. Advances in the biology of seed and vegetative storage proteins based on two-dimensional electrophoresis coupled to mass spectrometry. Molecules 2018, 23, 2462. [Google Scholar] [CrossRef]
- Agrawal, G.K.; Thelen, J.J. Large scale identification and quantitative profiling of phosphoproteins expressed during seed filling in oilseed rape. Mol. Cell. Proteomics 2006, 5, 2044–2059. [Google Scholar] [CrossRef]
- López-Pedrouso, M.; Alonso, J.; Zapata, C. Evidence for phosphorylation of the major seed storage protein of the common bean and its phosphorylation-dependent degradation during germination. Plant Mol. Biol. 2014, 84, 415–428. [Google Scholar] [CrossRef]
- Irar, S.; Oliveira, E.; Pagès, M.; Goday, A. Towards the identification of late-embryogenic-abundant phosphoproteome in Arabidopsis by 2-DE and MS. Proteomics 2006, 6, S175–S185. [Google Scholar] [CrossRef]
- Wan, L.; Ross, A.R.S.; Yang, J.; Hegedus, D.D.; Kermode, A.R. Phosphorylation of the 12 S globulin cruciferin in wild-type and abi1-1 mutant Arabidopsis thaliana (thale cress) seeds. Biochem. J. 2007, 404, 247–256. [Google Scholar] [CrossRef]
- Kuyama, H.; Toda, C.; Watanabe, M.; Tanaka, K.; Nishimura, O. An efficient chemical method for dephosphorylation of phosphopeptides. Rapid Commun. Mass Spectrom. 2003, 17, 1493–1496. [Google Scholar] [CrossRef]
- Kita, K.; Okumura, N.; Takao, T.; Watanabe, M.; Matsubara, T.; Nishimura, O.; Nagai, K. Evidence for phosphorylation of rat liver glucose-regulated protein 58, GRP58/ERp57/ER-60, induced by fasting and leptin. FEBS Lett. 2006, 580, 199–205. [Google Scholar] [CrossRef]
- Woo, E.M.; Fenyo, D.; Kwok, B.H.; Funabiki, H.; Chait, B.T. Efficient identification of phosphorylation by mass spectrometric phosphopeptide fingerprinting. Anal. Chem. 2008, 80, 2419–2425. [Google Scholar] [CrossRef]
- Bernal, J.; López-Pedrouso, M.; Franco, D.; Bravo, S.; García, L.; Zapata, C. Identification and mapping of phosphorylated isoforms of the major storage protein of potato based on two- dimensional electrophoresis. In Advances in Seed Biology; InTech: London, UK, 2017. [Google Scholar]
- Sinha, A.; Haider, T.; Narula, K.; Ghosh, S.; Chakraborty, N.; Chakraborty, S. Integrated seed proteome and phosphoproteome analyses reveal interplay of nutrient dynamics, carbon–nitrogen partitioning, and oxidative signaling in chickpea. Proteomics 2020, 20, 1900267. [Google Scholar] [CrossRef]
- Han, C.; Yang, P. Two dimensional gel electrophoresis-based plant phosphoproteomics. In Phospho-Proteomics. Methods in Molecular Biology; Springer: New York, NY, USA, 2016. [Google Scholar]
- Guo, G.; Lv, D.; Yan, X.; Subburaj, S.; Ge, P.; Li, X.; Hu, Y.; Yan, Y. Proteome characterization of developing grains in bread wheat cultivars (Triticum aestivum L.). BMC Plant Biol. 2012, 12, 147. [Google Scholar] [CrossRef]
- Han, C.; Wang, K.; Yang, P. Gel-Based Comparative phosphoproteomic analysis on rice embryo during germination. Plant Cell Physiol. 2014, 55, 1376–1394. [Google Scholar] [CrossRef]
- Li, M.; Yin, X.; Sakata, K.; Yang, P.; Komatsu, S. Proteomic analysis of phosphoproteins in the rice nucleus during the early stage of seed germination. J. Proteome Res. 2015, 14, 2884–2896. [Google Scholar] [CrossRef]
- Wang, Y.; Tong, X.; Qiu, J.; Li, Z.; Zhao, J.; Hou, Y.; Tang, L.; Zhang, J. A phosphoproteomic landscape of rice (Oryza sativa) tissues. Physiol. Plant. 2017, 160, 458–475. [Google Scholar] [CrossRef]
- Forzani, C.; Carreri, A.; De La Fuente Van Bentem, S.; Lecourieux, D.; Lecourieux, F.; Hirt, H. The Arabidopsis protein kinase Pto-interacting 1-4 is a common target of the oxidative signal-inducible 1 and mitogen-activated protein kinases. FEBS J. 2011, 278, 1126–1136. [Google Scholar] [CrossRef]
- Chen, Y.; Hoehenwarter, W. Rapid and reproducible phosphopeptide enrichment by tandem metal oxide affinity chromatography: Application to boron deficiency induced phosphoproteomics. Plant J. 2019, 98, 370–384. [Google Scholar] [CrossRef]
- Chang, I.F.; Hsu, J.L.; Hsu, P.H.; Sheng, W.A.; Lai, S.J.; Lee, C.; Chen, C.W.; Hsu, J.C.; Wang, S.Y.; Wang, L.Y.; et al. Comparative phosphoproteomic analysis of microsomal fractions of Arabidopsis thaliana and Oryza sativa subjected to high salinity. Plant Sci. 2012, 131–142. [Google Scholar] [CrossRef]
- Fíla, J.; Matros, A.; Radau, S.; Zahedi, R.P.; Čapková, V.; Mock, H.-P.; Honys, D. Revealing phosphoproteins playing role in tobacco pollen activated in vitro. Proteomics 2012, 12, 3229–3250. [Google Scholar] [CrossRef]
- Kurdyukov, D.A.; Chernova, E.N.; Russkikh, Y.V.; Eurov, D.A.; Sokolov, V.V.; Bykova, A.A.; Shilovskikh, V.V.; Keltsieva, O.A.; Ubyivovk, E.V.; Anufrikov, Y.A.; et al. Ni-functionalized submicron mesoporous silica particles as a sorbent for metal affinity chromatography. J. Chromatogr. A 2017, 1513, 140–148. [Google Scholar] [CrossRef]
- Yeh, T.-T.; Ho, M.-Y.; Chen, W.-Y.; Hsu, Y.-C.; Ku, W.-C.; Tseng, H.-W.; Chen, S.-T.; Chen, S.-F. Comparison of different fractionation strategies for in-depth phosphoproteomics by liquid chromatography tandem mass spectrometry. Anal. Bioanal. Chem. 2019, 411, 3417–3424. [Google Scholar] [CrossRef]
- Vu, L.D.; Zhu, T.; Verstraeten, I.; van de Cotte, B.; Gevaert, K.; De Smet, I. Temperature-induced changes in the wheat phosphoproteome reveal temperature-regulated interconversion of phosphoforms. J. Exp. Bot. 2018, 69, 4609–4624. [Google Scholar] [CrossRef] [PubMed]
- Qiu, J.; Hou, Y.; Tong, X.; Wang, Y.; Lin, H.; Liu, Q.; Zhang, W.; Li, Z.; Nallamilli, B.R.; Zhang, J. Quantitative phosphoproteomic analysis of early seed development in rice (Oryza sativa L.). Plant Mol. Biol. 2016, 90, 249–265. [Google Scholar] [CrossRef] [PubMed]
- Li, J.; Silva-Sanchez, C.; Zhang, T.; Chen, S.; Li, H. Phosphoproteomics technologies and applications in plant biology research. Front. Plant Sci. 2015, 6, 430. [Google Scholar] [CrossRef] [PubMed]
- Marcus, K. (Ed.) Quantitative Methods in Proteomics; Methods in Molecular Biology; Humana Press: Totowa, NJ, USA, 2012; Volume 893, ISBN 978-1-61779-884-9. [Google Scholar]
- Bindschedler, L.V.; Palmblad, M.; Cramer, R. Hydroponic isotope labelling of entire plants (HILEP) for quantitative plant proteomics; an oxidative stress case study. Phytochemistry 2008, 69, 1962–1972. [Google Scholar] [CrossRef] [PubMed]
- Hebeler, R.; Oeljeklaus, S.; Reidegeld, K.A.; Eisenacher, M.; Stephan, C.; Sitek, B.; Stühler, K.; Meyer, H.E.; Sturre, M.J.G.; Dijkwel, P.P.; et al. Study of early leaf senescence in arabidopsis thaliana by quantitative proteomics using reciprocal 14 N/ 15 N labeling and difference gel electrophoresis. Mol. Cell. Proteomics 2008, 7, 108–120. [Google Scholar] [CrossRef]
- Minkoff, B.B.; Stecker, K.E.; Sussman, M.R. Rapid Phosphoproteomic effects of abscisic acid (ABA) on wild-type and aba receptor-deficient A. thaliana mutants. Mol. Cell. Proteomics 2015, 14, 1169–1182. [Google Scholar] [CrossRef]
- Lewandowska, D.; ten Have, S.; Hodge, K.; Tillemans, V.; Lamond, A.I.; Brown, J.W.S. Plant SILAC: Stable-isotope labelling with amino acids of Arabidopsis seedlings for quantitative proteomics. PLoS ONE 2013, 8, e72207. [Google Scholar] [CrossRef]
- Wong, M.M.; Bhaskara, G.B.; Wen, T.-N.; Lin, W.-D.; Nguyen, T.T.; Chong, G.L.; Verslues, P.E. Phosphoproteomics of Arabidopsis highly ABA-induced1 identifies AT-Hook–Like10 phosphorylation required for stress growth regulation. Proc. Natl. Acad. Sci. USA 2019, 116, 2354–2363. [Google Scholar] [CrossRef]
- Li, H.; Han, J.; Pan, J.; Liu, T.; Parker, C.E.; Borchers, C.H. Current trends in quantitative proteomics - an update. J. Mass Spectrom. 2017, 52, 319–341. [Google Scholar] [CrossRef]
- Fan, S.; Meng, Y.; Song, M.; Pang, C.; Wei, H.; Liu, J.; Zhan, X.; Lan, J.; Feng, C.; Zhang, S.; et al. Quantitative Phosphoproteomics analysis of nitric oxide–responsive phosphoproteins in cotton leaf. PLoS ONE 2014, 9, e94261. [Google Scholar] [CrossRef]
- Zhang, G.-L.; Zhu, Y.; Fu, W.-D.; Wang, P.; Zhang, R.-H.; Zhang, Y.-L.; Song, Z.; Xia, G.-X.; Wu, J.-H. iTRAQ Protein profile differential analysis of dormant and germinated grassbur twin seeds reveals that ribosomal synthesis and carbohydrate metabolism promote germination possibly through the PI3K pathway. Plant Cell Physiol. 2016, 57, 1244–1256. [Google Scholar] [CrossRef] [PubMed]
- Moothoo-Padayachie, A.; Macdonald, A.; Varghese, B.; Pammenter, N.W.; Govender, P. Sershen uncovering the basis of viability loss in desiccation sensitive Trichilia dregeana seeds using differential quantitative protein expression profiling by iTRAQ. J. Plant Physiol. 2018, 221, 119–131. [Google Scholar] [CrossRef]
- Schoberer, J.; Strasser, R. Plant glyco-biotechnology. Semin. Cell Dev. Biol. 2018, 80, 133–141. [Google Scholar] [CrossRef]
- Aalberse, R.; Koshte, V.; Clemens, J. Immunoglobulin E antibodies that crossreact with vegetable foods, pollen, and Hymenoptera venom. J. Allergy Clin. Immunol. 1981, 68, 356–364. [Google Scholar] [CrossRef]
- La Fuente, M.D.; López-pedrouso, M.; Alonso, J.; Santalla, M.; De Ron, A.M.; Álvarez, G.; Zapata, C. In-depth characterization of the phaseolin protein diversity of common bean (Phaseolus vulgaris L.) Based on two-dimensional electrophoresis and mass spectrometry. Food Technol. Biotechnol. 2012, 50, 315–325. [Google Scholar]
- Mehta-D’souza, P. Detection of glycoproteins in polyacrylamide gels using Pro-Q Emerald 300 Dye, a fluorescent periodate schiff-base stain. In Protein Gel Detection and Imaging. Methods in Molecular Biology; Humana Press: New York, NY, USA, 2018; pp. 115–119. [Google Scholar]
- Weiss, W.; Postel, W.; Görg, A. Qualitative and quantitative changes in barley seed protein patterns during the malting process analyzed by sodium dodecyl sulfate-polyacrylamide gel electrophoresis with respect to malting quality. Electrophoresis 1992, 13, 787–797. [Google Scholar] [CrossRef]
- Weiss, W.; Postel, W.; Görg, A. Application of sequential extraction procedures and glycoprotein blotting for the characterization of the 2-D polypeptide patterns of barley seed proteins. Electrophoresis 1992, 13, 770–773. [Google Scholar] [CrossRef]
- Madera, M.; Mann, B.; Mechref, Y.; Novotny, M.V. Efficacy of glycoprotein enrichment by microscale lectin affinity chromatography. J. Sep. Sci. 2008, 31, 2722–2732. [Google Scholar] [CrossRef]
- Ostrowski, M.; Hetmann, A.; Jakubowska, A. Indole-3-acetic acid UDP-glucosyltransferase from immature seeds of pea is involved in modification of glycoproteins. Phytochemistry 2015, 117, 25–33. [Google Scholar] [CrossRef]
- Wang, T.; Hu, X.-C.; Cai, Z.-P.; Voglmeir, J.; Liu, L. Qualitative and quantitative analysis of carbohydrate modification on glycoproteins from seeds of Ginkgo biloba. J. Agric. Food Chem. 2017, 65, 7669–7679. [Google Scholar] [CrossRef]
- Rao, R.S.P.; Thelen, J.J.; Miernyk, J.A. Is Lys-Ne{open}-acetylation the next big thing in post-translational modifications? Trends Plant Sci. 2014, 19, 550–553. [Google Scholar] [CrossRef] [PubMed]
- Smith-Hammond, C.L.; Swatek, K.N.; Johnston, M.L.; Thelen, J.J.; Miernyk, J.A. Initial description of the developing soybean seed protein Lys-Nε-acetylome. J. Proteomics 2014, 96, 56–66. [Google Scholar] [CrossRef] [PubMed]
- He, D.; Wang, Q.; Li, M.; Damaris, R.N.; Yi, X.; Cheng, Z.; Yang, P. Global Proteome analyses of lysine acetylation and succinylation reveal the widespread involvement of both modification in metabolism in the embryo of germinating rice seed. J. Proteome Res. 2016, 15, 879–890. [Google Scholar] [CrossRef] [PubMed]
- Traverso, J.A.; Meinnel, T.; Giglione, C. Expanded impact of protein N-myristoylation in plants. Plant Signal. Behav. 2008, 3, 501–502. [Google Scholar] [CrossRef] [PubMed]
- Running, M.P. The role of lipid post–translational modification in plant developmental processes. Front. Plant Sci. 2014, 5, 50. [Google Scholar] [CrossRef]
- Kalemba, E.M.; Litkowiec, M. Functional characterization of a dehydrin protein from Fagus sylvatica seeds using experimental and in silico approaches. Plant Physiol. Biochem. 2015, 97, 246–254. [Google Scholar] [CrossRef]
- Friso, G.; van Wijk, K.J. Update: Post-translational protein modifications in plant metabolism. Plant Physiol. 2015, 169, 1469–1487. [Google Scholar] [CrossRef]
- Mann, M.; Højrup, P.; Roepstorff, P. Use of mass spectrometric molecular weight information to identify proteins in sequence databases. Biol. Mass Spectrom. 1993, 22, 338–345. [Google Scholar] [CrossRef]
- Henzel, W.J.; Watanabe, C.; Stults, J.T. Protein identification: The origins of peptide mass fingerprinting. J. Am. Soc. Mass Spectrom. 2003, 14, 931–942. [Google Scholar] [CrossRef]
- Eng, J.K.; McCormack, A.L.; Yates, J.R. An approach to correlate tandem mass spectral data of peptides with amino acid sequences in a protein database. J. Am. Soc. Mass Spectrom. 1994, 5, 976–989. [Google Scholar] [CrossRef]
- Cottrell, J.S. Protein identification using MS/MS data. J. Proteomics 2011, 74, 1842–1851. [Google Scholar] [CrossRef] [PubMed]
- Stein, S.E.; Scott, D.R. Optimization and testing of mass spectral library search algorithms for compound identification. J. Am. Soc. Mass Spectrom. 1994, 5, 859–866. [Google Scholar] [CrossRef]
- Collisionally induced dissociation of protonated peptide ions and the interpretation of product ion spectra. In Protein Sequencing and Identification Using Tandem Mass Spectrometry; Wiley Online Books; John Wiley & Sons, Inc.: Hoboken, NJ, USA, 2005; pp. 64–116. ISBN 9780471721987.
- Mann, M.; Wilm, M. Error-tolerant identification of peptides in sequence databases by peptide sequence tags. Anal. Chem. 1994, 66, 4390–4399. [Google Scholar] [CrossRef] [PubMed]
- Tabb, D.L. The SEQUEST family tree. J. Am. Soc. Mass Spectrom. 2015, 26, 1814–1819. [Google Scholar] [CrossRef] [PubMed]
- Perkins, D.N.; Pappin, D.J.C.; Creasy, D.M.; Cottrell, J.S. Probability-based protein identification by searching sequence databases using mass spectrometry data. Electrophoresis 1999, 20, 3551–3567. [Google Scholar] [CrossRef]
- Cox, J.; Neuhauser, N.; Michalski, A.; Scheltema, R.A.; Olsen, J.V.; Mann, M. Andromeda: A peptide search engine integrated into the MaxQuant environment. J. Proteome Res. 2011, 10, 1794–1805. [Google Scholar] [CrossRef] [PubMed]
- Eng, J.K.; Searle, B.C.; Clauser, K.R.; Tabb, D.L. A Face in the Crowd: Recognizing peptides through database search. Mol. Cell. Proteomics 2011, 10, R111.009522. [Google Scholar] [CrossRef]
- Moore, R.E.; Young, M.K.; Lee, T.D. Qscore: An algorithm for evaluating SEQUEST database search results. J. Am. Soc. Mass Spectrom. 2002, 13, 378–386. [Google Scholar] [CrossRef]
- Peng, J.; Elias, J.E.; Thoreen, C.C.; Licklider, L.J.; Gygi, S.P. Evaluation of multidimensional chromatography coupled with tandem mass spectrometry (LC/LC−MS/MS) for large-scale protein analysis: The yeast proteome. J. Proteome Res. 2003, 2, 43–50. [Google Scholar] [CrossRef]
- Reiter, L.; Claassen, M.; Schrimpf, S.P.; Jovanovic, M.; Schmidt, A.; Buhmann, J.M.; Hengartner, M.O.; Aebersold, R. Protein identification false discovery rates for very large proteomics data sets generated by tandem mass spectrometry. Mol. Cell. Proteomics 2009, 8, 2405–2417. [Google Scholar] [CrossRef]
- Savitski, M.M.; Wilhelm, M.; Hahne, H.; Kuster, B.; Bantscheff, M. A scalable approach for protein false discovery rate estimation in large proteomic data sets. Mol. Cell. Proteomics 2015, 14, 2394–2404. [Google Scholar] [CrossRef] [PubMed]
- Elias, J.E.; Gygi, S.P. Target-decoy search strategy for increased confidence in large-scale protein identifications by mass spectrometry. Nat. Methods 2007, 4, 207–214. [Google Scholar] [CrossRef] [PubMed]
- Sinitcyn, P.; Rudolph, J.D.; Cox, J. Computational Methods for understanding mass spectrometry–based shotgun proteomics data. Annu. Rev. Biomed. Data Sci. 2018, 1, 207–234. [Google Scholar] [CrossRef]
- Angel, T.E.; Aryal, U.K.; Hengel, S.M.; Baker, E.S.; Kelly, R.T.; Robinson, E.W.; Smith, R.D. Mass spectrometry-based proteomics: Existing capabilities and future directions. Chem. Soc. Rev. 2012, 41, 3912. [Google Scholar] [CrossRef]
- Hansen, B.T.; Davey, S.W.; Ham, A.-J.L.; Liebler, D.C. P-Mod: An algorithm and software to map modifications to peptide sequences using tandem MS data. J. Proteome Res. 2005, 4, 358–368. [Google Scholar] [CrossRef]
- Kertesz, V.; Connelly, H.M.; Erickson, B.K.; Hettich, R.L. PTMSearchPlus: Software tool for automated protein identification and post-translational modification characterization by integrating accurate intact protein mass and bottom-up mass spectrometric data searches. Anal. Chem. 2009, 81, 8387–8395. [Google Scholar] [CrossRef]
- Na, S.; Paek, E. Software eyes for protein post-translational modifications. Mass Spectrom. Rev. 2015, 34, 133–147. [Google Scholar] [CrossRef]
- Medzihradszky, K.F.; Chalkley, R.J. Lessons in de novo peptide sequencing by tandem mass spectrometry. Mass Spectrom. Rev. 2015, 34, 43–63. [Google Scholar] [CrossRef]
- Jeong, K.; Kim, S.; Pevzner, P.A. UniNovo: A universal tool for de novo peptide sequencing. Bioinformatics 2013, 29, 1953–1962. [Google Scholar] [CrossRef]
- Hu, J. The importance of experimental design in proteomic mass spectrometry experiments: Some cautionary tales. Briefings Funct. Genomics Proteomics 2005, 3, 322–331. [Google Scholar] [CrossRef]
- Schulze, W.X.; Usadel, B. Quantitation in mass-spectrometry-based proteomics. Annu. Rev. Plant Biol. 2010, 61, 491–516. [Google Scholar] [CrossRef]
- Oda, Y.; Huang, K.; Cross, F.R.; Cowburn, D.; Chait, B.T. Accurate quantitation of protein expression and site-specific phosphorylation. Proc. Natl. Acad. Sci. USA 1999, 96, 6591–6596. [Google Scholar] [CrossRef] [PubMed]
- Nahnsen, S.; Bielow, C.; Reinert, K.; Kohlbacher, O. Tools for label-free peptide quantification. Mol. Cell. Proteomics 2013, 12, 549–556. [Google Scholar] [CrossRef] [PubMed]
- Mueller, L.N.; Rinner, O.; Schmidt, A.; Letarte, S.; Bodenmiller, B.; Brusniak, M.-Y.; Vitek, O.; Aebersold, R.; Müller, M. SuperHirn – a novel tool for high resolution LC-MS-based peptide/protein profiling. Proteomics 2007, 7, 3470–3480. [Google Scholar] [CrossRef] [PubMed]
- Cox, J.; Mann, M. MaxQuant enables high peptide identification rates, individualized p.p.b.-range mass accuracies and proteome-wide protein quantification. Nat. Biotechnol. 2008, 26, 1367–1372. [Google Scholar] [CrossRef]
- Progenesis QI User Guide: Analysis Workflow Guidelines for DDA Data. Available online: http://www.nonlinear.com/progenesis/qi-for-proteomics/v4.1/user-guide/ (accessed on 29 November 2020).
- Bertsch, A.; Gröpl, C.; Reinert, K.; Kohlbacher, O. OpenMS and TOPP: Open source software for LC-MS data analysis. In Data Mining in Proteomics. Methods in Molecular Biology (Methods and Protocols); Hamacher, M., Eisenacher, M., Stephan, C., Eds.; Humana Press: Totowa, NJ, USA, 2011; pp. 353–367. ISBN 978-1-60761-987-1. [Google Scholar]
- Available online: https://www.thermofisher.com (accessed on 29 November 2020).
- Available online: http://tools.proteomecenter.org/software.php (accessed on 29 November 2020).
- Ishihama, Y.; Oda, Y.; Tabata, T.; Sato, T.; Nagasu, T.; Rappsilber, J.; Mann, M. Exponentially modified protein abundance index (emPAI) for estimation of absolute protein amount in proteomics by the number of sequenced peptides per protein. Mol. Cell. Proteomics 2005, 4, 1265–1272. [Google Scholar] [CrossRef]
- Braisted, J.C.; Kuntumalla, S.; Vogel, C.; Marcotte, E.M.; Rodrigues, A.R.; Wang, R.; Huang, S.-T.; Ferlanti, E.S.; Saeed, A.I.; Fleischmann, R.D.; et al. The APEX quantitative proteomics tool: Generating protein quantitation estimates from LC-MS/MS proteomics results. BMC Bioinform. 2008, 9, 529. [Google Scholar] [CrossRef]
- Sun, A.; Zhang, J.; Wang, C.; Yang, D.; Wei, H.; Zhu, Y.; Jiang, Y.; He, F. Modified spectral count index (mSCI) for Estimation of protein abundance by protein relative identification possibility (RIPpro): A new proteomic technological parameter. J. Proteome Res. 2009, 8, 4934–4942. [Google Scholar] [CrossRef]
- Silva, J.C.; Gorenstein, M.V.; Li, G.-Z.; Vissers, J.P.C.; Geromanos, S.J. Absolute quantification of proteins by LCMS E. Mol. Cell. Proteomics 2006, 5, 144–156. [Google Scholar] [CrossRef]
- Clough, T.; Key, M.; Ott, I.; Ragg, S.; Schadow, G.; Vitek, O. Protein quantification in label-free LC-MS experiments. J. Proteome Res. 2009, 8, 5275–5284. [Google Scholar] [CrossRef]
- Monroe, M.E.; Tolić, N.; Jaitly, N.; Shaw, J.L.; Adkins, J.N.; Smith, R.D. VIPER: An advanced software package to support high-throughput LC-MS peptide identification. Bioinformatics 2007, 23, 2021–2023. [Google Scholar] [CrossRef] [PubMed]
- Pluskal, T.; Castillo, S.; Villar-Briones, A.; Orešič, M. MZmine 2: Modular framework for processing, visualizing, and analyzing mass spectrometry-based molecular profile data. BMC Bioinform. 2010, 11, 395. [Google Scholar] [CrossRef] [PubMed]
- Bairoch, A.; Apweiler, R. The SWISS-PROT protein sequence data bank and its supplement TrEMBL in 1999. Nucleic Acids Res. 1999, 27, 49–54. [Google Scholar] [CrossRef] [PubMed]
- Simpson, J.C.; Pepperkok, R. Localizing the proteome. Genome Biol. 2003, 4, 240. [Google Scholar] [CrossRef] [PubMed][Green Version]
- Huh, W.-K.; Falvo, J.V.; Gerke, L.C.; Carroll, A.S.; Howson, R.W.; Weissman, J.S.; O’Shea, E.K. Global analysis of protein localization in budding yeast. Nature 2003, 425, 686–691. [Google Scholar] [CrossRef]
- Yu, C.-S.; Chen, Y.-C.; Lu, C.-H.; Hwang, J.-K. Prediction of protein subcellular localization. Proteins Struct. Funct. Bioinforma. 2006, 64, 643–651. [Google Scholar] [CrossRef] [PubMed]
- Horton, P.; Park, K.-J.; Obayashi, T.; Fujita, N.; Harada, H.; Adams-Collier, C.J.; Nakai, K. WoLF PSORT: Protein localization predictor. Nucleic Acids Res. 2007, 35, W585–W587. [Google Scholar] [CrossRef]
- Briesemeister, S.; Rahnenführer, J.; Kohlbacher, O. YLoc—An interpretable web server for predicting subcellular localization. Nucleic Acids Res. 2010, 38, W497–W502. [Google Scholar] [CrossRef]
- Savojardo, C.; Martelli, P.L.; Fariselli, P.; Profiti, G.; Casadio, R. BUSCA: An integrative web server to predict subcellular localization of proteins. Nucleic Acids Res. 2018, 46, W459–W466. [Google Scholar] [CrossRef]
- Sperschneider, J.; Catanzariti, A.-M.; DeBoer, K.; Petre, B.; Gardiner, D.M.; Singh, K.B.; Dodds, P.N.; Taylor, J.M. LOCALIZER: Subcellular localization prediction of both plant and effector proteins in the plant cell. Sci. Rep. 2017, 7, 44598. [Google Scholar] [CrossRef]
- Chou, K.-C.; Shen, H.-B. Plant-mPLoc: A Top-Down Strategy to Augment the Power for Predicting Plant Protein Subcellular Localization. PLoS ONE 2010, 5, e11335. [Google Scholar] [CrossRef] [PubMed]
- Käll, L.; Krogh, A.; Sonnhammer, E.L. A combined transmembrane topology and signal peptide prediction method. J. Mol. Biol. 2004, 338, 1027–1036. [Google Scholar] [CrossRef] [PubMed]
- Bateman, A.; Martin, M.J.; O’Donovan, C.; Magrane, M.; Alpi, E.; Antunes, R.; Bely, B.; Bingley, M.; Bonilla, C.; Britto, R.; et al. UniProt: The universal protein knowledgebase. Nucleic Acids Res. 2017, 45, D158–D169. [Google Scholar]
- Kanehisa, M.; Goto, S.; Sato, Y.; Kawashima, M.; Furumichi, M.; Tanabe, M. Data, information, knowledge and principle: Back to metabolism in KEGG. Nucleic Acids Res. 2014, 42, D199–D205. [Google Scholar] [CrossRef] [PubMed]
- Ogata, H.; Goto, S.; Sato, K.; Fujibuchi, W.; Bono, H.; Kanehisa, M. KEGG: Kyoto encyclopedia of genes and genomes. Nucleic Acids Res. 1999, 27, 29–34. [Google Scholar] [CrossRef]
- Klie, S.; Nikoloski, Z. The Choice between mapman and gene ontology for automated gene function prediction in plant science. Front. Genet. 2012, 3. [Google Scholar] [CrossRef]
- Kanehisa, M.; Sato, Y.; Morishima, K. BlastKOALA and GhostKOALA: KEGG tools for functional characterization of genome and metagenome sequences. J. Mol. Biol. 2016, 428, 726–731. [Google Scholar] [CrossRef]
- Kanehisa, M.; Sato, Y.; Kawashima, M.; Furumichi, M.; Tanabe, M. KEGG as a reference resource for gene and protein annotation. Nucleic Acids Res. 2016, 44, D457–D462. [Google Scholar] [CrossRef]
- Mi, H.; Muruganujan, A.; Huang, X.; Ebert, D.; Mills, C.; Guo, X.; Thomas, P.D. Protocol update for large-scale genome and gene function analysis with the PANTHER classification system (v.14.0). Nat. Protoc. 2019, 14, 703–721. [Google Scholar] [CrossRef]
- Usadel, B.; Poree, F.; Nagel, A.; Lohse, M.; Czedik-Eysenberg, A.; Stitt, M. A guide to using MapMan to visualize and compare omics data in plants: A case study in the crop species, maize. Plant. Cell Environ. 2009, 32, 1211–1229. [Google Scholar] [CrossRef]
- Lohse, M.; Nagel, A.; Herter, T.; May, P.; Schroda, M.; Zrenner, R.; Tohge, T.; Fernie, A.R.; Stitt, M.; Usadel, B. Mercator: A fast and simple web server for genome scale functional annotation of plant sequence data. Plant. Cell Environ. 2014, 37, 1250–1258. [Google Scholar] [CrossRef] [PubMed]
- Saha, I.; Klingström, T.; Forsberg, S.; Wikander, J.; Zubek, J.; Kierczak, M.; Plewczynski, D. Evaluation of machine learning algorithms on protein-protein interactions. In Advances in Intelligent Systems and Computing; Springer: Cham, Switzerland, 2014; pp. 211–218. ISBN 9783319023083. [Google Scholar]
- Hayashi, T.; Matsuzaki, Y.; Yanagisawa, K.; Ohue, M.; Akiyama, Y. MEGADOCK-Web: An integrated database of high-throughput structure-based protein-protein interaction predictions. BMC Bioinform. 2018, 19, 62. [Google Scholar] [CrossRef] [PubMed]
- Liu, S.; Liu, C.; Deng, L. Machine Learning approaches for protein–protein interaction hot spot prediction: Progress and comparative assessment. Molecules 2018, 23, 2535. [Google Scholar] [CrossRef] [PubMed]
- Schrader, M. Origins, technological development, and applications of peptidomics. In Methods in Molecular Biology; Springer: Berlin/Heidelberg, Germany, 2018. [Google Scholar]
- Ohyama, K.; Ogawa, M.; Matsubayashi, Y. Identification of a biologically active, small, secreted peptide in Arabidopsis by in silico gene screening, followed by LC-MS-based structure analysis. Plant J. 2008, 55, 152–160. [Google Scholar] [CrossRef] [PubMed]
- Farrokhi, N.; Whitelegge, J.P.; Brusslan, J.A. Plant peptides and peptidomics. Plant Biotechnol. J. 2008, 6, 105–134. [Google Scholar] [CrossRef]
- Segonzac, C.; Monaghan, J. Modulation of plant innate immune signaling by small peptides. Curr. Opin. Plant Biol. 2019, 51, 22–28. [Google Scholar] [CrossRef]
- Pan, S.; Agyei, D.; Jeevanandam, J.; Danquah, M.K. Bio-active peptides: Role in plant growth and defense. In Natural Bio-Active Compounds; Springer: Singapore, 2019; pp. 1–29. [Google Scholar]
- Gancheva, M.S.; Malovichko, Y.V.; Poliushkevich, L.O.; Dodueva, I.E.; Lutova, L.A. Plant peptide hormones. Russ. J. Plant Physiol. 2019, 66, 171–189. [Google Scholar] [CrossRef]
- Stührwohldt, N.; Schaller, A. Regulation of plant peptide hormones and growth factors by post-translational modification. Plant Biol. 2019, 21, 49–63. [Google Scholar] [CrossRef]
- Oh, E.; Seo, P.J.; Kim, J. Signaling peptides and receptors coordinating plant root development. Trends Plant Sci. 2018, 23, 337–351. [Google Scholar] [CrossRef]
- Pan, H.; Wang, D. Nodule cysteine-rich peptides maintain a working balance during nitrogen-fixing symbiosis. Nat. Plants 2017, 3, 17048. [Google Scholar] [CrossRef]
- Ayala-Niño, A.; Rodríguez-Serrano, G.M.; González-Olivares, L.G.; Contreras-López, E.; Regal-López, P.; Cepeda-Saez, A. Sequence Identification of bioactive peptides from amaranth seed proteins (Amaranthus hypochondriacus spp.). Molecules 2019, 24, 3033. [Google Scholar] [CrossRef] [PubMed]
- Sharma, S.; Verma, H.N.; Sharma, N.K. Cationic bioactive peptide from the seeds of Benincasa hispida. Int. J. Pept. 2014, 2014, 1–12. [Google Scholar] [CrossRef] [PubMed]
- Maruyama, N.; Mikami, B.; Utsumi, S. The development of transgenic crops to improve human health by advanced utilization of seed storage proteins. Biosci. Biotechnol. Biochem. 2011, 75, 823–828. [Google Scholar] [CrossRef] [PubMed]
- Prak, K.; Maruyama, Y.; Maruyama, N.; Utsumi, S. Design of genetically modified soybean proglycinin A1aB1b with multiple copies of bioactive peptide sequences. Peptides 2006, 27, 1179–1186. [Google Scholar] [CrossRef]
- Pu, C.; Tang, W. The antibacterial and antibiofilm efficacies of a liposomal peptide originating from rice bran protein against: Listeria monocytogenes. Food Funct. 2017, 8, 4159–4169. [Google Scholar] [CrossRef]
- Chai, T.-T.; Tan, Y.-N.; Ee, K.-Y.; Xiao, J.; Wong, F.-C. Seeds, fermented foods, and agricultural by-products as sources of plant-derived antibacterial peptides. Crit. Rev. Food Sci. Nutr. 2019, 59, S162–S177. [Google Scholar] [CrossRef]
- Yang, J.; Hu, L.; Cai, T.; Chen, Q.; Ma, Q.; Yang, J.; Meng, C.; Hong, J. Purification and identification of two novel antioxidant peptides from perilla (Perilla frutescens L. Britton) seed protein hydrolysates. PLoS ONE 2018, 13, e0200021. [Google Scholar] [CrossRef]
- Ye, N.; Hu, P.; Xu, S.; Chen, M.; Wang, S.; Hong, J.; Chen, T.; Cai, T. Preparation and characterization of antioxidant peptides from carrot seed protein. J. Food Qual. 2018, 2018, 1–9. [Google Scholar] [CrossRef]
- Aguilar-Toalá, J.E.; Liceaga, A.M. Identification of chia seed (Salvia hispanica L.) peptides with enzyme inhibition activity towards skin-aging enzymes. Amino Acids 2020, 52, 1149–1159. [Google Scholar] [CrossRef]
- Dallas, D.C.; Guerrero, A.; Parker, E.A.; Robinson, R.C.; Gan, J.; German, J.B.; Barile, D.; Lebrilla, C.B. Current peptidomics: Applications, purification, identification, quantification, and functional analysis. Proteomics 2015, 15, 1026–1038. [Google Scholar] [CrossRef]
- Smith, C.A.; Want, E.J.; O’Maille, G.; Abagyan, R.; Siuzdak, G. XCMS: Processing mass spectrometry data for metabolite profiling using nonlinear peak alignment, matching, and identification. Anal. Chem. 2006, 78, 779–787. [Google Scholar] [CrossRef] [PubMed]
- Meyrand, M.; Dallas, D.C.; Caillat, H.; Bouvier, F.; Martin, P.; Barile, D. Comparison of milk oligosaccharides between goats with and without the genetic ability to synthesize αs1-casein. Small Rumin. Res. 2013, 113, 411–420. [Google Scholar] [CrossRef] [PubMed]
- Guerrero, A.; Dallas, D.C.; Contreras, S.; Chee, S.; Parker, E.A.; Sun, X.; Dimapasoc, L.; Barile, D.; German, J.B.; Lebrilla, C.B. Mechanistic Peptidomics: Factors that dictate specificity in the formation of endogenous peptides in human milk. Mol. Cell. Proteomics 2014, 13, 3343–3351. [Google Scholar] [CrossRef] [PubMed]
- Kaur, H.; Garg, A.; Raghava, G.P.S. Raghava PEPstr: A de novo method for tertiary structure prediction of small bioactive peptides. Protein Pept. Lett. 2007, 14, 626–631. [Google Scholar] [CrossRef]
- Thévenet, P.; Shen, Y.; Maupetit, J.; Guyon, F.; Derreumaux, P.; Tufféry, P. PEP-FOLD: An updated de novo structure prediction server for both linear and disulfide bonded cyclic peptides. Nucleic Acids Res. 2012, 40, W288–W293. [Google Scholar] [CrossRef]
- Beaufays, J.; Lins, L.; Thomas, A.; Brasseur, R. In silico predictions of 3D structures of linear and cyclic peptides with natural and non-proteinogenic residues. J. Pept. Sci. 2012, 18, 17–24. [Google Scholar] [CrossRef]
- Wienkoop, S.; Staudinger, C.; Hoehenwarter, W.; Weckwerth, W.; Egelhofer, V. ProMEX—A mass spectral reference database for plant proteomics. Front. Plant Sci. 2012, 3, 3. [Google Scholar] [CrossRef]
- Colgrave, M.L.; Poth, A.G.; Kaas, Q.; Craik, D.J. A new “era” for cyclotide sequencing. Biopolymers 2010, 94, 592–601. [Google Scholar] [CrossRef]
- Fesenko, I.A.; Arapidi, G.P.; Skripnikov, A.Y.; Alexeev, D.G.; Kostryukova, E.S.; Manolov, A.I.; Altukhov, I.A.; Khazigaleeva, R.A.; Seredina, A.V.; Kovalchuk, S.I.; et al. Specific pools of endogenous peptides are present in gametophore, protonema, and protoplast cells of the moss Physcomitrella patens. BMC Plant Biol. 2015, 15, 1–16. [Google Scholar] [CrossRef]
- Del Río, L.A. ROS and RNS in plant physiology: An overview. J. Exp. Bot. 2015, 66, 2827–2837. [Google Scholar] [CrossRef]
- Turkan, I. ROS and RNS: Key signalling molecules in plants. J. Exp. Bot. 2018, 69, 3313–3315. [Google Scholar] [CrossRef] [PubMed]
- Birben, E.; Sahiner, U.M.; Sackesen, C.; Erzurum, S.; Kalayci, O. Oxidative stress and antioxidant defense. World Allergy Organ. J. 2012, 5, 9–19. [Google Scholar] [CrossRef] [PubMed]
- Mock, H.P.; Dietz, K.J. Redox proteomics for the assessment of redox-related posttranslational regulation in plants. Biochim. Biophys. Acta Proteins Proteomics 2016, 1864, 967–973. [Google Scholar] [CrossRef] [PubMed]
- Dietz, K.J. Peroxiredoxins in plants and cyanobacteria. Antioxid. Redox Signal. 2011, 15, 1129–1159. [Google Scholar] [CrossRef] [PubMed]
- Huang, J.; Willems, P.; Wei, B.; Tian, C.; Ferreira, R.B.; Bodra, N.; Martínez Gache, S.A.; Wahni, K.; Liu, K.; Vertommen, D.; et al. Mining for protein S-sulfenylation in Arabidopsis uncovers redox-sensitive sites. Proc. Natl. Acad. Sci. USA 2019, 116, 21256–21261. [Google Scholar] [CrossRef]
- Wang, H.; Wang, S.; Lu, Y.; Alvarez, S.; Hicks, L.M.; Ge, X.; Xia, Y. Proteomic analysis of early-responsive redox-sensitive proteins in Arabidopsis. J. Proteome Res. 2012, 11, 412–424. [Google Scholar] [CrossRef] [PubMed]
- Akter, S.; Carpentier, S.; Van Breusegem, F.; Messens, J. Identification of dimedone-trapped sulfenylated proteins in plants under stress. Biochem. Biophys. Reports 2017, 9, 106–113. [Google Scholar] [CrossRef]
- De Smet, B.; Willems, P.; Fernandez-Fernandez, A.D.; Alseekh, S.; Fernie, A.R.; Messens, J.; Van Breusegem, F. In vivo detection of protein cysteine sulfenylation in plastids. Plant J. 2019, 97, 765–778. [Google Scholar] [CrossRef]
- Akter, S.; Fu, L.; Jung, Y.; Lo Conte, M.; Lawson, J.R.; Lowther, W.T.; Sun, R.; Liu, K.; Yang, J.; Carroll, K.S. Chemical proteomics reveals new targets of cysteine sulfinic acid reductase. Nat. Chem. Biol. 2018, 14, 995–1004. [Google Scholar] [CrossRef]
- Nietzel, T.; Mostertz, J.; Ruberti, C.; Née, G.; Fuchs, P.; Wagner, S.; Moseler, A.; Müller-Schüssele, S.J.; Benamar, A.; Poschet, G.; et al. Redox-mediated kick-start of mitochondrial energy metabolism drives resource-efficient seed germination. Proc. Natl. Acad. Sci. USA 2020, 117, 741–751. [Google Scholar] [CrossRef]
- Ratajczak, E.; Staszak, A.; Wojciechowska, N.; Bagniewska-Zadworna, A.; Dietz, K. Regulation of thiol metabolism as a factor that influences the development and storage capacity of beech seeds. J. Plant Physiol. 2019, 239, 61–70. [Google Scholar] [CrossRef] [PubMed]
- Ratajczak, E.; Małecka, A.; Ciereszko, I.; Staszak, A. Mitochondria are important determinants of the aging of seeds. Int. J. Mol. Sci. 2019, 20, 1568. [Google Scholar] [CrossRef] [PubMed]
- Smolikova, G.; Kreslavski, V.; Shiroglazova, O.; Bilova, T.; Sharova, E.; Frolov, A.; Medvedev, S. Photochemical activity changes accompanying the embryogenesis of pea (Pisum sativum) with yellow and green cotyledons. Funct. Plant Biol. 2018, 45, 228. [Google Scholar] [CrossRef] [PubMed]
- Landry, E.J.; Fuchs, S.J.; Hu, J. Carbohydrate composition of mature and immature faba bean seeds. J. Food Compos. Anal. 2016, 50, 55–60. [Google Scholar] [CrossRef]
- Bailly, C.; Kraner, I. Analyses of ROS and antioxidants in relation to seed longevity and germination. In Seed Dormancy:Methods and Protocols; Kermode, A.R., Ed.; Springer: Berlin/Heidelberg, Germany, 2011; pp. 343–367. [Google Scholar]
- Oracz, K.; Bouteau, H.E.-M.; Farrant, J.M.; Cooper, K.; Belghazi, M.; Job, C.; Job, D.; Corbineau, F.; Bailly, C. ROS production and protein oxidation as a novel mechanism for seed dormancy alleviation. Plant J. 2007, 50, 452–465. [Google Scholar] [CrossRef] [PubMed]
- Leymarie, J.; Vitkauskaité, G.; Hoang, H.H.; Gendreau, E.; Chazoule, V.; Meimoun, P.; Corbineau, F.; El-Maarouf-Bouteau, H.; Bailly, C. Role of reactive oxygen species in the regulation of Arabidopsis seed dormancy. Plant Cell Physiol. 2012, 53, 96–106. [Google Scholar] [CrossRef] [PubMed]
- Bailly, C. Active oxygen species and antioxidants in seed biology. Seed Sci. Res. 2004, 14, 93–107. [Google Scholar] [CrossRef]
- Wolff, I.A. Seed lipids. Science 1966, 154, 1140–1149. [Google Scholar] [CrossRef]
- Ponquett, R.T.; Ross, G. Lipid autoxidation and seed ageing: Putative relationships between seed longevity and lipid stability. Seed Sci. Res. 1992, 2, 51–54. [Google Scholar] [CrossRef]
- Ouzouline, M.; Tahani, N.; Demandre, C.; El Amrani, E.; Benhassaine-Kesri, G.; Serghini Caid, H. Effects of accelerated aging upon the lipid composition of seeds from two soft wheat varieties from Morocco. Grasas y Aceites 2009, 60, 367–374. [Google Scholar]
- Murthy, U.M.N.; Kumar, P.P.; Sun, W.Q.; Murthy, N.U.M.; Kumar, P.P.; Sun, W.Q. Mechanisms of seed ageing under different storage conditions for Vigna radiata (L.) Wilczek: Lipid peroxidation, sugar hydrolysis, Maillard reactions and their relationship to glass state transition. J. Exp. Bot. 2003, 54, 1057–1067. [Google Scholar] [CrossRef] [PubMed]
- Hoekstra, F.A.; Golovina, E.A.; Tetteroo, F.A.; Wolkers, W.F. Induction of desiccation tolerance in plant somatic embryos: How exclusive is the protective role of sugars? Cryobiology 2001, 43, 140–150. [Google Scholar] [CrossRef] [PubMed]
- Wolff, S.P.; Dean, R.T. Glucose autoxidation and protein modification. The potential role of ‘autoxidative glycosylation’ in diabetes. Biochem. J. 1987, 245, 243–250. [Google Scholar] [CrossRef]
- Ayala, A.; Muñoz, M.F.; Argüelles, S. Lipid Peroxidation: Production, metabolism, and signaling mechanisms of malondialdehyde and 4-hydroxy-2-nonenal. Oxid. Med. Cell. Longev. 2014, 2014, 1–31. [Google Scholar] [CrossRef] [PubMed]
- Vistoli, G.; De Maddis, D.; Cipak, A.; Zarkovic, N.; Carini, M.; Aldini, G. Advanced glycoxidation and lipoxidation end products (AGEs and ALEs): An overview of their mechanisms of formation. Free Radic. Res. 2013, 47, 3–27. [Google Scholar] [CrossRef] [PubMed]
- Møller, I.M.; Rogowska-Wrzesinska, A.; Rao, R.S.P. Protein carbonylation and metal-catalyzed protein oxidation in a cellular perspective. J. Proteomics 2011, 74, 2228–2242. [Google Scholar] [CrossRef]
- Strelec, I.; Hlevnjak, M. Accumulation of Amadori and Maillard products in wheat seeds aged under different storage conditions. Croat. Chem. Acta 2008, 81, 131–137. [Google Scholar]
- Wettlaufer, S.H.; Leopold, A.C. Relevance of Amadori and Maillard products to seed deterioration. Plant Physiol. 1991, 97, 165–169. [Google Scholar] [CrossRef]
- Colville, L.; Bradley, E.L.; Lloyd, A.S.; Pritchard, H.W.; Castle, L.; Kranner, I. Volatile fingerprints of seeds of four species indicate the involvement of alcoholic fermentation, lipid peroxidation, and Maillard reactions in seed deterioration during ageing and desiccation stress. J. Exp. Bot. 2012, 63, 6519–6530. [Google Scholar] [CrossRef]
- Greifenhagen, U.; Nguyen, V.D.V.D.; Moschner, J.; Giannis, A.; Frolov, A.; Hoffmann, R. Sensitive and site-specific identification of carboxymethylated and carboxyethylated peptides in tryptic digests of proteins and human plasma. J. Proteome Res. 2015, 14, 768–777. [Google Scholar] [CrossRef]
- Schmidt, R.; Böhme, D.; Singer, D.; Frolov, A. Specific tandem mass spectrometric detection of AGE-modified arginine residues in peptides. J. Mass Spectrom. 2015, 50, 613–624. [Google Scholar] [CrossRef] [PubMed]
- Frolov, A.; Hoffmann, P.; Hoffmann, R. Fragmentation behavior of glycated peptides derived fromD-glucose,D-fructose andD-ribose in tandem mass spectrometry. J. Mass Spectrom. 2006, 41, 1459–1469. [Google Scholar] [CrossRef] [PubMed]
- Zhang, Q.; Frolov, A.; Tang, N.; Hoffmann, R.; van de Goor, T.; Metz, T.O.; Smith, R.D.R.D. Application of electron transfer dissociation mass spectrometry in analyses of non-enzymatically glycated peptides. Rapid Commun. Mass Spectrom. 2007, 21, 661–666. [Google Scholar] [CrossRef] [PubMed]
- Fedorova, M.; Frolov, A.; Hoffmann, R. Fragmentation behavior of Amadori-peptides obtained by non-enzymatic glycosylation of lysine residues with ADP-ribose in tandem mass spectrometry. J. Mass Spectrom. 2010, 45. [Google Scholar] [CrossRef]
- Ehrlich, H.; Hanke, T.; Frolov, A.; Langrock, T.; Hoffmann, R.; Fischer, C.; Schwarzenbolz, U.; Henle, T.; Born, R.; Worch, H. Modification of collagen in vitro with respect to formation of Nɛ-carboxymethyllysine. Int. J. Biol. Macromol. 2009, 44, 51–56. [Google Scholar] [CrossRef]
- Frolov, A.; Singer, D.; Hoffmann, R. Sites-specific synthesis of Amadori-modified peptides on solid phase. J. Pept. Sci. 2006, 12, 389–395. [Google Scholar] [CrossRef]
- Frolov, A.; Hoffmann, R. Separation of Amadori peptides from their unmodified analogs by ion-pairing RP-HPLC with heptafluorobutyric acid as ion-pair reagent. Anal. Bioanal. Chem. 2008, 392, 1209–1214. [Google Scholar] [CrossRef]
- Frolov, A.; Singer, D.; Hoffmann, R. Solid-phase synthesis of glucose-derived Amadori peptides. J. Pept. Sci. 2007, 13, 862–867. [Google Scholar] [CrossRef]
- Greifenhagen, U.; Frolov, A.; Hoffmann, R. Oxidative degradation of N ε-fructosylamine-substituted peptides in heated aqueous systems. Amino Acids 2015, 47, 1065–1076. [Google Scholar] [CrossRef]
- Spiller, S.; Frolov, A.; Hoffmann, R. Quantification of specific glycation sites in human serum albumin as prospective type 2 diabetes mellitus biomarkers. Protein Pept. Lett. 2018, 24, 887–896. [Google Scholar] [CrossRef]
- Soboleva, A.; Modzel, M.; Didio, A.; Płóciennik, H.; Kijewska, M.; Grischina, T.; Karonova, T.; Bilova, T.; Stefanov, V.; Stefanowicz, P.; et al. Quantification of prospective type 2 diabetes mellitus biomarkers by stable isotope dilution with bi-labeled standard glycated peptides. Anal. Methods 2017, 9, 409–418. [Google Scholar] [CrossRef]
- Thornalley, P.J.; Battah, S.; Ahmed, N.; Karachalias, N.; Agalou, S.; Babaei-Jadidi, R.; Dawnay, A. Quantitative screening of advanced glycation endproducts in cellular and extracellular proteins by tandem mass spectrometry. Biochem. J. 2003, 375, 581–592. [Google Scholar] [CrossRef] [PubMed]
- Smuda, M.; Henning, C.; Raghavan, C.T.; Johar, K.; Vasavada, A.R.; Nagaraj, R.H.; Glomb, M.A. Comprehensive analysis of maillard protein modifications in human lenses: Effect of age and cataract. Biochemistry 2015, 54, 2500–2507. [Google Scholar] [CrossRef] [PubMed]
- Rabbani, N.; Al-Motawa, M.; Thornalley, P.J. Protein glycation in plants—An under-researched field with much still to discover. Int. J. Mol. Sci. 2020, 21, 3942. [Google Scholar] [CrossRef]
- Leonova, T.; Popova, V.; Tsarev, A.; Henning, C.; Antonova, K.; Rogovskaya, N.; Vikhnina, M.; Baldensperger, T.; Soboleva, A.; Dinastia, E.; et al. Does protein glycation impact on the drought-related changes in metabolism and nutritional properties of mature pea (Pisum sativum L.) seeds? Int. J. Mol. Sci. 2020, 21, 567. [Google Scholar] [CrossRef]
- Dammann, P.; Sell, D.R.; Begall, S.; Strauch, C.; Monnier, V.M. Advanced Glycation End-Products as Markers of Aging and longevity in the long-lived Ansell’s mole-rat (Fukomys anselli). J. Gerontol. Ser. A 2012, 67A, 573–583. [Google Scholar] [CrossRef]
- Bilova, T.; Paudel, G.; Shilyaev, N.; Schmidt, R.; Brauch, D.; Tarakhovskaya, E.; Milrud, S.; Smolikova, G.; Tissier, A.; Vogt, T.; et al. Global proteomic analysis of advanced glycation end products in the Arabidopsis proteome provides evidence for age-related glycation hot spots. J. Biol. Chem. 2017, 292, 15758–15776. [Google Scholar] [CrossRef]
- Vilhena, M.B.; Franco, M.R.; Schmidt, D.; Carvalho, G.; Azevedo, R.A. Evaluation of protein extraction methods for enhanced proteomic analysis of tomato leaves and roots. An. Acad. Bras. Cienc. 2015, 87, 1853–1863. [Google Scholar] [CrossRef]
- Galland, M.; He, D.; Lounifi, I.; Arc, E.; Clément, G.; Balzergue, S.; Huguet, S.; Cueff, G.; Godin, B.; Collet, B.; et al. An integrated “multi-omics” comparison of embryo and endosperm tissue-specific features and their impact on rice seed quality. Front. Plant Sci. 2017, 8, 1984. [Google Scholar] [CrossRef]
- Yin, X.; He, D.; Gupta, R.; Yang, P. Physiological and proteomic analyses on artificially aged Brassica napus seed. Front. Plant Sci. 2015, 6, 112. [Google Scholar] [CrossRef]
- Kołodziejczyk, I.; Dzitko, K.; Szewczyk, R.; Posmyk, M.M. Exogenous melatonin improves corn (Zea mays L.) embryo proteome in seeds subjected to chilling stress. J. Plant Physiol. 2016, 193, 47–56. [Google Scholar] [CrossRef] [PubMed]
- DeBlasio, S.L.; Johnson, R.S.; MacCoss, M.J.; Gray, S.M.; Cilia, M. Model system-guided protein interaction mapping for virus isolated from phloem tissue. J. Proteome Res. 2016, 15, 4601–4611. [Google Scholar] [CrossRef] [PubMed]
- Tyanova, S.; Temu, T.; Carlson, A.; Sinitcyn, P.; Mann, M.; Cox, J. Visualization of LC-MS/MS proteomics data in MaxQuant. Proteomics 2015, 15, 1453–1456. [Google Scholar] [CrossRef]
- PEAKS AB Software, Version 2.0. Available online: https://www.bioinfor.com/peaks-ab-software/ (accessed on 29 November 2020).
- Cox, B.; Kislinger, T.; Wigle, D.A.; Kannan, A.; Brown, K.; Okubo, T.; Hogan, B.; Jurisica, I.; Frey, B.; Rossant, J.; et al. Integrated proteomic and transcriptomic profiling of mouse lung development and Nmyc target genes. Mol. Syst. Biol. 2007, 3, 109. [Google Scholar] [CrossRef]
- Röst, H.L.; Sachsenberg, T.; Aiche, S.; Bielow, C.; Weisser, H.; Aicheler, F.; Andreotti, S.; Ehrlich, H.-C.; Gutenbrunner, P.; Kenar, E.; et al. OpenMS: A flexible open-source software platform for mass spectrometry data analysis. Nat. Methods 2016, 13, 741–748. [Google Scholar] [CrossRef] [PubMed]
- Proteome Discoverer. User Guide. Software Version 2.2; Thermo Fisher Scientific Inc. 2017. Available online: https://assets.thermofisher.com/TFS-Assets/CMD/manuals/Man-XCALI-97808-Proteome-Discoverer-User-ManXCALI97808-EN.pdf (accessed on 29 November 2020).
- Park, S.K.; Yates, J.R. Census for proteome quantification. In Current Protocols in Bioinformatics; John Wiley & Sons, Inc.: Hoboken, NJ, USA, 2010; Volume 29, pp. 13.12.1–13.12.11. [Google Scholar]
- Chang, C.; Zhang, J.; Han, M.; Ma, J.; Zhang, W.; Wu, S.; Liu, K.; Xie, H.; He, F.; Zhu, Y. SILVER: An efficient tool for stable isotope labeling LC-MS data quantitative analysis with quality control methods. Bioinformatics 2014, 30, 586–587. [Google Scholar] [CrossRef]
- Bellew, M.; Coram, M.; Fitzgibbon, M.; Igra, M.; Randolph, T.; Wang, P.; May, D.; Eng, J.; Fang, R.; Lin, C.; et al. A suite of algorithms for the comprehensive analysis of complex protein mixtures using high-resolution LC-MS. Bioinformatics 2006, 22, 1902–1909. [Google Scholar] [CrossRef]
- Valot, B.; Langella, O.; Nano, E.; Zivy, M. MassChroQ: A versatile tool for mass spectrometry quantification. Proteomics 2011, 11, 3572–3577. [Google Scholar] [CrossRef]
- MacLean, B.; Tomazela, D.M.; Shulman, N.; Chambers, M.; Finney, G.L.; Frewen, B.; Kern, R.; Tabb, D.L.; Liebler, D.C.; MacCoss, M.J. Skyline: An open source document editor for creating and analyzing targeted proteomics experiments. Bioinformatics 2010, 26, 966–968. [Google Scholar] [CrossRef]
- Tsou, C.-C.; Avtonomov, D.; Larsen, B.; Tucholska, M.; Choi, H.; Gingras, A.-C.; Nesvizhskii, A.I. DIA-Umpire: Comprehensive computational framework for data-independent acquisition proteomics. Nat. Methods 2015, 12, 258–264. [Google Scholar] [CrossRef]
- Deutsch, E.W.; Mendoza, L.; Shteynberg, D.; Farrah, T.; Lam, H.; Tasman, N.; Sun, Z.; Nilsson, E.; Pratt, B.; Prazen, B.; et al. A guided tour of the Trans-Proteomic Pipeline. Proteomics 2010, 10, 1150–1159. [Google Scholar] [CrossRef] [PubMed]
- Argentini, A.; Goeminne, L.J.E.; Verheggen, K.; Hulstaert, N.; Staes, A.; Clement, L.; Martens, L. moFF: A robust and automated approach to extract peptide ion intensities. Nat. Methods 2016, 13, 964–966. [Google Scholar] [CrossRef] [PubMed]
- An introduction to Mascot Distiller. Available online: http://www.matrixscience.com/distiller.html (accessed on 29 November 2020).
- Brusniak, M.-Y.; Bodenmiller, B.; Campbell, D.; Cooke, K.; Eddes, J.; Garbutt, A.; Lau, H.; Letarte, S.; Mueller, L.N.; Sharma, V.; et al. Corra: Computational framework and tools for LC-MS discovery and targeted mass spectrometry-based proteomics. BMC Bioinform. 2008, 9, 542. [Google Scholar] [CrossRef] [PubMed]
- Millikin, R.J.; Solntsev, S.K.; Shortreed, M.R.; Smith, L.M. Ultrafast peptide label-free quantification with FlashLFQ. J. Proteome Res. 2018, 17, 386–391. [Google Scholar] [CrossRef] [PubMed]
- ProSightPC 4.0 Quick Start Guide. Revision A XCALI-97800; Thermo Fisher Scientific Inc. 2016. Available online: https://assets.thermofisher.com/TFS-Assets/CMD/Product-Guides/QS-XCALI-97800-ProSightPC-QSXCALI97800-EN.pdf (accessed on 29 November 2020).
- Sanford, H.; Harnos, S. Agilent MassHunter Qualitative Data Analysis; Software B.07.00. 2017. Available online: https://www.agilent.com/cs/library/eseminars/public/Session_3_Qualitative_Analysis_Basics.pdf (accessed on 29 November 2020).
- Schwacke, R.; Ponce-Soto, G.Y.; Krause, K.; Bolger, A.M.; Arsova, B.; Hallab, A.; Gruden, K.; Stitt, M.; Bolger, M.E.; Usadel, B. MapMan4: A Refined protein classification and annotation framework applicable to multi-omics data analysis. Mol. Plant 2019, 12, 879–892. [Google Scholar] [CrossRef] [PubMed]
- Huerta-Cepas, J.; Forslund, K.; Coelho, L.P.; Szklarczyk, D.; Jensen, L.J.; von Mering, C.; Bork, P. Fast Genome-wide functional annotation through orthology assignment by eggNOG-mapper. Mol. Biol. Evol. 2017, 34, 2115–2122. [Google Scholar] [CrossRef]
- Szklarczyk, D.; Gable, A.L.; Lyon, D.; Junge, A.; Wyder, S.; Huerta-Cepas, J.; Simonovic, M.; Doncheva, N.T.; Morris, J.H.; Bork, P.; et al. STRING v11: Protein-protein association networks with increased coverage, supporting functional discovery in genome-wide experimental datasets. Nucleic Acids Res. 2019, 47, D607–D613. [Google Scholar] [CrossRef]


Publisher’s Note: MDPI stays neutral with regard to jurisdictional claims in published maps and institutional affiliations. |
© 2020 by the authors. Licensee MDPI, Basel, Switzerland. This article is an open access article distributed under the terms and conditions of the Creative Commons Attribution (CC BY) license (http://creativecommons.org/licenses/by/4.0/).
Share and Cite
Smolikova, G.; Gorbach, D.; Lukasheva, E.; Mavropolo-Stolyarenko, G.; Bilova, T.; Soboleva, A.; Tsarev, A.; Romanovskaya, E.; Podolskaya, E.; Zhukov, V.; et al. Bringing New Methods to the Seed Proteomics Platform: Challenges and Perspectives. Int. J. Mol. Sci. 2020, 21, 9162. https://doi.org/10.3390/ijms21239162
Smolikova G, Gorbach D, Lukasheva E, Mavropolo-Stolyarenko G, Bilova T, Soboleva A, Tsarev A, Romanovskaya E, Podolskaya E, Zhukov V, et al. Bringing New Methods to the Seed Proteomics Platform: Challenges and Perspectives. International Journal of Molecular Sciences. 2020; 21(23):9162. https://doi.org/10.3390/ijms21239162
Chicago/Turabian StyleSmolikova, Galina, Daria Gorbach, Elena Lukasheva, Gregory Mavropolo-Stolyarenko, Tatiana Bilova, Alena Soboleva, Alexander Tsarev, Ekaterina Romanovskaya, Ekaterina Podolskaya, Vladimir Zhukov, and et al. 2020. "Bringing New Methods to the Seed Proteomics Platform: Challenges and Perspectives" International Journal of Molecular Sciences 21, no. 23: 9162. https://doi.org/10.3390/ijms21239162
APA StyleSmolikova, G., Gorbach, D., Lukasheva, E., Mavropolo-Stolyarenko, G., Bilova, T., Soboleva, A., Tsarev, A., Romanovskaya, E., Podolskaya, E., Zhukov, V., Tikhonovich, I., Medvedev, S., Hoehenwarter, W., & Frolov, A. (2020). Bringing New Methods to the Seed Proteomics Platform: Challenges and Perspectives. International Journal of Molecular Sciences, 21(23), 9162. https://doi.org/10.3390/ijms21239162