Synthesis, Molecular Modeling and Biological Evaluation of Metabolically Stable Analogues of the Endogenous Fatty Acid Amide Palmitoylethanolamide

 ,
,  ,
,  ,
,  , and
, and 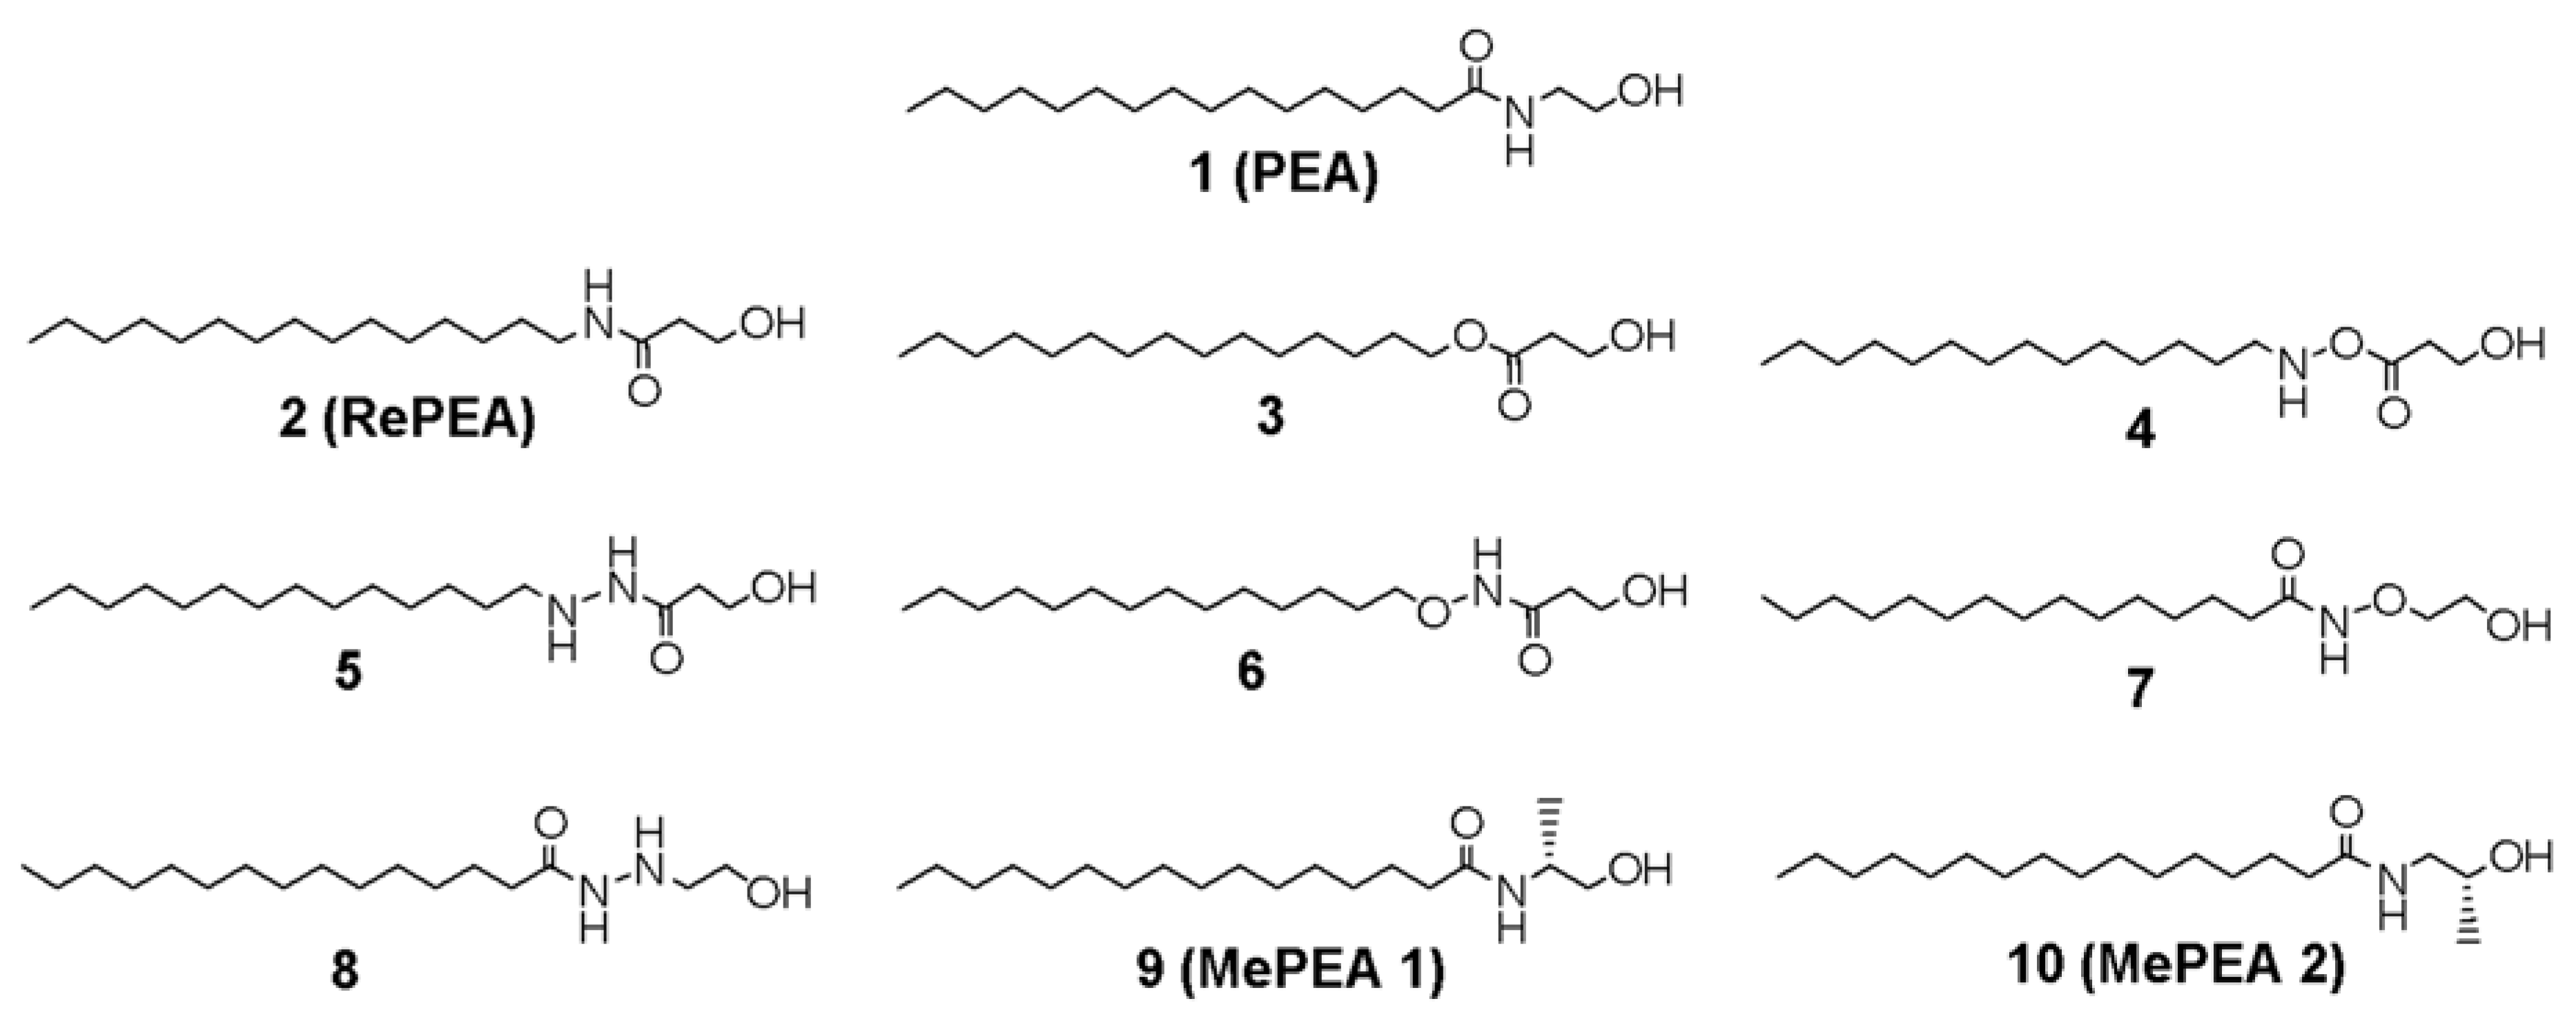
Abstract
1. Introduction
2. Results
2.1. Design of PEA-Analogues
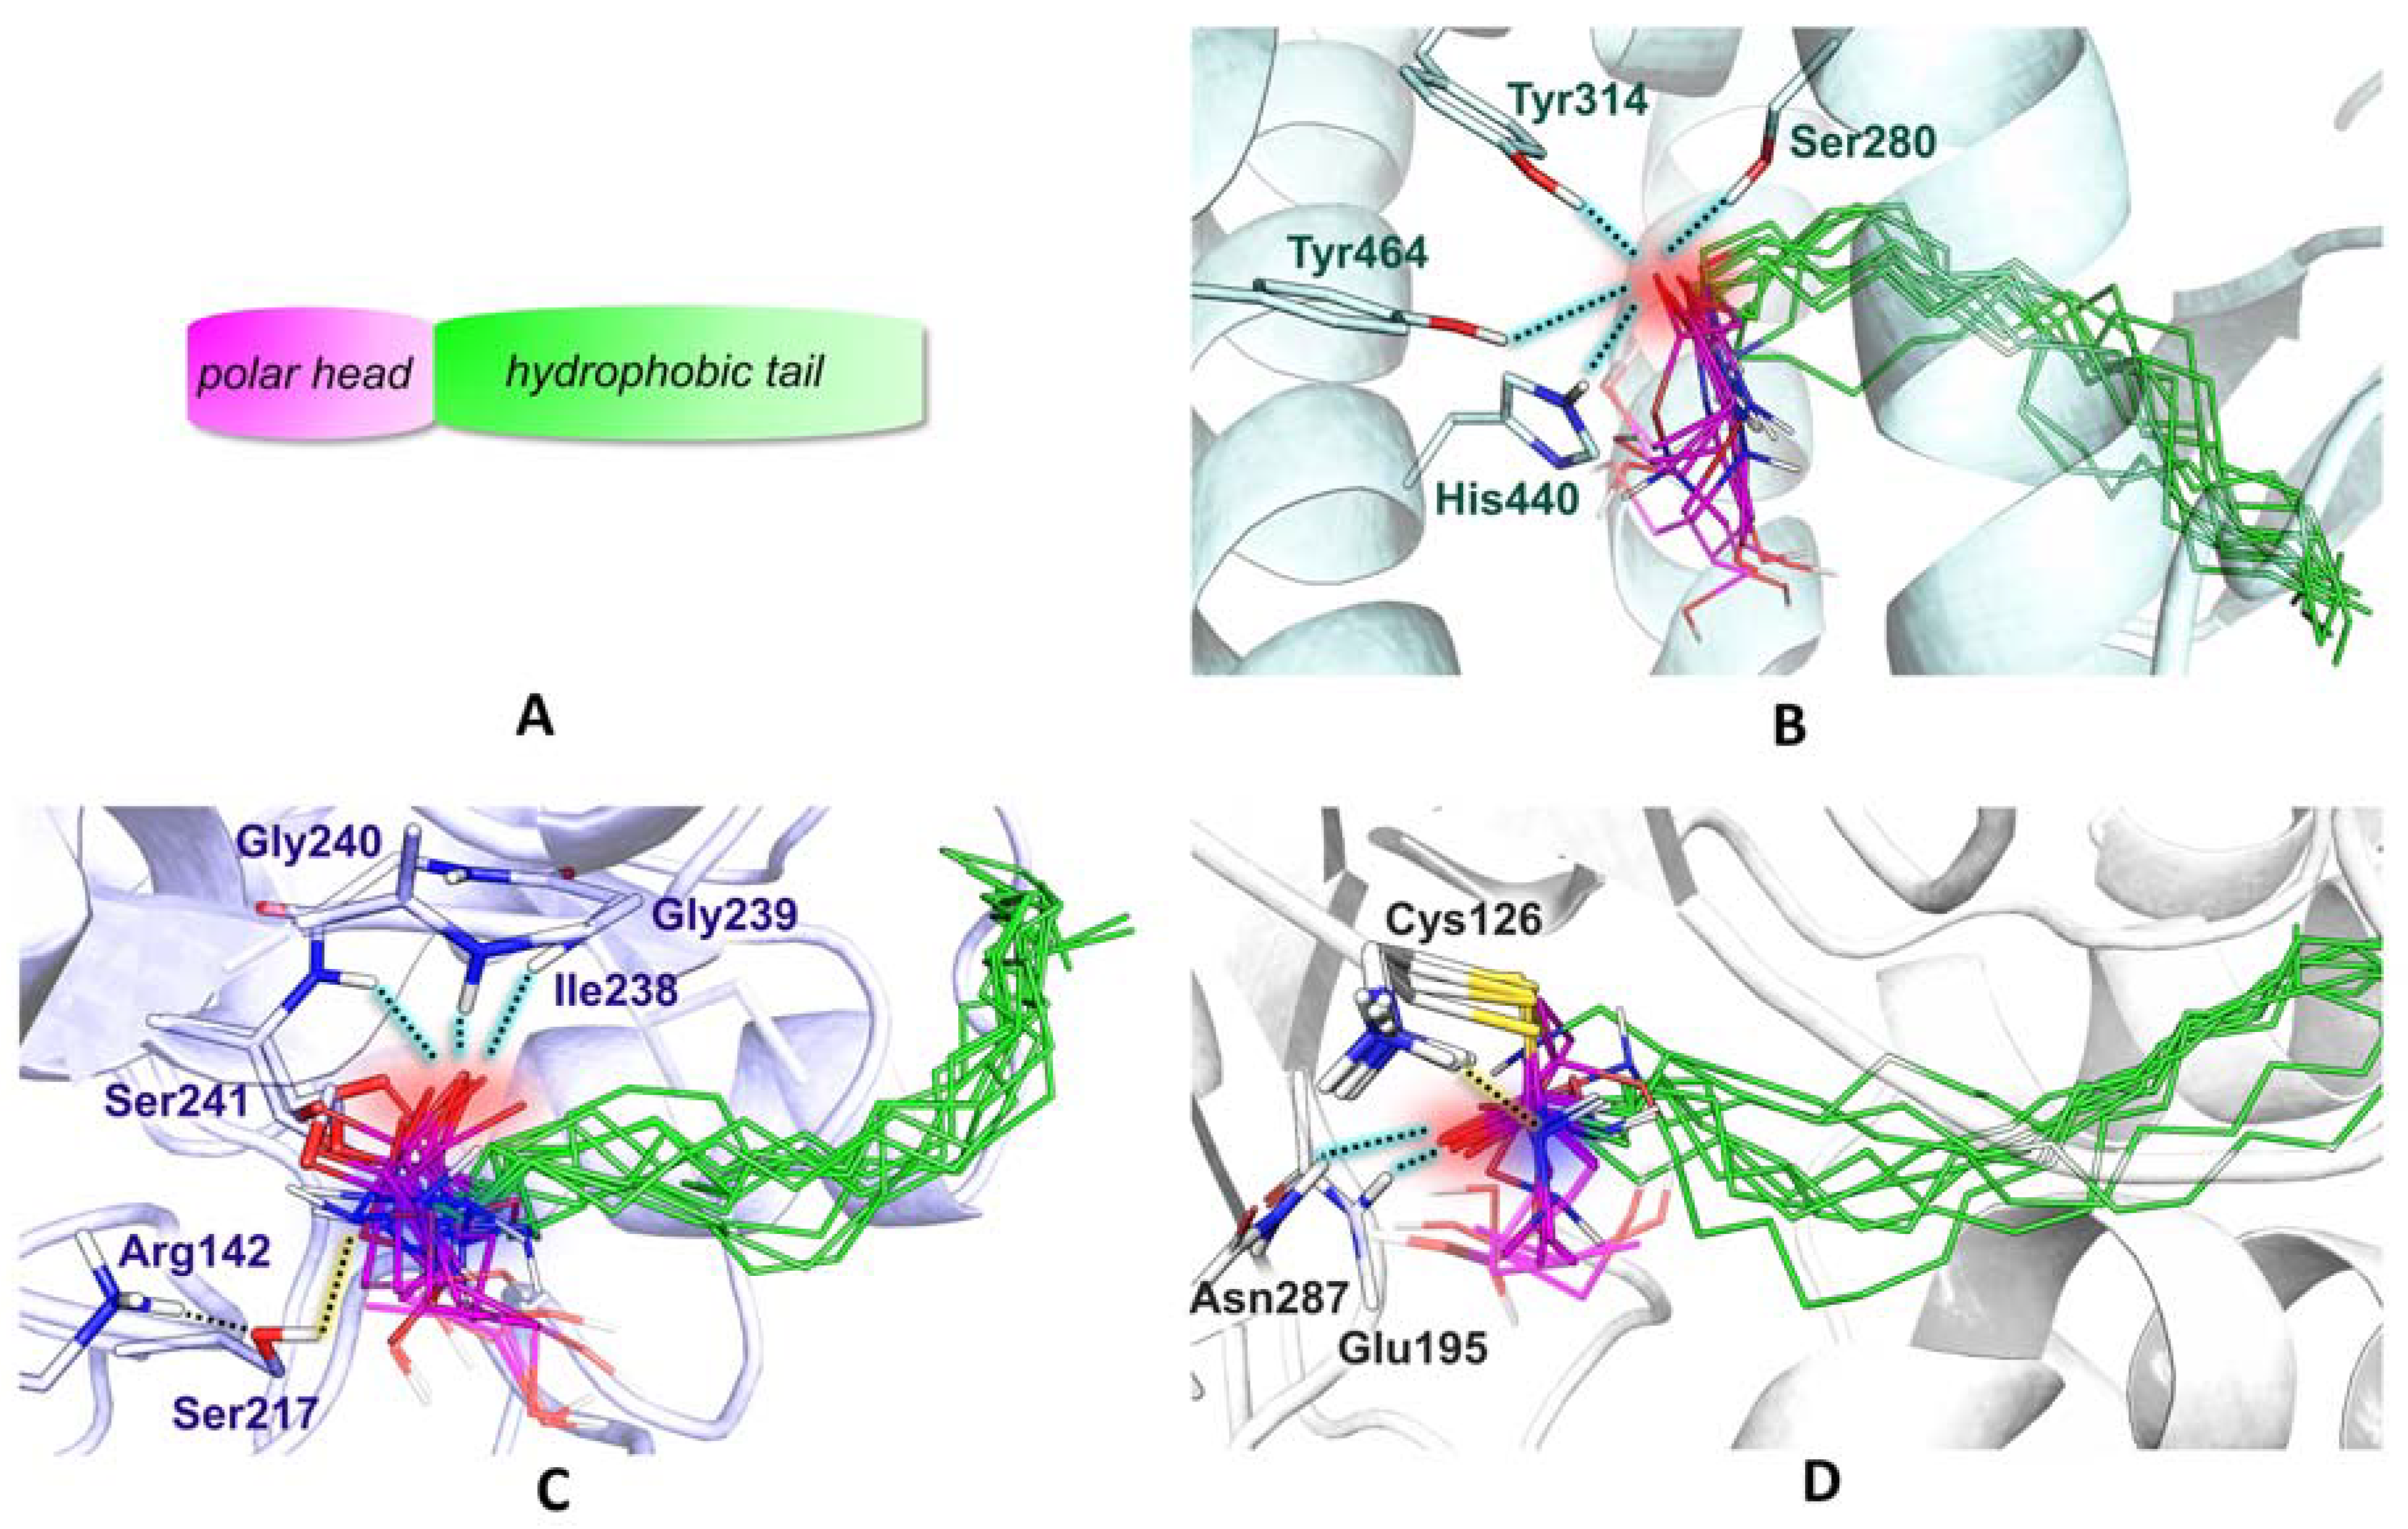
2.2. Analogues of PEA Can Equally Bind PPAR-α Receptor
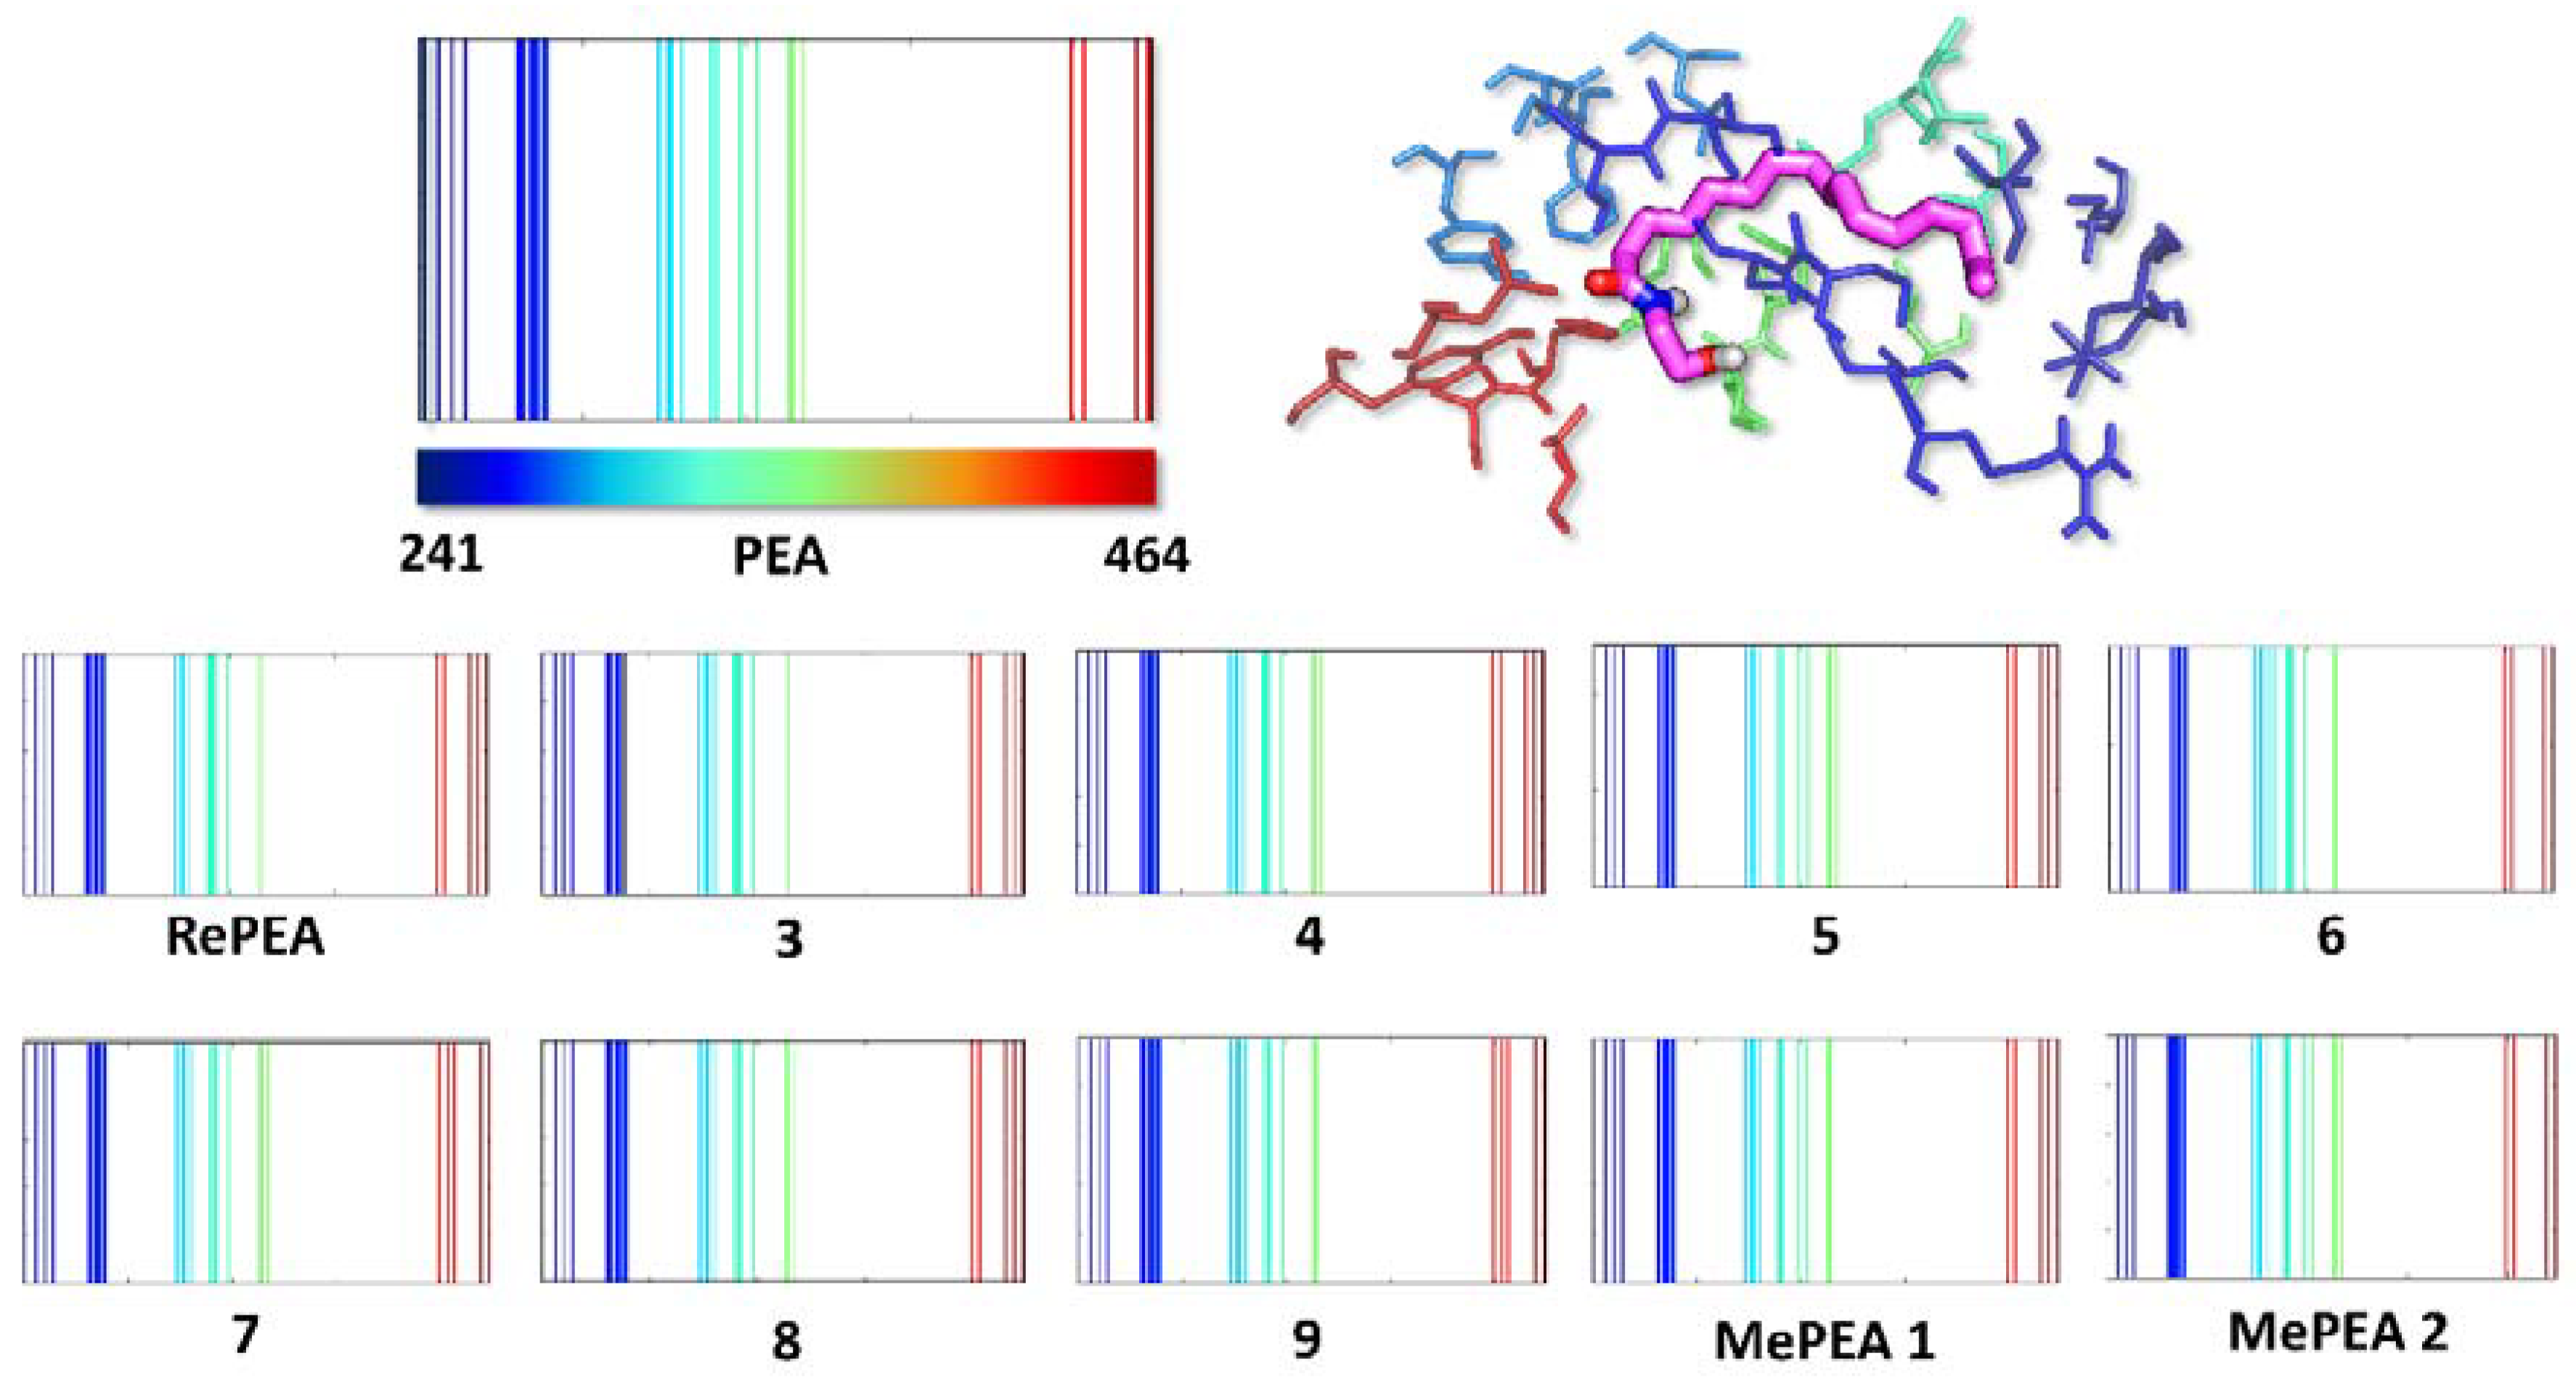
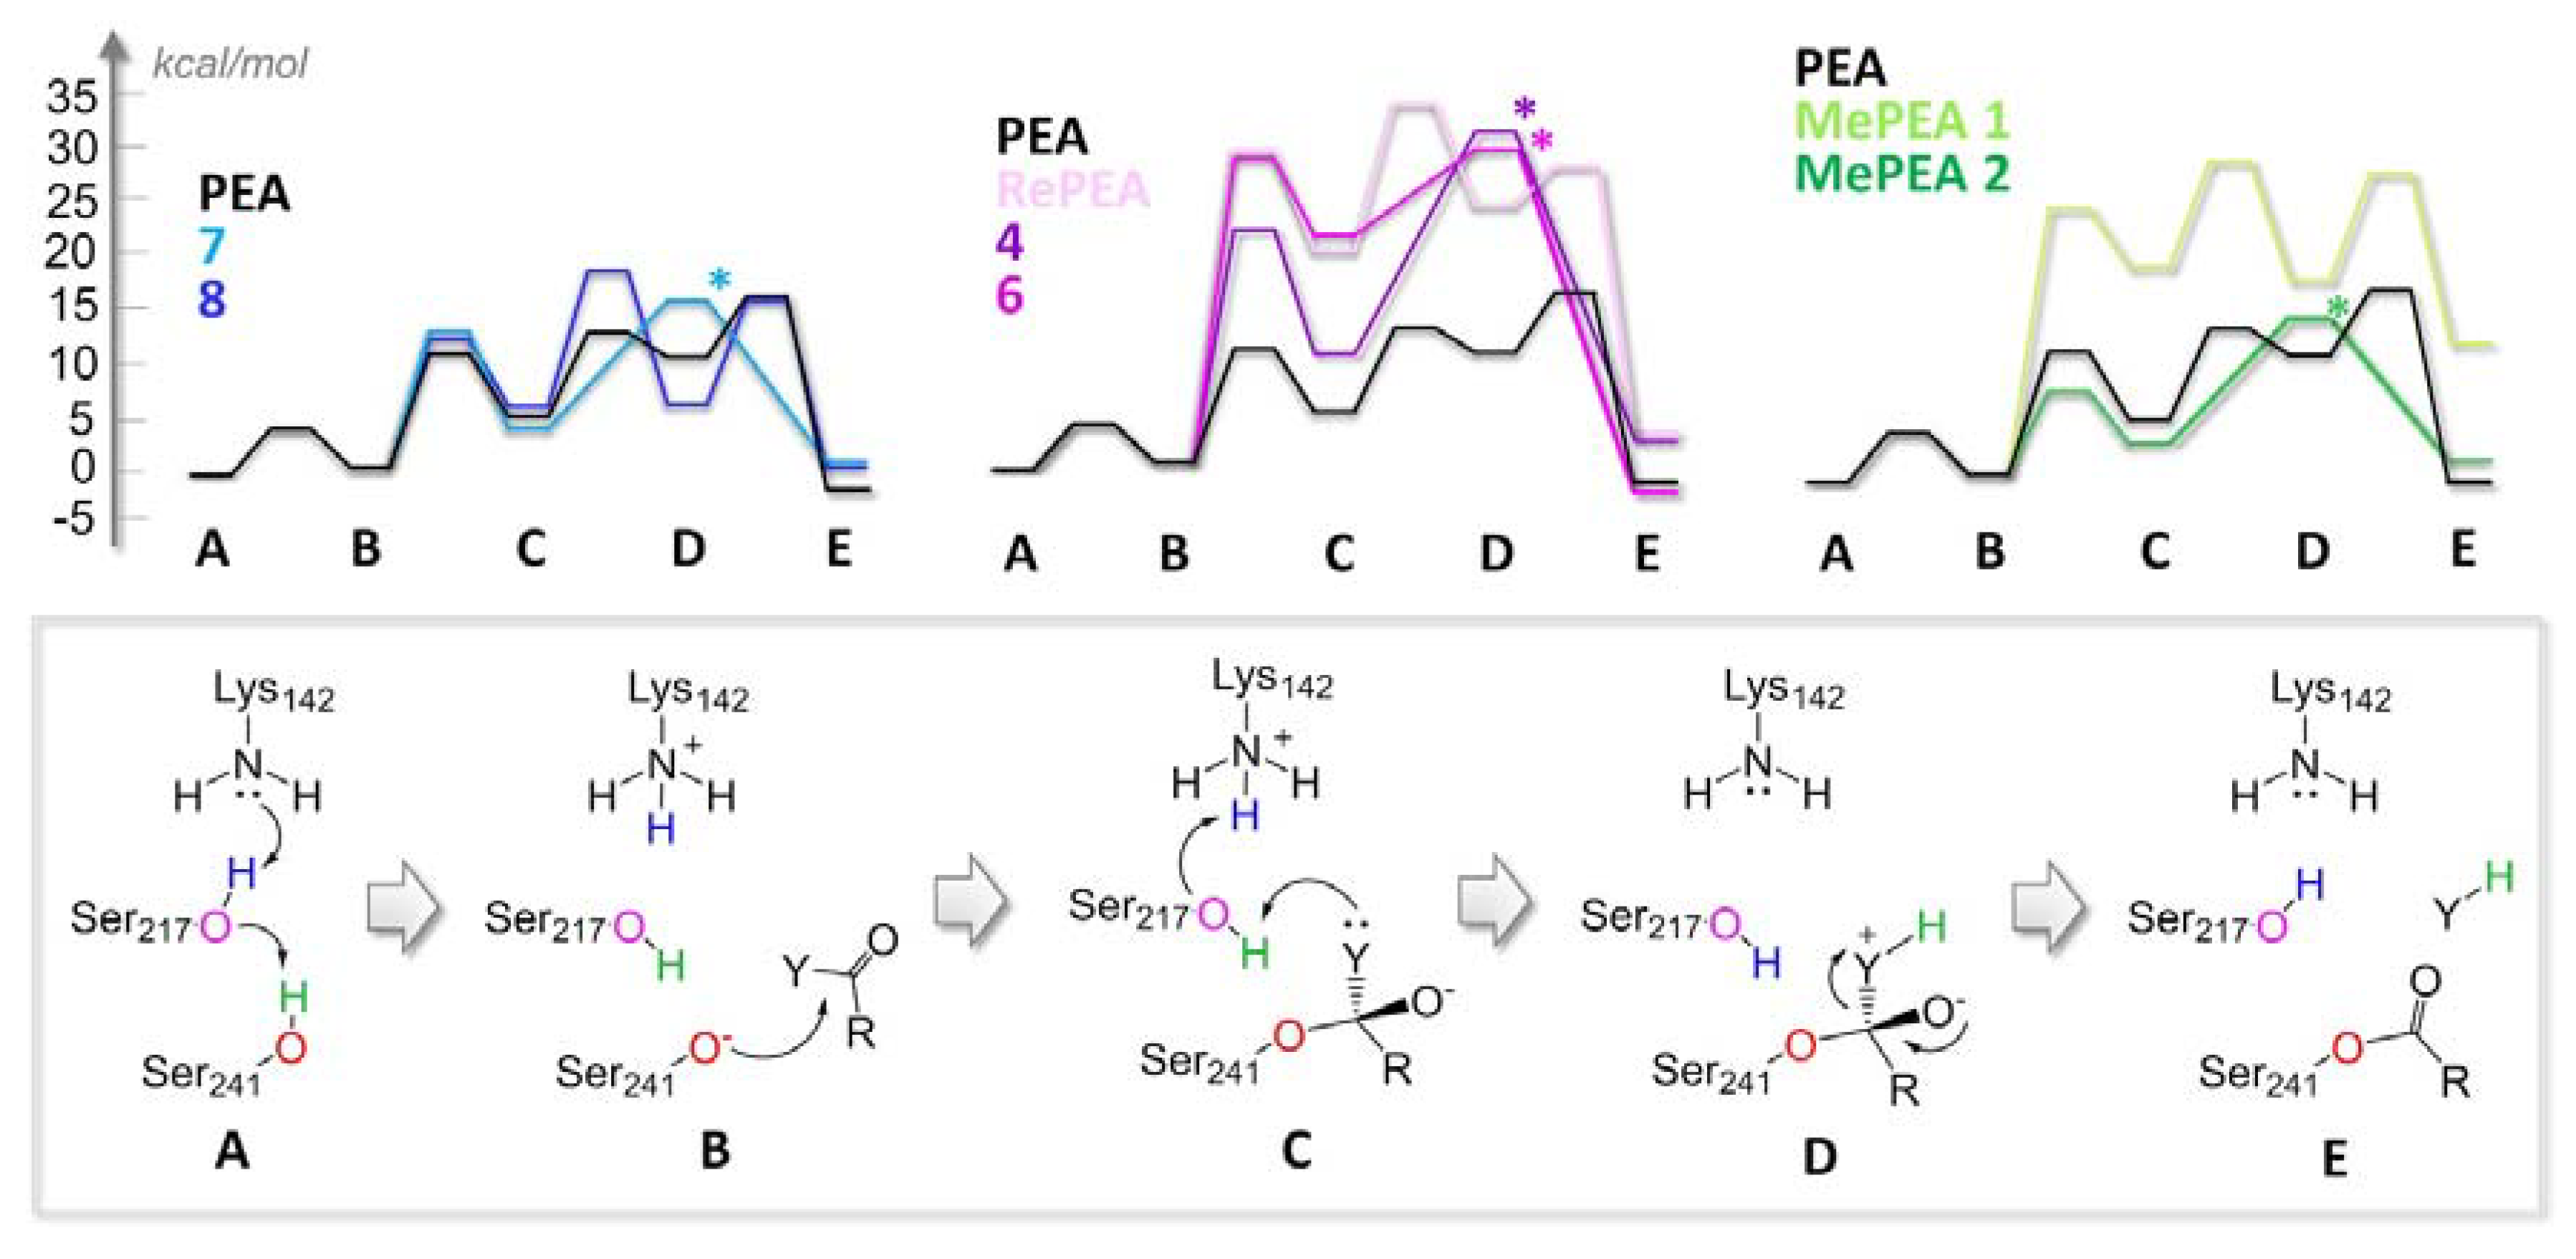
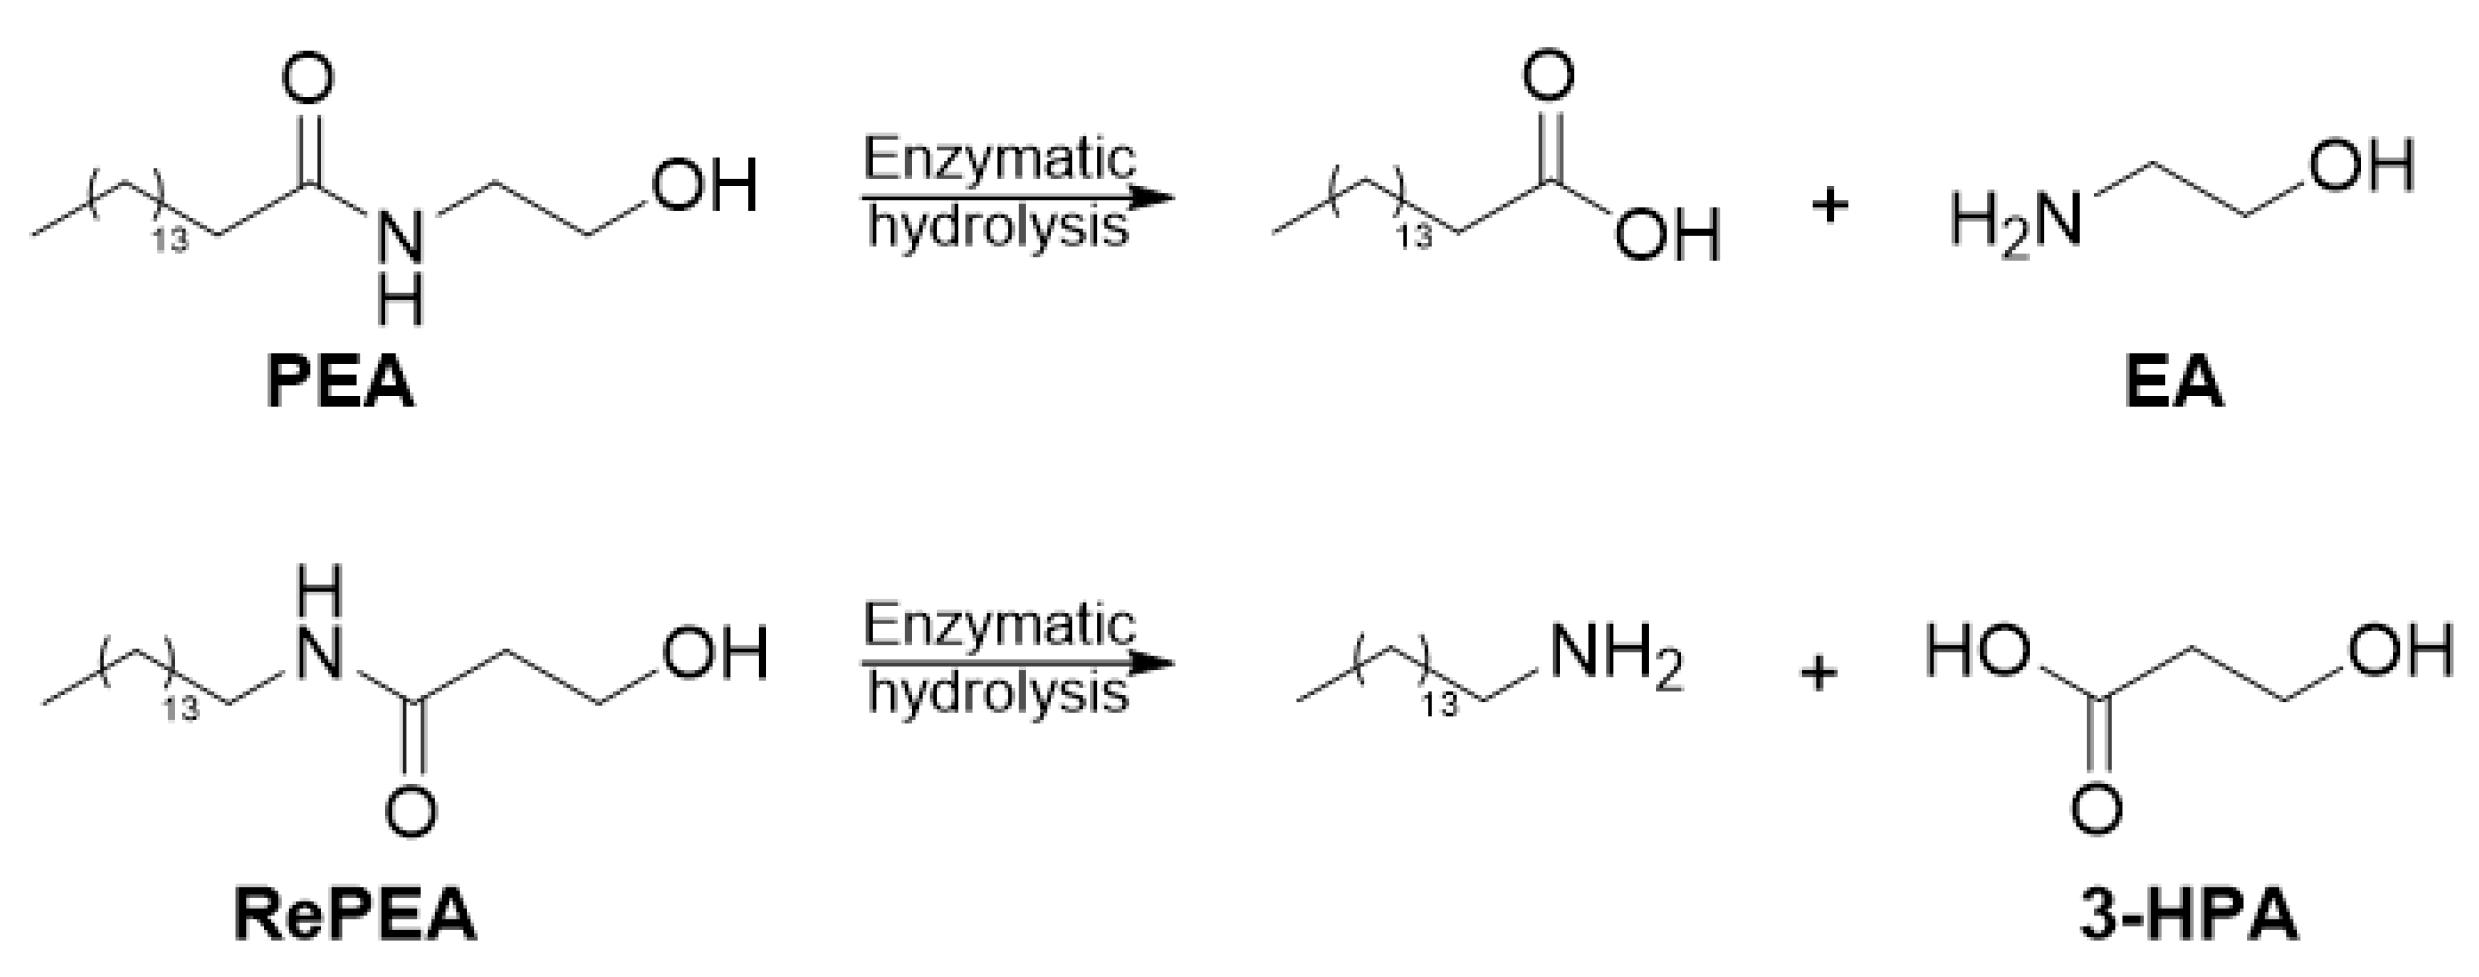
2.3. All of the Designed Compounds Are Eligible as FAAH Substrate
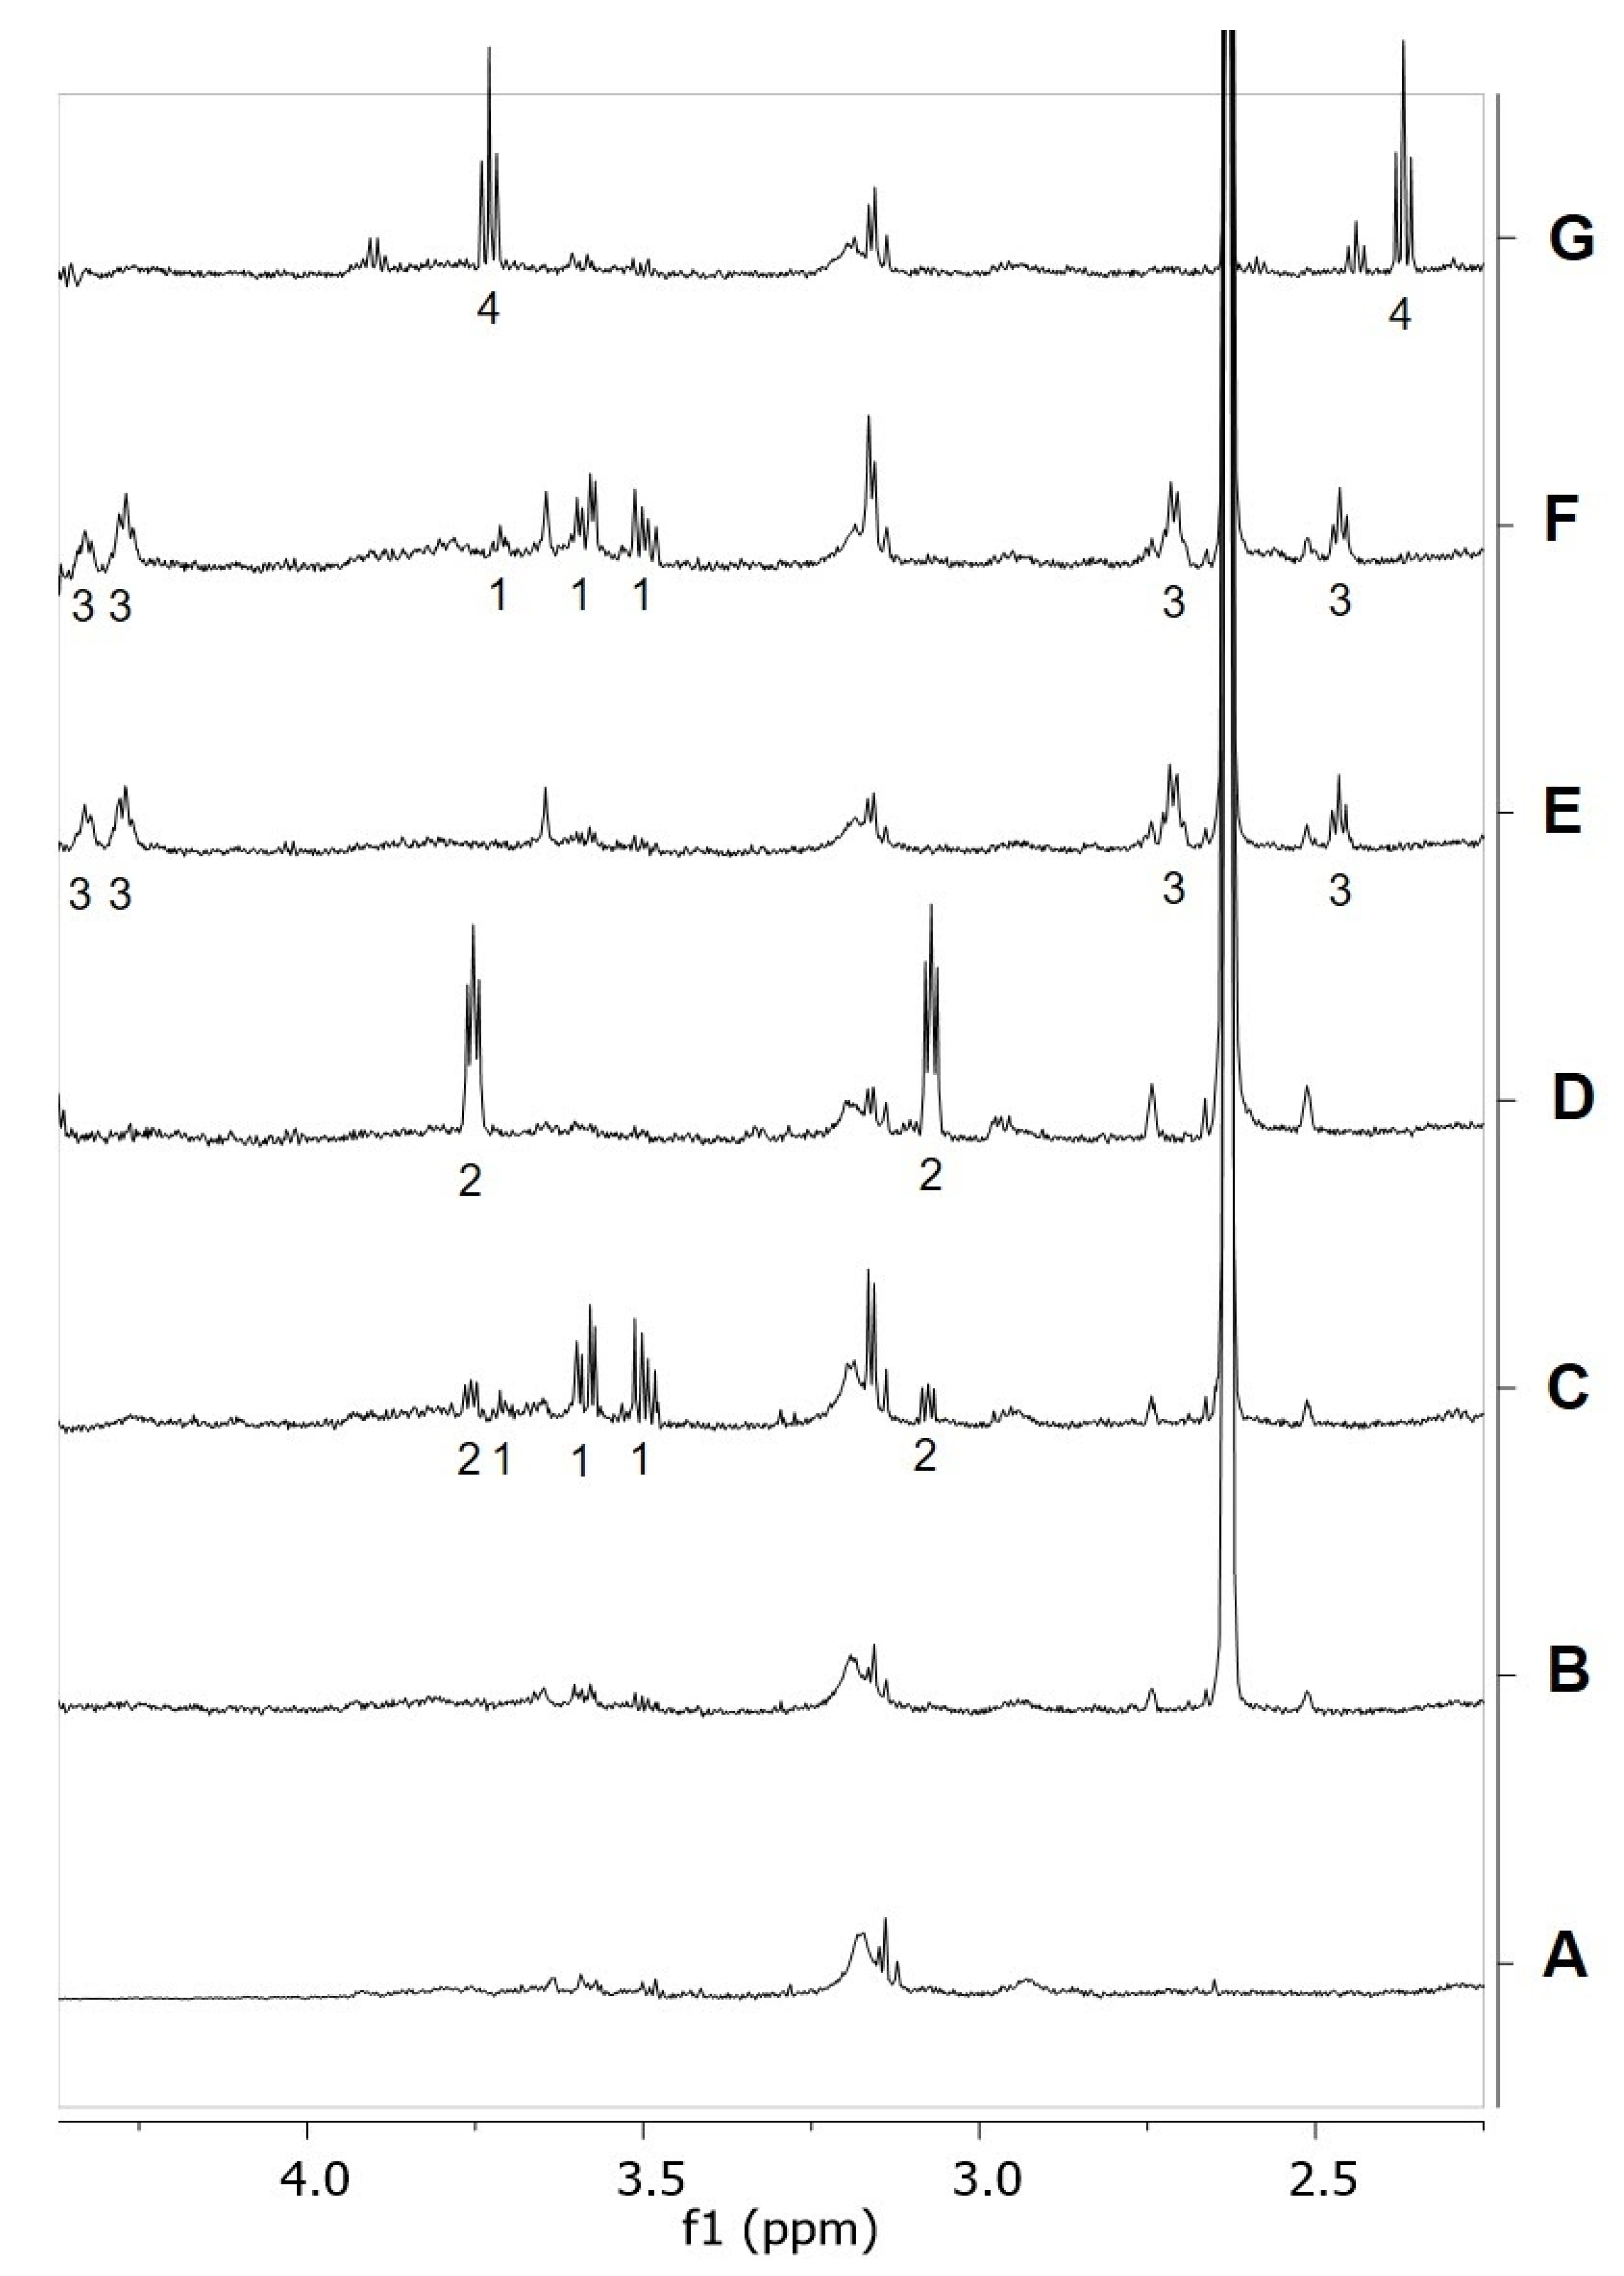
2.4. Identification of Analogues with a Higher Metabolic Stability
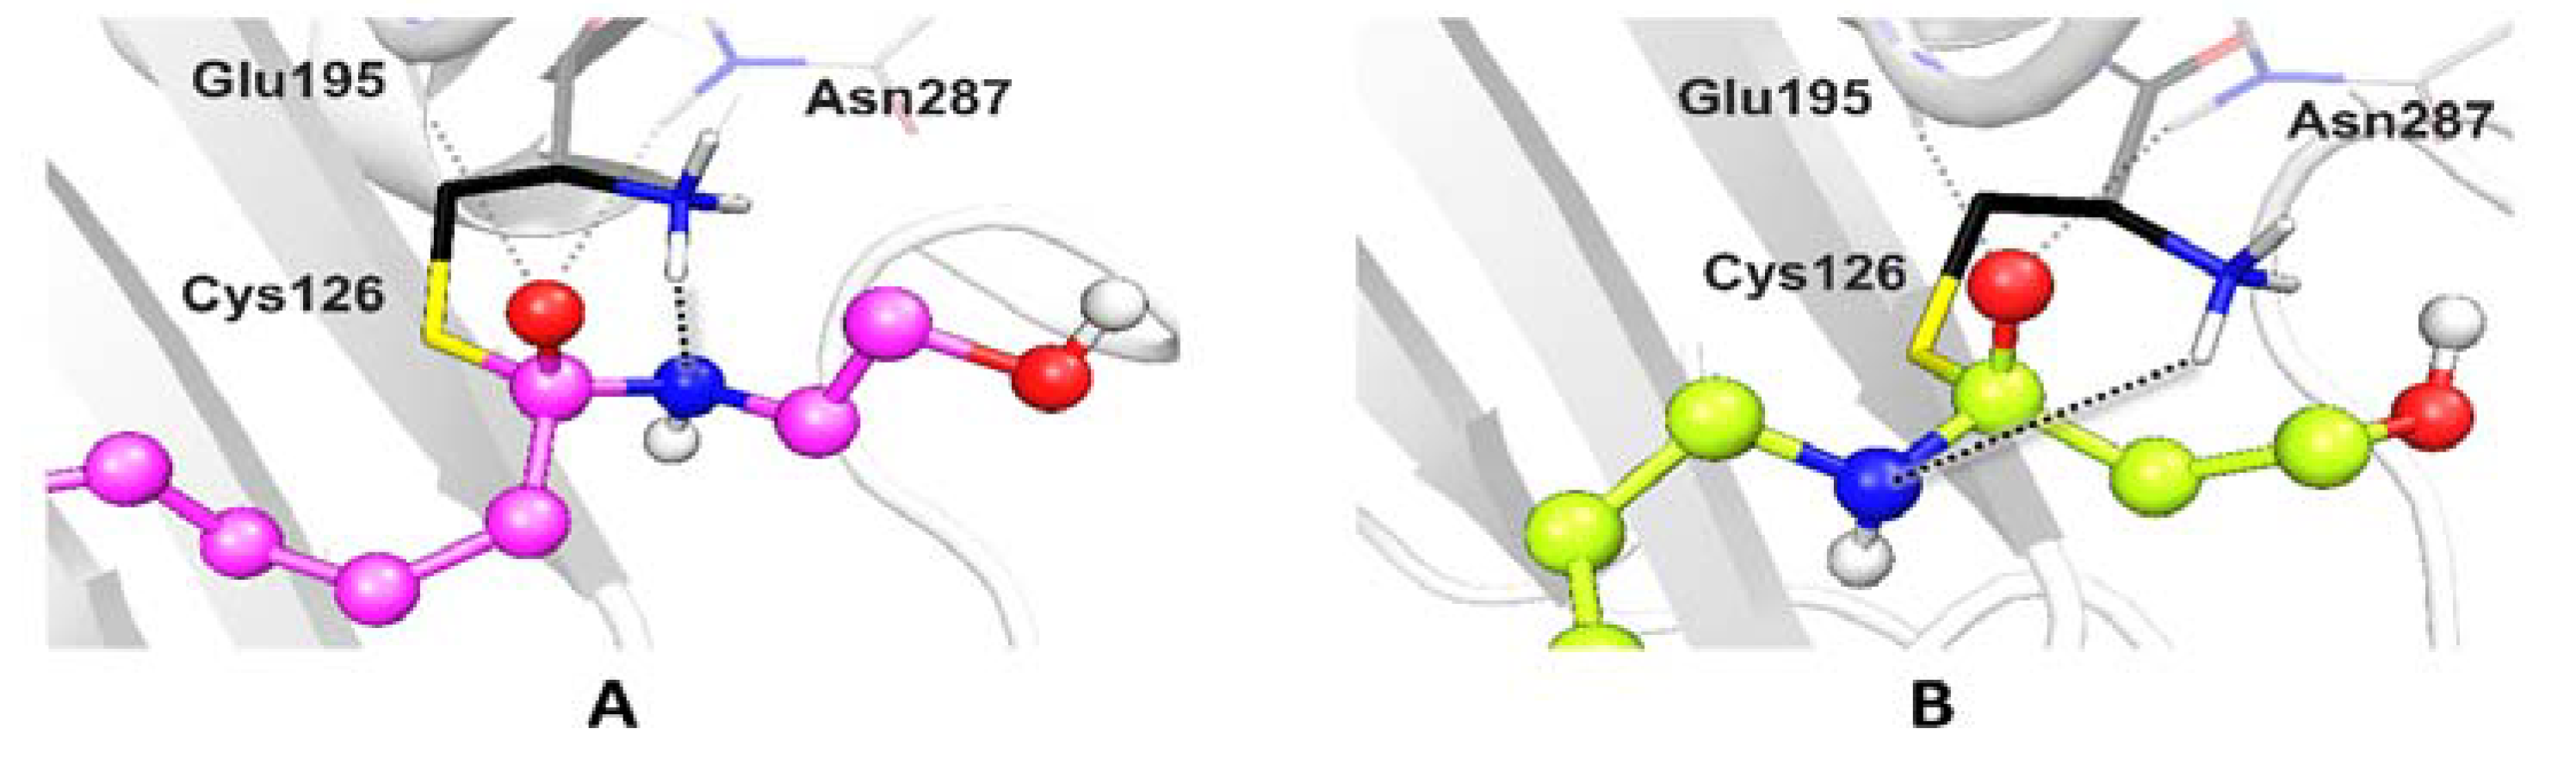
2.5. Ligand Binding to NAAA and Implications on Hydrolysis
2.6. RePEA Is Stable When Exposed to FAAH-Containing Membranes
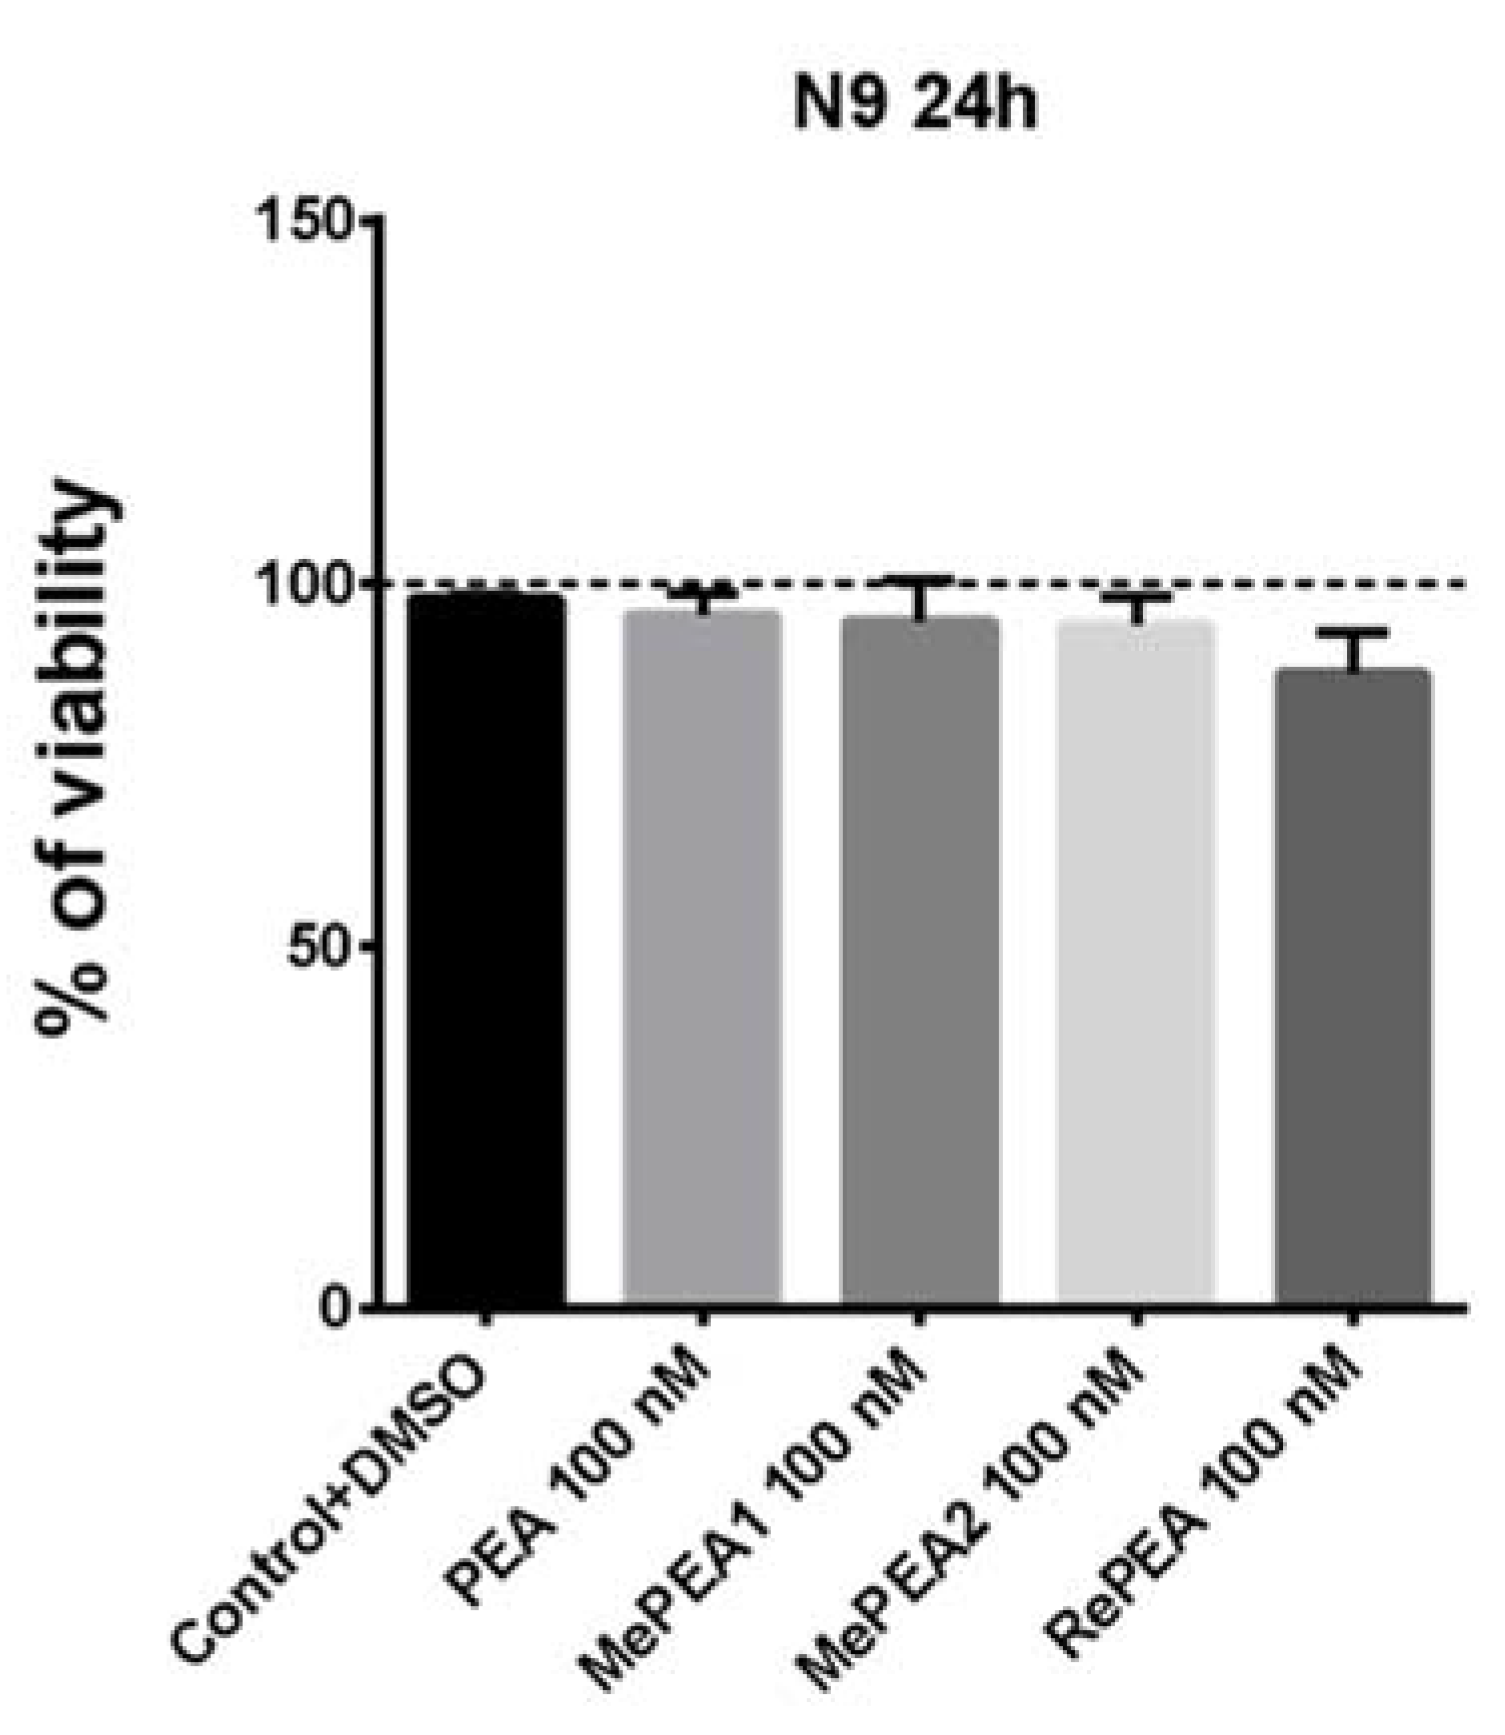
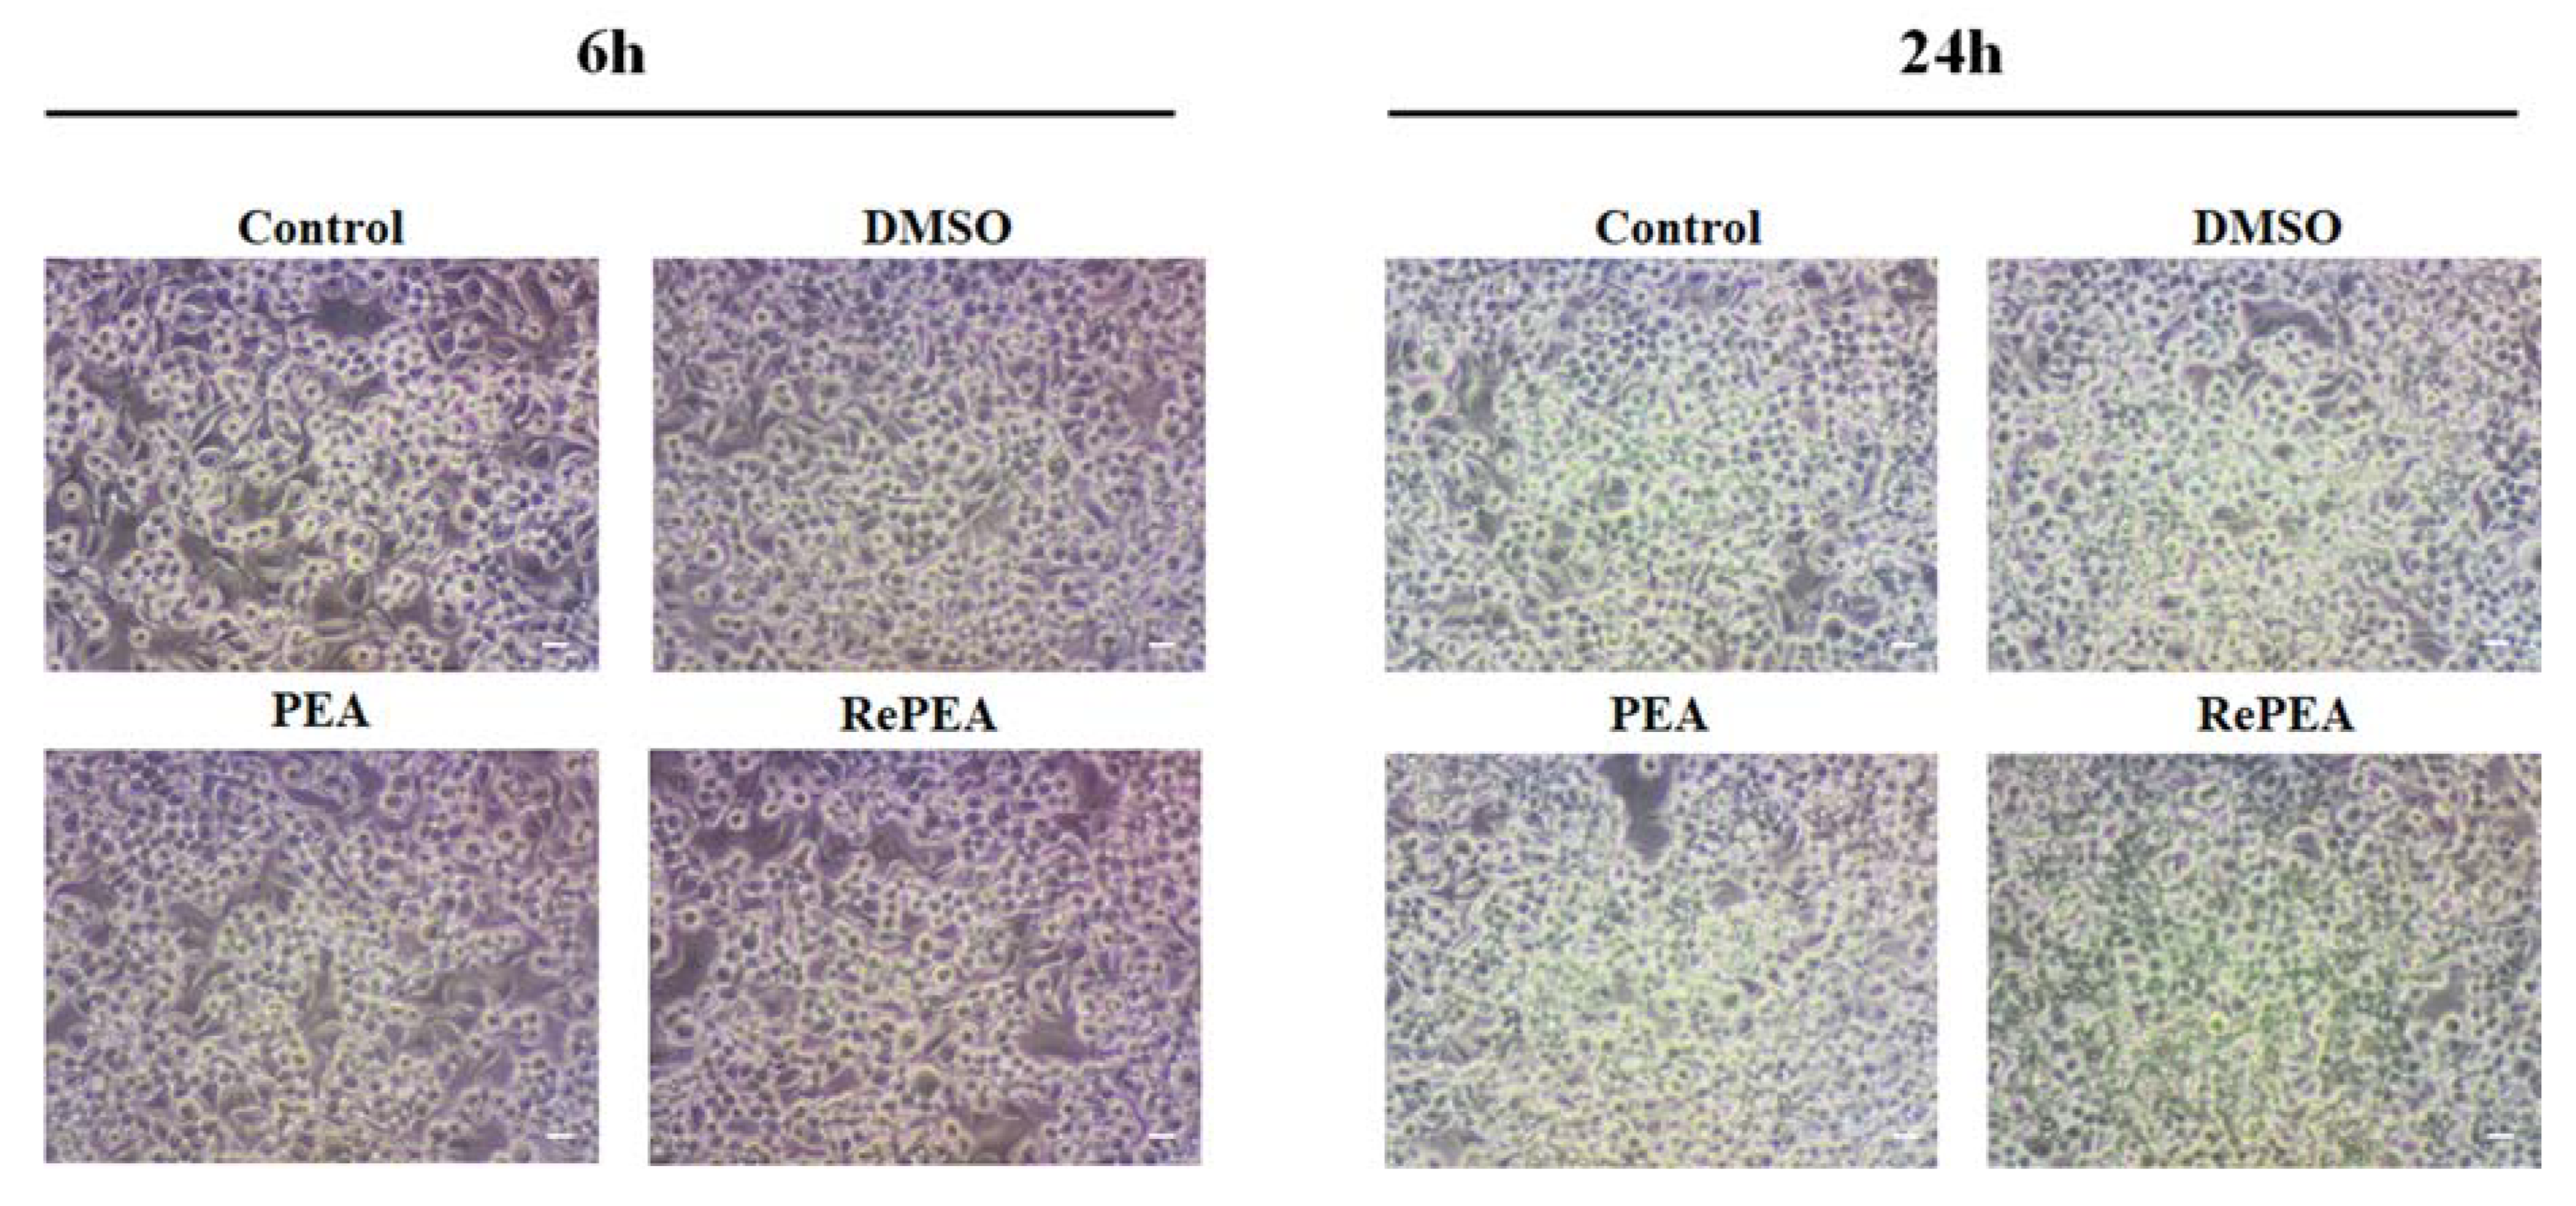
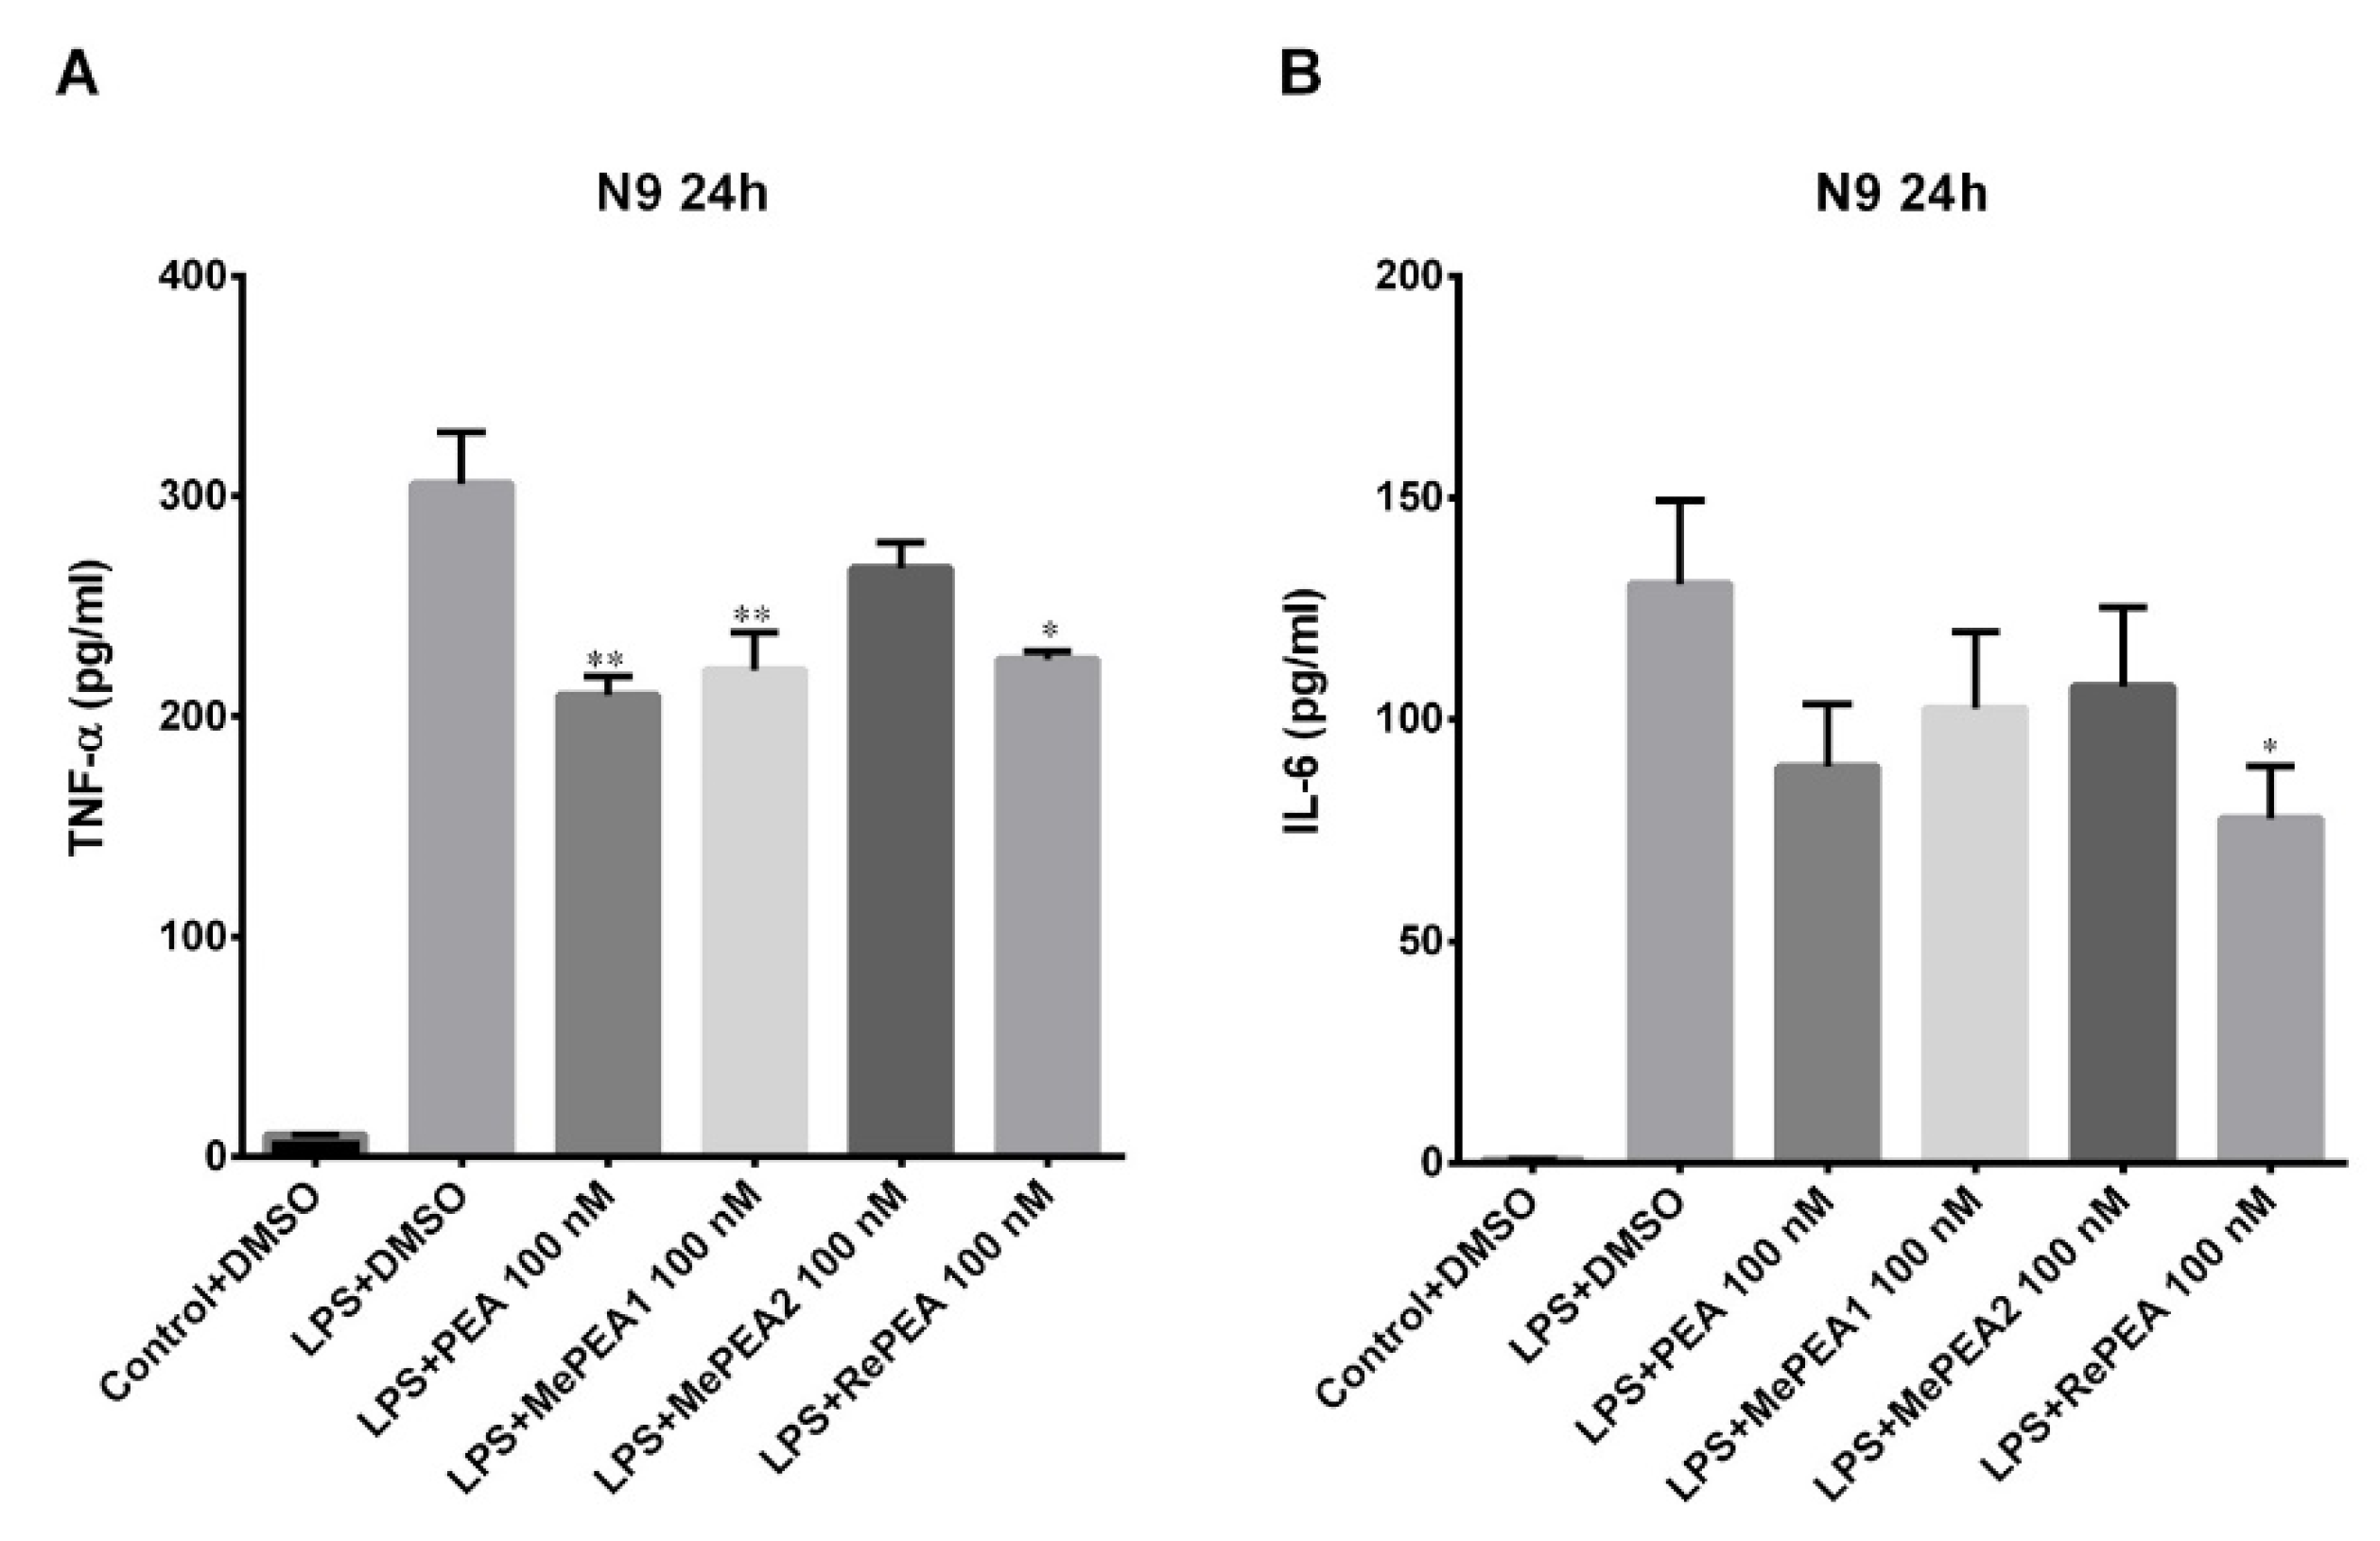
2.7. PEA and RePEA Inhibits LPS-Induced Tumor Necrosis Factor-α (TNF-α) and Interleukin-6 (IL-6) Release in N9 Microglial Cells
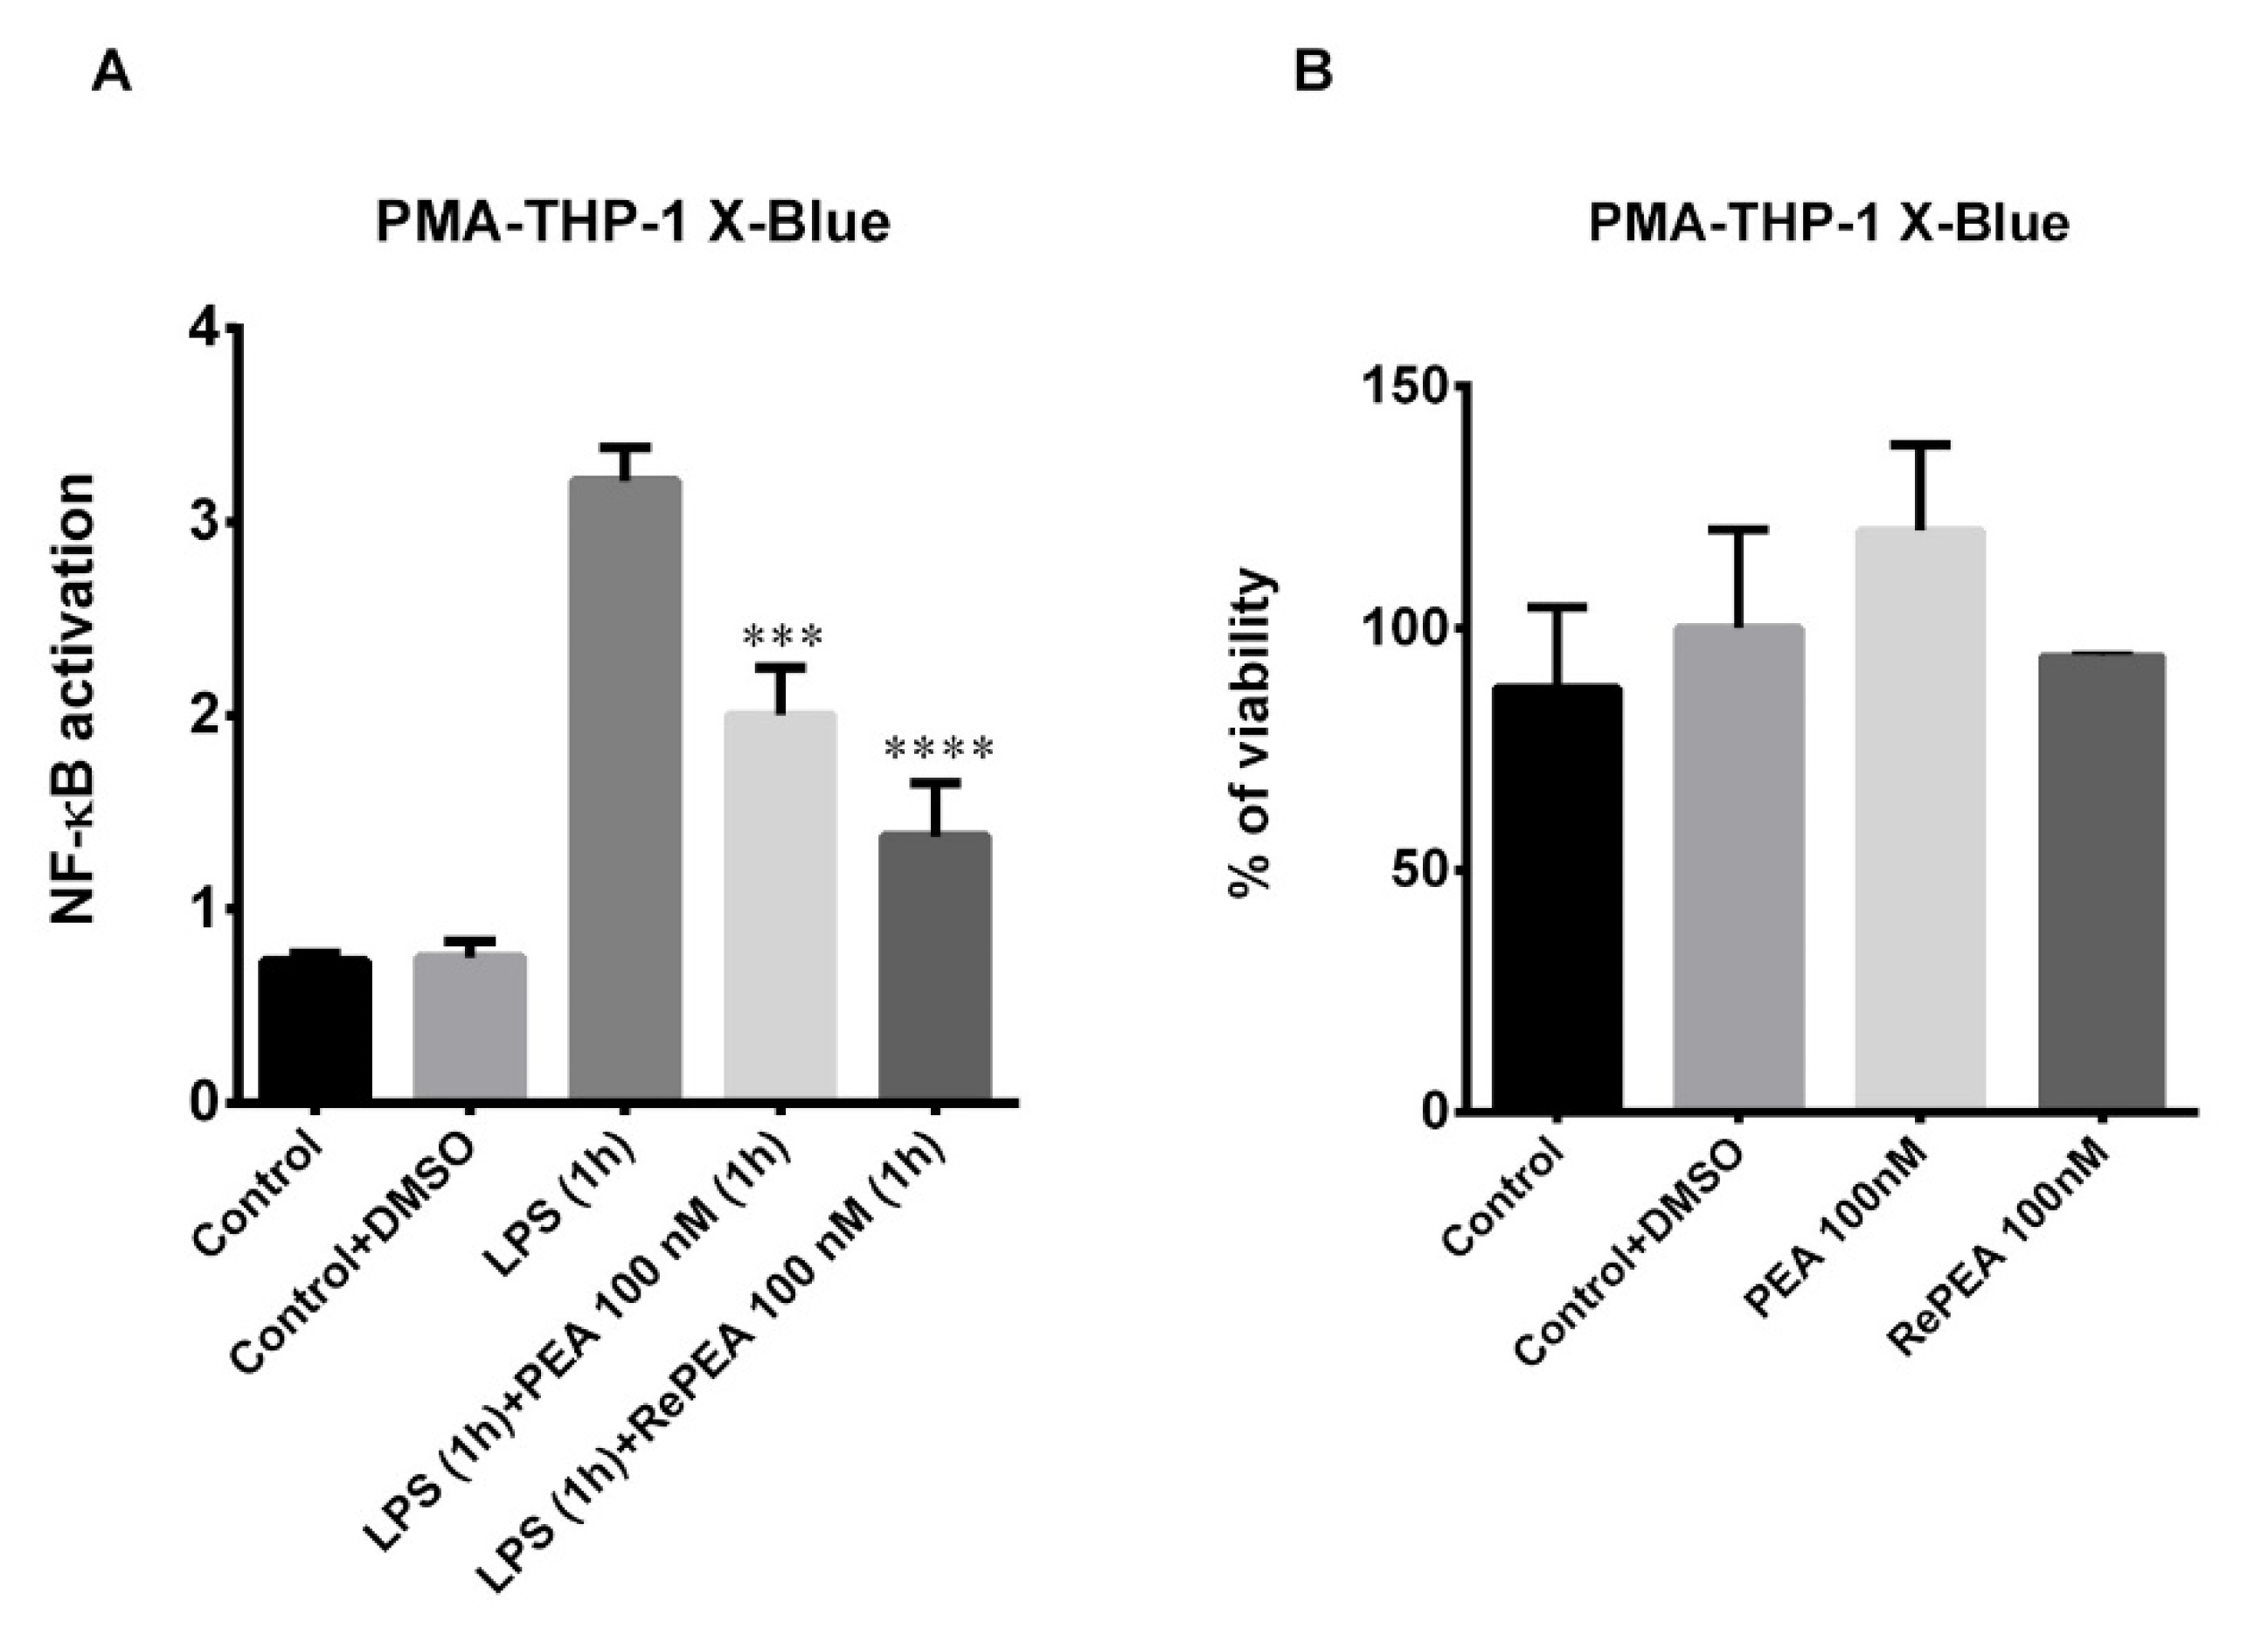
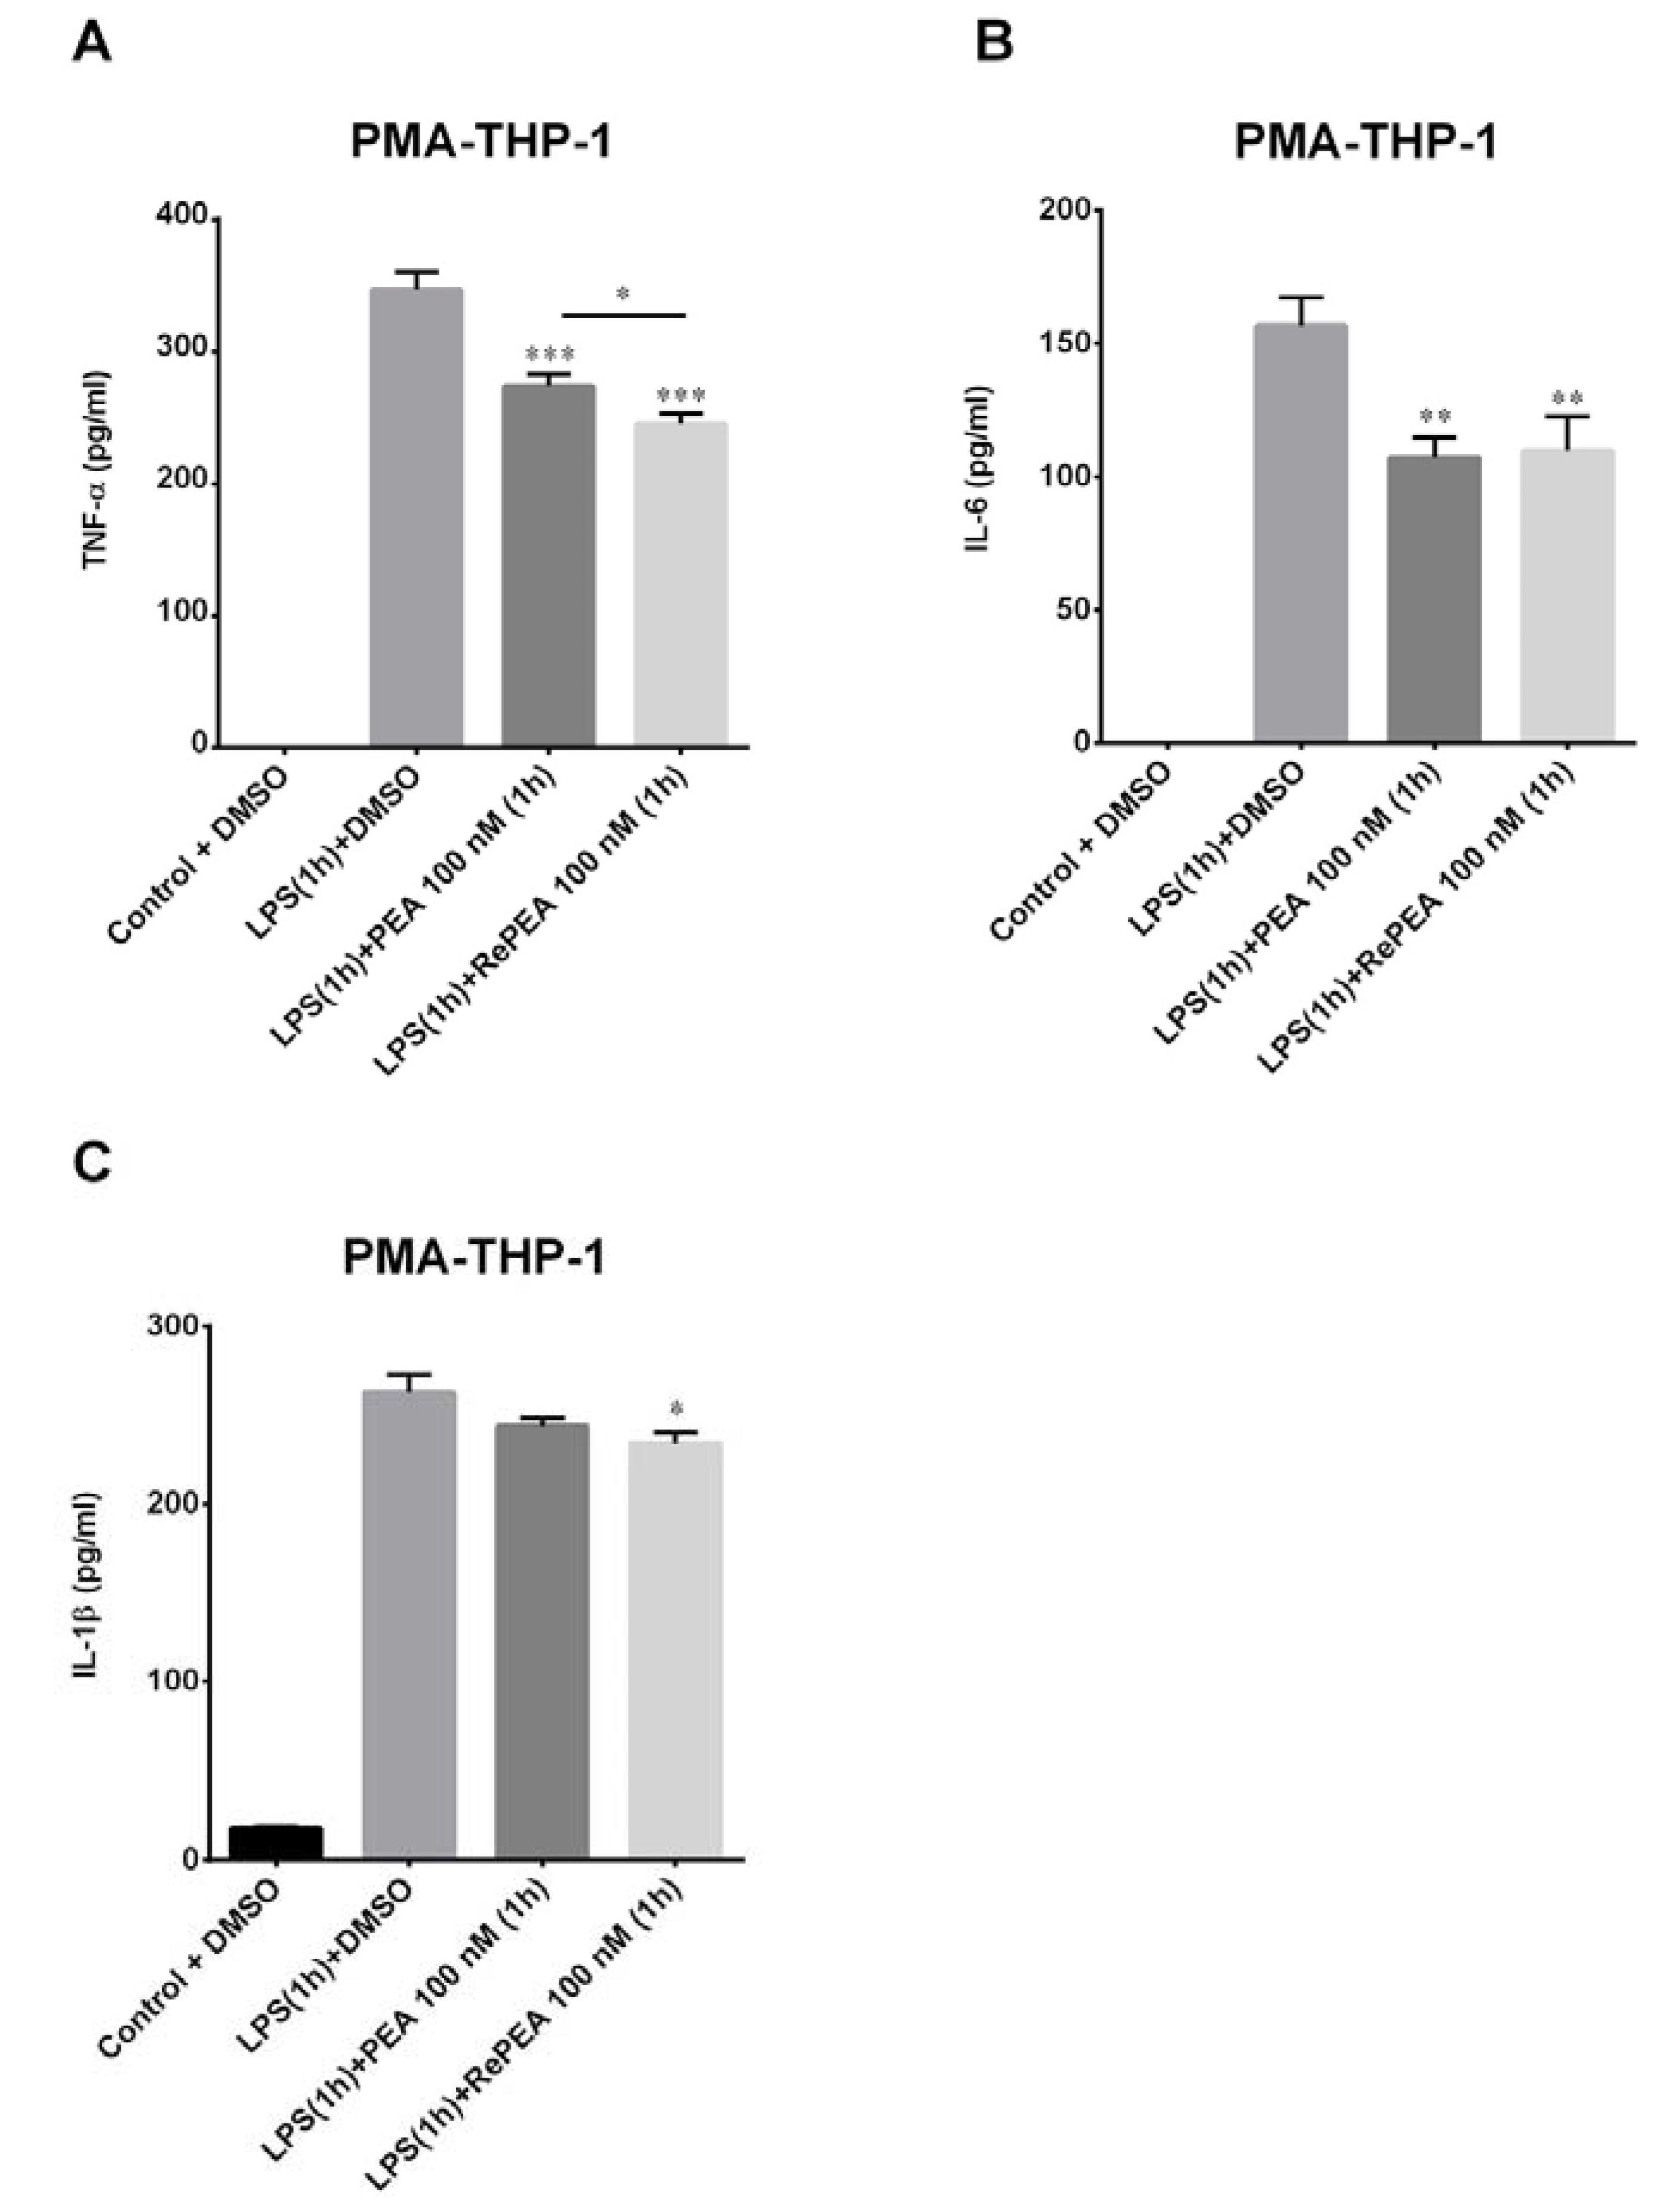
2.8. PEA and RePEA Effects on Nuclear Factor Kappa-Light-Chain-Enhancer of Activated B Cells (NF-κB) Activation in Human PMA-THP-1 X-Blue™ Cells
3. Discussion
4. Materials and Methods
4.1. Chemical Procedures
4.1.1. Synthesis of 3-Hydroxy-N-pentadecylpropanamide (RePEA)
4.1.2. Sample Preparation
4.2. Computational Methods
4.2.1. Molecular Docking
4.2.2. Density Functional Theory Calculations
4.3. FAAH Assay
4.4. Cell Cultures
4.4.1. Murine N9 Microglial Cells
4.4.2. THP-1 and THP-1 X-Blue™ Cells
4.5. Cell Viability Assay
4.6. Morphological Analysis
4.7. LPS Treatment with and without PEA and Its Analogues
4.8. Pro-Inflammatory Cytokine Release
4.9. SEAP Assay
4.10. Statistical Analysis
Supplementary Materials
Author Contributions
Funding
Conflicts of Interest
Abbreviations
| ABP | Acyl-chain Binding Pocket |
| AF-2 | Activation function-2 |
| DFT | Density Functional Theory |
| EA | Ethanolamine |
| FAAH | Fatty Acid Amide Hydrolase |
| HPA | Hydroxy-propionic acid |
| IL-1β | Interleukin-1β |
| IL-6 | Interleukin-6 |
| iNOS | inducible Nitric Oxide Synthase |
| LPS | Lipopolysaccharide |
| MAGL | Monoacylglycerol lipase |
| MD-2 | Myeloid differentiation protein-2 |
| MePEA | Methan-PEA |
| NAAA | N-acylethanolamine acid amidase |
| NF-κB | Nuclear Factor kappa-light-chain-enhancer of activated B cells |
| PEA | PalmitoylEthanolAmide |
| PPAR-α | Peroxisome Proliferator-Activated Receptor alpha |
| QM | Quantum Mechanical |
| QM-MM | Quantum Mechanics/Molecular Mechanics |
| RePEA | Retro-PEA |
| SEAP | Secreted embryonic alkaline phosphatase |
| SIFs | Structural Interaction Fingerprints |
| TLR | Toll Like Receptor |
| TNF-α | Tumor necrosis factor alpha |
References
- Lo Verme, J.; Fu, J.; Astarita, G.; La Rana, G.; Russo, R.; Calignano, A.; Piomelli, D. The Nuclear Receptor Peroxisome Proliferator-Activated Receptor-α Mediates the Anti-Inflammatory Actions of Palmitoylethanolamide. Mol. Pharmacol. 2005, 67, 15–19. [Google Scholar] [CrossRef] [PubMed]
- Rankin, L.; Fowler, C.J. The Basal Pharmacology of Palmitoylethanolamide. Int. J. Mol. Sci. 2020, 21, 7942. [Google Scholar] [CrossRef] [PubMed]
- Balvers, M.G.J.; Verhoeckx, K.C.M.; Meijerink, J.; Wortelboer, H.M.; Witkamp, R.F. Measurement of Palmitoylethanolamide and Other N-Acylethanolamines during Physiological and Pathological Conditions. CNS Neurol. Disord. Drug Targets. 2013, 12, 23–33. [Google Scholar] [CrossRef] [PubMed]
- Petrosino, S.; Moriello, A.S.; Cerrato, S.; Fusco, M.; Puigdemont, A.; De Petrocellis, L.; Di Marzo, V. The anti-inflammatory mediator palmitoylethanolamide enhances the levels of 2-arachidonoyl-glycerol and potentiates its actions at TRPV1 cation channels. Br. J. Pharmacol. 2016, 173, 1154–1162. [Google Scholar] [CrossRef] [PubMed]
- Desarnaud, F.; Cadas, H.; Piomelli, D. Anandamide amidohydrolase activity in rat brain microsomes. Identification and partial characterization. J. Biol. Chem. 1995, 270, 6030–6035. [Google Scholar] [CrossRef]
- Abadji, V.; Lin, S.; Taha, G.; Griffin, G.; Stevenson, L.A.; Pertwee, R.G.; Makriyannis, A. (R)-methanandamide: A chiral novel anandamide possessing higher potency and metabolic stability. J. Med. Chem. 1994, 37, 1889–1893. [Google Scholar] [CrossRef]
- Capelli, D.; Cerchia, C.; Montanari, R.; Loiodice, F.; Tortorella, P.; Laghezza, A.; Cervoni, L.; Pochetti, G.; Lavecchia, A. Structural basis for PPAR partial or full activation revealed by a novel ligand binding mode. Sci. Rep. 2016, 6, 34792. [Google Scholar] [CrossRef]
- Wu, C.-C.; Baiga, T.J.; Downes, M.; La Clair, J.J.; Atkins, A.R.; Richard, S.B.; Fan, W.; Stockley-Noel, T.A.; Bowman, N.E.; Noel, J.P.; et al. Structural basis for specific ligation of the peroxisome proliferator-activated receptor δ. Proc. Natl. Acad. Sci. USA 2017, 114, E2563–E2570. [Google Scholar] [CrossRef]
- Cronet, P.; Petersen, J.F.W.; Folmer, R.; Blomberg, N.; Sjöblom, K.; Karlsson, U.; Lindstedt, E.L.; Bamberg, K. Structure of the PPARα and -γ Ligand Binding Domain in Complex with AZ 242; Ligand Selectivity and Agonist Activation in the PPAR Family. Structure 2001, 8, 699–706. [Google Scholar] [CrossRef]
- Yoshida, T.; Oki, H.; Doi, M.; Fukuda, S.; Yuzuriha, T.; Tabata, R.; Ishimoto, K.; Kawahara, K.; Ohkubo, T.; Miyachi, H.; et al. Structural Basis for PPARα Activation by 1H-pyrazolo-[3,4-b]pyridine Derivatives. Sci. Rep. 2020, 10, 7623. [Google Scholar] [CrossRef]
- Xu, H.E.; Lambert, M.H.; Montana, V.G.; Parks, D.J.; Blanchard, S.G.; Brown, P.J.; Sternbach, D.D.; Lehmann, J.M.; Wisely, G.B.; Willson, T.M.; et al. Molecular Recognition of Fatty Acids by Peroxisome Proliferator–Activated Receptors. Mol. Cell. 1999, 3, 397–403. [Google Scholar] [CrossRef]
- Singh, J.; Deng, Z.; Narale, G.; Chuaqui, C. Structural interaction fingerprints: A new approach to organizing, mining, analyzing, and designing protein-small molecule complexes. Chem. Biol. Drug Des. 2006, 67, 5–12. [Google Scholar] [CrossRef] [PubMed]
- Bracey, M.H.; Hanson, M.A.; Masuda, K.R.; Stevens, R.C.; Cravatt, B.F. Structural adaptations in a membrane enzyme that terminates endocannabinoid signaling. Science 2002, 298, 1793–1796. [Google Scholar] [CrossRef] [PubMed]
- Tuo, W.; Leleu-Chavain, N.; Spencer, J.; Sansook, S.; Millet, R.; Chavatte, P. Therapeutic Potential of Fatty Acid Amide Hydrolase, Monoacylglycerol Lipase, and N-Acylethanolamine Acid Amidase Inhibitors. J. Med. Chem. 2017, 60, 4–46. [Google Scholar] [CrossRef] [PubMed]
- Palermo, G.; Bauer, I.; Campomanes, P.; Cavalli, A.; Armirotti, A.; Girotto, S.; Rothlisberger, U.; De Vivo, M. Keys to Lipid Selection in Fatty Acid Amide Hydrolase Catalysis: Structural Flexibility, Gating Residues and Multiple Binding Pockets. PLoS Comput. Biol. 2015, 11, e1004231. [Google Scholar] [CrossRef] [PubMed]
- Palermo, G.; Campomanes, P.; Cavalli, A.; Rothlisberger, U.; De Vivo, M. Anandamide hydrolysis in FAAH reveals a dual strategy for efficient enzyme-assisted amide bond cleavage via nitrogen inversion. J. Phys. Chem. B. 2015, 119, 789–801. [Google Scholar] [CrossRef]
- McKinney, M.K.; Cravatt, B.F. Structure and function of fatty acid amide hydrolase. Annu. Rev. Biochem. 2005, 74, 411–432. [Google Scholar] [CrossRef]
- Otrubova, K.; Ezzili, C.; Boger, D.L. The discovery and development of inhibitors of fatty acid amide hydrolase (FAAH). Bioorg. Med. Chem. Lett. 2011, 21, 4674–4685. [Google Scholar] [CrossRef]
- Palermo, G.; Rothlisberger, U.; Cavalli, A.; De Vivo, M. Computational insights into function and inhibition of fatty acid amide hydrolase. Eur. J. Med. Chem. 2015, 91, 15–26. [Google Scholar] [CrossRef]
- Tubert-Brohman, I.; Acevedo, O.; Jorgensen, W.L. Elucidation of Hydrolysis Mechanisms for Fatty Acid Amide Hydrolase and Its Lys142Ala Variant via QM/MM Simulations. J. Am. Chem. Soc. 2006, 128, 16904–16913. [Google Scholar] [CrossRef]
- Lodola, A.; Mor, M.; Rivara, S.; Christov, C.; Tarzia, G.; Piomelli, D.; Mulholland, A.J. Identification of productive inhibitor binding orientation in fatty acid amide hydrolase (FAAH) by QM/MM mechanistic modelling. Chem. Commun. 2008, 2, 214–216. [Google Scholar] [CrossRef] [PubMed]
- Lodola, A.; Mor, M.; Hermann, J.C.; Tarzia, G.; Piomelli, D.; Mulholland, A.J. QM/MM modelling of oleamide hydrolysis in fatty acid amide hydrolase (FAAH) reveals a new mechanism of nucleophile activation. Chem. Commun. 2005, 35, 4399–4401. [Google Scholar] [CrossRef] [PubMed][Green Version]
- Lodola, A.; Mor, M.; Sirirak, J.; Mulholland, A.J. Insights into the mechanism and inhibition of fatty acid amide hydrolase from quantum mechanics/molecular mechanics (QM/MM) modelling. Biochem. Soc. Trans. 2009, 37, 363–367. [Google Scholar] [CrossRef] [PubMed]
- Capoferri, L.; Mor, M.; Sirirak, J.; Chudyk, E.; Mulholland, A.J.; Lodola, A. Application of a SCC-DFTB QM/MM approach to the investigation of the catalytic mechanism of fatty acid amide hydrolase. J. Mol. Model. 2011, 17, 2375–2383. [Google Scholar] [CrossRef] [PubMed]
- Lodola, A.; Capoferri, L.; Rivara, S.; Tarzia, G.; Piomelli, D.; Mulholland, A.; Mor, M. Quantum Mechanics/Molecular Mechanics Modeling of Fatty Acid Amide Hydrolase Reactivation Distinguishes Substrate from Irreversible Covalent Inhibitors. J. Med. Chem. 2013, 56, 2500–2512. [Google Scholar] [CrossRef] [PubMed]
- McKinney, M.K.; Cravatt, B.F. Evidence for distinct roles in catalysis for residues of the serine-serine-lysine catalytic triad of fatty acid amide hydrolase. J. Biol. Chem. 2003, 278, 37393–37399. [Google Scholar] [CrossRef]
- Scalvini, L.; Ghidini, A.; Lodola, A.; Callegari, D.; Rivara, S.; Piomelli, D.; Mor, M. N-Acylethanolamine Acid Amidase (NAAA): Mechanism of Palmitoylethanolamide Hydrolysis Revealed by Mechanistic Simulations. ACS Catal. 2020, 20, 11797–11813. [Google Scholar] [CrossRef]
- Gorelik, A.; Gebai, A.; Illes, K.; Piomelli, D.; Nagar, B. Molecular mechanism of activation of the immunoregulatory amidase NAAA. Proc. Natl. Acad. Sci. USA 2018, 115, E10032–E10040. [Google Scholar] [CrossRef]
- Lodola, A.; Rivara, S.; Mor, M. Insights in the Mechanism of Action and Inhibition of N-Acylethanolamine Acid Amidase by Means of Computational Methods. Adv. Protein Chem. Struct. Biol. 2014, 96, 219–234. [Google Scholar] [CrossRef]
- Piomelli, D.; Scalvini, L.; Fotio, Y.; Lodola, A.; Spadoni, G.; Tarzia, G.; Mor, M. N-Acylethanolamine Acid Amidase (NAAA): Structure, Function, and Inhibition. J. Med. Chem. 2020, 63, 7475–7490. [Google Scholar] [CrossRef]
- Solorzano, C.; Zhu, C.; Battista, N.; Astarita, G.; Lodola, A.; Rivara, S.; Mor, M.; Russo, R.; Maccarrone, M.; Antonietti, F.; et al. Selective N-acylethanolamine-hydrolyzing acid amidase inhibition reveals a key role for endogenous palmitoylethanolamide in inflammation. Proc. Natl. Acad. Sci. USA 2009, 106, 20966–20971. [Google Scholar] [CrossRef] [PubMed]
- Righi, M.; Mori, L.; De Libero, G.; Sironi, M.; Biondi, A.; Mantovani, A.; Donini, S.D.; Ricciardi-Castagnoli, P. Monokine production by microglial cell clones. Eur. J. Immunol. 1989, 19, 1443–1448. [Google Scholar] [CrossRef] [PubMed]
- Fleisher-Berkovich, S.; Filipovich-Rimon, T.; Ben-Shmuel, S.; Hülsmann, C.; Kummer, M.P.; Heneka, M.T. Distinct modulation of microglial amyloid β phagocytosis and migration by neuropeptides (i). J. Neuroinflammation. 2010, 7, 61. [Google Scholar] [CrossRef] [PubMed]
- Guida, F.; Luongo, L.; Boccella, S.; Giordano, M.E.; Romano, R.; Bellini, G.; Manzo, I.; Furiano, A.; Rizzo, A.; Imperatore, R.; et al. Palmitoylethanolamide induces microglia changes associated with increased migration and phagocytic activity: Involvement of the CB2 receptor. Sci. Rep. 2017, 7, 375. [Google Scholar] [CrossRef] [PubMed]
- Rivest, S. Molecular insights on the cerebral innate immune system. Brain Behav. Immun. 2003, 1, 13–19. [Google Scholar] [CrossRef]
- Cohen, J. The immunopathogenesis of sepsis. Nature 2002, 420, 885–891. [Google Scholar] [CrossRef] [PubMed]
- Sanz, J.M.; Di Virgilio, F. Kinetics and mechanism of ATP-dependent IL-1 beta release from microglial cells. J. Immunol. 2000, 164, 4893–4898. [Google Scholar] [CrossRef] [PubMed]
- Ghosh, S.; Karin, M. Missing pieces in the NF-kappaB puzzle. Cell 2002, 109, S81–S96. [Google Scholar] [CrossRef]
- Cravatt, B.F.; Giang, D.K.; Mayfield, S.P.; Boger, D.L.; Lerner, R.A.; Gilula, N.B. Molecular characterization of an enzyme that degrades neuromodulatory fatty-acid amides. Nature 1996, 384, 83–87. [Google Scholar] [CrossRef]
- Ueda, N.; Yamanaka, K.; Yamamoto, S. Purification and Characterization of an Acid Amidase Selective forN-Palmitoylethanolamine, a Putative Endogenous Anti-inflammatory Substance. J. Biol. Chem. 2001, 276, 35552–35557. [Google Scholar] [CrossRef]
- Petrosino, S.; Cordaro, M.; Verde, R.; Schiano Moriello, A.; Marcolongo, G.; Schievano, C.; Siracusa, R.; Piscitelli, F.; Peritore, A.F.; Crupi, R.; et al. Oral Ultramicronized Palmitoylethanolamide: Plasma and Tissue Levels and Spinal Anti-hyperalgesic Effect. Front. Pharmacol. 2018, 9, 249. [Google Scholar] [CrossRef] [PubMed]
- Chirchiglia, D.; Chirchiglia, P.; Signorelli, F. Nonsurgical lumbar radiculopathies treated with ultramicronized palmitoylethanolamide (umPEA): A series of 100 cases. Neurol. Neurochir. Pol. 2018, 52, 44–47. [Google Scholar] [CrossRef] [PubMed]
- Passavanti, M.B.; Fiore, M.; Sansone, P.; Aurilio, C.; Pota, V.; Barbarisi, M.; Fierro, D.; Pace, M.D. The beneficial use of ultramicronized palmitoylethanolamide as add-on therapy to Tapentadol in the treatment of low back pain: A pilot study comparing prospective and retrospective observational arms. BMC Anesthesiol. 2017, 17, 171. [Google Scholar] [CrossRef] [PubMed]
- Marini, I.; Bartolucci, M.L.; Bortolotti, F.; Gatto, M.R.; Bonetti, G.A. Palmitoylethanolamide versus a nonsteroidal anti-inflammatory drug in the treatment of temporomandibular joint inflammatory pain. J. Orofac. Pain 2012, 26, 99–104. [Google Scholar]
- Truini, A.; Biasiotta, A.; Di Stefano, G.; La Cesa, S.; Leone, C.; Cartoni, C.; Federico, V.; Petrucci, M.T.; Cruccu, G. Palmitoylethanolamide restores myelinated-fibre function in patients with chemotherapy-induced painful neuropathy. CNS Neurol. Disord. Drug Targets 2011, 10, 916–920. [Google Scholar] [CrossRef]
- Paladini, A.; Fusco, M.; Cenacchi, T.; Schievano, C.; Piroli, A.; Varrassi, G. Palmitoylethanolamide, a Special Food for Medical Purposes, in the Treatment of Chronic Pain: A Pooled Data Meta-analysis. Pain Physician. 2016, 19, 11–24. [Google Scholar]
- Di Marzo, V.; Melck, D.; Orlando, P.; Bisogno, T.; Zagoory, O.; Bifulco, M.; Vogel, Z.; De Petrocellis, L. Palmitoylethanolamide inhibits the expression of fatty acid amide hydrolase and enhances the anti-proliferative effect of anandamide in human breast cancer cells. Biochem. J. 2001, 358, 249–255. [Google Scholar] [CrossRef]
- Ryberg, E.; Larsson, N.; Sjögren, S.; Hjorth, S.; Hermansson, N.-O.; Leonova, J.; Elebring, T.; Nilsson, K.; Drmota, T.; Greasley, P.J. The orphan receptor GPR55 is a novel cannabinoid receptor. Br. J. Pharmacol. 2007, 152, 1092–1101. [Google Scholar] [CrossRef]
- Vandevoorde, S.; Tsuboi, K.; Ueda, N.; Jonsson, K.-O.; Fowler, C.J.; Lambert, D.M. Esters, Retroesters, and a Retroamide of Palmitic Acid: Pool for the First Selective Inhibitors of N-Palmitoylethanolamine- Selective Acid Amidase. J. Med. Chem. 2003, 46, 4373–4376. [Google Scholar] [CrossRef]
- Tsuboi, K.; Sun, Y.-X.; Okamoto, Y.; Araki, N.; Tonai, T.; Ueda, N. Molecular characterization of N-acylethanolamine-hydrolyzing acid amidase, a novel member of the choloylglycine hydrolase family with structural and functional similarity to acid ceramidase. J. Biol. Chem. 2005, 280, 11082–11092. [Google Scholar] [CrossRef]
- Katayama, K.; Ueda, N.; Katoh, I.; Yamamoto, S. Equilibrium in the hydrolysis and synthesis of cannabimimetic anandamide demonstrated by a purified enzyme. Biochim. Biophys. Acta 1999, 1440, 205–214. [Google Scholar] [CrossRef]
- Kreutzberg, G.W. Microglia: A sensor for pathological events in the CNS. Trends Neurosci. 1996, 19, 312–318. [Google Scholar] [CrossRef]
- Brown, G.C.; Bal-Price, A. Inflammatory neurodegeneration mediated by nitric oxide, glutamate, and mitochondria. Mol. Neurobiol. 2003, 27, 325–355. [Google Scholar] [CrossRef]
- Gabay, C. Interleukin-6 and chronic inflammation. Arthritis Res. Ther. 2006, 8, S3. [Google Scholar] [CrossRef] [PubMed]
- Dinarello, C.A. Biologic basis for interleukin-1 in disease. Blood 1996, 87, 2095–2147. [Google Scholar] [CrossRef]
- Braddock, M.; Quinn, A. Targeting IL-1 in inflammatory disease: New opportunities for therapeutic intervention. Nat. Rev. Dug Discov. 2004, 3, 330–339. [Google Scholar] [CrossRef]
- Reutershan, J.; Chang, D.; Hayes, J.K.; Ley, K. Protective effects of isoflurane pretreatment in endotoxin-induced lung injury. Anesthesiology 2006, 104, 511–517. [Google Scholar] [CrossRef]
- Jung, W.-K.; Lee, D.-Y.; Park, C.; Choi, Y.H.; Choi, I.; Park, S.-G.; Seo, S.H.; Lee, S.W.; Yea, S.S.; Ahn, S.C.; et al. Cilostazol is anti-inflammatory in BV2 microglial cells by inactivating nuclear factor-kappaB and inhibiting mitogen-activated protein kinases. Br. J. Pharmacol. 2010, 159, 1274–1285. [Google Scholar] [CrossRef]
- Tang, Y.; Li, T.; Li, J.; Yang, J.; Liu, H.; Zhang, X.J.; Le, W. Jmjd3 is essential for the epigenetic modulation of microglia phenotypes in the immune pathogenesis of Parkinson’s disease. Cell Death Differ. 2014, 21, 369–380. [Google Scholar] [CrossRef]
- Liu, H.-C.; Zheng, M.-H.; Du, Y.-L.; Wang, L.; Kuang, F.; Qin, H.-Y.; Zhang, B.-F.; Han, H. N9 microglial cells polarized by LPS and IL4 show differential responses to secondary environmental stimuli. Cell Immunol. 2012, 278, 84–90. [Google Scholar] [CrossRef]
- Aisen, P.S. The potential of anti-inflammatory drugs for the treatment of Alzheimer’s disease. Lancet Neurol. 2002, 1, 279–284. [Google Scholar] [CrossRef]
- Block, M.L.; Hong, J.-S. Microglia and inflammation-mediated neurodegeneration: Multiple triggers with a common mechanism. Prog Neurobiol. 2005, 76, 77–98. [Google Scholar] [CrossRef] [PubMed]
- Gao, H.M.; Liu, B.; Zhang, W.; Hong, J.S. Novel anti-inflammatory therapy for Parkinson’s disease. Trends Pharmacol. Sci. 2003, 24, 395–401. [Google Scholar] [CrossRef]
- Rock, R.B.; Peterson, P.K. Microglia as a pharmacological target in infectious and inflammatory diseases of the brain. J. Neuroimmune Pharmacol. 2006, 1, 117–126. [Google Scholar] [CrossRef] [PubMed]
- Kawai, T.; Akira, S. The role of pattern-recognition receptors in innate immunity: Update on Toll-like receptors. Nat. Immunol. 2010, 11, 373–384. [Google Scholar] [CrossRef] [PubMed]
- Poltorak, A.; He, X.; Smirnova, I.; Liu, M.Y.; Van Huffel, C.; Du, X.; Birdwell, D.; Alejos, E.; Silva, M.; Galanos, C.; et al. Defective LPS signaling in C3H/HeJ and C57BL/10ScCr mice: Mutations in Tlr4 gene. Science 1998, 282, 2085–2088. [Google Scholar] [CrossRef] [PubMed]
- Park, B.S.; Lee, J.-O. Recognition of lipopolysaccharide pattern by TLR4 complexes. Exp. Mol. Med. 2013, 45, e66. [Google Scholar] [CrossRef] [PubMed]
- Shimazu, R.; Akashi, S.; Ogata, H.; Nagai, Y.; Fukudome, K.; Miyake, K.; Kimoto, M. MD-2, a molecule that confers lipopolysaccharide responsiveness on Toll-like receptor 4. J. Exp. Med. 1999, 189, 1777–1782. [Google Scholar] [CrossRef]
- Ohto, U.; Fukase, K.; Miyake, K.; Satow, Y. Crystal structures of human MD-2 and its complex with antiendotoxic lipid IVa. Science 2007, 316, 1632–1634. [Google Scholar] [CrossRef]
- Park, B.S.; Song, D.H.; Kim, H.M.; Choi, B.-S.; Lee, H.; Lee, J.-O. The structural basis of lipopolysaccharide recognition by the TLR4-MD-2 complex. Nature 2009, 458, 1191–1195. [Google Scholar] [CrossRef]
- Bryant, C.E.; Spring, D.R.; Gangloff, M.; Gay, N.J. The molecular basis of the host response to lipopolysaccharide. Nat. Rev. Microbiol. 2010, 8, 8–14. [Google Scholar] [CrossRef] [PubMed]
- Gerondakis, S.; Fulford, T.S.; Messina, N.L.; Grumont, R.J. NF-κB control of T cell development. Nat. Immunol. 2014, 15, 15–25. [Google Scholar] [CrossRef] [PubMed]
- Laird, M.H.W.; Rhee, S.H.; Perkins, D.J.; Medvedev, A.E.; Piao, W.; Fenton, M.J.; Vogel, S.N. TLR4/MyD88/PI3K interactions regulate TLR4 signaling. J. Leukoc. Biol. 2009, 85, 966–977. [Google Scholar] [CrossRef] [PubMed]
- Hayden, M.S.; Ghosh, S. Signaling to NF-kappaB. Genes Dev. 2004, 18, 2195–2224. [Google Scholar] [CrossRef]
- Oeckinghaus, A.; Ghosh, S. The NF-kappaB family of transcription factors and its regulation. Cold Spring Harb. Perspect. Biol. 2009, 1, a000034. [Google Scholar] [CrossRef]
- Facchini, F.A.; Di Fusco, D.; Barresi, S.; Luraghi, A.; Minotti, A.; Granucci, F.; Monteleone, G.; Peri, F.; Monteleone, I. Effect of chemical modulation of toll-like receptor 4 in an animal model of ulcerative colitis. Eur. J. Clin. Pharmacol. 2020, 76, 409–418. [Google Scholar] [CrossRef]
- Halgren, T.A.; Murphy, R.B.; Friesner, R.A.; Beard, H.S.; Frye, L.L.; Pollard, W.T.; Banks, J.L. Glide: A new approach for rapid, accurate docking and scoring. 2. Enrichment factors in database screening. J. Med. Chem. 2004, 47, 1750–1759. [Google Scholar] [CrossRef]
- Friesner, R.A.; Banks, J.L.; Murphy, R.B.; Halgren, T.A.; Klicic, J.J.; Mainz, D.T.; Repasky, M.P.; Knoll, E.H.; Shelley, M.; Perry, J.K.; et al. Glide: A new approach for rapid, accurate docking and scoring. 1. Method and assessment of docking accuracy. J. Med. Chem. 2004, 47, 1739–1749. [Google Scholar] [CrossRef]
- Repasky, M.P.; Shelley, M.; Friesner, R.A. Flexible Ligand Docking with Glide. Curr. Protoc. Bioinformatics 2007. [Google Scholar] [CrossRef]
- Sherman, W.; Friesner, R. Glide XP fragment docking and structurebased pharmacophores. Chem. Central J. 2009. [Google Scholar] [CrossRef][Green Version]
- Zhu, K.; Borrelli, K.W.; Greenwood, J.R.; Day, T.; Abel, R.; Farid, R.S.; Harder, E. Docking covalent inhibitors: A parameter free approach to pose prediction and scoring. J. Chem. Inf. Model. 2014, 54, 1932–1940. [Google Scholar] [CrossRef] [PubMed]
- Harder, E.; Damm, W.; Maple, J.; Wu, C.; Reboul, M.; Xiang, J.Y.; Wang, L.; Lupyan, D.; Dahglren, M.K.; Knight, J.L.; et al. OPLS3: A Force Field Providing Broad Coverage of Drug-like Small Molecules and Proteins. J. Chem. Theory Comput. 2016, 12, 281–296. [Google Scholar] [CrossRef] [PubMed]
- Jorgensen, W.L.; Maxwell, D.S.; Tirado-Rives, J. Development and Testing of the OPLS All-Atom Force Field on Conformational Energetics and Properties of Organic Liquids. J. Am. Chem. Soc. 1996, 118, 11225–11236. [Google Scholar] [CrossRef]
- Becke, A.D. Density-functional exchange-energy approximation with correct asymptotic behavior. Phys. Rev. A Gen. Phys. 1988, 38, 3098–3100. [Google Scholar] [CrossRef]
- Perdew, J.P. Density-functional approximation for the correlation energy of the inhomogeneous electron gas. Phys. Rev. B Condens. Matter 1986, 33, 8822–8824. [Google Scholar] [CrossRef]
- Dunning, T.H. Gaussian basis functions for use in molecular calculations. Contraction of (12s9p) atomic basis sets for the second row atoms. Chem. Phys. Lett. 1970, 7, 423–427. [Google Scholar] [CrossRef]
- Balasubramani, S.G.; Chen, G.P.; Coriani, S.; Diedenhofen, M.; Frank, M.S.; Franzke, Y.J.; Furche, F.; Grotjahn, R.; Harding, M.E.; Hattig, C.; et al. TURBOMOLE: Modular program suite for ab initio quantum-chemical and condensed-matter simulations. J. Chem. Phys. 2020, 152, 184107. [Google Scholar] [CrossRef]
- Eichkorn, K.; Weigend, F.; Treutler, O.; Ahlrichs, R. Auxiliary basis sets for main row atoms and transition metals and their use to approximate Coulomb potentials. Theor. Chem. Acta 1997, 97, 119–124. [Google Scholar] [CrossRef]
- Grimme, S.; Antony, J.; Ehrlich, S.; Krieg, H. A consistent and accurate ab initio parametrization of density functional dispersion correction (DFT-D) for the 94 elements H-Pu. J. Chem. Phys. 2010, 132, 154104. [Google Scholar] [CrossRef]
- Klamt, A. Conductor-like Screening Model for Real Solvents: A New Approach to the Quantitative Calculation of Solvation Phenomena. J. Phys. Chem. 1995, 99, 2224–2235. [Google Scholar] [CrossRef]
- Klamt, A. Calculation of UV/Vis Spectra in Solution. J. Phys. Chem. 1996, 100, 3349–3353. [Google Scholar] [CrossRef]
- Jonsson, K.-O.; Vandevoorde, S.; Lambert, D.M.; Tiger, G.; Fowler, C.J. Effects of homologues and analogues of palmitoylethanolamide upon the inactivation of the endocannabinoid anandamide. Br. J. Pharmacol. 2001, 133, 1263–1275. [Google Scholar] [CrossRef] [PubMed]


Publisher’s Note: MDPI stays neutral with regard to jurisdictional claims in published maps and institutional affiliations. |
© 2020 by the authors. Licensee MDPI, Basel, Switzerland. This article is an open access article distributed under the terms and conditions of the Creative Commons Attribution (CC BY) license (http://creativecommons.org/licenses/by/4.0/).
Share and Cite
D’Aloia, A.; Arrigoni, F.; Tisi, R.; Palmioli, A.; Ceriani, M.; Artusa, V.; Airoldi, C.; Zampella, G.; Costa, B.; Cipolla, L. Synthesis, Molecular Modeling and Biological Evaluation of Metabolically Stable Analogues of the Endogenous Fatty Acid Amide Palmitoylethanolamide. Int. J. Mol. Sci. 2020, 21, 9074. https://doi.org/10.3390/ijms21239074
D’Aloia A, Arrigoni F, Tisi R, Palmioli A, Ceriani M, Artusa V, Airoldi C, Zampella G, Costa B, Cipolla L. Synthesis, Molecular Modeling and Biological Evaluation of Metabolically Stable Analogues of the Endogenous Fatty Acid Amide Palmitoylethanolamide. International Journal of Molecular Sciences. 2020; 21(23):9074. https://doi.org/10.3390/ijms21239074
Chicago/Turabian StyleD’Aloia, Alessia, Federica Arrigoni, Renata Tisi, Alessandro Palmioli, Michela Ceriani, Valentina Artusa, Cristina Airoldi, Giuseppe Zampella, Barbara Costa, and Laura Cipolla. 2020. "Synthesis, Molecular Modeling and Biological Evaluation of Metabolically Stable Analogues of the Endogenous Fatty Acid Amide Palmitoylethanolamide" International Journal of Molecular Sciences 21, no. 23: 9074. https://doi.org/10.3390/ijms21239074
APA StyleD’Aloia, A., Arrigoni, F., Tisi, R., Palmioli, A., Ceriani, M., Artusa, V., Airoldi, C., Zampella, G., Costa, B., & Cipolla, L. (2020). Synthesis, Molecular Modeling and Biological Evaluation of Metabolically Stable Analogues of the Endogenous Fatty Acid Amide Palmitoylethanolamide. International Journal of Molecular Sciences, 21(23), 9074. https://doi.org/10.3390/ijms21239074