Abstract
Non-alcoholic steatohepatitis (NASH) is a severe form of non-alcoholic fatty liver disease that is growing in prevalence. Symptoms of NASH become apparent when the disease has progressed significantly. Thus, there is a need to identify biomarkers of NASH in order to detect the disease earlier and to monitor disease severity. The inflammasome has been shown to play a role in liver diseases. Here, we performed a proof of concept study of biomarker analyses (cut-off points, positive and negative predictive values, receiver operating characteristic (ROC) curves, and likelihood ratios) on the serum of patients with NASH and healthy controls on apoptosis-associated speck-like protein containing a caspase recruitment domain (ASC), interleukin (IL)-18, Galectin-3 (Gal-3), and C-reactive protein (CRP). ASC, IL-18, and Gal-3 were elevated in the serum of NASH patients when compared to controls. The area under the curve (AUC) for ASC was the highest (0.7317) with an accuracy of 68%, followed by IL-18 (0.7036) with an accuracy of 66% and Gal-3 (0.6891) with an accuracy of 61%. Moreover, we then fit a stepwise multivariate logistic regression model using ASC, IL-18, and Gal-3 to determine the probability of patients having a NASH diagnosis, which resulted in an AUC of 0.71 and an accuracy of 79%, indicating that combining these biomarkers increases their diagnostic potential for NASH. These results indicate that ASC, IL-18, and Gal-3 are reliable biomarkers of NASH and that combining these analytes increases the biomarker potential of these proteins.
1. Introduction
Non-alcoholic fatty liver disease (NAFLD) is a common liver disease, which ranges from steatosis to non-alcoholic steatohepatitis (NASH), the most severe type [1]. A patient with steatosis may eventually progress to NASH if no treatment is initiated. NASH is characterized by steatosis, inflammation, and a characteristic pattern of hepatocellular injury [1]. NASH may progress to cirrhosis, cancer, and eventually the patient may require a liver transplant [1]. The prevalence of NASH has grown over the last few decades, and it is predicted to increase in frequency. For instance, cases in 2016 were estimated at 17.32 million cases in the United States, and it is estimated that the number of cases by the year 2030 will rise by 56% [2]. Currently, the diagnosis of NASH is made by a liver biopsy. Due to the invasive nature of this diagnostic method and the severity of the disease, it is imperative to develop a less invasive test using blood biomarkers in order to diagnose and monitor the disease with more ease and accuracy.
Galectin-3 (Gal-3) is a lectin protein that binds galactose-containing glycoproteins, and it is involved in the pathology of fibrosis in a number of organs, including the liver [3]. Furthermore, Gal-3 expression is associated with increased severity of steatosis and NASH. Gal-3 ablation protects mice from high fat diet-induced NASH when compared to wildtype mice [4]. Moreover, Gal-3 deficient mice present with milder liver disease when compared to wildtype controls. However, there have also been studies that show that when compared to wildtype mice, Gal-3 knockout mice promote hepatic injury when fed a choline deficient amino acid-defined (CDAA) diet [5] and steatosis when fed a high fat diet [6]. Each of these diets are used to model NAFLD in rodents. Despite the contrasting evidence on the role of Gal-3 in NASH, Gal-3 inhibitors are currently being developed as potential treatments for NASH [7].
A primary characteristic of NASH that distinguishes it from other NAFLDs is inflammation [2]. Following liver injury, an inflammatory response is initiated that is mediated in part by the pro-inflammatory cytokine interleukin (IL)-1β that is released from cells in the liver [8]. Active IL-1β is released via the inflammasome, a multiprotein complex that typically contains a NOD-like receptor (NLR), an adaptor protein known as apoptosis-associated speck-like protein containing a caspase recruitment domain (ASC), and inflammatory caspase-1 [9]. When the inflammasome is activated, it processes IL-1β and IL-18 into their respective active forms to then spread inflammation to other tissues and cells.
Inflammasomes are present in hepatocytes [10], liver stellate cells [11], and sinusoidal endothelial cells [12]. The NLRP3 inflammasome, in particular, plays a role in the progression of NASH [13]. In wildtype mice, the CDAA diet induces hepatic steatosis. However, when the same diet is given to NLRP3 knockout mice, they are protected from liver injury and fibrosis while NLRP3 knock-in mice showed severe liver inflammation and early signs of fibrosis. In addition, mRNA expression levels of NLRP3, ASC, caspase-1, pro-IL-1β, and pro-IL-18 are upregulated in the liver of NASH patients compared to healthy controls [10,13].
Inflammasome may lead to pyroptosis, which causes cells to release their contents, including inflammasome proteins, following cell death [9], and thus, it contributes to the spread of the inflammatory response. This release of inflammasome proteins makes inflammasome proteins promising biomarkers of inflammation. Our studies have shown inflammasome signaling proteins as inflammatory biomarkers of brain injury [14], stroke [15], Alzheimer’s disease [16], mild cognitive impairment [16], depression [17], multiple sclerosis [18], and psoriasis [19]. In this paper, we extend our previous biomarker studies by examining the protein levels of ASC, C-reactive protein (CRP), IL-18, and Gal-3 as potential biomarkers of NASH. We conducted receiver operating characteristic (ROC) analysis with associated sensitivity and specificity as well as calculated cut-off points for the diagnosis of NASH.
2. Results
2.1. ASC, IL-18, and Gal-3 Are Elevated in Serum of NASH Patients
Serum samples from NASH patients and normal age-matched controls were analyzed for the protein levels of ASC (p = 0.0003, Figure 1A), IL-18 (p = 0.0014, Figure 1B), Gal-3 (p = 0.008, Figure 1C), and CRP (p = 0.4385, (Figure 1D). The protein expression levels for ASC, IL-18, and Gal-3 were significantly higher in the serum of NASH patients when compared to healthy controls. However, CRP protein expression levels were not significantly different between groups. These data suggest an involvement of ASC, IL-18, and Gal-3 in the pathology of NASH.
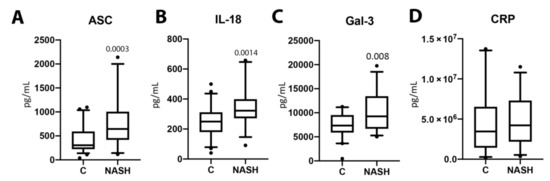
Figure 1.
The concentration of inflammasome proteins is increased in NASH patient serum. The protein concentration levels in pg/mL of ASC (A), IL-18 (B), Gal-3 (C), and CRP (D) in the serum of aged-matched controls and NASH patients. N = ASC: 53 controls, 32 NASH; IL-18: 58 controls, 31 NASH; Gal-3: 39 controls, 32 NASH; and CRP: 33 controls, 31 NASH. Box and whiskers are shown for the 5th and 95th percentile. C: Control; NASH: Non-alcoholic Steatohepatitis; ASC: Apoptosis-Associated Speck-like Protein Containing a Caspase Recruitment Domain; IL-18: Interleukin-18; Gal-3: Galectin-3; CRP: C-Reactive Protein.
2.2. ASC Is a Potential Serum Biomarker of NASH
In order to establish whether ASC, IL-18, and Gal-3 proteins could be considered as reliable biomarkers of NASH, the area under the curve (AUC) was determined for ASC (Figure 2A), IL-18 (Figure 2B), Gal-3 (Figure 2C), and CRP (Figure 2D). The AUC of each protein analyzed was compared to each other (Figure 3). ASC had the highest AUC of 0.7317 (p = 0.0004) (Table 1), IL-18 had an AUC of 0.7036 (p = 0.0016) (Table 1), and Gal-3 had an AUC of 0.6891 (p = 0.0064) (Table 1). The cut-off point for ASC was 394.9 pg/mL with 81% sensitivity and 60% specificity, the IL-18 cut-off point was 269.2 pg/mL with 77% sensitivity and 60% specificity, and for Gal-3, the cut-off point was 7120 pg/mL with 75% sensitivity and 49% specificity (Table 2); thus, indicating that ASC, IL-18, and Gal-3 are reliable biomarkers of NASH.
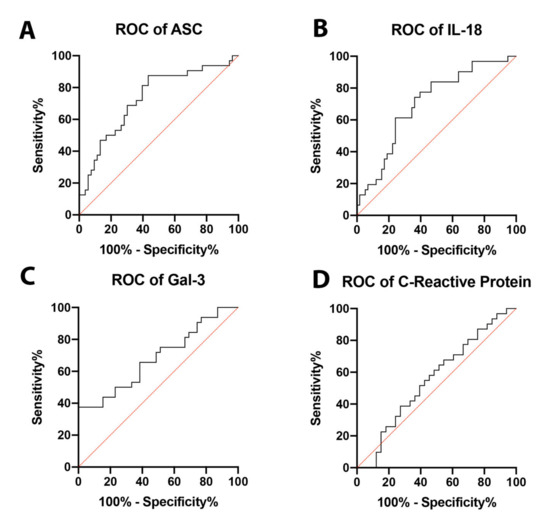
Figure 2.
ROC curves for analyzed proteins. ROC curves for ASC (A), IL-18 (B), Gal-3 (C), and CRP (D) from the serum of aged-matched controls and NASH patients. N = ASC: 53 controls, 32 NASH; IL-18: 58 controls, 31 NASH; Gal-3: 39 controls, 32 NASH; and CRP: 33 controls, 31 NASH. C: Control; NASH: Non-alcoholic Steatohepatitis; ASC: Apoptosis-Associated Speck-like Protein Containing a Caspase Recruitment Domain; IL-18: Interleukin-18; Gal-3: Galectin-3. ROC: Receiver Operating Characteristics.
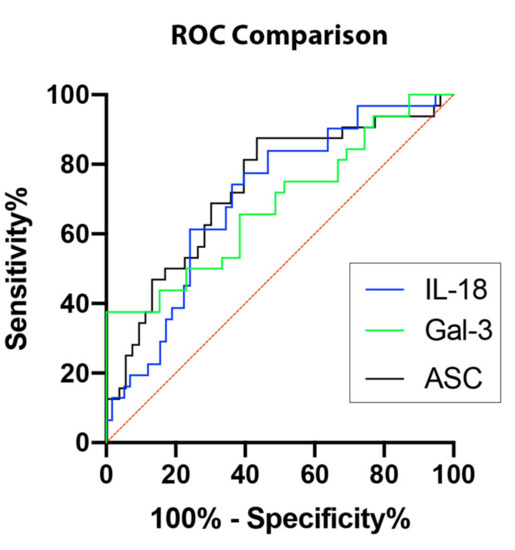
Figure 3.
Inflammasome proteins as potential biomarkers for NASH. Comparison of ROC curves for ASC (black), IL-18 (blue), and Gal-3 (green). N = ASC: 53 controls, 32 NASH; IL-18: 58 controls, 31 NASH; Gal-3: 39 controls, 32 NASH. ROC: Receiver Operating Characteristics.

Table 1.
ROC analysis results for signaling proteins in serum.
Table 2.
Cut-off point analyses for signaling proteins in serum as markers of NASH.
2.3. Logistic Regression between ASC, IL-18, and Gal-3
To predict the probability that either ASC, IL-18, and Gal-3 contribute to the pathology of NASH, we ran binomial logistic regression models for the probability of explaining the diagnosis of NASH. Accordingly, three univariate models were tested using each analyte that showed statistically significant difference between controls and NASH patients. All three analytes presented AUC values greater than 0.65 (ASC (0.82), IL-18 (0.74), and Gal-4 (0.69)) and a Hosmer–Lemeshow p-value greater than 0.05 (ASC (0.29), IL-18 (0.34), and Gal-4 (0.12)) (Table 3)
Table 3.
Univariate analysis.
Then, the analytes were used to fit a multivariate binominal logistic regression model (Table 4). Accordingly, the multivariate logistic regression model presented the following metrics: AUC 0.71, McFadden Pseudo-R2 0.35, Hosmer–Lemeshow p-value: 0.49, AIC: 70.37, and BIC: 79.36. Overall, this model was 79% accurate with an 81% sensitivity, a 60% specificity, 68% PPV, and 87% NPV.
Table 4.
Multivariate analysis.
3. Discussion
Here, we provide evidence that ASC, IL-18, and Gal-3 potentially play a role in the pathology of NASH and may serve as reliable biomarkers of NASH. All three proteins were elevated in serum of NASH patients compared to age-matched controls. In this study, we calculated AUC values for ASC, IL-18, and Gal-3. We show that ASC is the most reliable biomarker with the highest AUC (0.7317), followed by IL-18 (0.7036) and Gal-3 (0.6891). To further predict whether ASC, IL-18, and Gal-3 may serve as biomarkers of NASH pathology, we ran a binomial logistical regression. Our analyses indicate that the odds of a NASH diagnosis increased with increased protein levels of ASC (exponentiated coefficient: 1.0052), IL-18 (exponentiated coefficient: 1.0083), and Gal-3 (exponentiated coefficient: 1.0002) in serum. The accuracy of each individual analyte for the diagnosis of NASH corresponded to 68, 66, and 61%, respectively. However, when all three proteins were combined in a multivariate logistic regression model, the accuracy increased to 79%.
NAFLD is an umbrella term for a group of fatty liver diseases not induced by alcohol consumption. It encompasses steatosis as well as NASH. Steatosis (also known as non-alcoholic fatty liver) is characterized by fat accumulation in more than 5% of hepatocytes, and it is the least severe form of NAFLD, whereas NASH is characterized by inflammation and hepatocellular injury in addition to steatosis and is the most severe form of NAFLD [1]. NASH is likely to progress to fibrosis, cirrhosis, and even hepatocellular carcinoma [20].
Gal-3 is implicated in the progression of fibrosis of many different organs, including the liver [3], and has been implicated in the regulation of metabolic disorders including obesity and diabetes [21,22]. Gal-3 has been found to mediate inflammation and injury in acetaminophen-induced hepatotoxicity [23]. There is contradicting reports as to how Gal-3 affects NASH pathology. For instance, ablation of Gal-3 seems to protect mice from NASH development and severity in one study [4]. Alternatively, other studies have shown that Gal-3 ablation increases hepatocellular injury [5] and steatosis [6]. A fourth study suggests that Gal-3 has multiple roles in NASH, with CD68/Gal-3+ cells decreasing with severity of steatosis and NASH and α-smooth muscle actin/Gal-3+ cells increasing with severity of fibrosis [24]. Additionally, a Gal-3 inhibitor recently underwent a phase 2b clinical trial, but there were no significant effects on fibrosis or portal hypertension [7]. Consistent with a potential role for Gal-3 in liver pathology and fibrosis, here we show that Gal-3 is increased in the serum of patients with NASH.
CRP is a commonly used biomarker for systemic inflammation and has been found to be elevated in NASH [25]. There is evidence that serum CRP levels has a significant positive relationship with non-alcoholic fatty liver disease severity [26]. It has been suggested that CRP (and high sensitivity CRP) is an obesity independent marker of NASH [27,28,29]. However, in obese patients that were also diagnosed with NASH, CRP levels were increased in the liver and adipose tissue but not in serum [30]. A similar result was seen with high sensitivity CRP. Increased levels of high sensitivity CRP correlated with body mass index but did not predict the diagnosis of NASH [31,32]. There is also evidence that CRP is not indicative of NASH at all [33]. Similarly, we found no statistically significant difference in levels of serum CRP in NASH patients when compared to healthy controls.
The inflammasome has been found to play a role in NASH as well as other liver diseases. Inflammasome components have been proven to exist in several types of liver cells [10,11,12], strengthening the potential role of inflammasomes in liver inflammation. In hepatitis A, B, and C, there are elevated levels of IL-1β, thus indicating a potential role for the inflammasome [34]. In acetaminophen hepatotoxicity and ischemia/reperfusion, the NLRP3 inflammasome has been found to be involved in the inflammatory response [12,35]. The inflammasome has also been implicated in alcoholic liver disease (ALD), which encompasses a spectrum of liver diseases due to alcohol consumption. Accordingly, the effects of IL-1 on ALD have been associated to inflammasome signaling activation in bone marrow-derived Kupfer cells of mice [36].
One of the distinguishing features of NASH is inflammation. The inflammasome is thought to be responsible for this inflammation. For instance, ASC-deficient mice were protected from steatosis induced by a high fat diet [37]. Moreover, the NLRP3 inflammasome plays a major role in the inflammatory response in animal models of NASH. Accordingly, mRNA expression of NLRP3, ASC, caspase-1, pro-IL-1β, and pro-IL-18 is upregulated in the liver of NASH patients compared to healthy controls [10,13], and when NLRP3 was knocked out in a rodent model of NAFLD, the mice were protected from liver injury and fibrosis [13]. In the same study, knocking-in NLRP3 resulted in more severe inflammation and fibrosis. Evidence demonstrating the role of inflammasomes in NASH pathogenesis supports the idea that inflammasome components have potential as biomarkers of NASH. Here, we found that ASC and IL-18, in addition to Gal-3, can be used as reliable biomarkers of NASH based on AUC values of 0.73, 0.70, and 0.69, respectively.
Due to the beneficial role of a non-invasive diagnostic test for NASH, a few potential biomarkers have been studied. A serum biomarker test for cytokeratin-18 fragments (generated during cell death and apoptosis) has been tested but has a low sensitivity and has not been validated for NASH diagnosis [20]. High sensitivity CRP has also been tested as a serum biomarker with promising results [28,38], but as discussed above, CRP findings seem to vary across different cohorts of patients. Plasma Pentraxin-3 levels are increased in NASH patients, especially those with more severe disease (stages 3-4) compared to less severe disease (stages 0–2) and non-NASH (NAFLD patients) [39]. An in-depth analysis of plasma lipids proposed a signature of 20 candidates to distinguish NASH from steatosis [40]. Though most diagnostic tests use serum, one study evaluated urinary metabolomics to identify a panel of potential biomarkers to distinguish NASH from steatosis [41]. There are many potential biomarkers, for the diagnosis of NASH; however, none of them are ready for clinical use and all require further investigation [42].
Previous studies have shown AUC values of 0.63 for individual biomarkers such as fatty liver index [43] or 0.59 for tissue inhibitor of metalloproteinase 1 (TIMP 1), 0.73 for hyaluronic acid, 0.67 for cytokeratin-18, and 0.62 for human cartilage glycoprotein 39 (also known as YKL-40) [44] in individuals with NASH. In addition, combination of other diagnostic factors such body mass index, alanine aminotransferase, prolactin, high density lipoprotein cholesterol, and hemoglobin A1c provide AUC values of 0.86 [43]. Thus, our data showing single analytes with AUC values between 0.61 and 0.68 are consistent with other individual biomarkers of NASH, and together these findings highlight the difficulty in identifying individual biomarkers that are sensitive and specific enough for NASH. For instance, other studies have tested the effects of inflammation on liver elastography to obtain liver stiffness measurements and liver fibrosis in patients with hepatitis C virus (HCV) infections. Accordingly, in HCV, using models that included alanine aminotransferase (ALT), aspartate aminotransferase (AST), the AUC values were in the 0.9 range when measuring serum transaminase and liver fibrosis overestimation [45].
Increased inflammasome protein expression and Gal-3 have been associated with common comorbidities of NASH, such as hypertension, obesity, and type 2 diabetes, making it difficult to correlate these potential biomarkers with NASH exclusively [1,20,46]. Further studies analyzing serum samples from patients with varying NASH severities may help further confirm the role of ASC, IL-18, and Gal-3 as inflammatory biomarkers for this condition. Likewise, given that the presence of inflammation differentiates NASH from steatosis, further studies comparing serum levels of ASC, IL-18, and Gal-3 in patients with NASH to those with steatosis may help validate these potential biomarkers for NASH. Moreover, despite some of the comorbidities present in some of the patients used in this study, which are typical of patients with metabolic syndrome, the present study was powered to include patients with NASH and not the other comorbidities. Furthermore, logistic regression analyses were carried out to single out the diagnosis of NASH over other comorbidities; thus, providing evidence that the results obtained were more consistent with NASH than with the comorbidities that were presented by some of the patients in the study such as diabetes or hypertension. Accordingly, the p-values for the univariate logistic regression of NASH vs hypertension was p = 0.989, vs obesity p = 0.992, vs hypercholesterolemia p = 0.992, vs diabetes p = 0.988 and vs hyperlipidemia p = 0.988. Future studies are needed to validate ASC, IL-18, and Gal-3 as biomarkers of NASH in serum using a larger sample size for different disease severities. Most importantly, in this study, only some patients were diagnosed by biopsy procedures. Thus, additional studies are needed to validate these biomarkers in serum to correlate serum protein levels to protein levels obtained histologically from biopsy samples in all patients studied.
In conclusion, our results show that ASC, IL-18, and Gal-3 are elevated in the serum of patients with NASH. These three proteins present high AUC values, making them reliable biomarkers of NASH. Moreover, binomial logistic regression modeling using ASC, IL-18, and Gal-3 indicated that combined, these proteins are reliable to predict a diagnosis of NASH. These findings provide evidence for viable blood biomarker tests for NASH, which can comprise part of a biomarker panel to potentially eliminate the need for liver biopsy to diagnose this disease.
4. Materials and Methods
4.1. Participants
Serum samples were purchased from BioIVT (Hicksville, NY, USA). Donors were enrolled in the study Prospective Collection of Samples for Research sponsored by SeraTrials, LLC. with IRB number 20170439. Samples were obtained after informed consent. We analyzed serum samples from 14 male and 18 female patients diagnosed with NASH (Table 5) in the age range of 26 to 83 and 40 normal age-matched healthy controls. NASH diagnosis was made by a combination of methods, including magnetic resonance imaging, abdominal ultrasound, esophagogastroduodenoscopy, computerized tomography scans, fibroscan and biopsy as well as measurement of liver enzymes (ALT, AST), bilirubin, albumin and blood urea nitrogen.
Table 5.
Patients with NASH.
4.2. Multi- and Single- Plex Assays
Protein concentrations for the inflammasome signaling proteins ASC and IL-18 as well as galectin-3 and C-reactive protein (CRP) in serum samples from NASH patients and age-matched controls was performed using the Ella System (Protein Simple, San Jose, CA, USA) as described in [47].
4.3. Biomarker Analyses
Data obtained by the Simple and Multi-Plex assays were analyzed with Prism 9 software (v. 9.0.0) (GraphPad). Outliers were removed and receiver operating characteristics (ROC) were calculated, obtaining a 95% confidence interval, a standard deviation and a p-value. A cut-off point was then obtained for a range of different specificities and sensitivities and their respective likelihood ratio and accuracy.
4.4. Statistical Analyses
After identifying and eliminating outliers using the robust regression and outlier removal (ROUT) method with a Q equal to 1%, normality was tested by the Shapiro-Wilk normality test, and statistical difference between groups was tested by the Mann-Whitney test for non-normally distributed data. A significant two-tailed p-value was considered at less than 0.05.
Binomial logistic regression models were compared for their ability to discriminate between patients diagnosed with NASH and those in the control group as well as for the calibration of the model for the goodness of fit through the AUC, the Akaike information criterion (AIC), the Bayesian information criterion (BIC), the McFadden-pseudoR2 and the Hosmer–Lemeshow goodness-of-fit test [48]. A multivariate binomial logistic model was chosen for variables with variables that univariately showed an AUC greater than 0.65 and a Hosmer–Lemeshow p-value greater than 0.05. The multivariate model was estimated through forward stepwise regression. The model chosen was the one that presented the lowest AIC.
Author Contributions
Conceptualization, J.P.d.R.V. and R.W.K.; methodology, J.P.d.R.V.; formal analysis, J.P.d.R.V. and B.C.; investigation, J.P.d.R.V. and B.C.; resources, J.P.d.R.V. and R.W.K.; data curation, J.P.d.R.V.; writing—original draft preparation, review and editing, B.C., J.P.d.R.V. and R.W.K.; project administration, J.P.d.R.V.; funding acquisition, J.P.d.R.V. and R.W.K. All authors have read and agreed to the published version of the manuscript.
Funding
This work was supported by a Sponsored Research Grant from ZyVersa Therapeutics (1 November 2019) to J.P.d.R.V. and R.W.K.
Conflicts of Interest
J.P.d.R.V. and R.W.K. are co-founders and managing members of InflamaCORE, LLC and have licensed patents on inflammasome proteins as biomarkers of injury and disease as well as on targeting inflammasome proteins for therapeutic purposes. J.P.d.R.V. and R.W.K. are Scientific Advisory Board Member of ZyVersa Therapeutics. B.C. declares no conflicts of interest. ZyVersa Therapeutics, Inc. has been granted a worldwide exclusive license for development and commercialization of inflammasome inhibitor, IC 100, and related products for the treatment of inflammatory diseases, and for companion diagnostics. ZyVersa Therapeutics was not involved in the study design, data collection, analysis and interpretation of data, as well as in the writing of this article or the decision to publish the result.
Abbreviations
| AIC | Akaike Information Criterion |
| ALD | Alcoholic Liver Disease |
| ASC | Apoptosis-associated Speck-like protein containing a Caspase recruiting domain |
| AUC | Area Under the Curve |
| BIC | Bayesian Information Criterion |
| CDAA | Choline Deficient Amino Acid-defined |
| C.I. | Confidence Interval |
| CKD | Chronic Kidney Disease |
| CRP | C-Reactive Protein |
| Gal-3 | Galectin-3 |
| HLD | Hyperlipidemia |
| HTN | Hypertension |
| IL | Interleukin |
| NAFLD | Non-Alcoholic Fatty Liver Disease |
| NASH | Non-Alcoholic Steatohepatitis |
| NPV | Negative Predictive Value |
| PPV | Positive Predictive Value |
| RA | Rheumatoid Arthritis |
| ROC | Receiver Operating Characteristic |
| VIF | Variance Inflection Factor |
References
- Tesfay, M.; Goldkamp, W.J.; Neuschwander-Tetri, B.A. NASH: The Emerging Most Common Form of Chronic Liver Disease. Mo. Med. 2018, 115, 225–229. [Google Scholar] [PubMed]
- Estes, C.; Anstee, Q.M.; Arias-Loste, M.T.; Bantel, H.; Bellentani, S.; Caballeria, J.; Colombo, M.; Craxi, A.; Crespo, J.; Day, C.P.; et al. Modeling NAFLD disease burden in China, France, Germany, Italy, Japan, Spain, United Kingdom, and United States for the period 2016–2030. J. Hepatol. 2018, 69, 896–904. [Google Scholar] [CrossRef] [PubMed]
- Li, L.-C.; Li, J.; Gao, J. Functions of Galectin-3 and Its Role in Fibrotic Diseases. J. Pharmacol. Exp. Ther. 2014, 351, 336–343. [Google Scholar] [CrossRef] [PubMed]
- Iacobini, C.; Menini, S.; Ricci, C.; Fantauzzi, C.B.; Scipioni, A.; Salvi, L.; Cordone, S.; Delucchi, F.; Serino, M.; Federici, M.; et al. Galectin-3 ablation protects mice from diet-induced NASH: A major scavenging role for galectin-3 in liver. J. Hepatol. 2011, 54, 975–983. [Google Scholar] [CrossRef] [PubMed]
- Nomoto, K.; Nishida, T.; Nakanishi, Y.; Fujimoto, M.; Takasaki, I.; Tabuchi, Y.; Tsuneyama, K. Deficiency in Galectin-3 Promotes Hepatic Injury in CDAA Diet-Induced Nonalcoholic Fatty Liver Disease. Sci. World J. 2012, 2012, 1–9. [Google Scholar] [CrossRef]
- Jeftic, I.; Jovicic, N.; Pantic, J.; Arsenijevic, N.; Lukic, M.L.; Pejnovic, N. Galectin-3 Ablation Enhances Liver Steatosis, but Attenuates Inflammation and IL-33-Dependent Fibrosis in Obesogenic Mouse Model of Nonalcoholic Steatohepatitis. Mol. Med. 2015, 21, 453–465. [Google Scholar] [CrossRef] [PubMed]
- Chalasani, N.; Abdelmalek, M.F.; Garcia-Tsao, G.; Vuppalanchi, R.; Alkhouri, N.; Rinella, M.; Noureddin, M.; Pyko, M.; Shiffman, M.; Sanyal, A.; et al. Effects of Belapectin, an Inhibitor of Galectin-3, in Patients With Nonalcoholic Steatohepatitis With Cirrhosis and Portal Hypertension. Gastroenterology 2020, 158, 1334–1345. [Google Scholar] [CrossRef]
- Rossato, M.; Di Vincenzo, A.; Pagano, C.; Hadi, H.E.; Vettor, R. The P2X7 Receptor and NLRP3 Axis in Non-Alcoholic Fatty Liver Disease: A Brief Review. Cells 2020, 9, 1047. [Google Scholar] [CrossRef]
- Broz, P.; Dixit, V.M. Inflammasomes: Mechanism of assembly, regulation and signalling. Nat. Rev. Immunol. 2016, 16, 407–420. [Google Scholar] [CrossRef]
- Csak, T.; Ganz, M.; Pespisa, J.; Kodys, K.; Dolganiuc, A.; Szabo, G. Fatty acid and endotoxin activate inflammasomes in mouse hepatocytes that release danger signals to stimulate immune cells. Hepatology 2011, 54, 133–144. [Google Scholar] [CrossRef]
- Watanabe, A.; Sohail, M.A.; Gomes, D.A.; Hashmi, A.; Nagata, J.; Sutterwala, F.S.; Mahmood, S.; Jhandier, M.N.; Shi, Y.; Flavell, R.A.; et al. Inflammasome-mediated regulation of hepatic stellate cells. Am. J. Physiology. Gastrointest. Liver Physiol. 2009, 296, G1248–G1257. [Google Scholar] [CrossRef] [PubMed]
- Imaeda, A.B.; Watanabe, A.; Sohail, M.A.; Mahmood, S.; Mohamadnejad, M.; Sutterwala, F.S.; Flavell, R.A.; Mehal, W.Z. Acetaminophen-induced hepatotoxicity in mice is dependent on Tlr9 and the Nalp3 inflammasome. J. Clin. Investig. 2009, 119, 305–314. [Google Scholar] [CrossRef] [PubMed]
- Wree, A.; McGeough, M.D.; Peña, C.A.; Schlattjan, M.; Li, H.; Inzaugarat, M.E.; Messer, K.; Canbay, A.; Hoffman, H.M.; Feldstein, A.E. NLRP3 inflammasome activation is required for fibrosis development in NAFLD. J. Mol. Med. 2014, 92, 1069–1082. [Google Scholar] [CrossRef] [PubMed]
- Kerr, N.; Lee, S.W.; Perez-Barcena, J.; Crespi, C.; Ibañez, J.; Bullock, M.R.; Dietrich, W.D.; Keane, R.W.; De Rivero Vaccari, J.P. Inflammasome proteins as biomarkers of traumatic brain injury. PLoS ONE 2018, 13, e0210128. [Google Scholar] [CrossRef]
- Kerr, N.; García-Contreras, M.; Abbassi, S.; Mejias, N.H.; Desousa, B.R.; Ricordi, C.; Dietrich, W.D.; Keane, R.W.; De Rivero Vaccari, J.P. Inflammasome Proteins in Serum and Serum-Derived Extracellular Vesicles as Biomarkers of Stroke. Front. Mol. Neurosci. 2018, 11, 309. [Google Scholar] [CrossRef]
- Scott, X.O.; Stephens, M.E.; Desir, M.C.; Dietrich, W.D.; Keane, R.W.; De Rivero Vaccari, J.P. The Inflammasome Adaptor Protein ASC in Mild Cognitive Impairment and Alzheimer’s Disease. Int. J. Mol. Sci. 2020, 21, 4674. [Google Scholar] [CrossRef]
- Syed, S.A.; Beurel, E.; Loewenstein, D.A.; Lowell, J.A.; Craighead, W.E.; Dunlop, B.W.; Mayberg, H.S.; Dhabhar, F.; Dietrich, W.D.; Keane, R.W.; et al. Defective Inflammatory Pathways in Never-Treated Depressed Patients Are Associated with Poor Treatment Response. Neuron 2018, 99, 914–924. [Google Scholar] [CrossRef]
- Keane, R.W.; Dietrich, W.D.; De Rivero Vaccari, J.P. Inflammasome Proteins as Biomarkers of Multiple Sclerosis. Front. Neurol. 2018, 9, 135. [Google Scholar] [CrossRef]
- Forouzandeh, M.; Besen, J.; Keane, R.W.; De Rivero Vaccari, J.P. The Inflammasome Signaling Proteins ASC and IL-18 as Biomarkers of Psoriasis. Front. Pharmacol. 2020, 11, 1238. [Google Scholar] [CrossRef]
- European Associations for the Study of the Liver (EASL); European Associations for the Study of Diabetes (EASD); European Association for the Study of Obesity (EASO). EASL–EASD–EASO Clinical Practice Guidelines for the management of non-alcoholic fatty liver disease. Diabetologia 2016, 59, 1121–1140. [Google Scholar] [CrossRef]
- Pejnovic, N.N.; Pantic, J.M.; Jovanovic, I.P.; Radosavljevic, G.D.; Milovanovic, M.Z.; Nikolic, I.G.; Zdravkovic, N.S.; Djukic, A.L.; Arsenijevic, N.N.; Lukic, M.L. Galectin-3 Deficiency Accelerates High-Fat Diet-Induced Obesity and Amplifies Inflammation in Adipose Tissue and Pancreatic Islets. Diabetes 2013, 62, 1932–1944. [Google Scholar] [CrossRef] [PubMed]
- Pang, J.; Rhodes, D.H.; Pini, M.; Akasheh, R.T.; Castellanos, K.J.; Cabay, R.J.; Cooper, D.; Perretti, M.; Fantuzzi, G. Increased Adiposity, Dysregulated Glucose Metabolism and Systemic Inflammation in Galectin-3 KO Mice. PLoS ONE 2013, 8, e57915. [Google Scholar] [CrossRef] [PubMed]
- Dragomir, A.-C.; Sun, R.; Mishin, V.; Hall, L.B.; Laskin, J.D.; Laskin, D.L. Role of Galectin-3 in Acetaminophen-Induced Hepatotoxicity and Inflammatory Mediator Production. Toxicol. Sci. 2012, 127, 609–619. [Google Scholar] [CrossRef] [PubMed]
- De Oliveira, F.L.; Panera, N.; De Stefanis, C.; Mosca, A.; D’Oria, V.; Crudele, A.; De Vito, R.; Nobili, V.; Alisi, A. The Number of Liver Galectin-3 Positive Cells Is Dually Correlated with NAFLD Severity in Children. Int. J. Mol. Sci. 2019, 20, 3460. [Google Scholar] [CrossRef] [PubMed]
- Bocsan, I.C.; Milaciu, M.V.; Pop, R.M.; Vesa, S.C.; Ciumarnean, L.; Matei, D.M.; Buzoianu, A.D. Cytokines Genotype-Phenotype Correlation in Nonalcoholic Steatohepatitis. Oxidative Med. Cell. Longev. 2017, 2017, 1–7. [Google Scholar] [CrossRef]
- Foroughi, M.; Maghsoudi, Z.; Khayyatzadeh, S.; Ghiasvand, R.; Askari, G.; Iraj, B. Relationship between non-alcoholic fatty liver disease and inflammation in patients with non-alcoholic fatty liver. Adv. Biomed. Res. 2016, 5, 28. [Google Scholar]
- Park, S.H.; Kim, B.I.; Yun, J.W.; Kim, J.W.; Park, D.I.; Cho, Y.K.; Sung, I.K.; Park, C.Y.; Sohn, C.I.; Jeon, W.K.; et al. Insulin resistance and C-reactive protein as independent risk factors for non-alcoholic fatty liver disease in non-obese Asian men. J. Gastroenterol. Hepatol. 2004, 19, 694–698. [Google Scholar] [CrossRef]
- Yoneda, M.; Mawatari, H.; Fujita, K.; Iida, H.; Yonemitsu, K.; Kato, S.; Takahashi, H.; Kirikoshi, H.; Inamori, M.; Nozaki, Y.; et al. High-sensitivity C-reactive protein is an independent clinical feature of nonalcoholic steatohepatitis (NASH) and also of the severity of fibrosis in NASH. J. Gastroenterol. 2007, 42, 573–582. [Google Scholar] [CrossRef]
- Targher, G. Relationship between high-sensitivity C-reactive protein levels and liver histology in subjects with non-alcoholic fatty liver disease. J. Hepatol. 2006, 45, 879–881. [Google Scholar] [CrossRef]
- Anty, R.; Bekri, S.; Luciani, N.; Saint-Paul, M.C.; Dahman, M.; Iannelli, A.; Amor, I.B.; Staccini-Myx, A.; Huet, P.M.; Gugenheim, J.; et al. The inflammatory C-reactive protein is increased in both liver and adipose tissue in severely obese patients independently from metabolic syndrome, Type 2 diabetes, and NASH. Am. J. Gastroenterol. 2006, 101, 1824–1833. [Google Scholar] [CrossRef]
- Hui, J.M.; Farrell, G.C.; Kench, J.G.; George, J. High sensitivity C-reactive protein values do not reliably predict the severity of histological changes in NAFLD. Hepatology 2004, 39, 1458–1459. [Google Scholar] [CrossRef] [PubMed]
- Zimmermann, E.; Anty, R.; Tordjman, J.; Verrijken, A.; Gual, P.; Tran, A.; Iannelli, A.; Gugenheim, J.; Bedossa, P.; Francque, S.; et al. C-reactive protein levels in relation to various features of non-alcoholic fatty liver disease among obese patients. J. Hepatol. 2011, 55, 660–665. [Google Scholar] [CrossRef] [PubMed]
- Haukeland, J.W.; Damås, J.K.; Konopski, Z.; Løberg, E.M.; Haaland, T.; Goverud, I.; Torjesen, P.A.; Birkeland, K.; Bjøro, K.; Aukrust, P. Systemic inflammation in nonalcoholic fatty liver disease is characterized by elevated levels of CCL2. J. Hepatol. 2006, 44, 1167–1174. [Google Scholar] [CrossRef] [PubMed]
- Negash, A.A.; Gale, M. Hepatitis regulation by the inflammasome signaling pathway. Immunol. Rev. 2015, 265, 143–155. [Google Scholar] [CrossRef]
- Zhu, P.; Duan, L.; Chen, J.; Xiong, A.; Xu, Q.; Zhang, H.; Zheng, F.; Tan, Z.; Gong, F.; Fang, M. Gene silencing of NALP3 protects against liver ischemia-reperfusion injury in mice. Hum. Gene Ther. 2011, 22, 853–864. [Google Scholar] [CrossRef]
- Petrasek, J.; Bala, S.; Csak, T.; Lippai, D.; Kodys, K.; Menashy, V.; Barrieau, M.; Min, S.-Y.; Kurt-Jones, E.A.; Szabo, G. IL-1 receptor antagonist ameliorates inflammasome-dependent alcoholic steatohepatitis in mice. J. Clin. Investig. 2012, 122, 3476–3489. [Google Scholar] [CrossRef]
- Stienstra, R.; Van Diepen, J.A.; Tack, C.J.; Zaki, M.H.; Van De Veerdonk, F.L.; Perera, D.; Neale, G.A.; Hooiveld, G.J.; Hijmans, A.; Vroegrijk, I.; et al. Inflammasome is a central player in the induction of obesity and insulin resistance. Proc. Natl. Acad. Sci. USA 2011, 108, 15324–15329. [Google Scholar] [CrossRef]
- Uchihara, M.; Izumi, N. High-sensitivity C-reactive protein (hs-CRP): A promising biomarker for the screening of non-alcoholic steatohepatitis (NASH). Nihon Rinsho 2006, 64, 1133–1138. [Google Scholar]
- Yoneda, M.; Uchiyama, T.; Kato, S.; Endo, H.; Fujita, K.; Yoneda, K.; Mawatari, H.; Iida, H.; Takahashi, H.; Kirikoshi, H.; et al. Plasma Pentraxin3 is a Novel Marker for Nonalcoholic Steatohepatitis (NASH). BMC Gastroenterol. 2008, 8, 53. [Google Scholar] [CrossRef]
- Gorden, D.L.; Myers, D.S.; Ivanova, P.T.; Fahy, E.; Maurya, M.R.; Gupta, S.; Min, J.; Spann, N.J.; McDonald, J.G.; Kelly, S.L.; et al. Biomarkers of NAFLD progression: A lipidomics approach to an epidemic. J. Lipid Res. 2015, 56, 722–736. [Google Scholar] [CrossRef]
- Dong, S.; Zhan, Z.-Y.; Cao, H.-Y.; Wu, C.; Bian, Y.-Q.; Li, J.-Y.; Cheng, G.-H.; Liu, P.; Sun, M.-Y. Urinary metabolomics analysis identifies key biomarkers of different stages of nonalcoholic fatty liver disease. World J. Gastroenterol. 2017, 23, 2771. [Google Scholar] [CrossRef] [PubMed]
- Wong, V.W.-S.; Adams, L.A.; De Lédinghen, V.; Wong, G.L.-H.; Sookoian, S. Noninvasive biomarkers in NAFLD and NASH—Current progress and future promise. Nat. Rev. Gastroenterol. Hepatol. 2018, 15, 461–478. [Google Scholar] [CrossRef] [PubMed]
- Zhang, P.; Feng, W.; Chu, X.; Sun, X.; Zhu, D.; Bi, Y. A newly noninvasive model for prediction of non-alcoholic fatty liver disease: Utility of serum prolactin levels. BMC Gastroenterol. 2019, 19, 202. [Google Scholar] [CrossRef] [PubMed]
- Malik, R.; Chang, M.; Bhaskar, K.; Nasser, I.; Curry, M.; Schuppan, D.; Byrnes, V.; Afdhal, N. The clinical utility of biomarkers and the nonalcoholic steatohepatitis CRN liver biopsy scoring system in patients with nonalcoholic fatty liver disease. J. Gastroenterol. Hepatol. 2009, 24, 564–568. [Google Scholar] [CrossRef] [PubMed]
- Giuffre, M.; Fouraki, S.; Comar, M.; Masutti, F.; Croce, L.S. The Importance of Transaminases Flare in Liver Elastography: Characterization of the Probability of Liver Fibrosis Overestimation by Hepatitis C Virus-Induced Cytolysis. Microorganisms 2020, 8, 348. [Google Scholar] [CrossRef] [PubMed]
- Chen, L.; Chen, R.; Wang, H.; Liang, F. Mechanisms Linking Inflammation to Insulin Resistance. Int. J. Endocrinol. 2015, 2015, 1–9. [Google Scholar] [CrossRef]
- Brand, F.J., 3rd; Forouzandeh, M.; Kaur, H.; Travascio, F.; de Rivero Vaccari, J.P. Acidification changes affect the inflammasome in human nucleus pulposus cells. J. Inflamm. 2016, 13, 29. [Google Scholar] [CrossRef]
- Sambataro, G.; Giuffre, M.; Sambataro, D.; Palermo, A.; Vignigni, G.; Cesareo, R.; Crimi, N.; Torrisi, S.E.; Vancheri, C.; Malatino, L.; et al. The Model for Early COvid-19 Recognition (MECOR) Score: A Proof-of-Concept for a Simple and Low-Cost Tool to Recognize a Possible Viral Etiology in Community-Acquired Pneumonia Patients during COVID-19 Outbreak. Diagnostics (Basel) 2020, 10, 619. [Google Scholar] [CrossRef]


Publisher’s Note: MDPI stays neutral with regard to jurisdictional claims in published maps and institutional affiliations. |
© 2020 by the authors. Licensee MDPI, Basel, Switzerland. This article is an open access article distributed under the terms and conditions of the Creative Commons Attribution (CC BY) license (http://creativecommons.org/licenses/by/4.0/).