Article

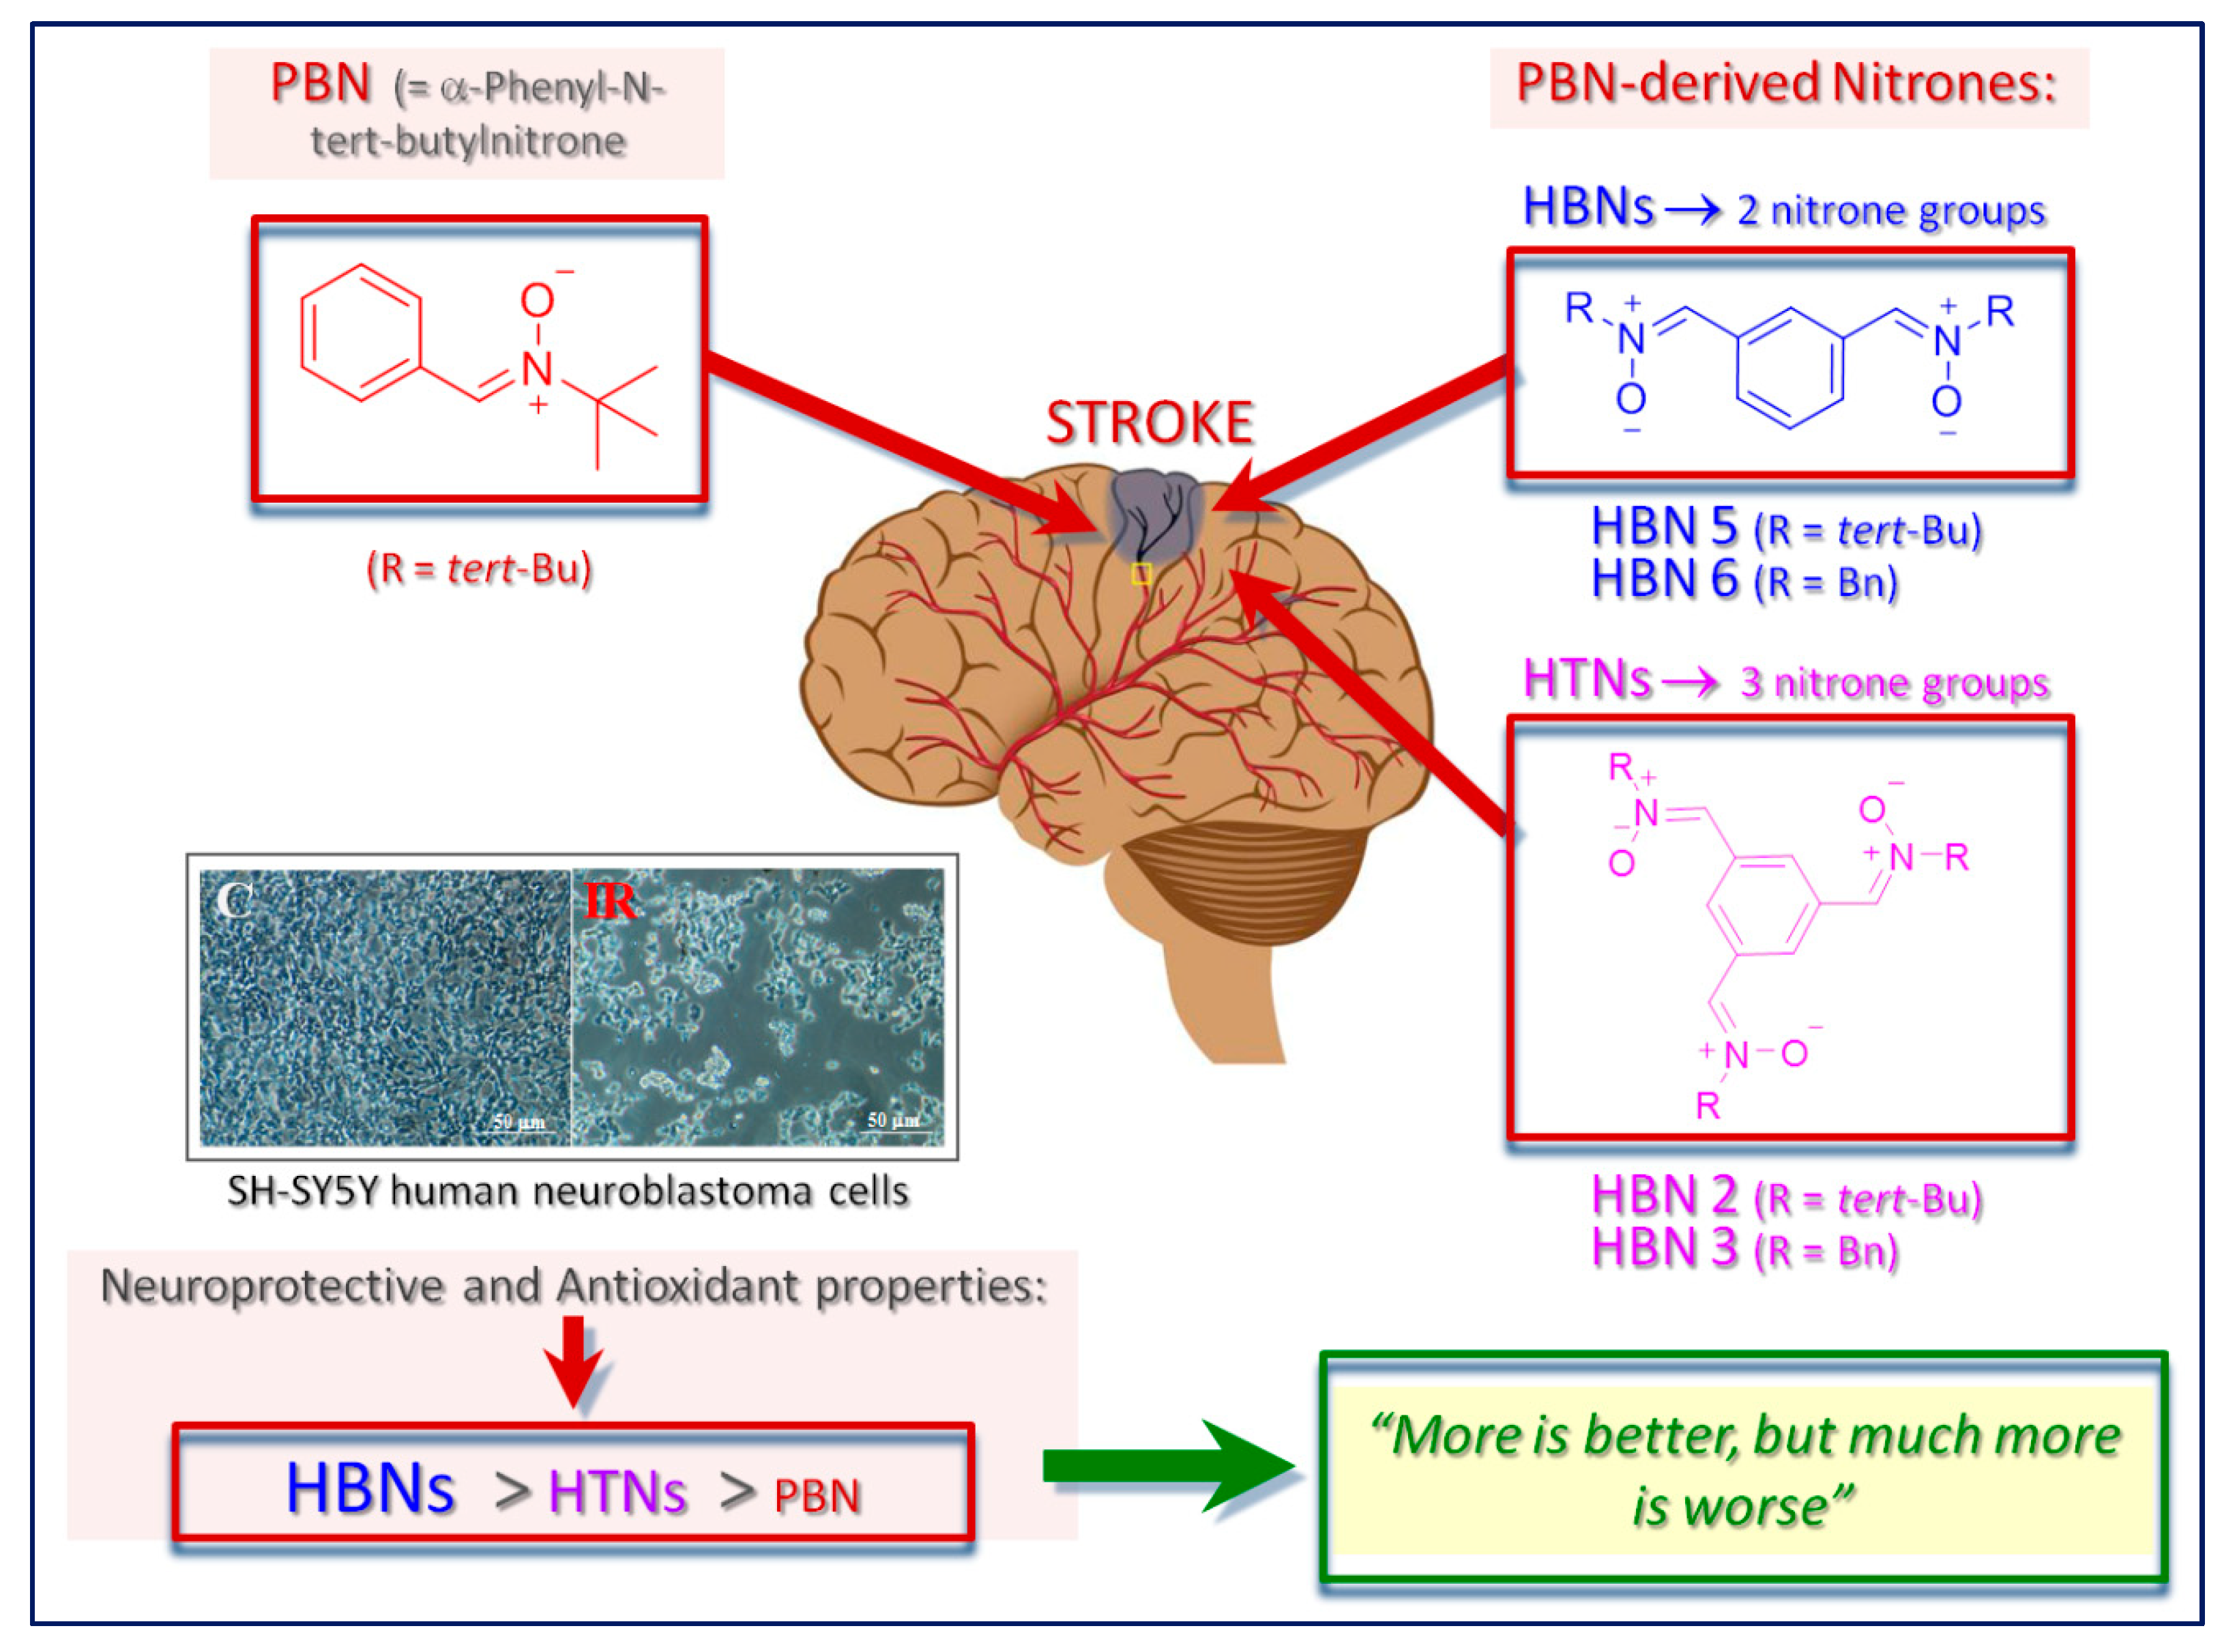
Homo-Tris-Nitrones Derived from α-Phenyl-N-tert-butylnitrone: Synthesis, Neuroprotection and Antioxidant Properties

by
Daniel Diez-Iriepa
1,2,†,
Beatriz Chamorro
3,4,†,
Marta Talaván
3,
Mourad Chioua
1,
Isabel Iriepa
2,5,
Dimitra Hadjipavlou-Litina
6,
Francisco López-Muñoz
4,7,
José Marco-Contelles
1,* and
María Jesús Oset-Gasque
3,8,*
1
Laboratory of Medicinal Chemistry, Institute of Organic Chemistry (CSIC), Juan de la Cierva 3, 28006 Madrid, Spain
2
Department of Organic Chemistry and Inorganic Chemistry, Alcalá University, Alcalá de Henares, 28805 Madrid, Spain
3
Department of Biochemistry and Molecular Biology, Faculty of Pharmacy, Complutense University of Madrid, Plaza Ramón y Cajal s/n, Ciudad Universitaria, 28040 Madrid, Spain
4
Faculty of Health, Camilo José Cela University of Madrid (UCJC), 28692 Villafranca del Castillo, Spain
5
Institute of Chemical Research Andrés M. del Río, Alcalá University, Alcalá de Henares, 28805 Madrid, Spain
6
Department of Pharmaceutical Chemistry, School of Pharmacy, Faculty of Health Sciences, Aristotle University of Thessaloniki, 54124 Thessaloniki, Greece
7
Neuropsychopharmacology Unit, “Hospital 12 de Octubre” Research Institute, 28041 Madrid, Spain
8
Instituto Universitario de Investigación en Neuroquímica, Universidad Complutense de Madrid, 28040 Madrid, Spain
*
Authors to whom correspondence should be addressed.
These authors have equally contributed to this work.
Int. J. Mol. Sci. 2020, 21(21), 7949; https://doi.org/10.3390/ijms21217949
Submission received: 5 October 2020 / Revised: 20 October 2020 / Accepted: 21 October 2020 / Published: 26 October 2020
(This article belongs to the Special Issue Neuroprotective Strategies 2020)

Abstract

:
Herein we report the synthesis, antioxidant and neuroprotective power of homo-tris-nitrones (HTN) 1-3, designed on the hypothesis that the incorporation of a third nitrone motif into our previously identified homo-bis-nitrone 6 (HBN6) would result in an improved and stronger neuroprotection. The neuroprotection of HTNs 1-3, measured against oligomycin A/rotenone, showed that HTN2 was the best neuroprotective agent at a lower dose (EC50 = 51.63 ± 4.32 μM), being similar in EC50 and maximal activity to α-phenyl-N-tert-butylnitrone (PBN) and less potent than any of HBNs 4-6. The results of neuroprotection in an in vitro oxygen glucose deprivation model showed that HTN2 was the most powerful (EC50 = 87.57 ± 3.87 μM), at lower dose, but 50-fold higher than its analogous HBN5, and ≈1.7-fold less potent than PBN. HTN3 had a very good antinecrotic (IC50 = 3.47 ± 0.57 μM), antiapoptotic, and antioxidant (EC50 = 6.77 ± 1.35 μM) profile, very similar to that of its analogous HBN6. In spite of these results, and still being attractive neuroprotective agents, HTNs 2 and 3 do not have better neuroprotective properties than HBN6, but clearly exceed that of PBN.

1. Introduction

Nowadays it is largely accepted that reactive oxygen species (ROS), such as O2−•, HO, HO2, are one of the main biological factors involved in the etiology of a number of pathologies such as neurodegenerative and psychiatric disorders, or stroke, playing key roles in their pathogenesis, suggesting thus possible therapeutic interventions [1,2,3]. Consequently, the identification of new antioxidants, and the development of more potent analogues are under extensive research [4].
Stroke is a major public health problem, whose current clinical treatment, based on treatment with recombinant tissue plasminogen activator is hampered by important side effects and narrow therapeutic window [5]. Thus, there is an urgent need for more effective therapies. This is the reason, combined to the multifactorial nature of this pathology, of the increased and continued attention that has been devoted to the research for new and more effective ROS trapping agents [6].
Nitrones, well known antioxidant organic molecules widely used as radical traps, appear to be interesting drug candidates to treat stroke [7,8,9,10,11,12,13,14,15,16,17,18,19]. The first proposal of nitrones as therapeutic candidates for stroke was made by Novelli, who reported that α-phenyl N-tert-butylnitrone (PBN) (Figure 1) prevented and reversed traumatic shock injury in rats [20]. Thus, not surprisingly, the search for new nitrones continue to attract the interest of a number of laboratories around the world [21,22,23,24,25,26,27,28,29,30,31,32,33]. This has been the case of our group, that in the last decade has been very active in this area reporting new antioxidant nitrones for the potential stroke therapy [34,35,36,37,38].
In this field, the neuroprotective profile and strong antioxidant capacity of bis-nitrones, as well as their potential clinical applications for the therapy of stroke has been documented in the literature, showing very promising hit-azulenyl nitrones [39,40,41] such as bis-nitrone W-AZN (Figure 1), of particular interest due to its neuroprotective power in an in vivo model of stroke [42], or bis-nitrone TN-2 (Figure 1), an excellent example of a compound bearing two tert-butyl nitrone groups, bound to a pyrazine heterocyclic nucleus, with remarkable neuroprotective capacity most possibly due to its ability to trap toxic ROS [43,44,45].
Our group has recently described a number of homo-bis-nitrones (HBNs) derived from PBN, from which HBN6 (Figure 1) exhibited a potent neuroprotective effect in in vitro and in vivo ischemia models, a very good antinecrotic and antiapoptotic activity, as well as very good antioxidant properties, stronger than the parent PBN [46]. Thus, our previous results strongly suggest that HBN6 is a potential neuroprotective agent against stroke and that the introduction of two nitrone groups improves the neuroprotective properties of PBN-based nitrone containing only one nitrone group [46]. Now, and continuing with our interest of polynitrones for stroke, and based on these previously reported results [46], we wondered whether the incorporation of a third nitrone motif would result in an improved and stronger neuroprotection effect. Consequently, we designed symmetrically substituted homo-tris-nitrones (HTNs) resulting in nitrones HTNs 1-3 (Figure 1).

2. Results and Discussion
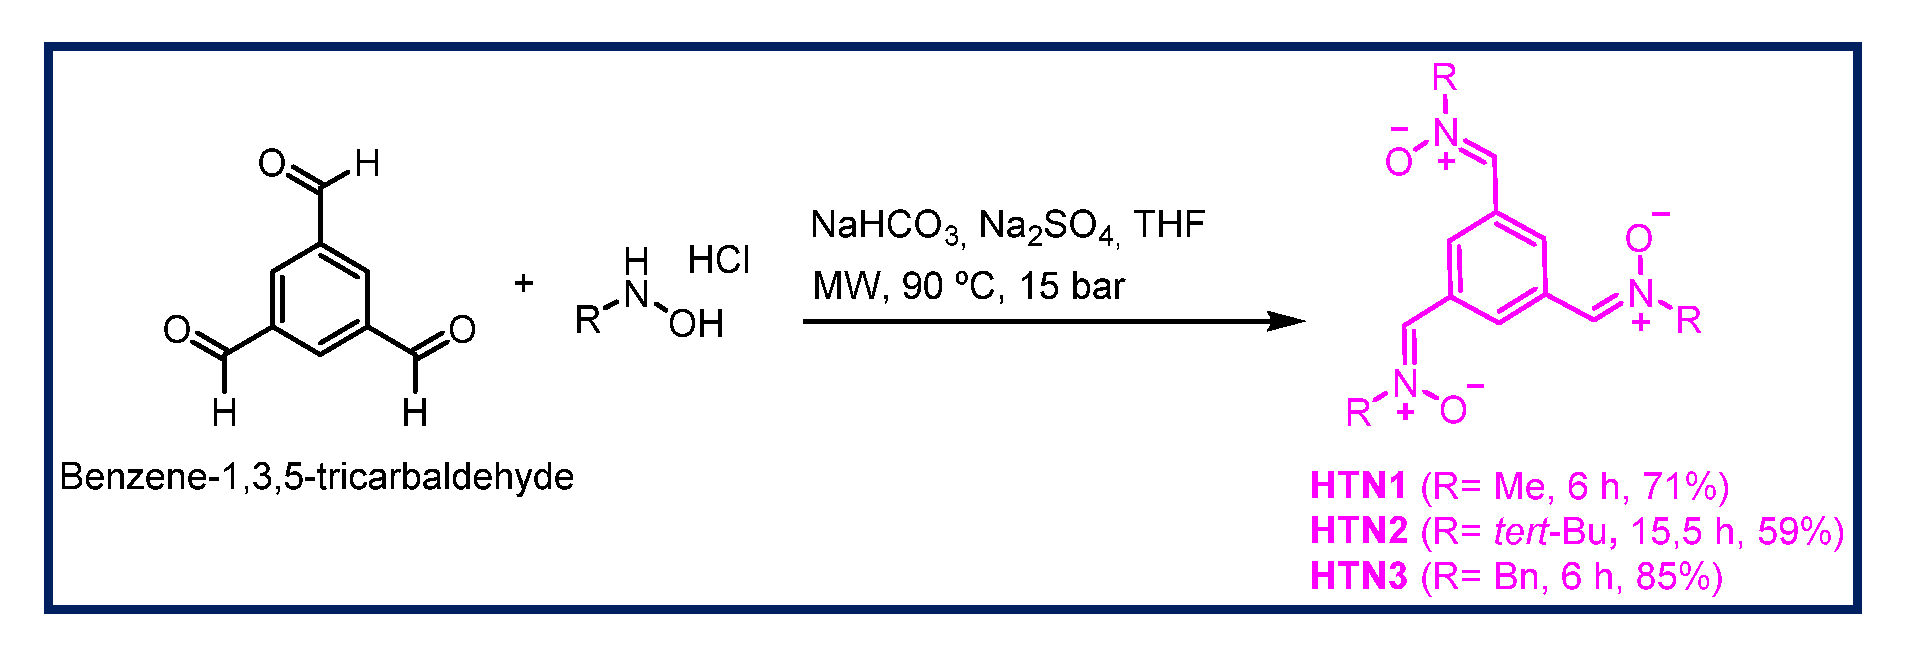
2.1. Chemistry

The synthesis of HTNs 1-3 was carried out as shown in Scheme 1 starting form benzene-1,3,5-tricarbaldehyde, and readily available N-alkylhydroxylamine hydrochlorides were selected. All the nitrones were isolated as pure and single Z isomers at the double ArC(H)=N+(O-)R bond, and gave analytical and spectroscopic data in good agreement with their structures (see Materials and Methods, Supplementary Material). Only HTN2 (Figure 1) has been previously described [47,48] in studies connected with the synthesis and magnetic properties of stable nitroxyl tri-radicals [47], and as spin trapping agents for the treatment of diseases associated with oxidation of lipids and proteins [48]. According to our design, and taking into account the structure if HBN6 as reference, HTNs 1-3 all bear the nitrone motives in relative meta position, a choice that was favored by the readily, commercially available benzene-1,3,5-tricarbaldehyde precursor, HTN1, HTN2, and HTN3 (Figure 1) bearing a N-methyl, a N-tert-butyl, and a N-benzyl group, respectively, at the R nitrone functional group.

2.2. Neuroprotection Studies of HTNs 1-3

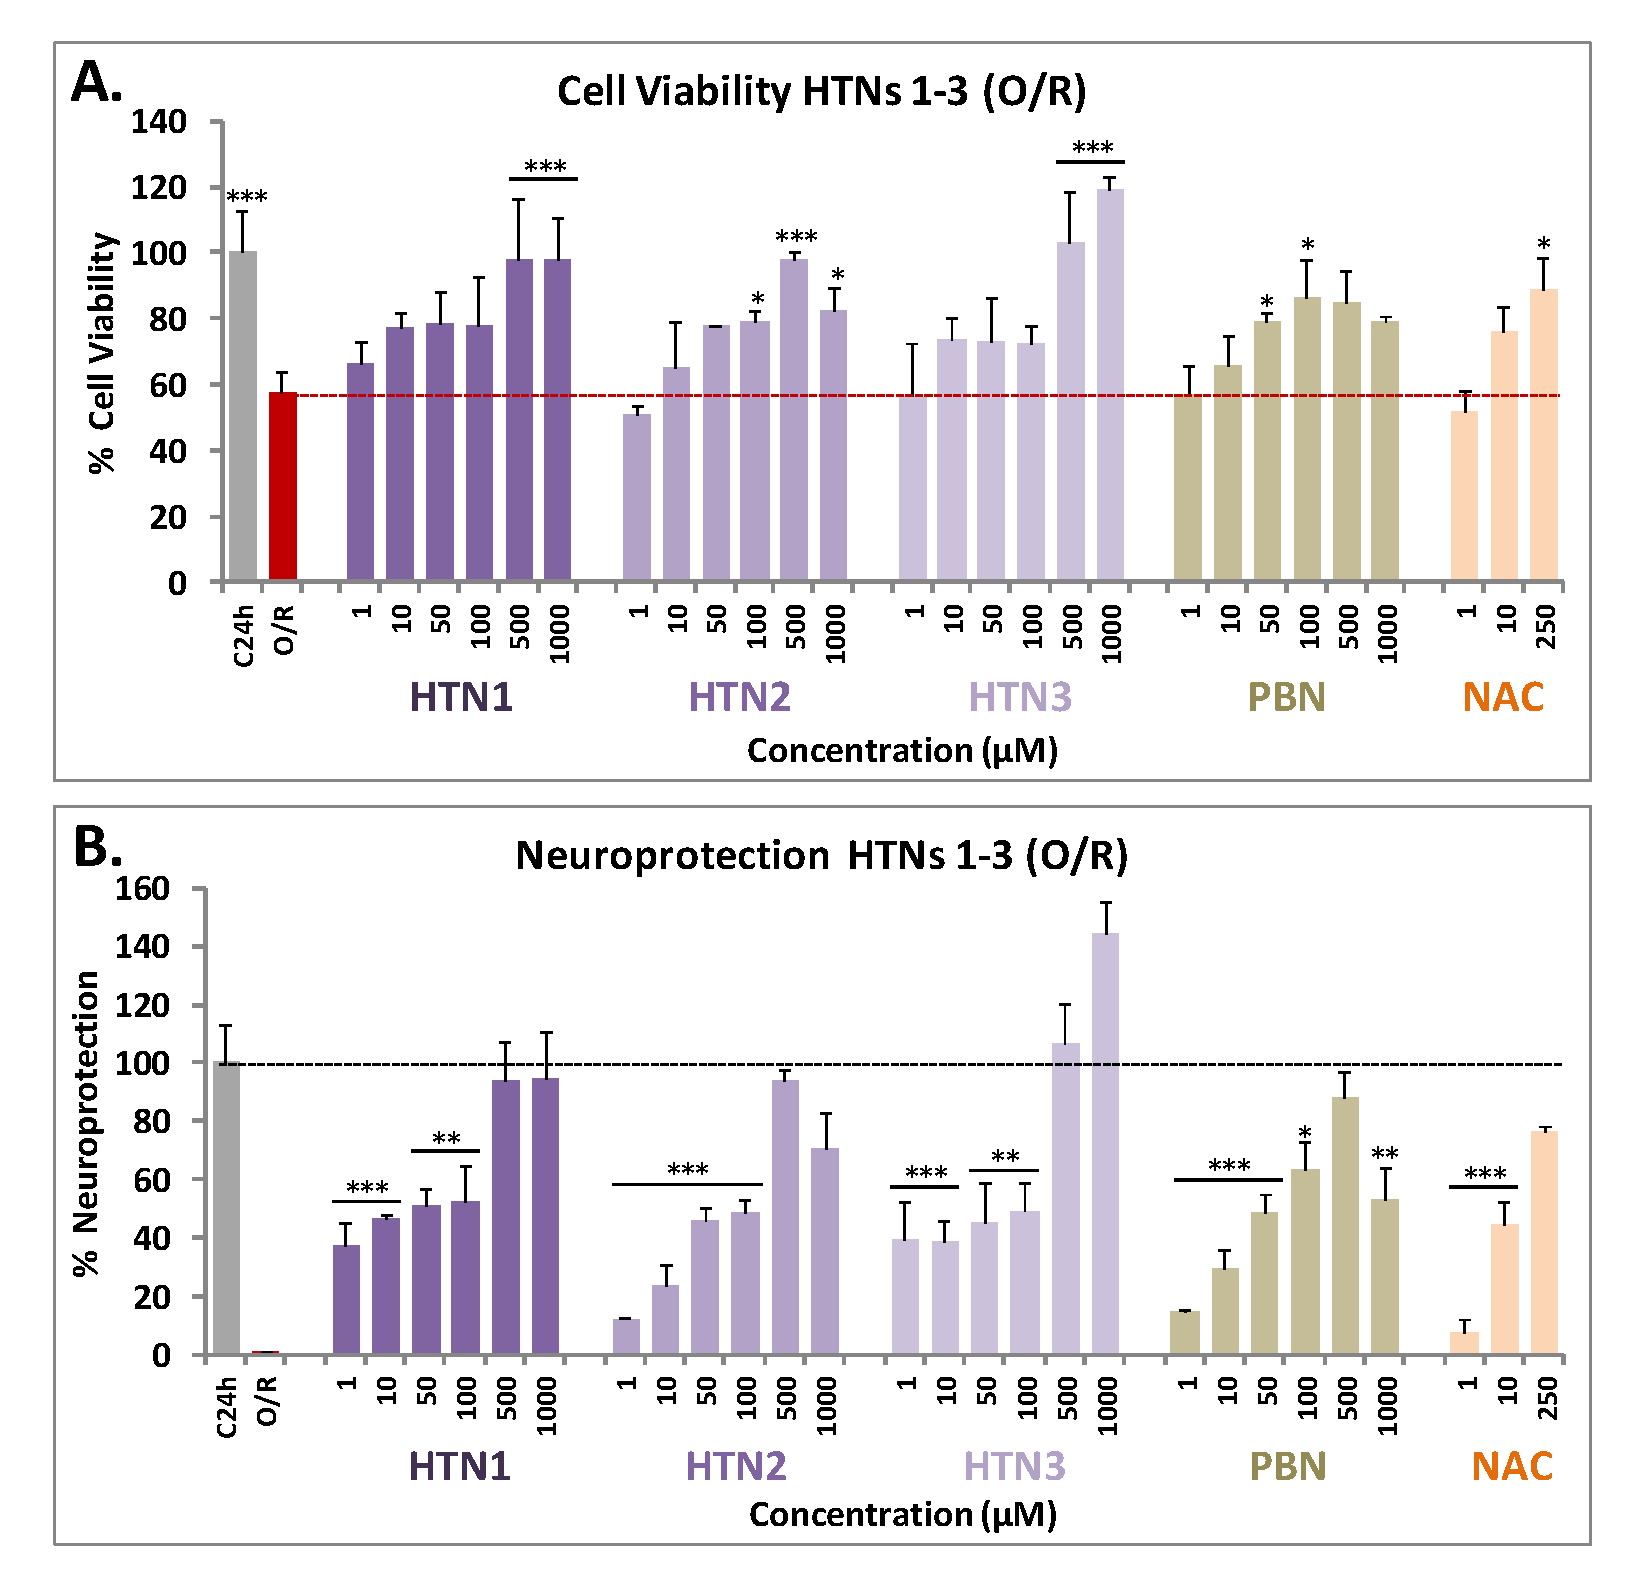
2.2.1. Neuroprotection Analysis in an Oligomycin A/Rotenone Model

One of the first events that take place in the initial stages of stroke is the collapse of the mitochondrial electron transport chain, leading to extended cell death and brain damage, due to the formation of ROS. In order to mimic this event into suitable experiments, we tested the effect of the new nitrones on cell death induced by the neurotoxic combination of oligomycin A/rotenone (O/R), inhibitors of mitochondrial complexes V and I, respectively. Based on a previous work from our laboratory [46], we selected the appropriate experimental conditions, and tested the neuroprotective effect of HTNs 1-3 at different concentrations (1–1000 μM), adding them 10 min before the administration of O10 μM/R30 μM, and using PBN and N-acetyl-L-cysteine (NAC) as reference compounds [46].
With pure nitrones HTNs 1-3 in hand, we next investigated in depth their neuroprotective capacity according to the usual experimental protocols (see Materials and Methods) [49,50,51,52].
As shown in Figure 2A, HTNs 1-3 showed a clear effect increasing cell viability in a concentration-dependent manner. The nitrone that provided the best result was HTN3, since from very low concentrations (10 μM) achieves a viability value above 70%, and even at high concentrations exceeds the viability of the control. HTN1, at low concentrations (1 μM), provided more than 60% viability, although like HTN2, failed to reach the maximal cell viability observed for HTN3 at high concentrations. In general, among the HTNs we could not observe high significant differences, but all of them improve the data obtained for the reference nitrone, PBN. Regarding neuroprotection, it was observed that the neuroprotective effects of HTNs were clearly concentration dependent (Figure 2B).
To assess more accurately the differences in neuroprotective capacity of these nitrones, a study of the EC50 was carried out (Table 1). The order of neuroprotective potency of the compounds (from lowest to highest EC50) was HTN2PBNHTN3HTN1 (Table 1). However, the maximal activity (%) data reflect a different trend (from highest to lowest): HTN3HTN1PBNHTN2. This means that the best compound that produces neuroprotection at a lower dose is HTN2, bearing a N-tert-Bu substituent; while the compound that produces a greater neuroprotection, although at a higher dose, is HTN3, bearing a N-Bn substituent. HTN1, bearing a N-Me substituent, would have an intermediate capacity between its analogues HTN2 and HTN3. HTN2 is similar in EC50 and maximal activity to PBN. However, the EC50s of these HTNs were higher than their corresponding HBNs 4-6 [46] (Table 1), which indicates that, having a similar maximum activity, HTNs showed less neuroprotective capacity than their structurally corresponding HBNs 4-6 [46] and NAC [46]. Therefore, we conclude that the introduction of an additional nitrone group seemed not to provide an additional benefit to the neuroprotective activity observed for HBNs 4-6, bearing two nitrone groups.

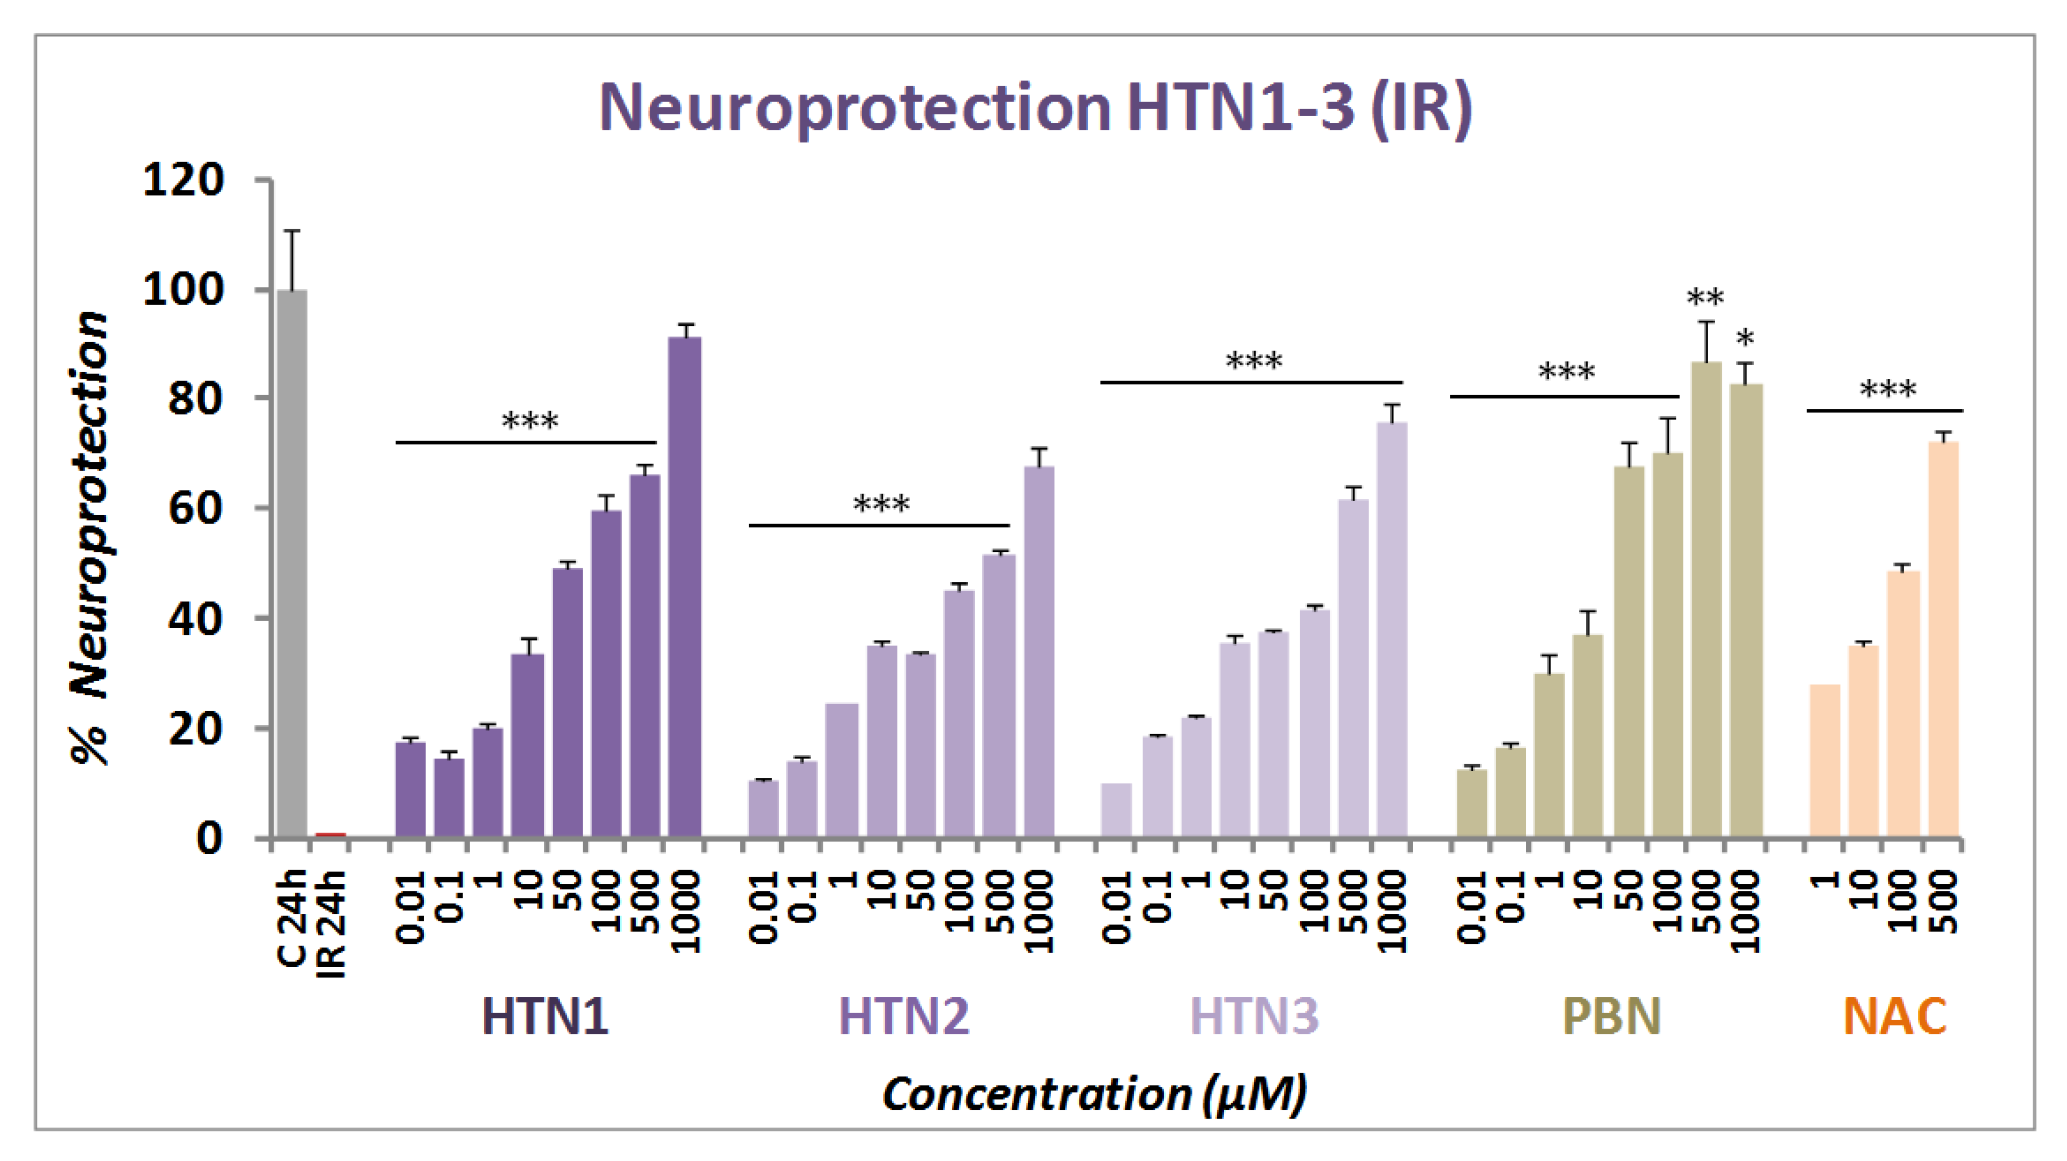
2.2.2. Neuroprotection Analysis in an Oxygen Glucose Deprivation Model

The neuroprotective effect of HTNs 1-3 was next evaluated in an in vitro oxygen glucose deprivation (OGD) model, followed by ischemic reperfusion (IR) by using XTT cell viability test, a colorimetric assay that detects the cellular metabolic activities, at concentrations from 0.01 to 1000 μM, after IR. After OGD (I) (4 h), 50–80% cell death was observed, showing a small cell recovery after 24 h IR of 38–61% (49.29 ± 3.26; mean ± SEM; n = 16). As shown in Figure 3, all HTNs 1-3 were able to partially or totally reverse cell death induced by IR, in a concentration dependent manner.
Based on these results, next we carried out the analyses of concentration–response curves for all the HTNs, PBN, and NAC, in the 0.00001 and 1 mM range, taking into account the potential neurotoxic effect at high concentrations, as measured in the basal neurotoxicity section (see below). As a result, we determined the EC50 and the highest neuroprotective activities for HTNs 1-3, and PBN. As shown in Table 2, nitrones HTNs 1-3 were less potent neuroprotective agents than PBN, as they showed significantly higher EC50 values, although they exhibited higher neuroprotective activity than PBN at higher concentrations. Thus, the order of neuroprotective power (from lowest to highest EC50) was PBNHTN2HTN3HTN1 (Table 2). In this case, there was only a small significant difference between the EC50 values of HTN2 and HTN1, but there were no significant differences between the % of maximal neuroprotective activities among the HTNs 1-3. However, like in the neuroprotection against O/R, the EC50s values of these HTNs were higher than their corresponding HBNs 4-6 and NAC, having a similar maximal activity [46] (Table 2), which indicates that, in this case too, the introduction of a third nitrone group, does not provide a better neuroprotective capacity with respect to their structurally similar HBNs. Thus, from the structure activity relationship (SAR) point of view, note that the incorporation of a new nitrone group in HTNs 1-3 with respect to HBN4-6 [46], significantly decreased their neuroprotective capacity.

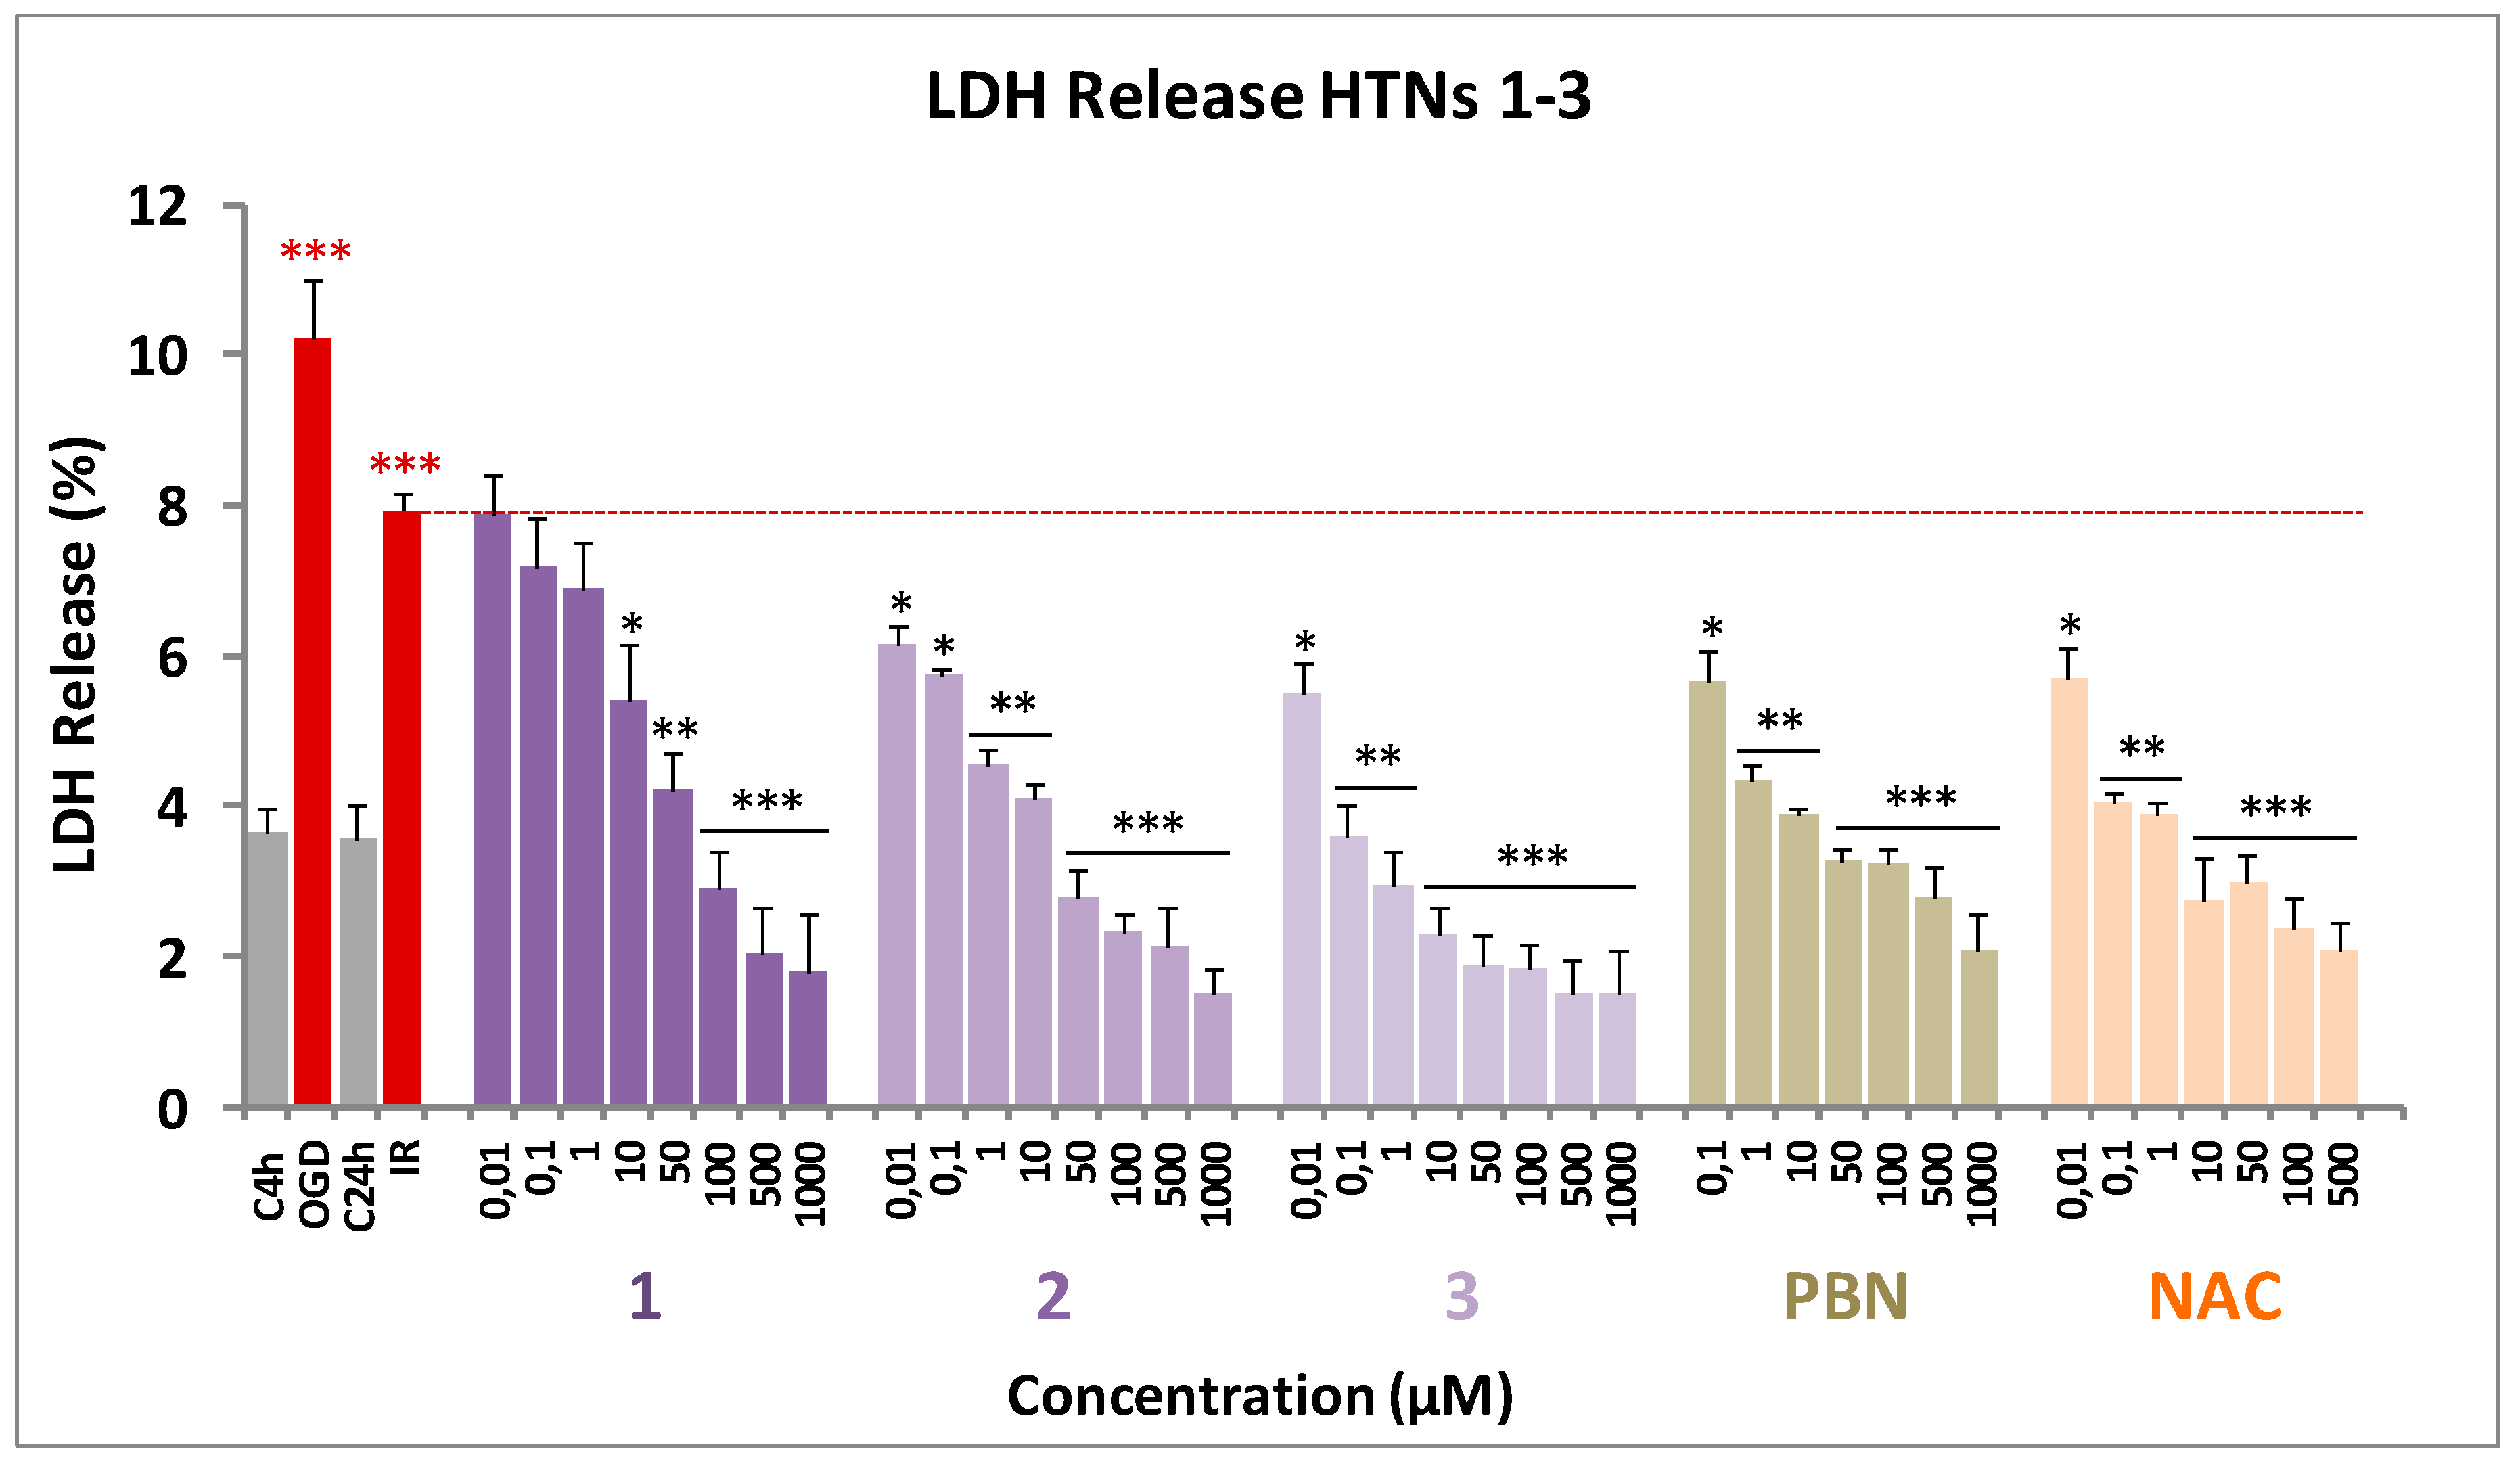
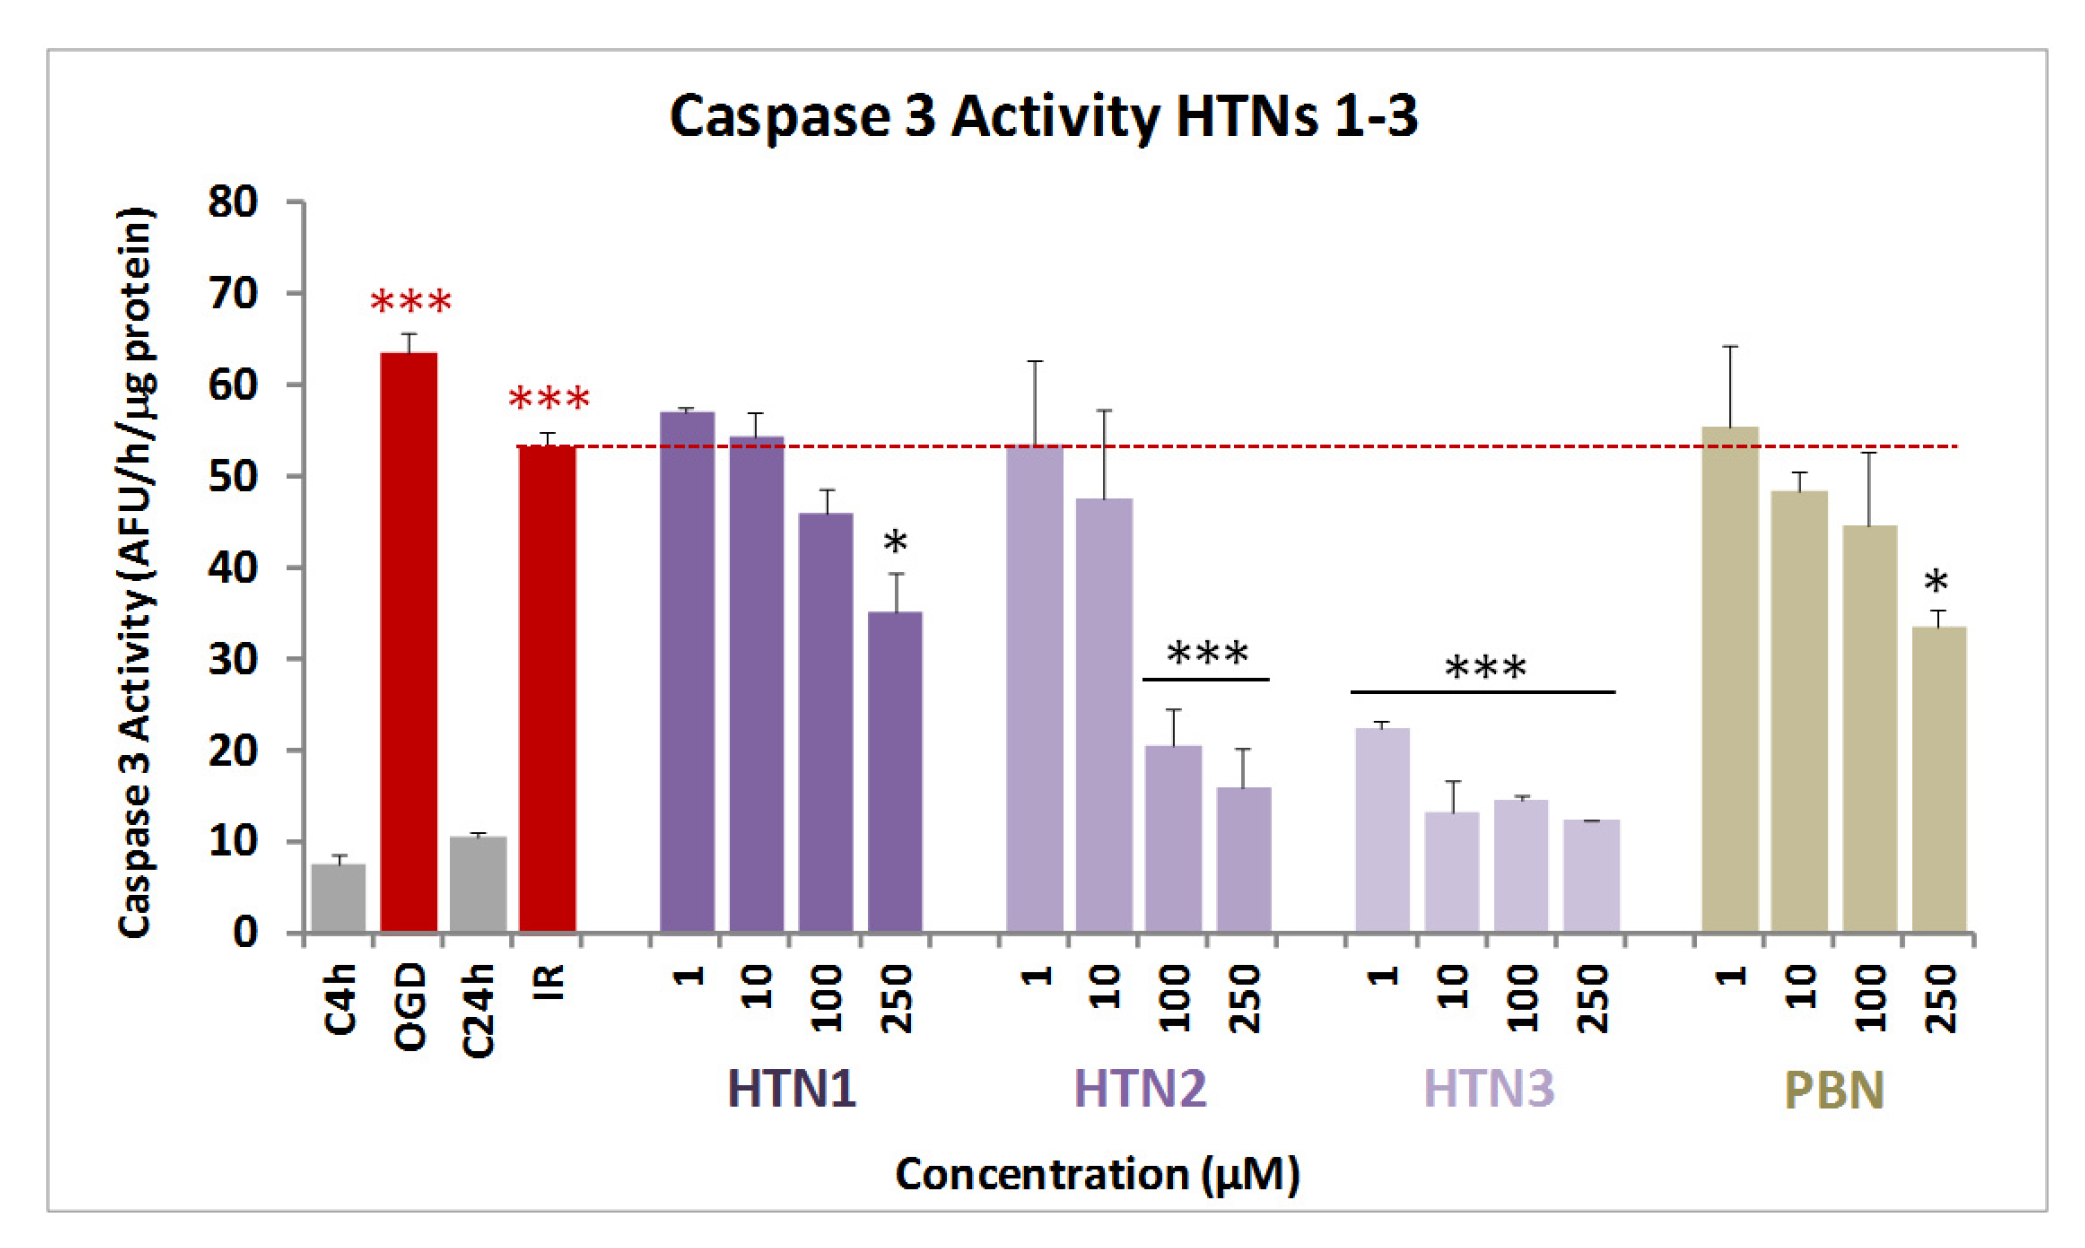
2.2.3. Effect of HTNs on Necrotic and Apoptotic Cell Death Induced by Induced by Oxygen Glucose Deprivation

During an ischemic stroke, in the brain area affected there is massive cell death due to necrosis, and as a consequence, the plasma membrane is broken or significantly permeabilized. Under these circumstances, lactate dehydrogenase (LDH), a soluble cytosolic enzyme, easily crosses the damaged membrane, and by measuring its extracellular activity, and comparing it with its intracellular activity, it is possible to determine the extent of the cell necrosis that took place in the OGD experiment.
As shown in Figure 4, from the values obtained from the measurement of the LDH release after OGD for 4 h followed by 24 h IR, on neuroblastoma cells, by adding the HTNs, PBN, and NAC, at 1–1000 µM concentrations, we concluded that the more efficient was HTN3, followed by HTN2 and HTN1 (Figure 4).
These data were confirmed by the calculation of the IC50 and the maximal activities (Table 3). In this case, HTNs 1-3 showed similar maximal activity; so, their efficiency was compared using the IC50 values.
According to the results in Table 3 HTN3 exhibits higher antinecrotic power (lower IC50) than HTN2, followed by HTN1, which had the lowest antinecrotic power of the tested HTNs. Comparing with the standards, HTN3 is significantly 10- and 6-fold more potent than PBN and NAC, respectively.
Next, and in order to evaluate the extent of cell death by apoptosis, we determined the caspase-3 activity, by using DEVD-AMC as substrate, that when hydrolyzed affords fluorescent AMC. Therefore, after OGD (4 h), and adding HTNs 1-3, PBN, and NAC, at 1–250 μM concentration doses, followed by IR (24 h), the cells were lysated, DEVD-AMC was added, and the fluorescence measured.
As shown from the values in Figure 5, and regarding antiapoptotic effects, compound HTN3 was undoubtedly the most potent of the three HTNs, even more active than its homologous HBN6 [46]. Thus, we can conclude that the N-Bn group provides antiapoptotic activity to these nitrones. Finally, as it was the case with their antinecrotic capacity, HTN3 was significantly higher than that of PBN, while the antiapoptotic activity of HTN1 was similar, and not significantly different, than that of the reference nitrone.

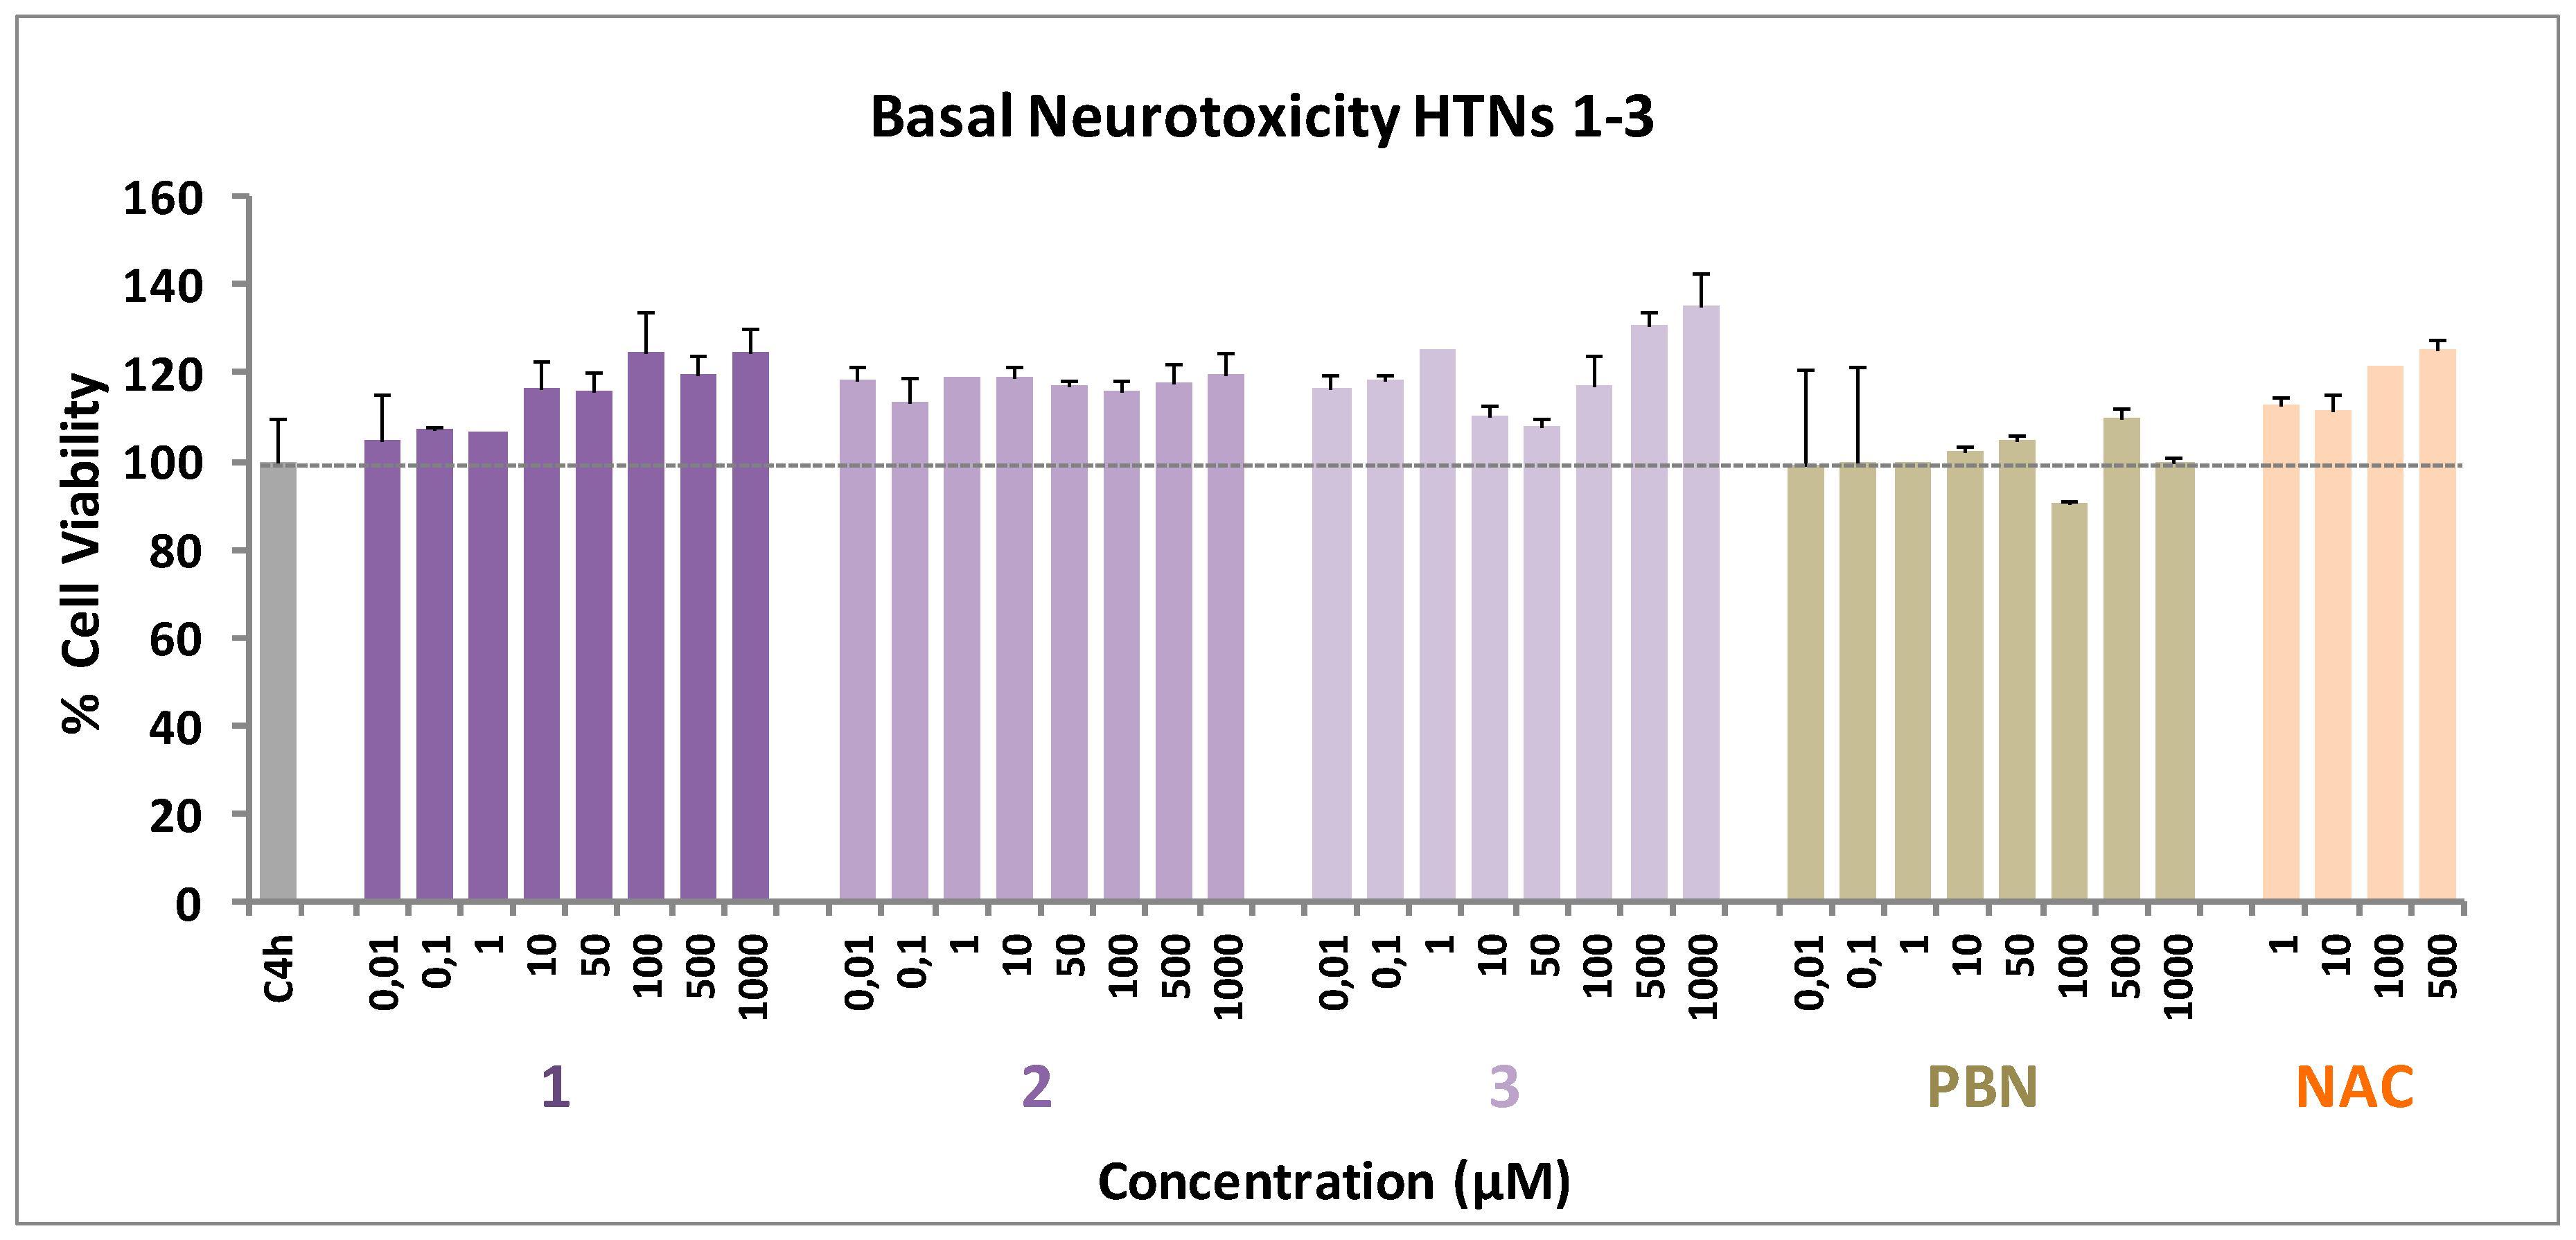
2.2.4. Basal Neurotoxicity of HTNs 1-3

Based on the results described above, the analysis of the possible neurotoxicity of the HTNs 1-3 was mandatory. Thus, an experiment was carried out by measuring the cell viability with XTT, but without adding any toxic insult. As shown in Figure 6, HTN1-3, as well as PBN and NAC, did not show any neurotoxic effect at basal level.

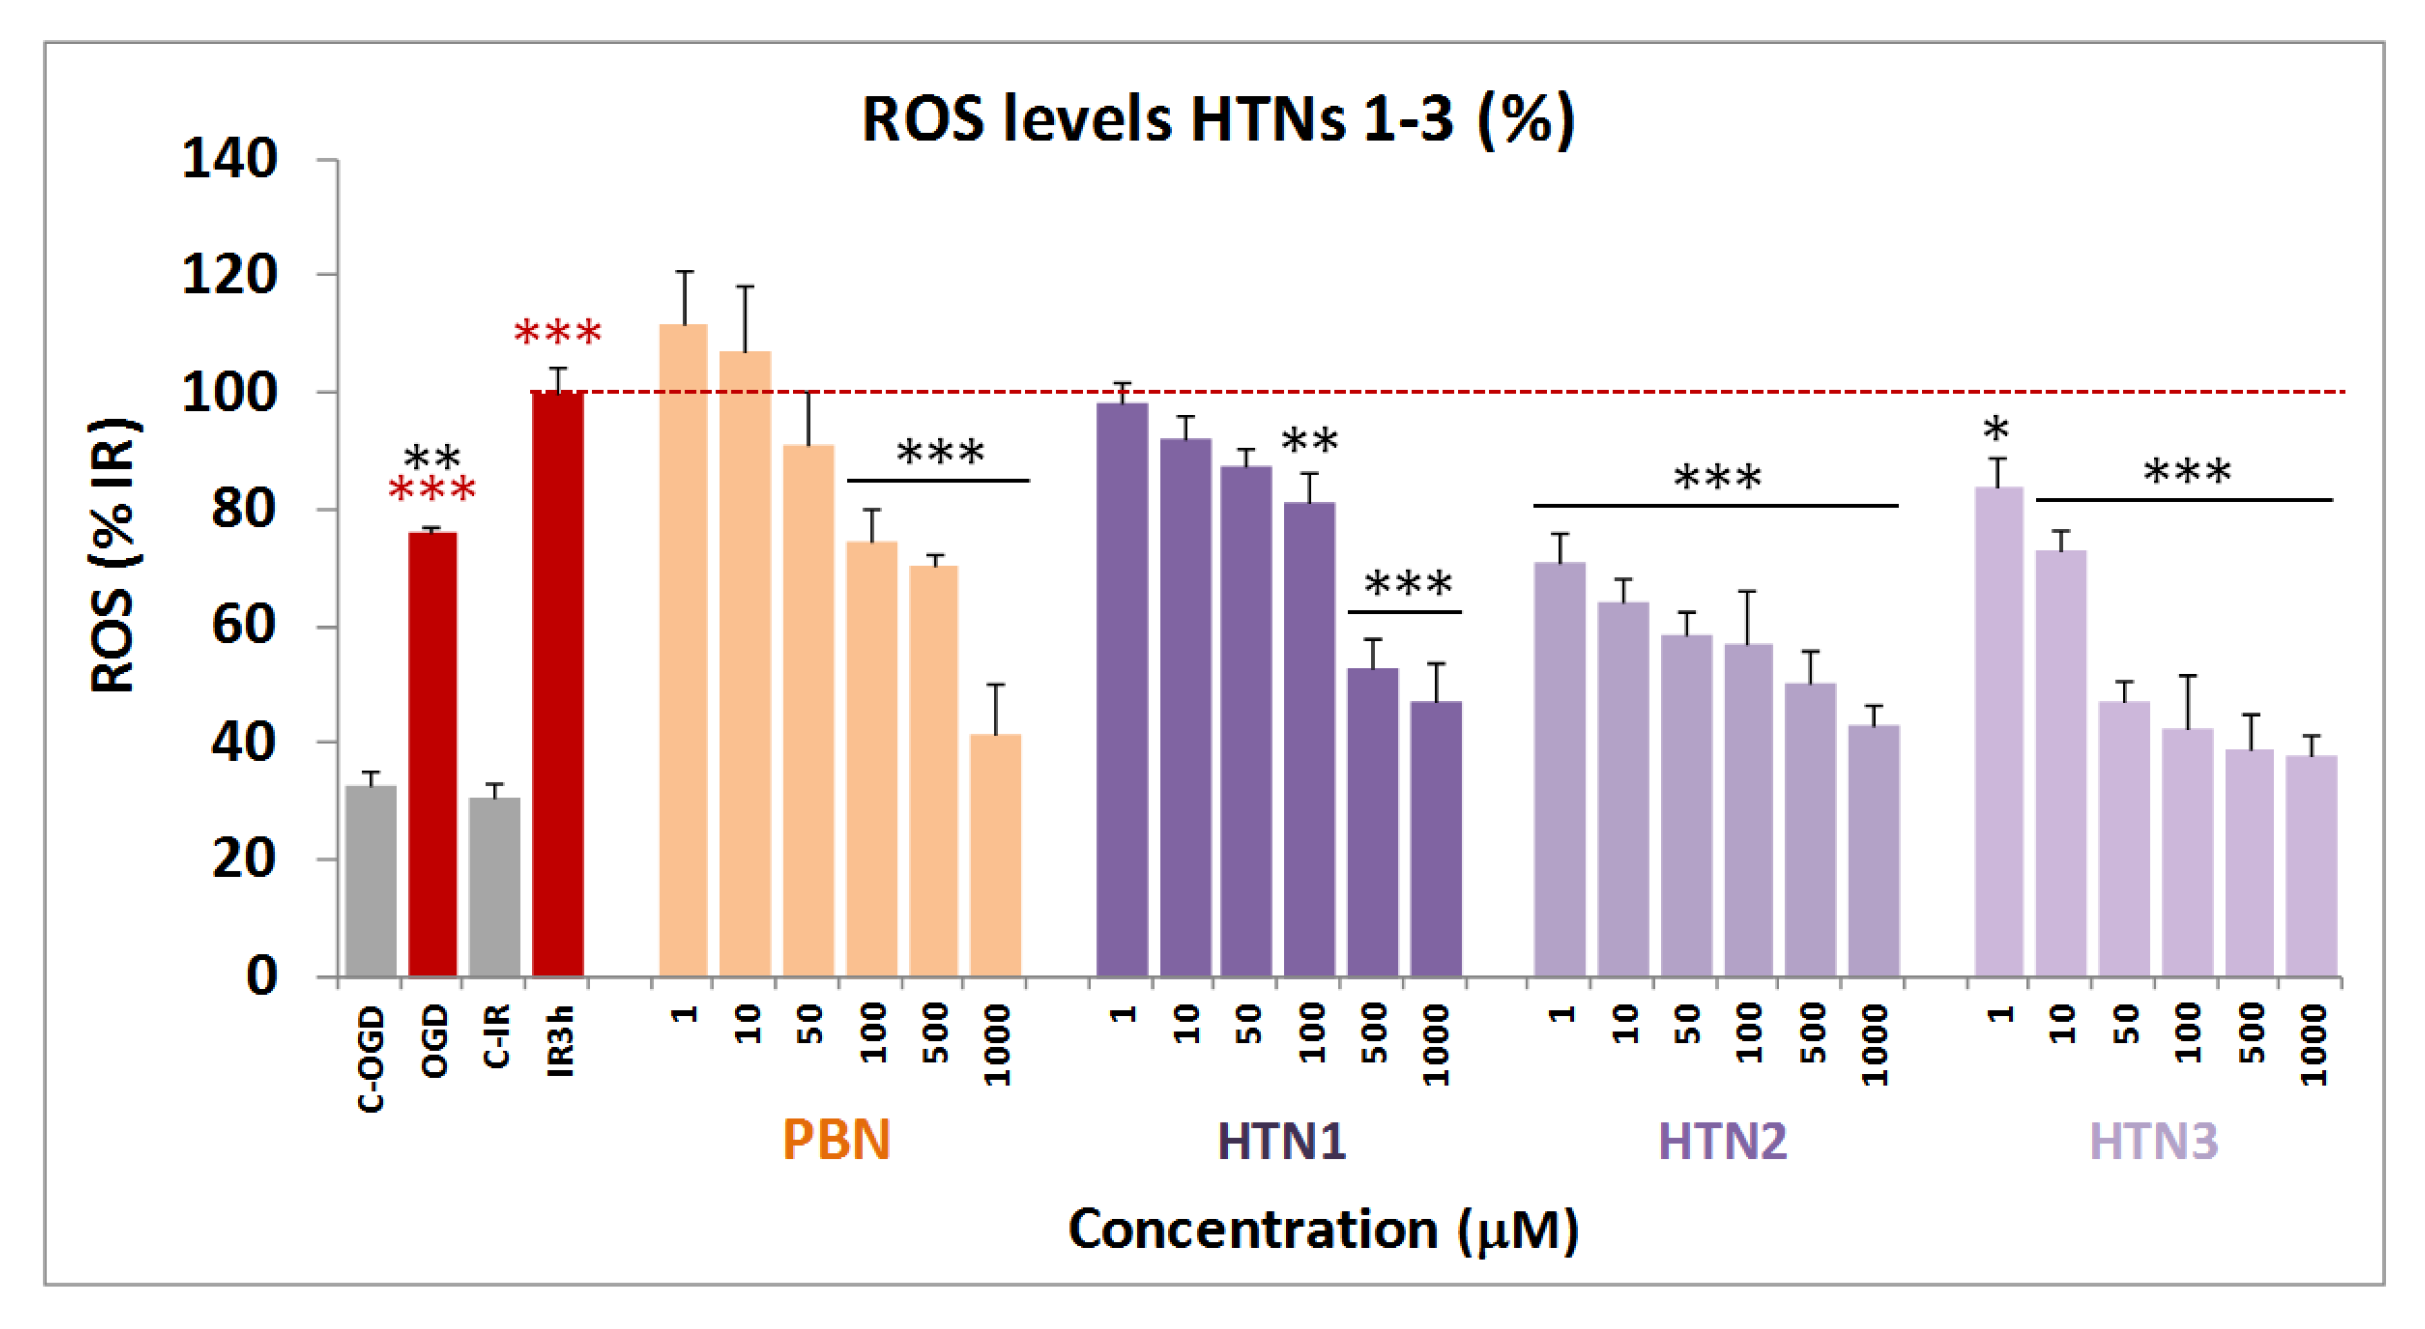
2.2.5. Antioxidant Capacity of HTNs 1-3. Production and Scavenging of Radical Superoxide Radical in Human Neuroblastoma SH-SY5Y Cells

The results shown in the previous sections prompted us to investigate whether the observed neuroprotection due to HTNs 1-3 was a consequence of their capacity to act as antioxidants, and ROS scavengers, particularly of superoxide anion-radical (O2−λ), whose detection can be carried out by using dihydroethidium (DHE), after OGD (3 h) and IR (3 h), with, or without HTNs 1-3, including PBN as a reference.
As shown in Figure 7, ROS level production after IR was higher than ROS production after OGD alone. As expected, PBN was a middle ROS trapping agent compared to the tested nitrones. Thus, in general, the HTNs 1-3 showed an excellent antioxidant profile, the most potent being HTNs 2 and 3, with an antioxidant profile similar to their counterparts HBN5 and 6, [46] greatly exceeding the antioxidant power of PBN.
The analyses of concentration–response curves and calculations of EC50 and the highest antioxidant activities for HTNs 1–3, PBN, and NAC are shown in Table 4. The EC50 values, from the lowest to the highest, follows the order: NAC ≤ HTN2 ≤ HTN3 < PBN < HTN1. As the highest antioxidant activity (maximal activities) was lower for HTN1 and PBN and higher for HTNs 2, 3, and NAC, we conclude that, regarding the antioxidant capacity against IR-induced superoxide production, HTN2 exhibit the best antioxidant properties, which was very similar to the antioxidant capacity of its HBNs 5 and 6 counterparts [46], as well as that of NAC (Table 4).
In summary, and from the SAR point of view, once again HTN2 and HTN3, bearing N-tert-Bu and N-Bn, substituents, respectively, were confirmed to be the most potent HTNs, with antioxidant capacity similar to their analogous HBNs 5 and 6, and to NAC, and better than that of PBN.

2.3. Antioxidant Tests

Based on the in vitro neuroprotection results, we carried out the antioxidant power analysis of HTNs 1-3, on diverse antioxidant tests [53], using NDGA and Trolox as standards for comparative purposes. As shown in Table 5, HTN3 was able to inhibit 92% LP, in the same range as Trolox (88%), in the same experiment, as well as LOX (70 μM) and ABTS+. (10%), albeit to a poorer extent than NDGA (0.45 μM), and Trolox (91%), respectively. HTN2 also has a good antioxidant profile, although weaker than HTN3, as it was only able to inhibit 55% LP, as well as LOX (26%), but not (ABTS+.). However, HTN3 and HTN2 were the most potent hydroxyl radical scavengers (83% and 81%, respectively), very similar to HBNs 5 and 6 [46], respectively, and in the same range as Trolox (83%). Finally, among HTNs and compared to PBN, HBNs 5 and 6, HTN3 and HTN2 showed the most potent balanced antioxidant capacity.

3. Materials and Methods

3.1. Chemistry

3.1.1. General Methods

Compound purification was performed by column chromatography with Merck Silica Gel (40–63 µm) or by flash chromatography and the adequate eluent for each case. Reaction course was monitored by thin layer chromatography (t.l.c.), revealing with UV light (λ = 254 nm) and ethanolic solution of vanillin or ninhydrin. Melting points were determined using a Reichert Thermo Galen Kofler block and were uncorrected. Samples were dissolved in CDCl3 or DMSO-d6 using TMS as internal standard for 1H NMR spectra. In 13C NMR spectra, CDCl3 central signal (77.0 ppm) and DMSO-d (39.5 ppm) were used as references. 1H-NMR and 13C-NMR spectra were obtained in Bruker Avance 300 (300 MHz) and Bruker Avance 400 III HD (400 Hz) spectrometers. Chemical shifts (δ) are given in ppm. Coupling constants (J) are given in Hz. Signal multiplicity is abbreviated as singlet (s), doublet (d), triplet (t), quartet (c), doublet of doublets (dd), triplet of doublets (td), or multiplet (m). IR spectra were recorded on a Perkin-Elmer Spectrum One B spectrometer. Units are cm−1. Low resolution mass spectra were recorded on an Agilent HP 1100 LC/MS Spectrometer, whereas High Resolution mass spectrometry (Exact Mass) was performed in an AGILENT 6520 Accurate-Mass QTOF LC/MS Spectrometer. Elemental analysis was performed in an Elementary Chemical Analyzer LECO CHNS-932.

3.1.2. General Method for the Synthesis of HTNs

To a suspension of benzene-1,3,5-tricarbaldehyde (1 mmol) in dry THF (20 mL), anhydrous NaHCO3 (3 equiv), Na2SO4 (4 equiv) and the corresponding N-alkylhydroxylamine hydrochloride (3 equiv) were added. The mixture was irradiated at 90 °C, and 15 bar, for the time indicated in each case. Then, the mixture was cooled, the solvent removed, and the crude purified by column chromatography.

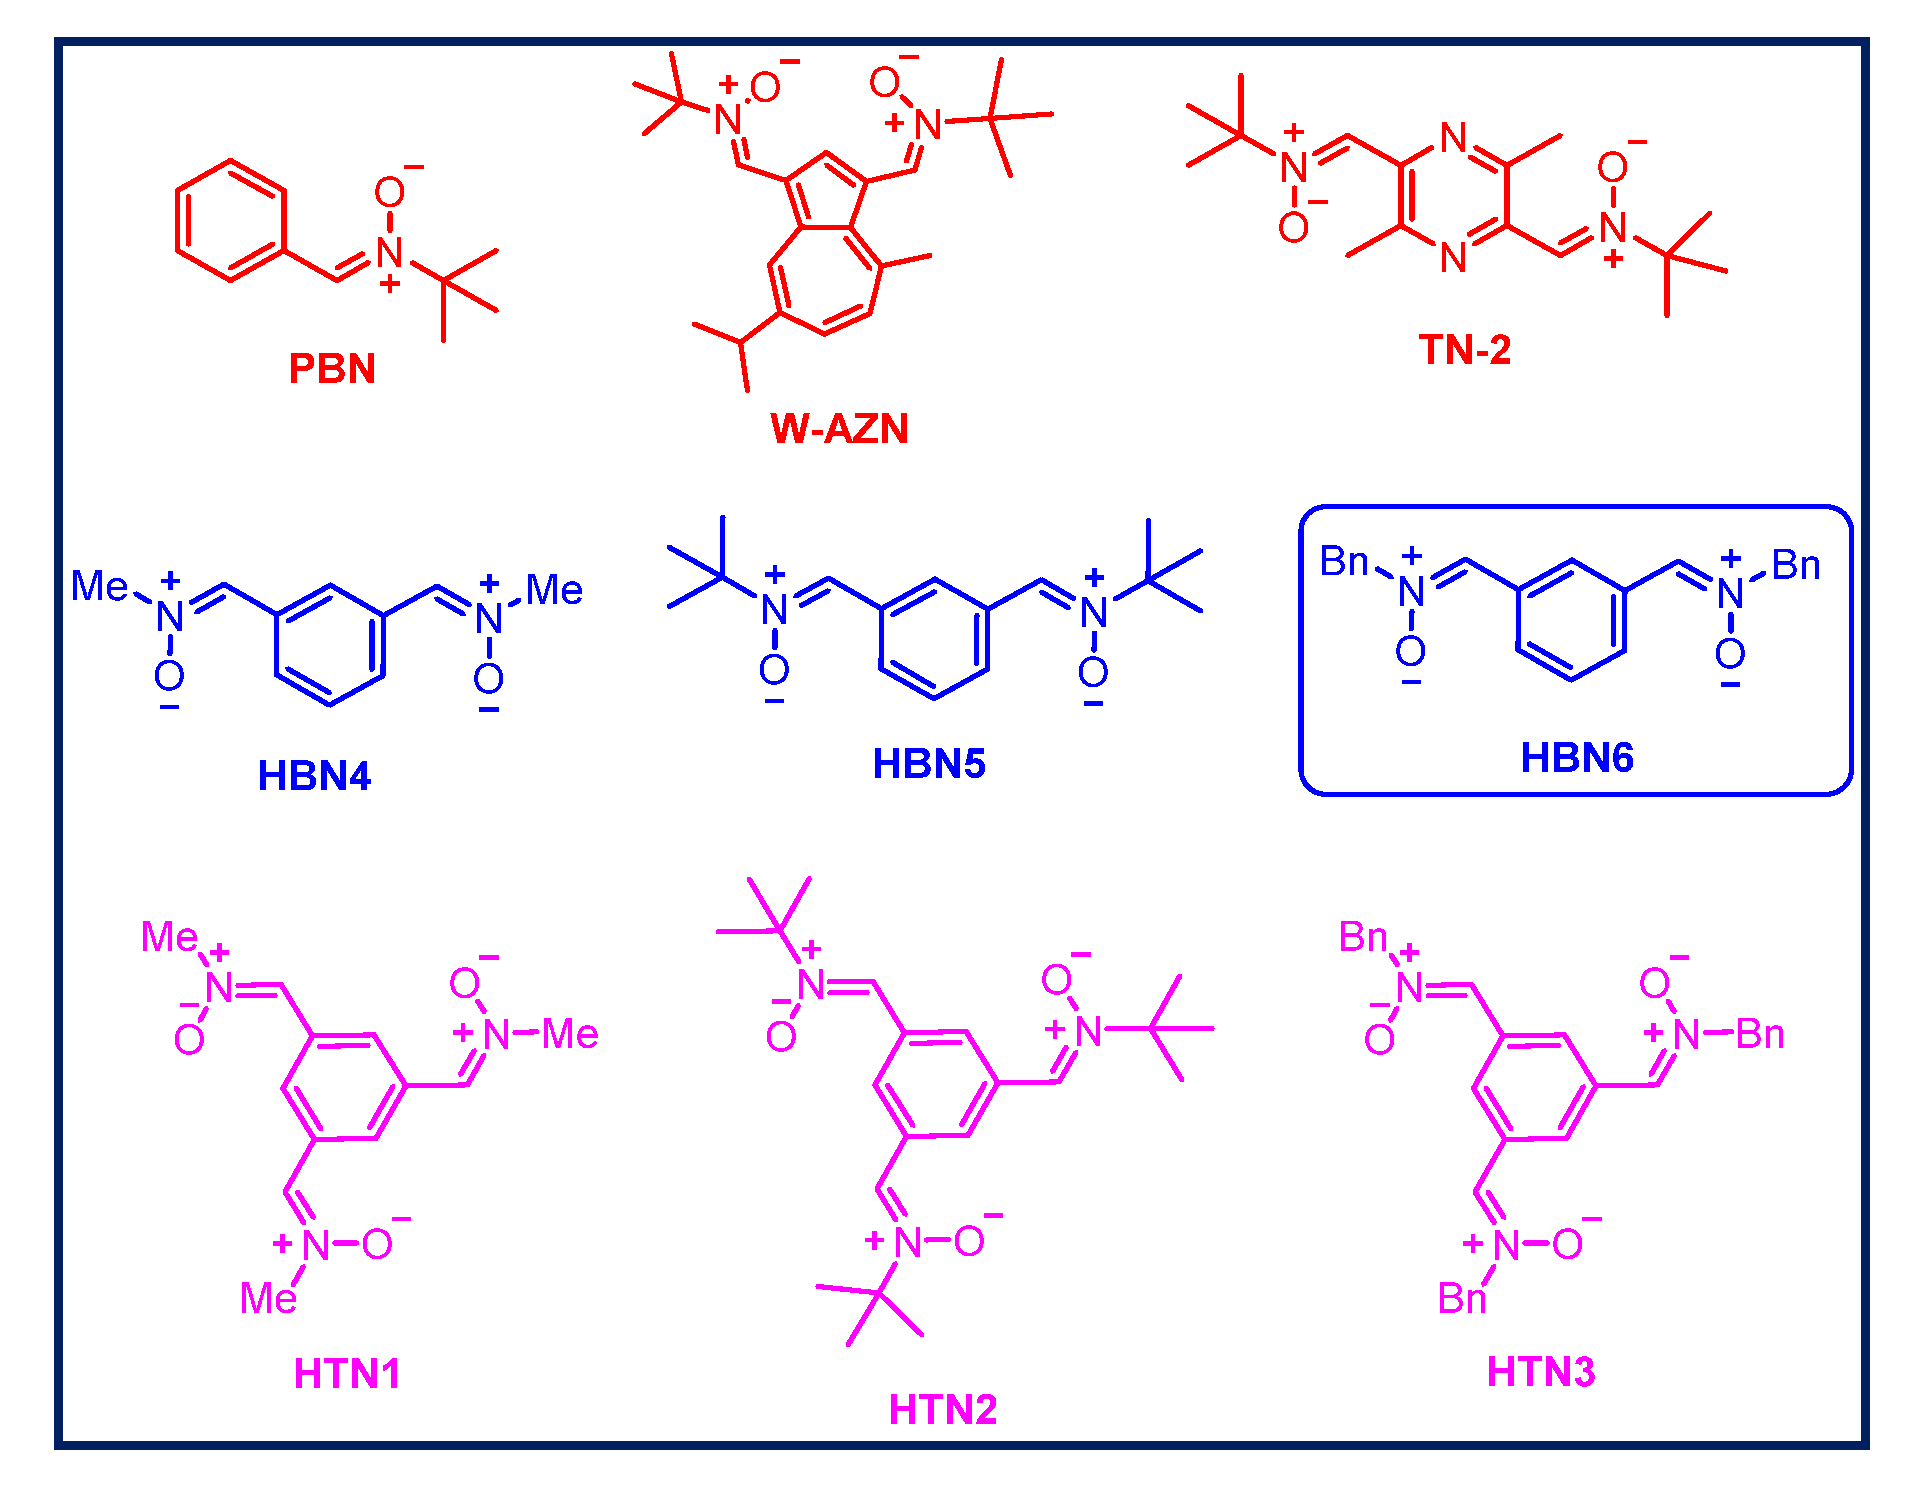
3.1.3. (1. Z,1′Z,1″Z)-1,1′,1″-(Benzene-1,3,5-triyl)tris(N-methylmethanimine oxide) (HTN1)

Following the general method, the reaction of benzene-1,3,5-tricarbaldehyde (113,4 mg, 0,7 mmol) with NaHCO3 (229,3 mg, 2,73 mmol), Na2SO4 (397,6 mg, 2,73 mmol), and N-methylhydroxylamine hydrochloride (228,1 mg, 2,73 mmol), in THF (20 mL), for 6 h, after work-up and purification by column chromatography eluting with MeOH:CH2Cl2 8%, gave HTN1 (123,8 mg, 71%): mp > 220 °C; IR (KBr) ν 3422, 1598, 1412, 1187, 1158 cm−1; 1H NMR (400 MHz, DMSO-d6) δ 9.11 (s, 3 H, H-7, H-9, H-11), 7.96 (s, 3 H, H-2, H-4, H-6), 3.81 (s, 9 H, CH3); 13C NMR (101 MHz, DMSO-d6) δ 133.9 (3 C, C-2, C-4, C-6), 131.7 (3 C, C-1, C-3, C-5), 128.2 (3 C, C-7, C-9, C-11), 54.6 (3 C, CH3); MS (ES) m/z (%): 249 [M+1]+, 271 [M+Na]+. Anal. Calcd for C12H15N3O3.2/3H2O: C, 55.16; H, 6.30; N, 16.08. Found: C, 55.12; H, 6.12; N, 15.89.

3.1.4. (1. Z,1′Z,1″Z)-1,1′,1″-(Benzene-1,3,5-triyl)tris(N-tert-butylmethanimine oxide) (HTN2)

Following the general method, the reaction of benzene-1,3,5-tricarbaldehyde (81 mg, 0.5 mmol) with NaHCO3 (163.8 mg, 1.95 mmol), Na2SO4 (284 mg, 2 mmol), and N-t-butylhydroxylamine hydrochloride (244.9 mg, 1.95 mmol), in THF (20 mL), for 15.5 h, after work-up and purification by column chromatography eluting with AcOEt, gave HTN2 (123.8 mg, 59%): mp > 220 °C; IR (KBr) ν 3434, 2975, 1562, 1361, 1172 cm−1; 1H NMR (400 MHz, DMSO-d6) δ 9.33 (s, 3 H, H-7, H-9, H-11), 7.86 (s, 3 H, H-2, H-4, H-6), 3.33 (s, 27 H, C(CH3)3]; 13C NMR (101 MHz, DMSO-d6) δ 131.8 (3 C, C-1, C-3, C-5), 129.5 (3 C, C-7, C-9, C-11), 128.8 (3 C, C-2, C-4, C-6), 71.1 (3 C, C-8, C-10, C-12), 28.3 [9 C, C(CH3)3]; MS (ES) m/z (%): 376 [M+1]+, 398 [M+Na]+. Anal. Calcd for C21H33N3O3: C, 67.17; H, 8.86; N, 11.19. Found: C, 66.94; H, 8.87; N, 11.07.

3.1.5. (1. Z,1′Z,1″Z)-1,1′,1″-(Benzene-1,3,5-triyl)tris(N-benzylmethanimine oxide) (HTN3)

Following the general method, the reaction of benzene-1,3,5-tricarbaldehyde (81 mg, 0.5 mmol) with NaHCO3 (163.8 mg, 1.95 mmol), Na2SO4 (284 mg, 2 mmol), and N-benzylhydroxylamine hydrochloride (310.1 mg, 1.95 mmol), in THF (20 mL), for 6 h, after work-up and purification by column chromatography eluting with AcOEt, gave HTN3 (203.2 mg, 85%): mp 165−7 °C; IR (KBr) ν 3429, 1580, 1580, 1496, 1457, 1176 cm−1; 1H NMR (400 MHz, DMSO-d6) δ 9.13 (s, 3 H, H-7, H-10, H-13), 8.18 (s, 3 H, H-2, H-4, H-6), 7.54–7.29 (m, 15 H, C6H5), 5.09 (s, 6 H, H-7, H-11, H-14); 13C NMR (101 MHz, DMSO-d6) δ 135.1 (3 C, C6H5), 133.2 (3 C, C-2, C-4, C-6), 131.6 (3 C, C-1, C-3, C-5), 129.5 (6 C, C6H5), 128.9 (6 C, C6H5), 128.8 (3 C, C6H5), 128.6 (3 C, C-7, C-10, C-13), 70.6 (3 C, C-7, C-11, C-14); MS (ES) m/z (%): 478 [M+1]+, 500 [M+Na]+. Anal. Calcd for C30H27N3O3.1/5H2O: C, 74.89; H, 5.74; N, 8.73. Found: C, 74.87; H, 5.81; N, 8.76.

3.2. Neuroprotection Assessment Assays

3.2.1. Neuroblastoma Cell Cultures

The human neuroblastomas cell line SH-SY5Y were cultured in Dulbecco’s: Ham’s F12, 1:1 [vol/vol] containing 3.15 mg/mL glucose, 2.5 mM Glutamax and 0.5 mM sodium pyruvate DMEM/F-12, GlutaMAX™; GIBCO, Life Technologies, Madrid (Spain), 1% Antibiotique-Antimitotic (Gibco; Life Technologies, Madrid, Spain) (containing 100 ui/mL penicillin, 100 mg/mL of streptomycin and 0.25 mg of amphotericine B), 1% gentamicina 15 mg/mL (Sigma-Aldrich, Madrid, España) and 10% Foetal Calf Serum (FCS) (Gibco; Life Technologies, Madrid, Spain) as described [46,49]. Cultures were seeded into flasks containing supplemented medium and maintained at 37 °C in a humidified atmosphere of 5% CO2 and 95% air. Culture media were changed every 2 d. Cells were subcultured after partial digestion with 0.25% trypsin-EDTA. For assays, SHSY5Y cells were subcultured in 96- or 48-well plates at a seeding density of 0.50–1 or 2–2.5 × 10⁵ or cells per well, respectively. When the SHSY5Y cells reached 80% confluence, the medium was replaced with fresh medium containing 0.01–1000 μM compound concentrations or PBS in the controls, as indicated in each assay.

3.2.2. Neuroblastoma Cell Cultures Exposure to Oxygen Glucose Deprivation

Neuroblastoma cell cultures were exposed to OGD so as to induce cellular damage (experimental ischemia) as described [46]. Cultured cells were washed and placed in glucose-free Dulbecco’s medium (bubbled with 95% N2/5% CO2 for 30 min) and maintained in an anaerobic chamber containing a gas mixture of 95% N2/5% CO2 and humidified at 37 °C at a constant pressure of 0.15 bar. Cells were exposed to OGD for a period of 4 h (OGD 4 h), as indicated. At the end of the OGD period, culture medium was replaced with oxygenated serum-free medium, and cells were placed and maintained in the normoxic incubator for 24 h to recovery (R24h). In the neuroprotection experiments, HTNs 1-3 and PBN (0.01 μM−1 mM) were added at the beginning of recovery period (see below). Control cultures in Dulbecco’s medium containing glucose were kept in the normoxic incubator for the same period of time as the OGD (C4h), and then culture medium was replaced with fresh medium and cells were returned to the normoxic incubator until the end of recovery period (C24h). Control experiments included the same amounts of vehicle (final concentration < 0.01% dimethyl sulfoxide). The experimental procedures were blindly performed, assigning a random order to each assayed nitrone. Nitrones were analyzed independently 3–5 times with different batches of cultures, and each experiment was run in triplicate.

3.2.3. Assessment of Cell Viability

Measurements of cell viability in human SHSY5Y neuroblastoma cells were carried out into 96- well culture plates as described [46,50]. Briefly, control and treated SH-SY5Y neuroblastoma cells (about 0.75–1 × 10⁵ cells/well) were incubated with the XTT solution (Cell Proliferation Kit II (XTT), Sigma, Aldrich, Madrid) at 0.3 mg/mL final concentration for 2 h in a humidified incubator at 37 °C with 5% CO2 and 95% air (v/v) and the soluble orange formazan dye formed was spectrophotometrically quantified, using a Biotek Power-Wave XS spectrophotometer microplate-reader at 450 nm (reference 650 nm). All XTT assays were performed in triplicate in cells of at least three different cell batches. Control cells treated with DMEM alone were regarded as 100% viability. Controls containing different DMSO concentrations (0.001–1% DMSO) were performed in all assays.

3.2.4. Measurement of LDH Activity

For these assays, cultured neuroblastoma cells grown in 96-well culture dishes at a density of 1.5 × 10⁵ cells/well were used. LDH activity was measured as the rate of decrease of the absorbance at 340 nm, resulting from the oxidation of NADH to NAD+ as described [46,51]. Data are given as the percentage of LDH release with respect to the total LDH content (LDH in the culture medium and LDH inside the cells).

3.2.5. Analysis of Caspase-3 Activity

For these assays, cultured neuroblastoma cells grown in 48-well culture dishes, at a density of 2.5 × 10⁵ cells/well, were used. After OGD treatment, cells were treated with different nitrones or indicated positive controls at 1−500 μM concentrations and subjected to 24 h IR. Attached cells were lysed at 4 °C in a lysis medium containing 5 mM Tris/HCl (pH 8.0), 20 mM ethylenediaminetetraacetic acid, and 0.5% Triton X-100 and centrifuged at 13,000g for 10 min. The activity of caspase- 3 was measured using the fluorogenic substrate peptide DEVD-amc (66081; BD Biosciences PharMingen), as described [46,51]. Proteins were measured by the Bradford assay. Results were expressed as arbitrary fluorescence units [(AFU)/μg protein/h].

3.2.6. Measurement of Reactive Oxygen Species Formation

SHSY5Y human neuroblastoma cells (2 × 10⁵ cells/well) were exposed to OGD for a period of 4 h (OGD4h). At the end of the OGD period, the culture medium was replaced with oxygenated Dulbecco’s modified Eagle’s medium containing glucose and 10% fetal calf serum. Cells were treated in the absence (controls) or presence of indicated concentrations of nitrones or different known neuroprotective agents and maintained at 37 °C in a normoxic incubator for 3 h for recovery. At the end of this period, 20 μM DHE (HEt; Molecular Probes) was added and fluorescence was recorded every 15−30 s during a 15 min period, using an excitation filter of 535 nm and an emission filter of 635 nm in a spectrofluorimeter (Bio-Tek FL 600) as previously described [46,52]. Linear regression of fluorescence data [expressed as arbitrary fluorescence units (AFU)] was calculated for each condition, and the slopes (a) of the best fitting lines (y = ax) were considered as an index of O2•− production [52].

3.2.7. Statistical Analysis

Data were expressed as mean ± SEM of results obtained from at least three independent experiments from different cultures, each of which was performed in triplicate. Statistical comparisons between the different experimental conditions were performed using one-way analysis of variance (ANOVA), followed by Holm−Sidak’s post -test when the analysis of variance was significant. A p value < 0.05 was considered statistically significant. Fit curves for EC50 determinations were performed according to the program of SigmaPlot v.11 (Systat Software Inc., Germany), 2012).

3.3. Antioxidant Activity Tests of HTNs 1-3, PBN, Trolox, and NDGA in Vitro

3.3.1. Estimation of Lipophilicity as Clog P

Bioloom of Biobyte Corp was used for the theoretical calculation of lipophilicity as Clog p values (BioByte Home Page. Available online: http://www.biobyte.com).

3.3.2. General Methods

Nordihydroguaiaretic acid (NDGA), Trolox, 2,2′-azobis(2-amidinopropane) dihydrochloride (AAPH), Soybean LOX linoleic acid sodium salt were purchased from the Aldrich Chemical Co. Milwaukee, WI, (USA). Phosphate buffer (0.1 M and pH 7.4) was prepared mixing an aqueous KH2PO4 solution (50 mL, 0.2 M), and an aqueous of NaOH solution (78 mL, 0.1 M); the pH (7.4) was adjusted by adding a solution of KH2PO4 or NaOH). For the in vitro tests a Lambda 20 (Perkin–Elmer-PharmaSpec 1700) UV–Vis double beam spectrophotometer was used.

3.3.3. Inhibition of Linoleic Acid Peroxidation

For initiating the free radical, 2,2′-azobis(2-amidinopropane) dihydrochloride (AAPH) was used. The final solution in the UV cuvette consisted of 10 μL of the 16 mM linoleate sodium dispersion, 0.93 mL of 0.05 M phosphate buffer, pH 7.4, thermostated at 37 °C. A total of 50 μL of 40 mM AAPH solution was added as a free radical initiator at 37 °C under air and 10 μL of the tested compounds. The oxidation of linoleic acid sodium salt results a conjugated diene hydroperoxide. The reaction was monitored at 234 nm.

3.3.4. Soybean Lipoxygenase Inhibition Study

DMSO solution of the tested compound (stock solutions 10 mM) was incubated with sodium linoleate (0.1 mM) and 0.2 mL of soybean lipoxygenase solution (1/9 × 10−4 w/v in saline) at room temperature. The test followed our previous published methods [53]. The conversion of sodium linoleate to 13-hydroperoxylinoleic acid was recorded at 234 nm and compared with the standard inhibitor NDGA (ΙC50 = 0.45 μΜ/935 at 100 μΜ). Several concentrations were used to determine the IC50.

3.3.5. ABTS+•—Decolorization Assay for Antioxidant Activity

The ABTS radical cation (ABTS+•) was generated from an ABTS stock solution in water (7 mM) which was mixed with potassium persulfate (2.45 mM) and left in the dark at room temperature for 12–16 h before use. The results were recorded after 1min of the mixing solutions at 734 nm and compared to the appropriate standard inhibitor Trolox [53].

3.3.6. Hydroxyl Radical Scavenging Activity

The hydroxyl radicals were produced by the Fe3+/ascorbic acid system. EDTA (0.1 mM), Fe3+ (167 μM), DMSO (33 mM) in phosphate buffer (50 mM, pH 7.4), the tested compounds (0.1 mM), and ascorbic acid (10 mM) were mixed in test tubes. The solutions were incubated at 37 °C for 30 min. The reaction was stopped by CCl3COOH (17% w/v) and the % scavenging activity of the tested compounds for hydroxyl radicals was given.

4. Conclusions

In this work we described the design, synthesis, neuroprotection, and antioxidant capacity of HTNs 13 derived from PBN, comparing them with HBN6 (Figure 1), our most recently discovered potent neuroprotective homo-bis-nitrone [46]. The biological evaluation of these HTNs included neuroprotection against O/R, an ischemia in vitro model under OGD conditions in human neuroblastoma SH-SY5Y cells, and diverse antioxidant tests.
Our design, supported by our previous report [46], was based on the hypothesis that three nitrone motifs installed in the same scaffold should afford higher neuroprotective power than two nitrone groups. In other words, the greater the number of nitrone free radical scavenging groups, the stronger the antioxidant and neuroprotective properties.
The neuroprotection of HTNs 1-3, measured against O/R, showed that HTN2 was the best neuroprotective agent at a lower dose (EC50 = 51.63 ± 4.32 μM), but HTN3 produced the greater neuroprotection at a higher dose (EC50 = 125.57 ± 6.19 μM), HTN2 being similar in EC50 and maximal activity to PBN and less potent than any of HBNs 4-6. The results of neuroprotection in an in vitro oxygen glucose deprivation model showed that HTN2 was the most powerful, EC50 = 87.57, 3,87 μM, at lower dose, but 50-fold higher than its analogous HBN5, and ≈1.7-fold less potent than PBN, but again HTN3 produced the greater neuroprotection at a higher dose (EC50 = 124.06 ± 7.40 μM). HTN3 has a very good antinecrotic (IC50 = 3.47 ± 0.57 μM), antiapoptotic, and antioxidant (EC50 = 6.77 ± 1.35 μM), profile, very similar to that of its analogous HBN6. Finally, HTN3 was able to inhibit 92% LP, LOX (70 μM), and ABTS+ (10%), showing high hydroxyl radical scavenger capacity (83%) and exhibiting thus the potent balanced antioxidant capacity among the nitrones investigated here. However, the results of the present work show that in general, the HTNs 1-3 do not have better properties than HBN6, but clearly exceed PBN. From the point of view of our drug design, it is clear that the introduction of a third, additional nitrone group seems not to provide an additional, accumulative benefit to the neuroprotective, and antioxidant activity previously observed for HBN5 and HBN6 [46], bearing two nitrone groups. In other words, “more is better, but much more is worse” (Figure 8).
Furthermore, these results confirmed what we have reported in a previous communication [54]. Thus, based on the ability of the “N-propargylamine” motif to impart MAO inhibition, we wondered whether the progressive incorporation of 1, 2, or 3 “N-propargylamine” motives in a simple core provided by the 1,3,5-triazine could afford progressive, accumulative, and higher MAO inhibition power. The observed results clearly showed again that much more is worse, that the incorporation of more anti-MAO pharmacophores is not a guarantee for better inhibition. On the contrary, less inhibition or no inhibition was detected, and only ligand 4,6-dichloro-N-(prop-2-yn-1-yl)-1,3,5-triazin-2-amine bearing a single N-propargylamine MAO pharmacophore motif, showed modest, but totally selective MAO-B inhibition [54].
The present result is not necessarily negative, as it was an obvious necessary development in our current program to identify new and more efficient nitrones for therapeutic purposes, and this is possibly a general trend that should be taken into account in drug discovery projects [54]. Consequently, our present endeavors in this arena are now directed to the rational and wise structural modification of HBN5 and HBN6 (Figure 1) to improve its neuroprotective and antioxidant properties [46].

Supplementary Materials

Supplementary Materials (NMR spectra of HTNs 1-3) can be found at https://www.mdpi.com/1422-0067/21/21/7949/s1.

Author Contributions

J.M.-C. designed the molecules and supervised their synthesis; D.D.-I. carried out the synthesis of HTNs 1-3; B.C. and M.T. performed the neuroprotection studies; M.C. carried out the analysis of the nitrones; D.H.-L. performed the antioxidant tests; M.J.O.-G. designed, supervised, analyzed, and coordinated the neuroprotection studies; M.J.O.-G. and J.M.-C. wrote the manuscript; M.J.O.-G., J.M.-C., I.I. and F.L.-M. corrected the manuscript. All authors have read and agreed to the published version of the manuscript.

Funding

This work was supported by grants from the Spanish Ministry of Economy and Competitiveness (SAF2015-65586-R) to J.M.-C. and Camilo José Cela University (UCJC-2018-04) to M.J.O.-G.

Acknowledgments

Hadjipavlou-Litina thanks Biobyte for the free use of C-QSAR platform. D.D.-I. thanks the Spanish Ministry of Science, Innovation and Universities for pre-doctoral FPU grant. B.C. thanks the UCJC for a pre-doctoral FPI grant.

Conflicts of Interest

The authors declare no competing financial interest. The funders had no role in the design of the study; in the collection, analyses, or interpretation of data; in the writing of the manuscript, or in the decision to publish the results.

Abbreviations

AAPH2,2′-Azobis(2-amidinopropane) dihydrochloride
NACN-Acetyl-L-cysteine
BBBBlood−brain barrier
HBNsHomo-bis-nitrones
HTNsHomo-tris-nitrones
IRIschemic reperfusion
LDHLactate dehydrogenase
LOXLipoxygenase
LPLipid peroxidation
MTT3-(4,5-Dimethylthiazol-2-yl)-2,5-diphenyltetrazolium bromide
NDGANordihydroguaiaretic acid
O/ROligomycin A/Rotenone
OGDOxygen Glucose Deprivation
PBNα-Phenyl-N-tert-butylnitrone
ROSReactive oxygen species

References

  1. Tanaka, M.; Bohár, Z.; Vécsei, L. Are kynurenines accomplices or principal villains in dementia? Maintenance of kynurenine metabolism. Molecules 2020, 25, 564. [Google Scholar] [CrossRef] [Green Version]
  2. Tanaka, M.; Vécsei, L. Monitoring the redox status in multiple sclerosis. Biomedicines 2020, 8, 406. [Google Scholar] [CrossRef]
  3. Catanesi, M.; d’Angelo, M.; Tupone, M.G.; Benedetti, E.; Giordano, A.; Castelli, V.; Cimini, A. 438 MicroRNAs dysregulation and mitochondrial dysfunction in neurodegenerative diseases. Int. J. Mol. Sci. 2020, 21, 5986. [Google Scholar] [CrossRef]
  4. Azzi, A. Antioxidants: Wonder drugs or quackery? BioFactors 2017, 43, 785–788. [Google Scholar] [CrossRef] [PubMed]
  5. Nicole, O.; Docagne, F.; Ali, C.; Margaill, I.; Carmeliet, P.; MacKenzie, E.T.; Vivien, D.; Buisson, A. The proteolytic activity of tissue-plasminogen activator enhances NMDA receptor-mediated signaling. Nat. Med. 2001, 7, 59–64. [Google Scholar] [CrossRef] [PubMed]
  6. Chan, P.H. Cellular Antioxidant Defense Mechanisms; Chow, C.K., Ed.; CRC Press: Boca Ratón, FL, USA, 1988; Volume 3, pp. 89–109. [Google Scholar]
  7. Rosselin, M.; Poeggeler, B.; Durand, G. Nitrone derivatives as therapeutics: From chemical modification to specific-targeting. Curr. Top. Med. Chem. 2017, 17, 2006–2022. [Google Scholar] [CrossRef] [PubMed]
  8. Oliveira, C.; Benfeito, S.; Fernandes, C.; Cagide, F.; Silva, T.; Borges, F. NO and HNO donors, nitrones, and nitroxides: Past, present, and future. Med. Res. Rev. 2018, 38, 1159–1187. [Google Scholar] [CrossRef] [PubMed]
  9. Floyd, R.A.; Kopke, R.D.; Choi, C.-H.; Foster, S.B.; Doblas, S.; Towner, R.A. Nitrones as therapeutics. Free Radic. Biol. Med. 2008, 45, 1361–1374. [Google Scholar] [CrossRef] [PubMed] [Green Version]
  10. Croitoru, M.D.; Ibolya, F.; Pop, M.C.; Dergez, T.; Mitroi, B.; Dogaru, M.T.; Tőkes, B. Nitrones are able to release nitric oxide in aqueous environment under hydroxyl free radical attack. Nitric Oxide 2011, 25, 309–315. [Google Scholar] [CrossRef]
  11. Durand, G.; Choteau, F.; Pucci, B.; Villamena, F.A. Reactivity of superoxide radical anion and hydroperoxyl radical with alpha-phenyl-N-tert-butylnitrone (PBN) derivatives. J. Phys. Chem. A 2008, 112, 12498–12509. [Google Scholar] [CrossRef]
  12. Cao, X.; Phillis, J.W. Phenyl-tert-butyl-nitrone reduces cortical infarct and edema in rats subjected to focal ischemia. Brain Res. 1994, 644, 267–272. [Google Scholar] [CrossRef]
  13. Escobar-Peso, A.; Chioua, M.; Frezza, V.; Martínez-Alonso, E.; Marco-Contelles, J.A.; Alcázar, A. Nitrones, Old fellows for new therapies in ischemic stroke. In Neuroprotective Therapy for Stroke and Ischemic Disease; Lapchak, P.A., Zhang, J.H., Eds.; Springer: Cham, Switzerland, 2017; Chapter 9; pp. 251–283. [Google Scholar]
  14. Maples, K.R.; Green, A.R.; Floyd, R.A. Nitrone-related therapeutics: Potential of NXY-059 for the treatment of acute ischaemic stroke. CNS Drugs 2004, 18, 1071–1084. [Google Scholar] [CrossRef] [PubMed]
  15. Liu, Z.-Q. Bridging free radical chemistry with drug discovery: A promising way for finding novel drugs efficiently. Eur. J. Med. Chem. 2020, 189, 112020. [Google Scholar] [CrossRef] [PubMed]
  16. Floyd, R.A.; Neto, H.C.C.F.; Zimmerman, G.A.; Hensley, K.; Towner, R.A. Nitrone-based therapeutics for neurodegenerative diseases: Their use alone or in combination with lanthionines. Free Rad. Biol. Med. 2013, 62, 145–156. [Google Scholar] [CrossRef] [Green Version]
  17. Floyd, R.A.; Towner, R.A.; He, T.; Hensley, K.; Maples, K.R. Translational research involving oxidative stress and diseases of aging. Free Radic. Biol. Med. 2011, 51, 931–941. [Google Scholar] [CrossRef] [Green Version]
  18. Mandal, M.N.; Moiseyev, G.P.; Elliott, M.H.; Kasus-Jacobi, A.; Li, X.; Chen, H.; Zheng, L.; Nikolaeva, O.; Floyd, R.A.; Ma, J.-X.; et al. Alpha-phenyl-N-tert-butylnitrone (PBN) prevents light-induced degeneration of the retina by inhibiting RPE65 protein isomerohydrolase activity. J. Biol. Chem. 2011, 286, 32491–32501. [Google Scholar] [CrossRef] [Green Version]
  19. Ewert, D.; Hu, N.; Du, X.; Li, W.; West, M.B.; Choi, C.-H.; Floyd, R.; Kopke, R.D. HPN-07, a free radical spin trapping agent, protects against functional, cellular and electrophysiological changes in the cochlea induced by acute acoustic trauma. PLoS ONE 2017, 12, e0183089. [Google Scholar] [CrossRef]
  20. Novelli, G.P.; Angiolini, P.; Tani, R.; Consales, G.; Bordi, L. Phenyl-t-butyl-nitrone is active against traumatic shock in rats. Free Radic. Res. Commun. 1986, 1, 321–327. [Google Scholar] [CrossRef]
  21. Dias, A.G.; Santos, C.E.V.; Cyrino, F.Z.G.A.; Bouskela, E.; Costa, P.R.R. N-tert-Butyl and N-methyl nitrones derived from aromatic aldehydes inhibit macromolecular permeability increase induced by ischemia/reperfusion in hamsters. Bioorg. Med. Chem. 2009, 17, 3995–3998. [Google Scholar] [CrossRef]
  22. Sun, Y.; Jiang, J.; Zhang, Z.; Yu, P.; Wang, L.; Xu, C.; Liu, W.; Wang, Y. Antioxidative and Thrombolytic TMP Nitrone for Treatment of Ischemic Stroke. Bioorg. Med. Chem. 2008, 16, 8868–8874. [Google Scholar] [CrossRef]
  23. Sun, Y.; Yu, P.; Zhang, G.; Wang, L.; Zhong, H.; Zhai, Z.; Wang, L.; Wang, Y. Therapeutic effects of tetramethylpyrazine nitrone in rat ischemic stroke models. J. Neurosci. Res. 2012, 90, 1662–1669. [Google Scholar] [CrossRef] [PubMed]
  24. Zhang, Z.; Zhang, G.; Sun, Y.; Szeto, S.S.W.; Law, H.C.H.; Quan, Q.; Li, G.; Yu, P.; Sho, E.; Siu, M.K.W.; et al. Tetramethylpyrazine nitrone, a multifunctional neuroprotective agent for ischemic stroke therapy. Sci. Rep. 2016, 6, 37148. [Google Scholar] [CrossRef]
  25. Sun, Y.; Zhang, G.; Zhang, Z.; Yu, P.; Zhong, H.; Du, J.; Wang, Y. Novel multi-functional nitrones for treatment of ischemic stroke. Bioorg. Med. Chem. 2012, 20, 3939–3945. [Google Scholar] [CrossRef] [PubMed]
  26. Socrier, L.; Rosselin, M.; Choteau, F.; Durand, G.; Morandat, S. Cholesterol-nitrone conjugates as protective agents against lipid oxidation: A model membrane study. BBA Biomembranes 2017, 1859, 2495–2504. [Google Scholar] [CrossRef] [PubMed]
  27. Choteau, F.; Durand, G.; Ranchon-Cole, I.; Cercy, C.; Pucci, B. Cholesterol-based-phenyl-N-tert-butyl nitrone derivatives as antioxidants against light-induced retinal degeneration. Bioorg. Med. Chem. Lett. 2010, 20, 7405–7409. [Google Scholar] [CrossRef] [PubMed]
  28. Rosselin, M.; Tuccio, B.; Perio, P.; Villamena, F.A.; Fabre, P.-L.; Durand, G. Electrochemical and spin-trapping properties of para-substituted α-phenyl-N-tert-butyl nitrones. Electrochim. Acta 2016, 193, 231–239. [Google Scholar] [CrossRef]
  29. Zeghdaoui, A.; Tuccio, B.; Finet, J.-P.; Cerri, V.; Tordo, P. β-Phosphorylated α-phenyl-N-tert-butylnitrone (PBN) analogues: A new series of spin traps for oxyl radicals. J. Chem. Soc. Perkin Trans. 1995, 2, 2087–2089. [Google Scholar] [CrossRef]
  30. Roubaud, V.; Lauricella, R.; Bouteiller, J.-C.; Tuccio, B. N-2-(2-Ethoxycarbonyl-propyl) α-phenylnitrone: An efficacious lipophilic spin trap for superoxide detection. Arch. Biochem. Biophys. 2002, 397, 51–56. [Google Scholar] [CrossRef]
  31. Rosselin, M.; Choteau, F.; Zéamari, K.; Nash, K.M.; Das, A.; Lauricella, R.; Lojou, E.; Tuccio, B.; Villamena, F.A.; Durand, G. Reactivities of substituted α-phenyl-N-tert -butyl nitrones. J. Org. Chem. 2014, 79, 6615–6626. [Google Scholar] [CrossRef]
  32. Deletraz, A.; Zéamari, K.; Hua, K.; Combes, M.; Villamena, F.A.; Tuccio, B.; Callizot, N.; Durand, G. Substituted α-phenyl and α-naphthlyl-N-tert-butyl nitrones: Synthesis, spin-trapping, and neuroprotection evaluation. J. Org. Chem. 2020, 85, 6073–6085. [Google Scholar] [CrossRef]
  33. Balogh, G.T.; Vukics, K.; Könczöl, A.; Kis-Varga, A.; Gere, A.; Fischer, J. Nitrone derivatives of trolox as neuroprotective agents. Bioorg. Med. Chem. Lett. 2005, 15, 3012–3015. [Google Scholar] [CrossRef] [PubMed]
  34. Chioua, M.; Sucunza, D.; Soriano, E.; Hadjipavlou-Litina, D.; Alcázar, A.; Ayuso, I.; Oset-Gasque, M.J.; González, M.P.; Monjas, L.; Rodríguez-Franco, M.I.; et al. Aryl-N-alkyl nitrones, as potential agents for stroke treatment: Synthesis, theoretical calculations, antioxidant, anti-inflammatory, neuroprotective and brain-blood barrier permeability properties. J. Med. Chem. 2012, 55, 153–168. [Google Scholar] [CrossRef] [PubMed] [Green Version]
  35. Ayuso, M.I.; Chioua, M.; Martínez-Alonso, E.; Soriano, E.; Montaner, J.; Masjuán, J.; Hadjipavlou-Litina, D.; Marco-Contelles, J.; Alcázar, A. Cholesteronitrones for stroke. J. Med. Chem. 2015, 58, 6704–6709. [Google Scholar] [CrossRef] [PubMed] [Green Version]
  36. Ayuso, M.I.; Martínez-Alonso, E.; Chioua, M.; Escobar-Peso, A.; Gonzalo-Gobernado, R.; Montaner, J.; Marco-Contelles, J.; Alcázar, A. Quinolinylnitrone RP19 induces neuroprotection after transient brain ischemia. ACS Chem. Neurosci. 2017, 8, 2202–2213. [Google Scholar] [CrossRef]
  37. Chioua, M.; Salgado-Ramos, M.; Diez-Iriepa, D.; Escobar-Peso, A.; Isabel Iriepa, I.; Hadjipavlou-Litina, D.; Martínez-Alonso, E.; Alcázar, A.; Marco-Contelles, J. Novel quinolylnitrones combining neuroprotective and antioxidant properties. ACS Chem. Neurosci. 2019, 10, 2703–2706. [Google Scholar] [CrossRef]
  38. Chioua, M.; Martinez-Alonso, E.; Gonzalo-Gobernado, R.; Ayuso, M.I.; Escobar-Peso, A.; Infantes, L.; Hadjipavlou-Litina, D.; Montoya, J.J.; Montaner, J.; Alcazar, A.; et al. New quinolylnitrones for stroke therapy: Antioxidant and neuroprotective (Z)-N-tert-butyl-1-(2-chloro-6-methoxyquinolin-3-yl)methanimine oxide as a new lead-compound for ischemic stroke treatment. J. Med. Chem. 2019, 62, 2184–2201. [Google Scholar] [CrossRef] [PubMed]
  39. Becker, D.A.; Ley, J.J.; Echegoyen, L.; Alvarado, R. Stilbazulenyl nitrone (STAZN): A nitronyl-substituted hydrocarbon with the potency of classical phenolic chain-breaking antioxidants. J. Am. Chem. Soc. 2002, 124, 4678–4684. [Google Scholar] [CrossRef]
  40. Ginsberg, M.D.; Becker, D.A.; Busto, R.; Belayev, A.; Zhang, Y.; Khoutorova, L.; Ley, J.J.; Zhao, W.; Belayev, L. Stilbazulenyl nitrone, a novel antioxidant, is highly neuroprotective in focal ischemia. Ann. Neurol. 2003, 54, 330–342. [Google Scholar] [CrossRef]
  41. Lapchak, P.A.; Schubert, D.R.; Maher, P.A. De-risking of stilbazulenyl nitrone (stazn), a lipophilic nitrone to treat stroke using a unique panel of in vitro assays. Trans. Stroke Res. 2011, 2, 209–217. [Google Scholar] [CrossRef] [Green Version]
  42. Althaus, J.S.; Fleck, T.J.; Becker, D.A.; Hall, E.D.; Von Voigtlander, P.F. Azulenyl nitrones: Colorimetric detection of oxyradical end products and neuroprotection in the gerbil transient forebrain ischemia/reperfusion model. Free Radical Biol. Med. 1998, 24, 738–744. [Google Scholar] [CrossRef]
  43. Xu, D.; Duan, H.; Zhang, Z.; Cui, W.; Wang, L.; Sun, Y.; Lang, M.; Hoy, P.M.; Han, Y.; Wang, Y.; et al. The novel tetramethypyrazine bis-nitrone (TN-2) protects against MPTP/MPP+-induced neurotoxicity via inhibition of mitochondrial-dependent apoptosis. J. Neuroimmune Pharmacol. 2014, 9, 245–258. [Google Scholar] [CrossRef] [PubMed]
  44. Xu, D.-P.; Zhang, K.; Zhang, Z.-J.; Sun, Y.-W.; Guo, B.-J.; Wang, Y.-Q.; Hoi, P.-M.; Han, Y.-F.; Lee, S.M.-Y. A Novel Tetramethylpyrazine bis-nitrone (TN-2) protects against 6-hydroxyldopamine-induced neurotoxicity via modulation of the NF-κB and the PKCα/PI3-K/Akt pathways. Neurochem. Int. 2014, 78, 76–85. [Google Scholar] [CrossRef] [PubMed]
  45. Sun, Y.; Liao, K.; Li, S.; Zhang, Z.; Yu, P.; Wang, Y. Pharmacokinetic analysis of tetramethylpyrazine bis-nitrone TN-2 in rats and its protein binding in vitro. Lett. Drug Des. Discov. 2014, 11, 770–777. [Google Scholar] [CrossRef]
  46. Chamorro, B.; Diez-Iriepa, D.; Merás-Sáiz, B.; Chioua, M.; García-Vieira, D.; Iriepa, I.; Hadjipavlou-Litina, D.; López-Muñoz, F.; Martínez-Murillo, R.; González-Nieto, D.; et al. Synthesis, antioxidant properties and neuroprotection of α-phenyl-tert-butylnitrone derived HomoBisNitrones in in vitro and in vivo ischemia models. Sci. Rep. 2020, 10, 14150. [Google Scholar] [CrossRef] [PubMed]
  47. Tien, M.-J.; Wang, Y.; Ho, T.-I.; Chiang, L.Y. Synthesis and magnetic properties of stable nitroxyl tri-radicals. Synth. Metals 1997, 85, 1675–1676. [Google Scholar] [CrossRef]
  48. Carney, J.M.; Floyd, R.A. Spin trapping agents for the treatment of diseases associated with oxidation of lipids and proteins. PCT Int. Appl. 1992, 32, S22–S27, WO9222290. [Google Scholar]
  49. Jiménez-Almarza, A.; Diez-Iriepa, D.; Chioua, M.; Chamorro, B.; Iriepa, I.; Martínez-Murillo, R.; Hadjipavlou-Litina, D.; Oset-Gasque, M.J.; Marco-Contelles, J. Synthesis, neuroprotective and antioxidant capacity of PBN-related indanonitrones. Bioorg. Chem. 2019, 86, 445–451. [Google Scholar] [CrossRef]
  50. García-Font, N.; Hayour, H.; Belfaitah, A.; Pedraz, J.; Moraleda, I.; Iriepa, I.; Bouraiou, A.; Chioua, M.; Marco-Contelles, J.; Oset-Gasque, M.J. Potent anticholinesterasic and neuroprotective pyranotacrines as inhibitors of beta-amyloid aggregation, oxidative stress and tau-phosphorylation for Alzheimer’s disease. Eur. J. Med. Chem. 2016, 118, 178–192. [Google Scholar] [CrossRef]
  51. Vicente, S.; Pérez-Rodríguez, R.; Oliván, A.M.; Martínez-Palacián, A.; González, M.P.; Oset-Gasque, M.J. Nitric oxide andperoxynitrite induce cellular death in bovine chromaffin cells: Evidence for a mixed necrotic and apoptotic mechanism with caspases activation. J. Neurosci. Res. 2006, 84, 78–96. [Google Scholar] [CrossRef]
  52. Piotrowska, D.G.; Mediavilla, L.; Cuarental, L.; Głowacka, I.E.; Marco-Contelles, J.; Hadjipavlou-Litina, D.; López-Muñoz, F.; Oset-Gasque, M.J. Synthesis and neuroprotective properties of N-substituted C-dialkoxyphosphorylated nitrones. ACS Omega 2019, 16, 8581–8587. [Google Scholar] [CrossRef] [Green Version]
  53. Pontiki, E.; Hadjipavlou-Litina, D.; Litinas, K.; Geromichalos, G. Novel cinnamic acid derivatives as antioxidant and anticancer agents: Design, synthesis and modeling studies. Molecules 2014, 19, 9655–9674. [Google Scholar] [CrossRef] [PubMed]
  54. Chioua, M.; González-Camuñas, A.; Catarozzo, M.T.; Alcaro, S.; Ortuso, F.; Yáñez, M.; Marco-Contelles, J. Synthesis, monoamine oxidase inhibition and computational analysis of diversely substituted N-propargylated-1,3,5-triazines. ChemistrySelect 2019, 4, 8334–8337. [Google Scholar] [CrossRef]
Figure 1. Structures of α-phenyl-N-tert-butylnitrone (PBN), W-AZN, TN-2 (red), homo-bis-nitrones (HBNs 4-6) (blue), and homo-tris-nitrones (HTNs 1-3) (pink).
Ijms 21 07949 g001
Scheme 1. Synthesis of HTNs 1-3.
Ijms 21 07949 sch001
Figure 2. Neuroprotective effect of HTNs 1-3 on SH-SY5Y human neuroblastoma metabolic activity after treatment with oligomycin A 10 μM/rotenone 30 μM (O/R). (A) Bars show % cell viability after treatment with O/R, with, or without, HBNs, PBN, and NAC, at the indicated concentrations. (B) Bars show % of the resulting neuroprotection at the same concentrations, considering as 100% neuroprotection the difference between the control (C24h) viability and the obtained in the presence of O/R. Values are the mean ± SEM of three experiments, each one performed in triplicate. The statistics in (A) compare differences with O/R (red dotted line) and the statistics in (B) compare differences with control (100% neuroprotection without nitrones) (C24h) (black dotted line) at * p < 0.05, ** p < 0.01, and *** p < 0.001 (one-way ANOVA, followed by Holm−Sidak analysis as a test post hoc). No statistic comparisons are shown for values higher than those for C.
Ijms 21 07949 g002
Figure 3. Neuroprotective effect of HTNs 1-3 on neuroblastoma cell viability after oxygen glucose deprivation (4 h) and ischemic reperfusion (24 h) (IR). Bars show % neuroprotection at indicated concentrations, considering 100% neuroprotection the difference in viability between Control (C24h) and IR alone. Values represent the mean ± SEM after three experiments, each one in triplicate. The statistics compare the effect of each HTN concentration with 100% neuroprotection, without IR (C 24h) at * p < 0.05, ** p < 0.01, and *** p < 0.001 (ANOVA one-way, followed by Holm−Sidak analysis as test post hoc).
Ijms 21 07949 g003
Figure 4. Effect of HTNs 1-3 on the lactate dehydrogenase release in SH-SY5Y cells after ischemia reperfusion. Bars show % LDH release after OGD (4 h) and IR (24 h), without treatment (IR 24 h) or treated with HTNs 1-3, PBN, and NAC, at the indicated concentrations. Values are the mean ± SEM of three experiments, each one performed in triplicate, and compared to the effect of I and IR on respective controls (red ***) or the effect of the different compounds after IR (24 h) with IR (24 h) alone (red dotted line) in the absence of these compounds (black ***). Data were statistically analyzed by one-way ANOVA, followed by Holm–Sidak as test post hoc. * p < 0.05, ** p < 0.01, and *** p < 0.001.
Ijms 21 07949 g004
Figure 5. Effect of HTNs 1-3 on caspase-3 activity in SH-SY5Y neuroblastoma cells after ischemia reperfusion. Bars show % LDH release after OGD (4 h) and IR (24 h), without treatment (IR alone) or treated with HTNs 1-3, PBN, and NAC, at the indicated concentrations. Values are the mean ± SEM of three experiments, each one performed in triplicate, and compared to the effect of I and IR on respective controls (red ***) or the effect of the different compounds after IR (24 h) with IR alone (red dotted line), in the absence of these compounds (black ***). Data were statistically analyzed by one-way ANOVA, followed by Holm–Sidak as test post hoc. * p < 0.05, ** p < 0.01, and *** p < 0.001. UAF = arbitrary fluorescent units.
Ijms 21 07949 g005
Figure 6. Effect of HTNs 1-3, PBN, and NAC on human neuroblastoma SH-SY5Y cell viability under basal conditions. Bars represent % of cell viability in the presence of the ligands at the indicated concentrations. Cell viability for the untreated cells (C4h) was assigned 100% (100 ± 5.52%). Values are the mean ± SEM of five experiments, each one in triplicate. No statistically significant differences were observed between the control (black dotted line) and the different nitrones tested at the concentrations indicated (one-way ANOVA test).
Ijms 21 07949 g006
Figure 7. Inhibitory effects of HTNs 1-3, and PBN on ROS (superoxide) production in SHSY5Y human neuroblastoma cell cultures exposed to oxygen glucose deprivation (4 h) and ischemic reperfusion (3 h). Bars shows % ROS formed after OGD and IR alone (IR 3 h) or after treatment with HTNs 1-3 and PBN, at the indicated concentration concentrations. Values are then mean ± SEM of three experiments, each one performed in triplicate. Values for ROS in IR were calculated as 1.98 ± 0.25 UAF/min/150,000 cells. The statistics compare the effect of IR against the corresponding control (red ***) or the effect of the different compounds respect to IR alone (red dotted line), (black ***) at * p < 0.05, ** p < 0.01, *** p < 0.001 (one-way ANOVA followed by Holm–Sidak analysis post hoc).
Ijms 21 07949 g007
Figure 8. Graphic diagram showing the most important conclusions of this work. HTNs 2 and 3 have a good antioxidant and neuroprotective activity against necrotic and apoptotic cell death, very similar to those of their homologous HBN5 and HBN6. However, they have a worse capacity than their counterparts to reverse the cellular metabolic alterations induced by oligomycin A/rotenone and by in vitro ischemia/reperfusion in human neuroblastoma SH-SY5Y cells. Therefore, although HTNs 2 and 3 overcome the antioxidant and neuroprotective properties of PBN, the addition of a third nitrone group does not improve, but rather worsens, the neuroprotective capacity observed in HBN5 and HBN6. In other words, “more is better, but much more is worse”.
Ijms 21 07949 g008
Table 1. Neuroprotective effect of HTNs 1-3, PBN, and NAC against neurotoxicity induced by oligomycin A/rotenone in human neuroblastoma SH-SY5Y cells.
Ijms 21 07949 i001
The estimation of EC50 (μM) and maximal activities (% neuroprotection) values were performed by a weighted nonlinear regression of minimum squares using logistic curves, as is described in the “Statistical Analysis” section of “Neuroprotection Assessment Assays”. Values are the mean ± S.E.M. Data analysis was carried out with SigmaPlot v.12., and ANOVA one-way to get the significant statistics of HTNs with respect to PBN. Differences are statistically significant when p ≤ 0.05. Differences are statistically significant when p ≤ 0.05. * p < 0.05, ** p < 0.01, and *** p < 0.001, ns = non-significant (ANOVA one-way, followed by Holm−Sidak analysis as test post hoc).
Table 2. Neuroprotective effect of HTNs 1-3, PBN, and NAC after oxygen glucose deprivation/ischemic reperfusion (IR) in human neuroblastoma SH-SY5Y cells.
Ijms 21 07949 i002
The estimation of EC50 (μM) and maximal activities (% neuroprotection) values were performed by a weighted nonlinear regression of minimum squares using logistic curves, as is described in the “Statistical Analysis” section of “Neuroprotection Assessment Assays”. Values are the mean ± S.E.M. Data analysis was carried out with SigmaPlot v.12., and ANOVA one-way to get the significant statistics of HTNs and HBNs with respect to PBN and HTN2. Differences are statistically significant when p ≤ 0.05. * p < 0.05, ** p < 0.01, and *** p < 0.001, ns = non-significant (ANOVA one-way, followed by Holm−Sidak analysis as test post hoc).
Table 3. Effect of HTNs 1-3, PBN, and NAC on the lactate dehydrogenase release after oxygen glucose deprivation/ischemic reperfusion in human neuroblastoma SH-SY5Y cells. EC50 and maximal activities.
Ijms 21 07949 i003
The estimation of IC50 (μM) and maximal inhibitory activities (%) values were performed by a weighted nonlinear regression of minimum squares using logistic curves, as is described in the “Statistical Analysis” section of “Neuroprotection Assessment Assays”. Values are the mean ± S.E.M. Data analysis was carried out with SigmaPlot v.12., and ANOVA one-way to get the significant statistics of HTNs with respect to PBN, or to HTN2. Differences are statistically significant when p < 0.05, ** p < 0.01, ** p < 0.001. ns = non-significant (ANOVA one-way, followed by Holm−Sidak analysis as test post hoc).
Table 4. Antioxidant effect of HTNs 1–3, PBN, and NAC after oxygen glucose deprivation/ischemia reperfusion in human neuroblastoma SH-SY5Y cells.
Ijms 21 07949 i004
The estimation of EC50 (μM) and maximal activities (% antioxidant effect) values were performed by a weighted nonlinear regression of minimum squares using logistic curves, as is described in the “Statistical Analysis” section of “Neuroprotection Assessment Assays”. Values are the mean ± S.E.M. EC50 and maximal activities were calculated from the data obtained from three experiments, each one in triplicate. The statistics compare differences with PBN or HTN2 at * p < 0.05, ** p < 0.01, and *** p < 0.001 and ns = non-significant (one-way ANOVA, followed by Holm–Sidak analysis as a test post hoc).
Table 5. Antioxidant activity of HTNs 1-3, PBN, HBNs 5, 6, Trolox, and NDGA.
Nitrones/
Standards
ClogP *ILPO (%)LOX Inhibition
(% or IC50 [μM]) (±SEM)
Scavenger
Activity for OH (%)
ABTS+.
(%)
HTN1−2.9446100 ± 1.1 μΜ59No
HTN20.775526 ± 0.2%81No
HTN32.739270 ± 2.6 μΜ8310
PBN3.021123 ± 0.1%No5
HBN5 [46]4.51556 ± 0.1%67No
HBN6 [46]4.963729 ± 0.3%81No
NDGA 0.45 μM
Trolox 88 8391
Nitrones were tested at 100 µM. Values are means of three or four different determinations. No—no activity under the experimental conditions. Means within each column differ significantly (p < 0.05). nd—not determined. * Biobyte BioByte Corporation, C-QSAR database, 201 W Fourth Str., Suite 204, Claremont CA 91711-4707, USA.
Publisher’s Note: MDPI stays neutral with regard to jurisdictional claims in published maps and institutional affiliations.

