Myosin and Other Energy-Transducing ATPases: Structural Dynamics Studied by Electron Paramagnetic Resonance

Abstract
1. Introduction
2. Site-Directed Spin-Labeling EPR Spectroscopy: Advantages and Limitations
3. Myosin ATPase
4. Regulation of Myosin ATPase by the Actin–Troponin–Tropomyosin Filament
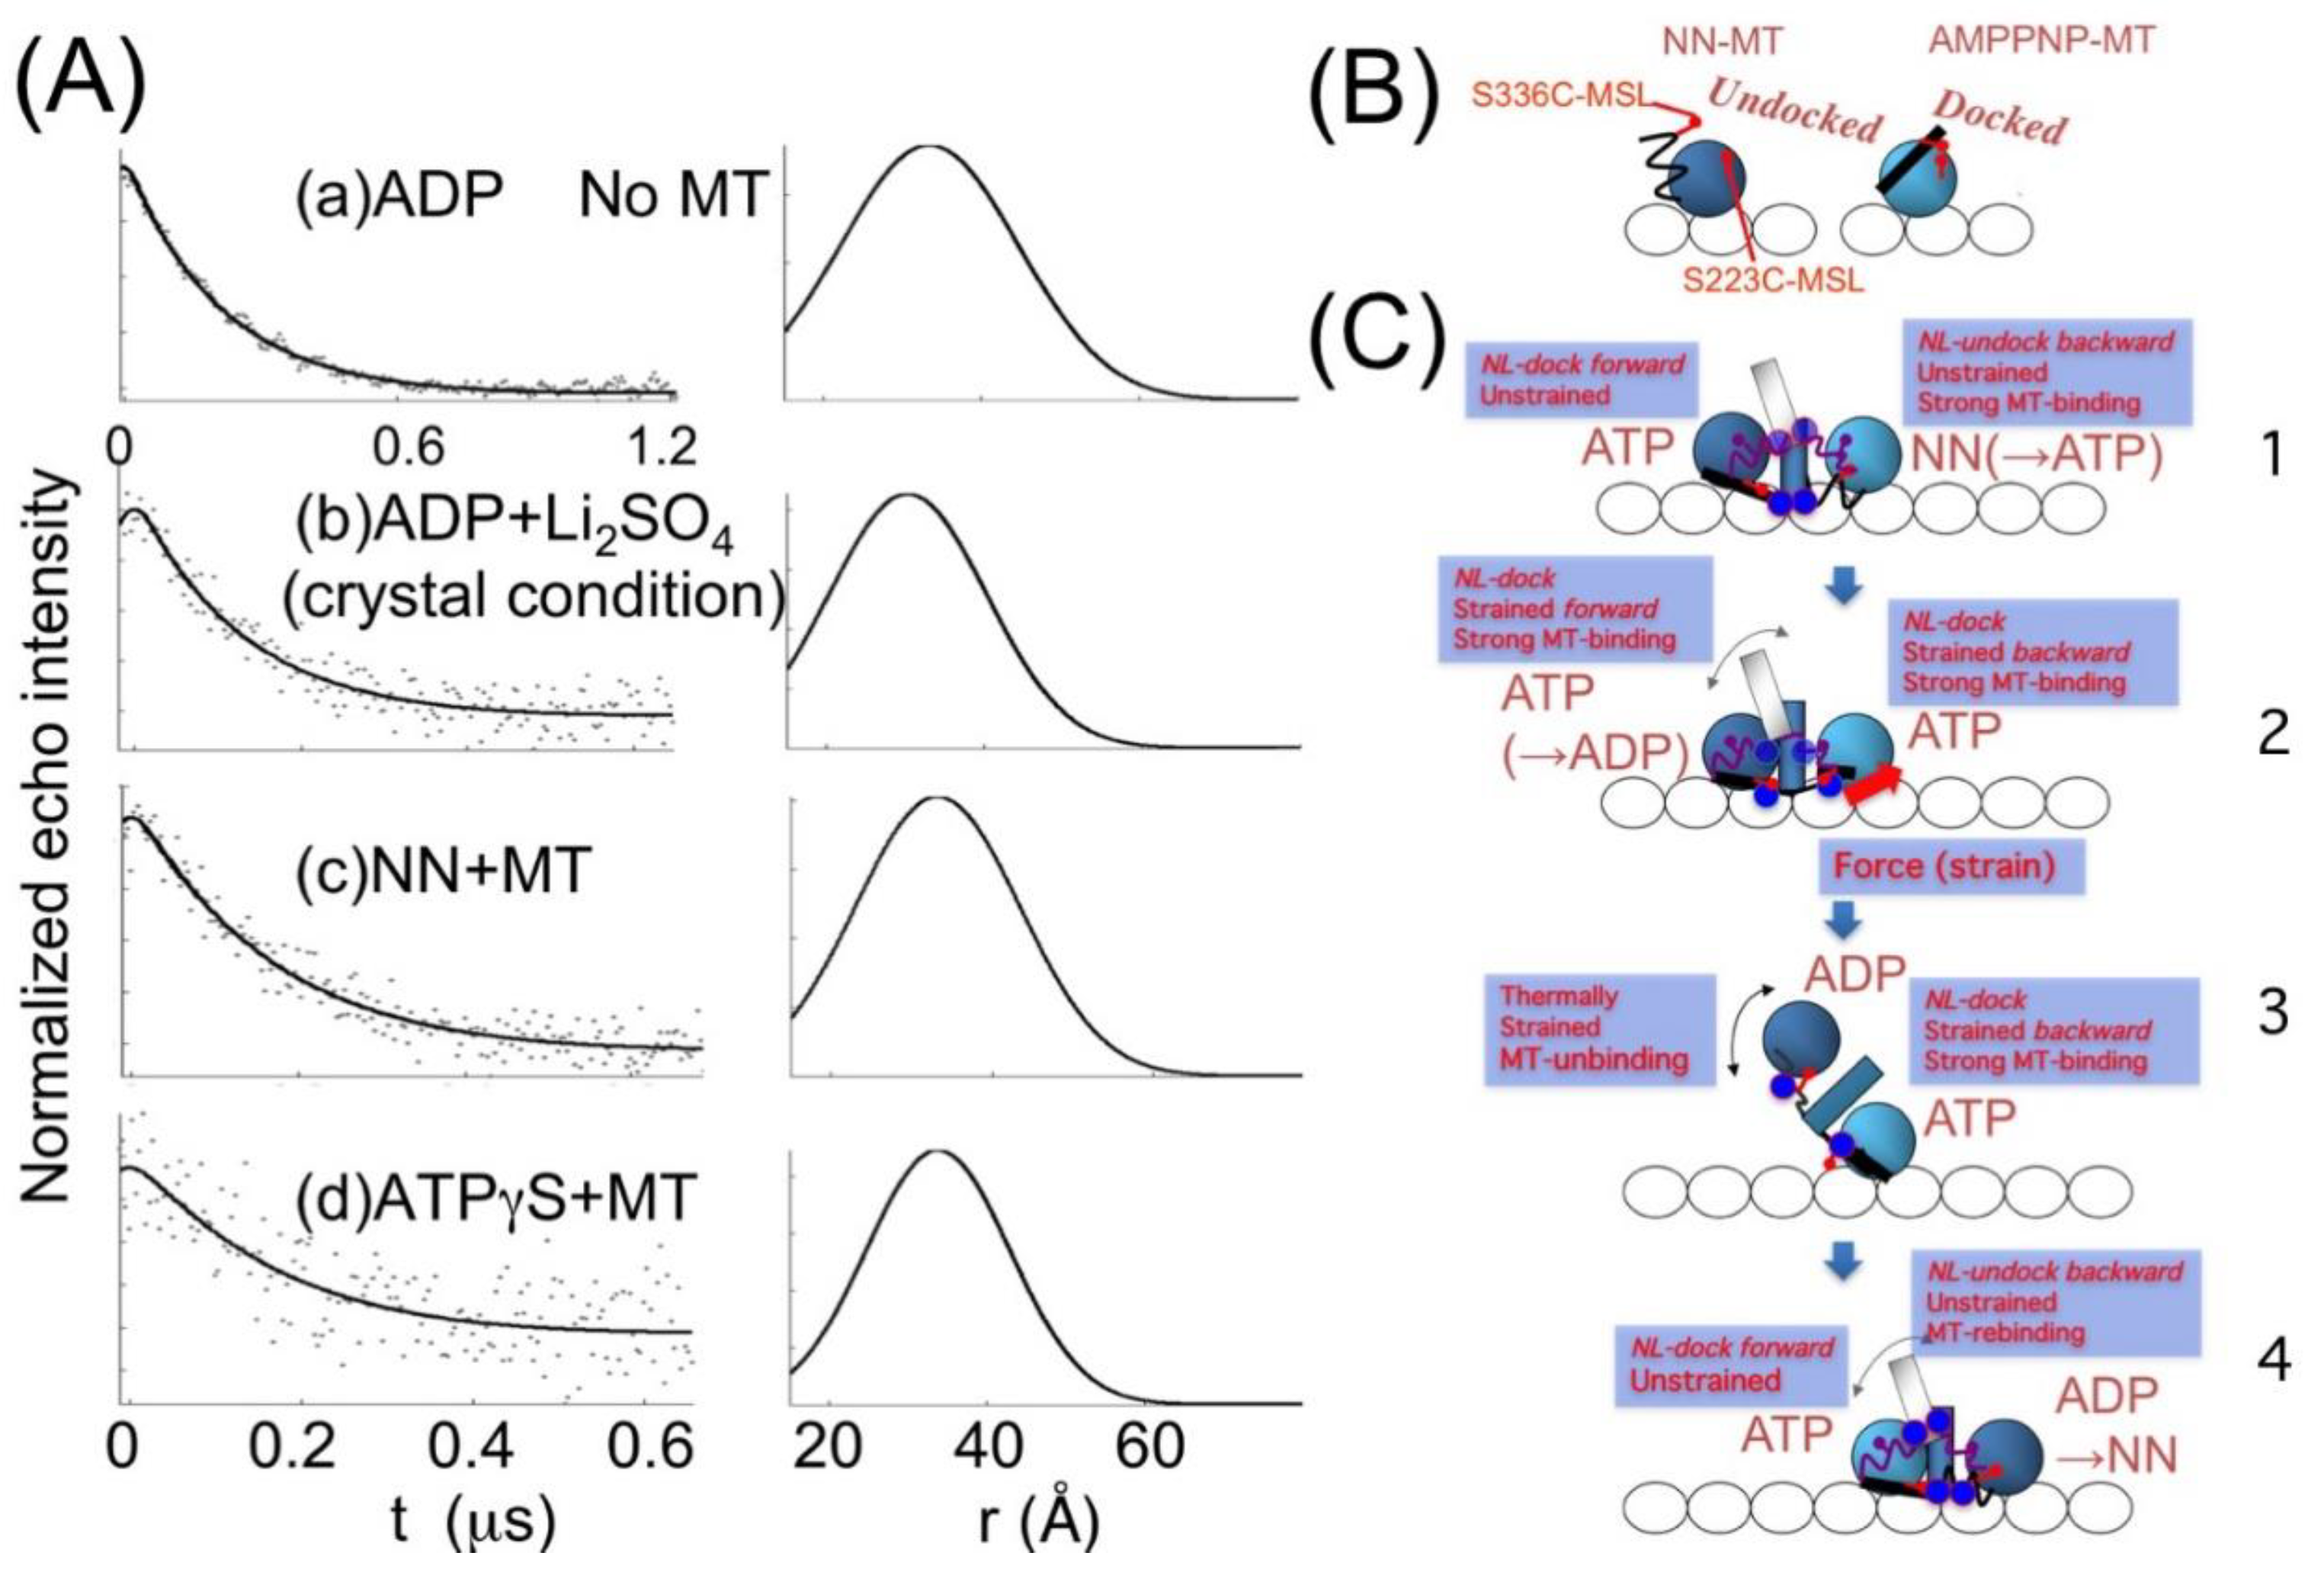
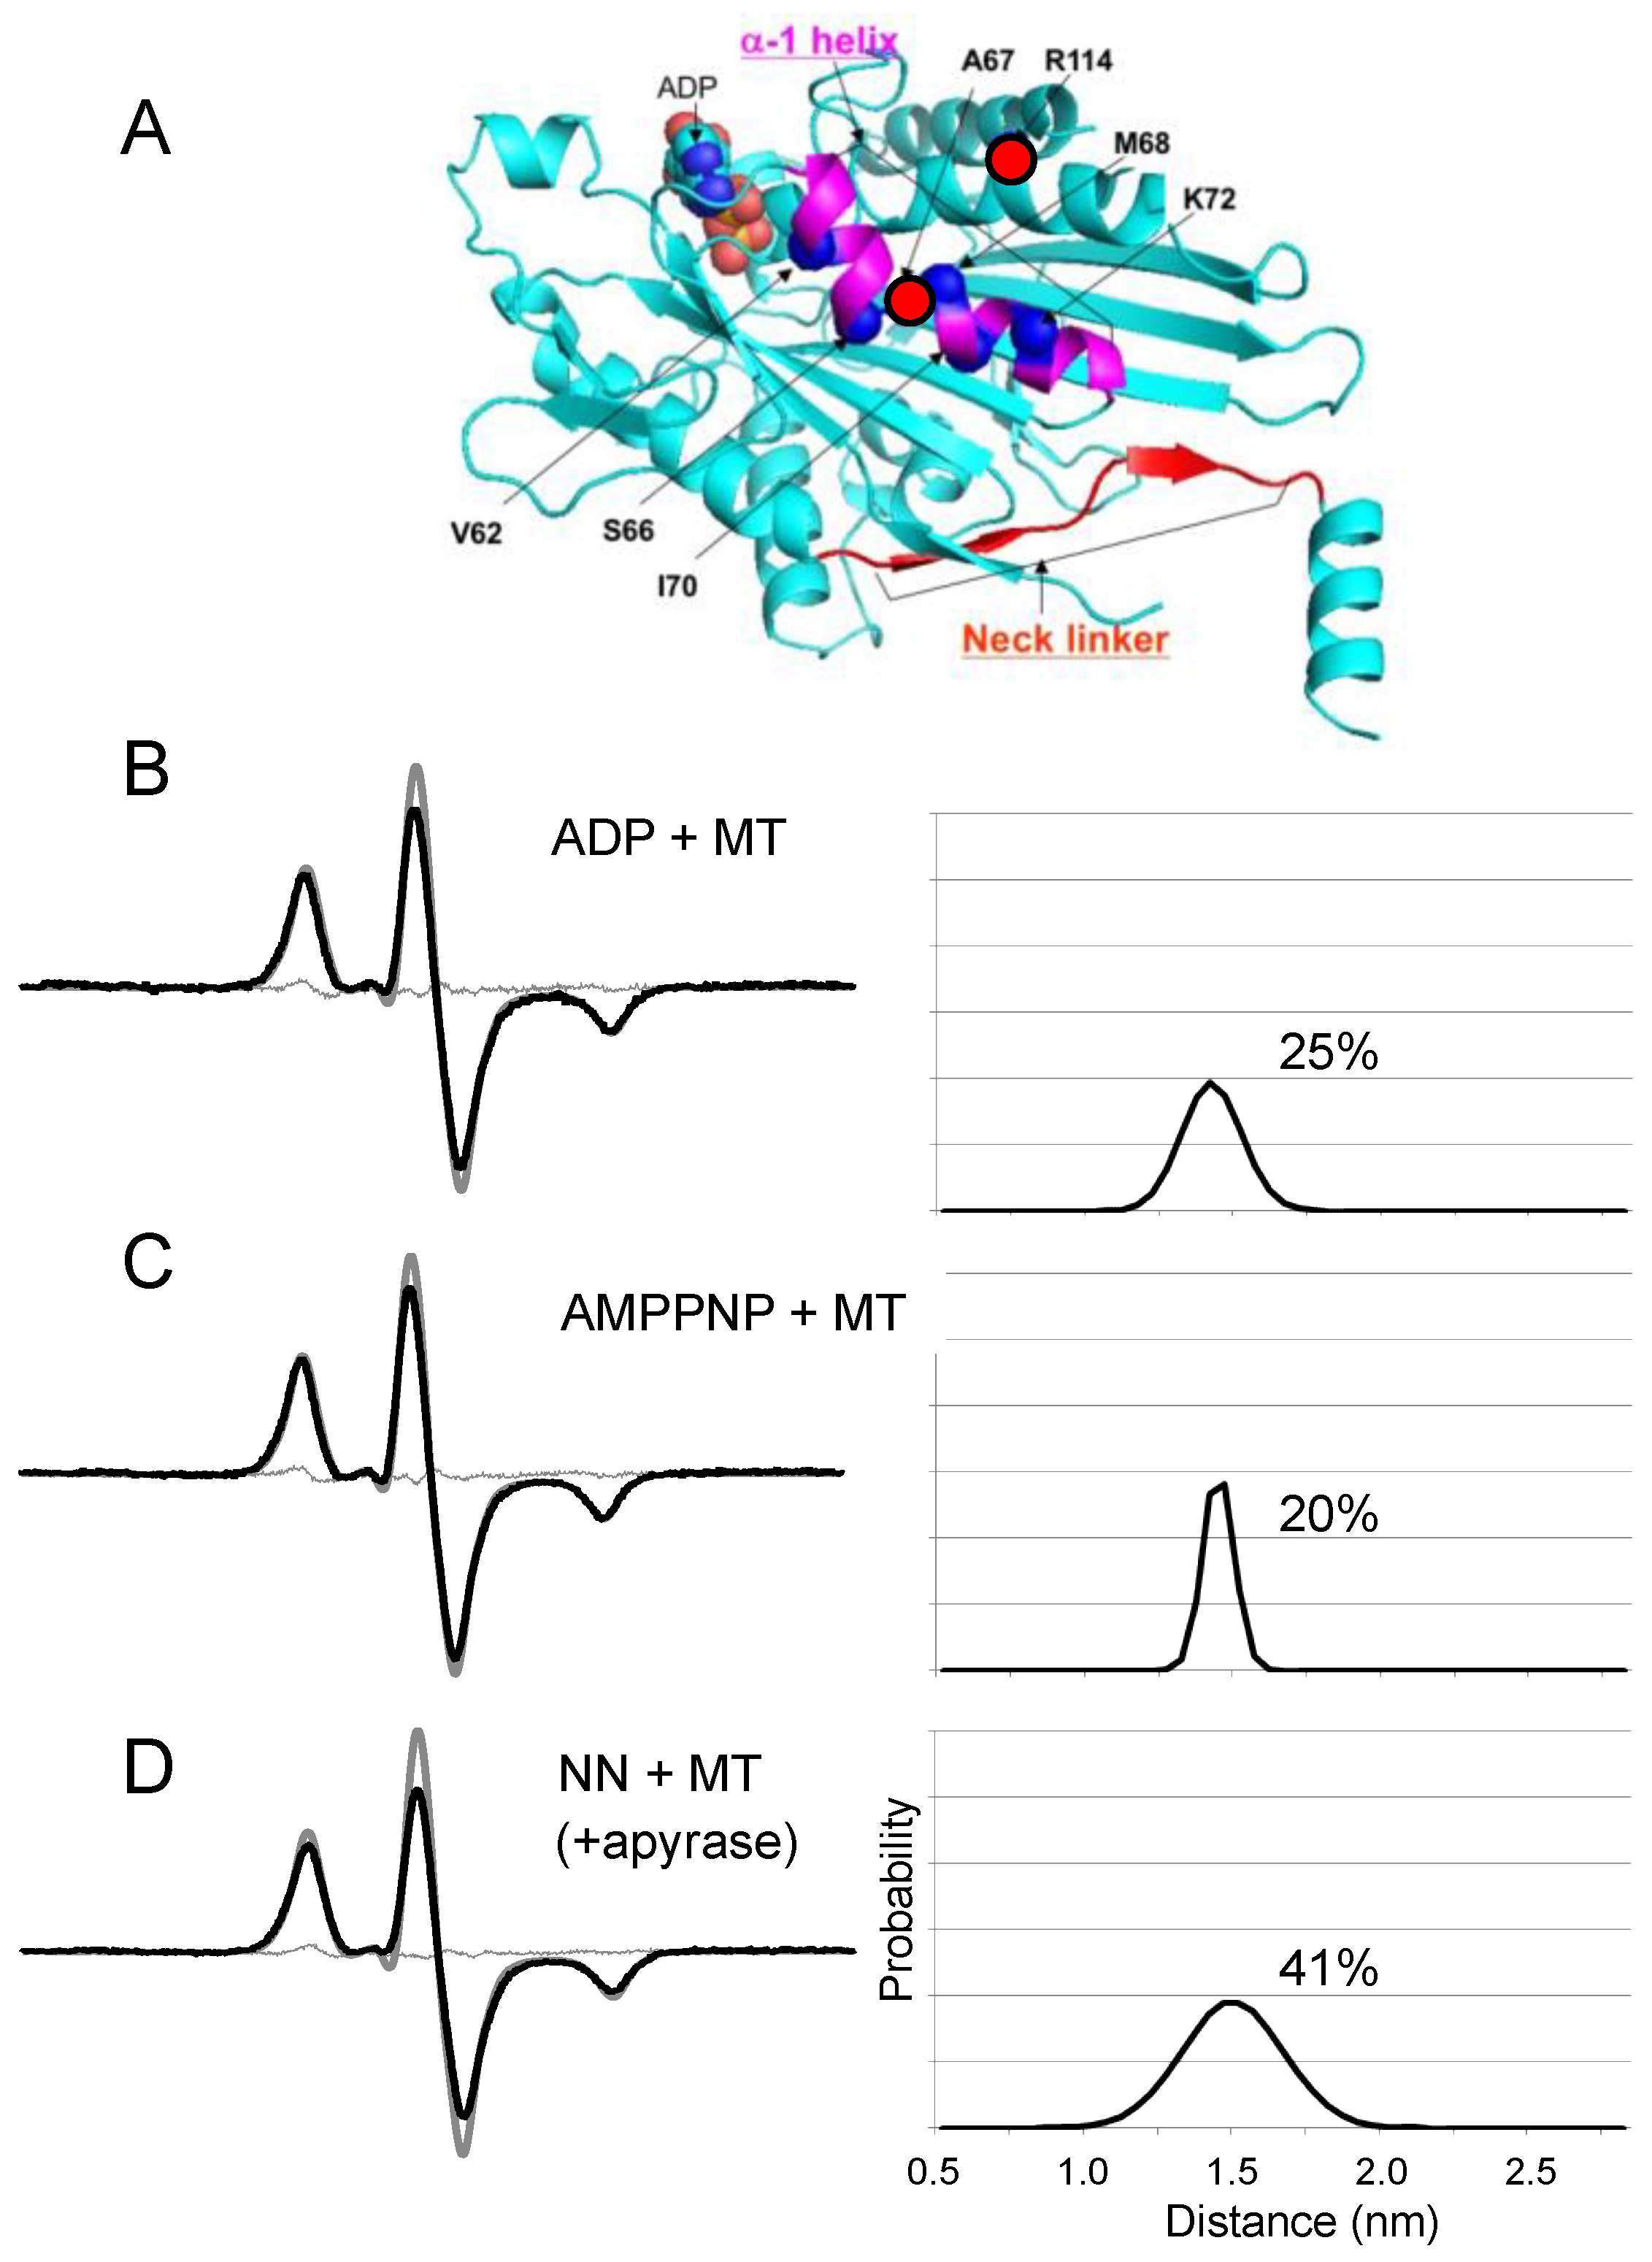
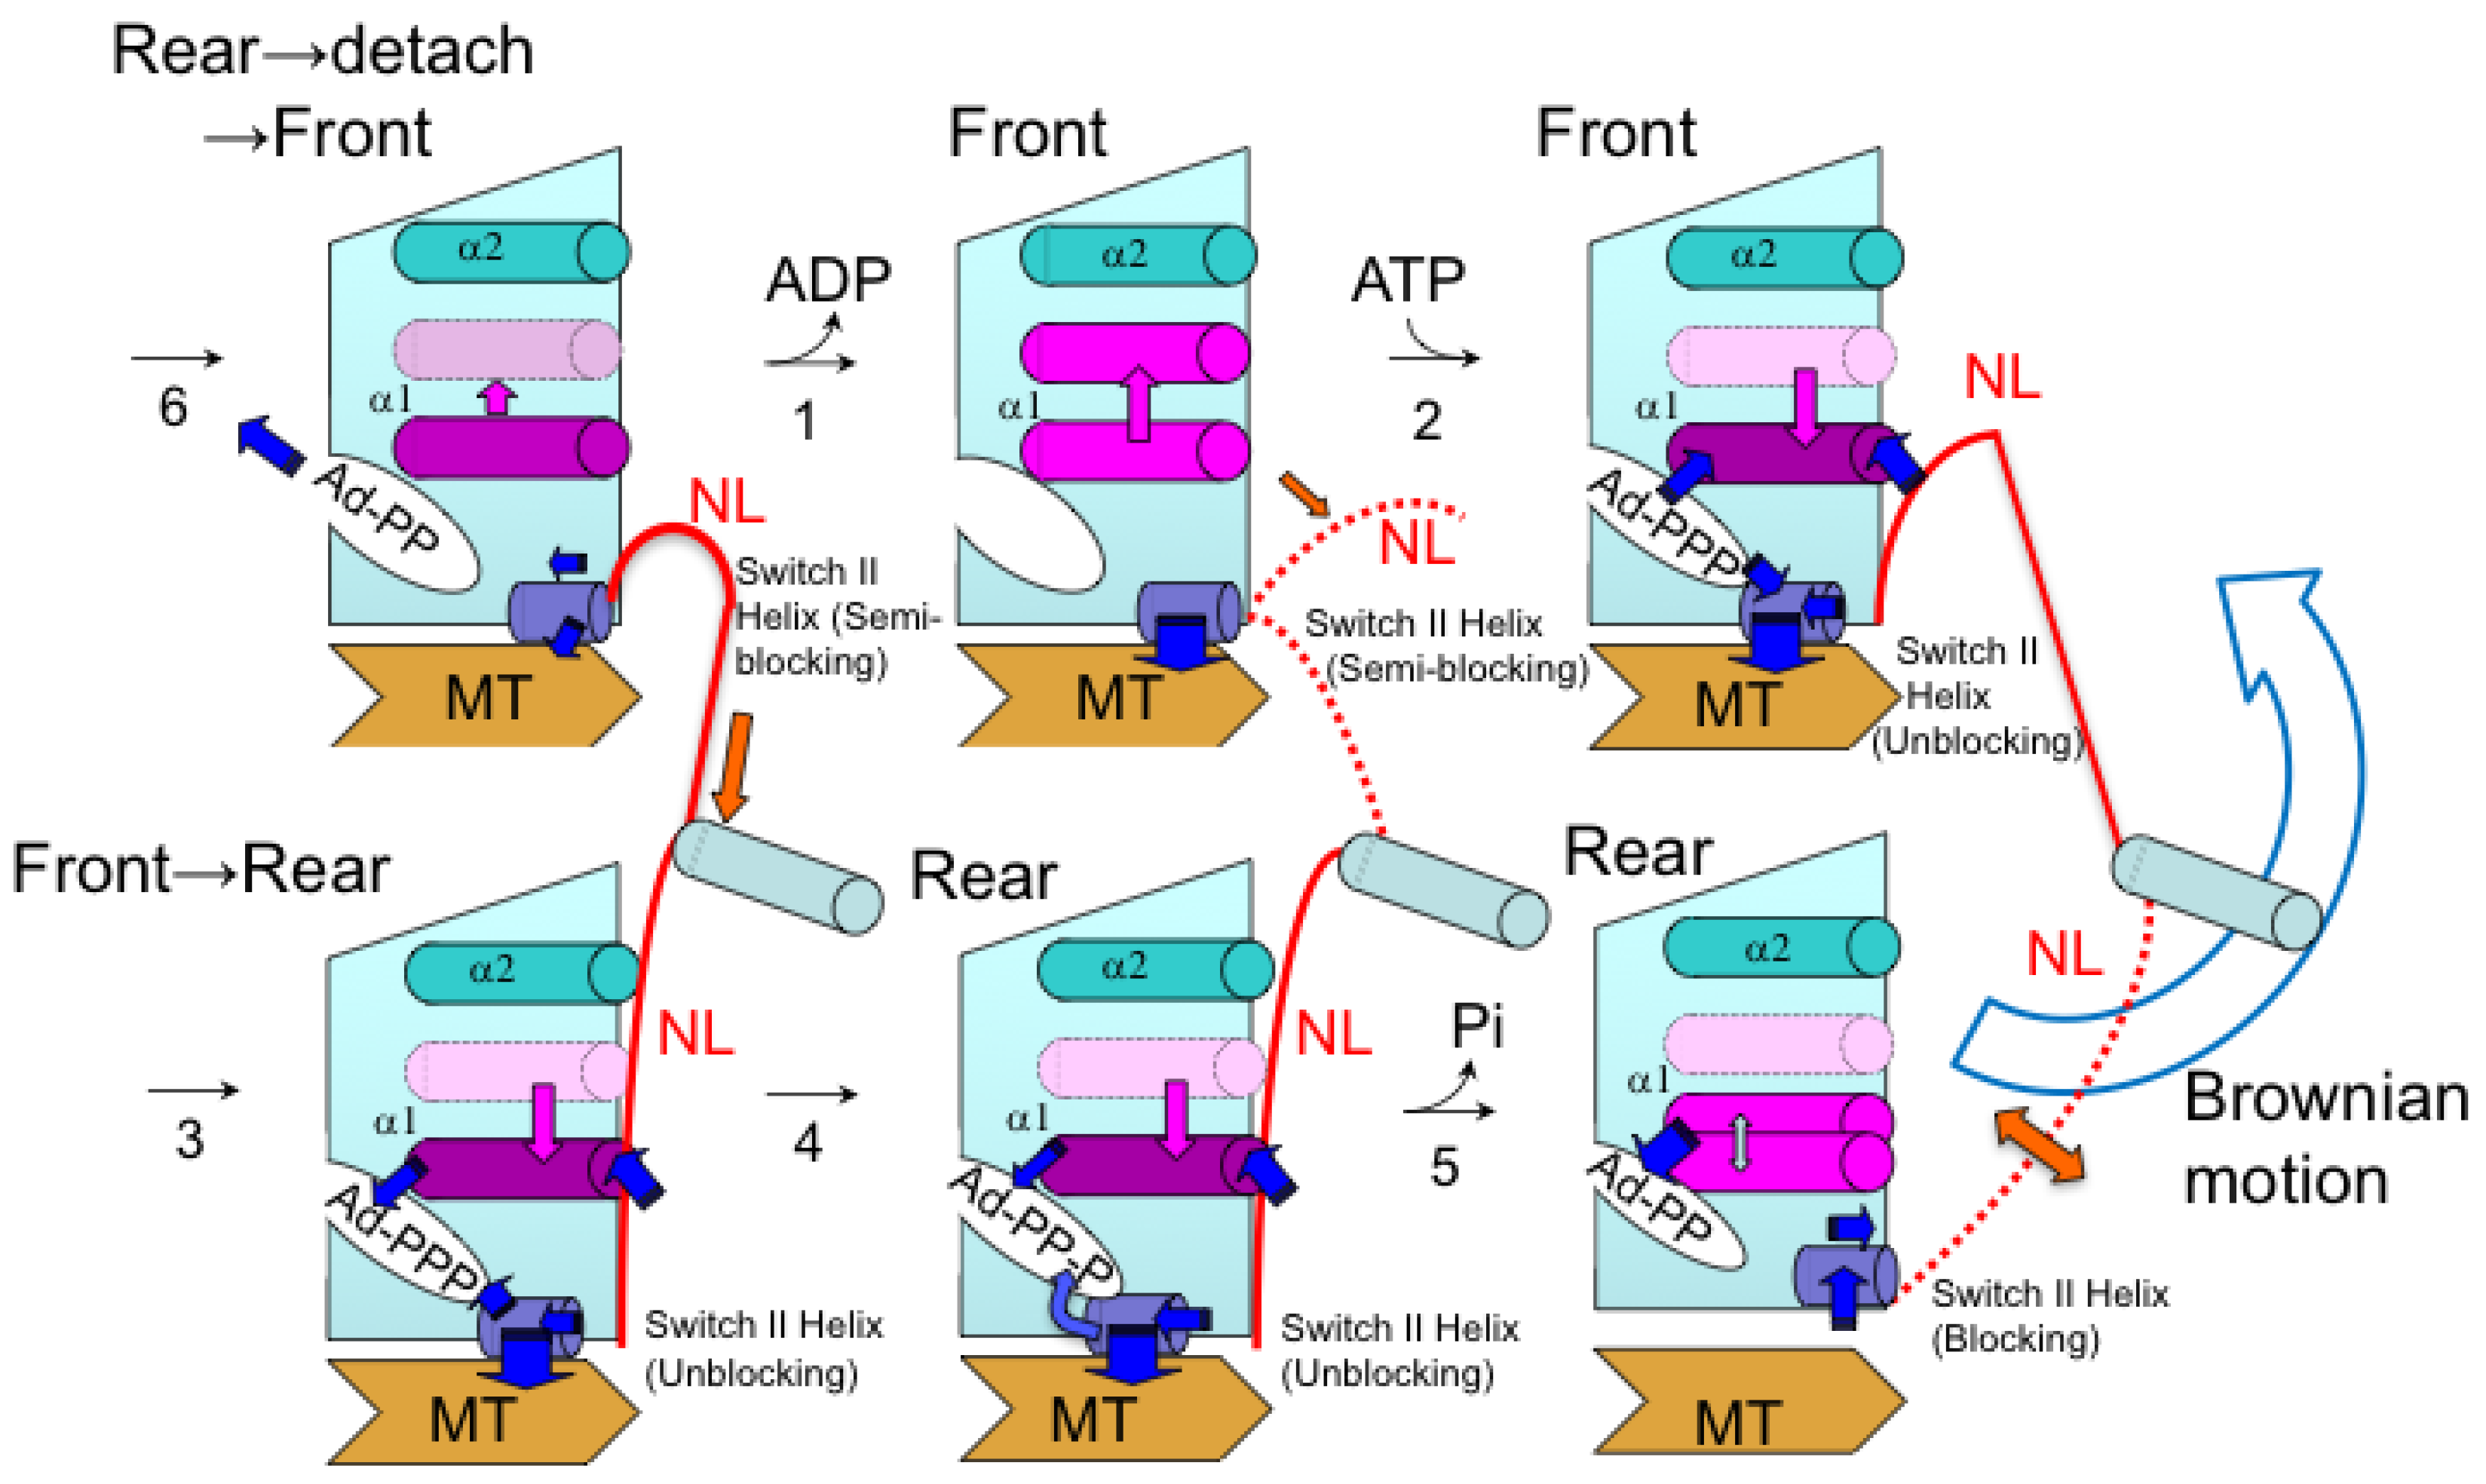
5. Kinesin ATPase
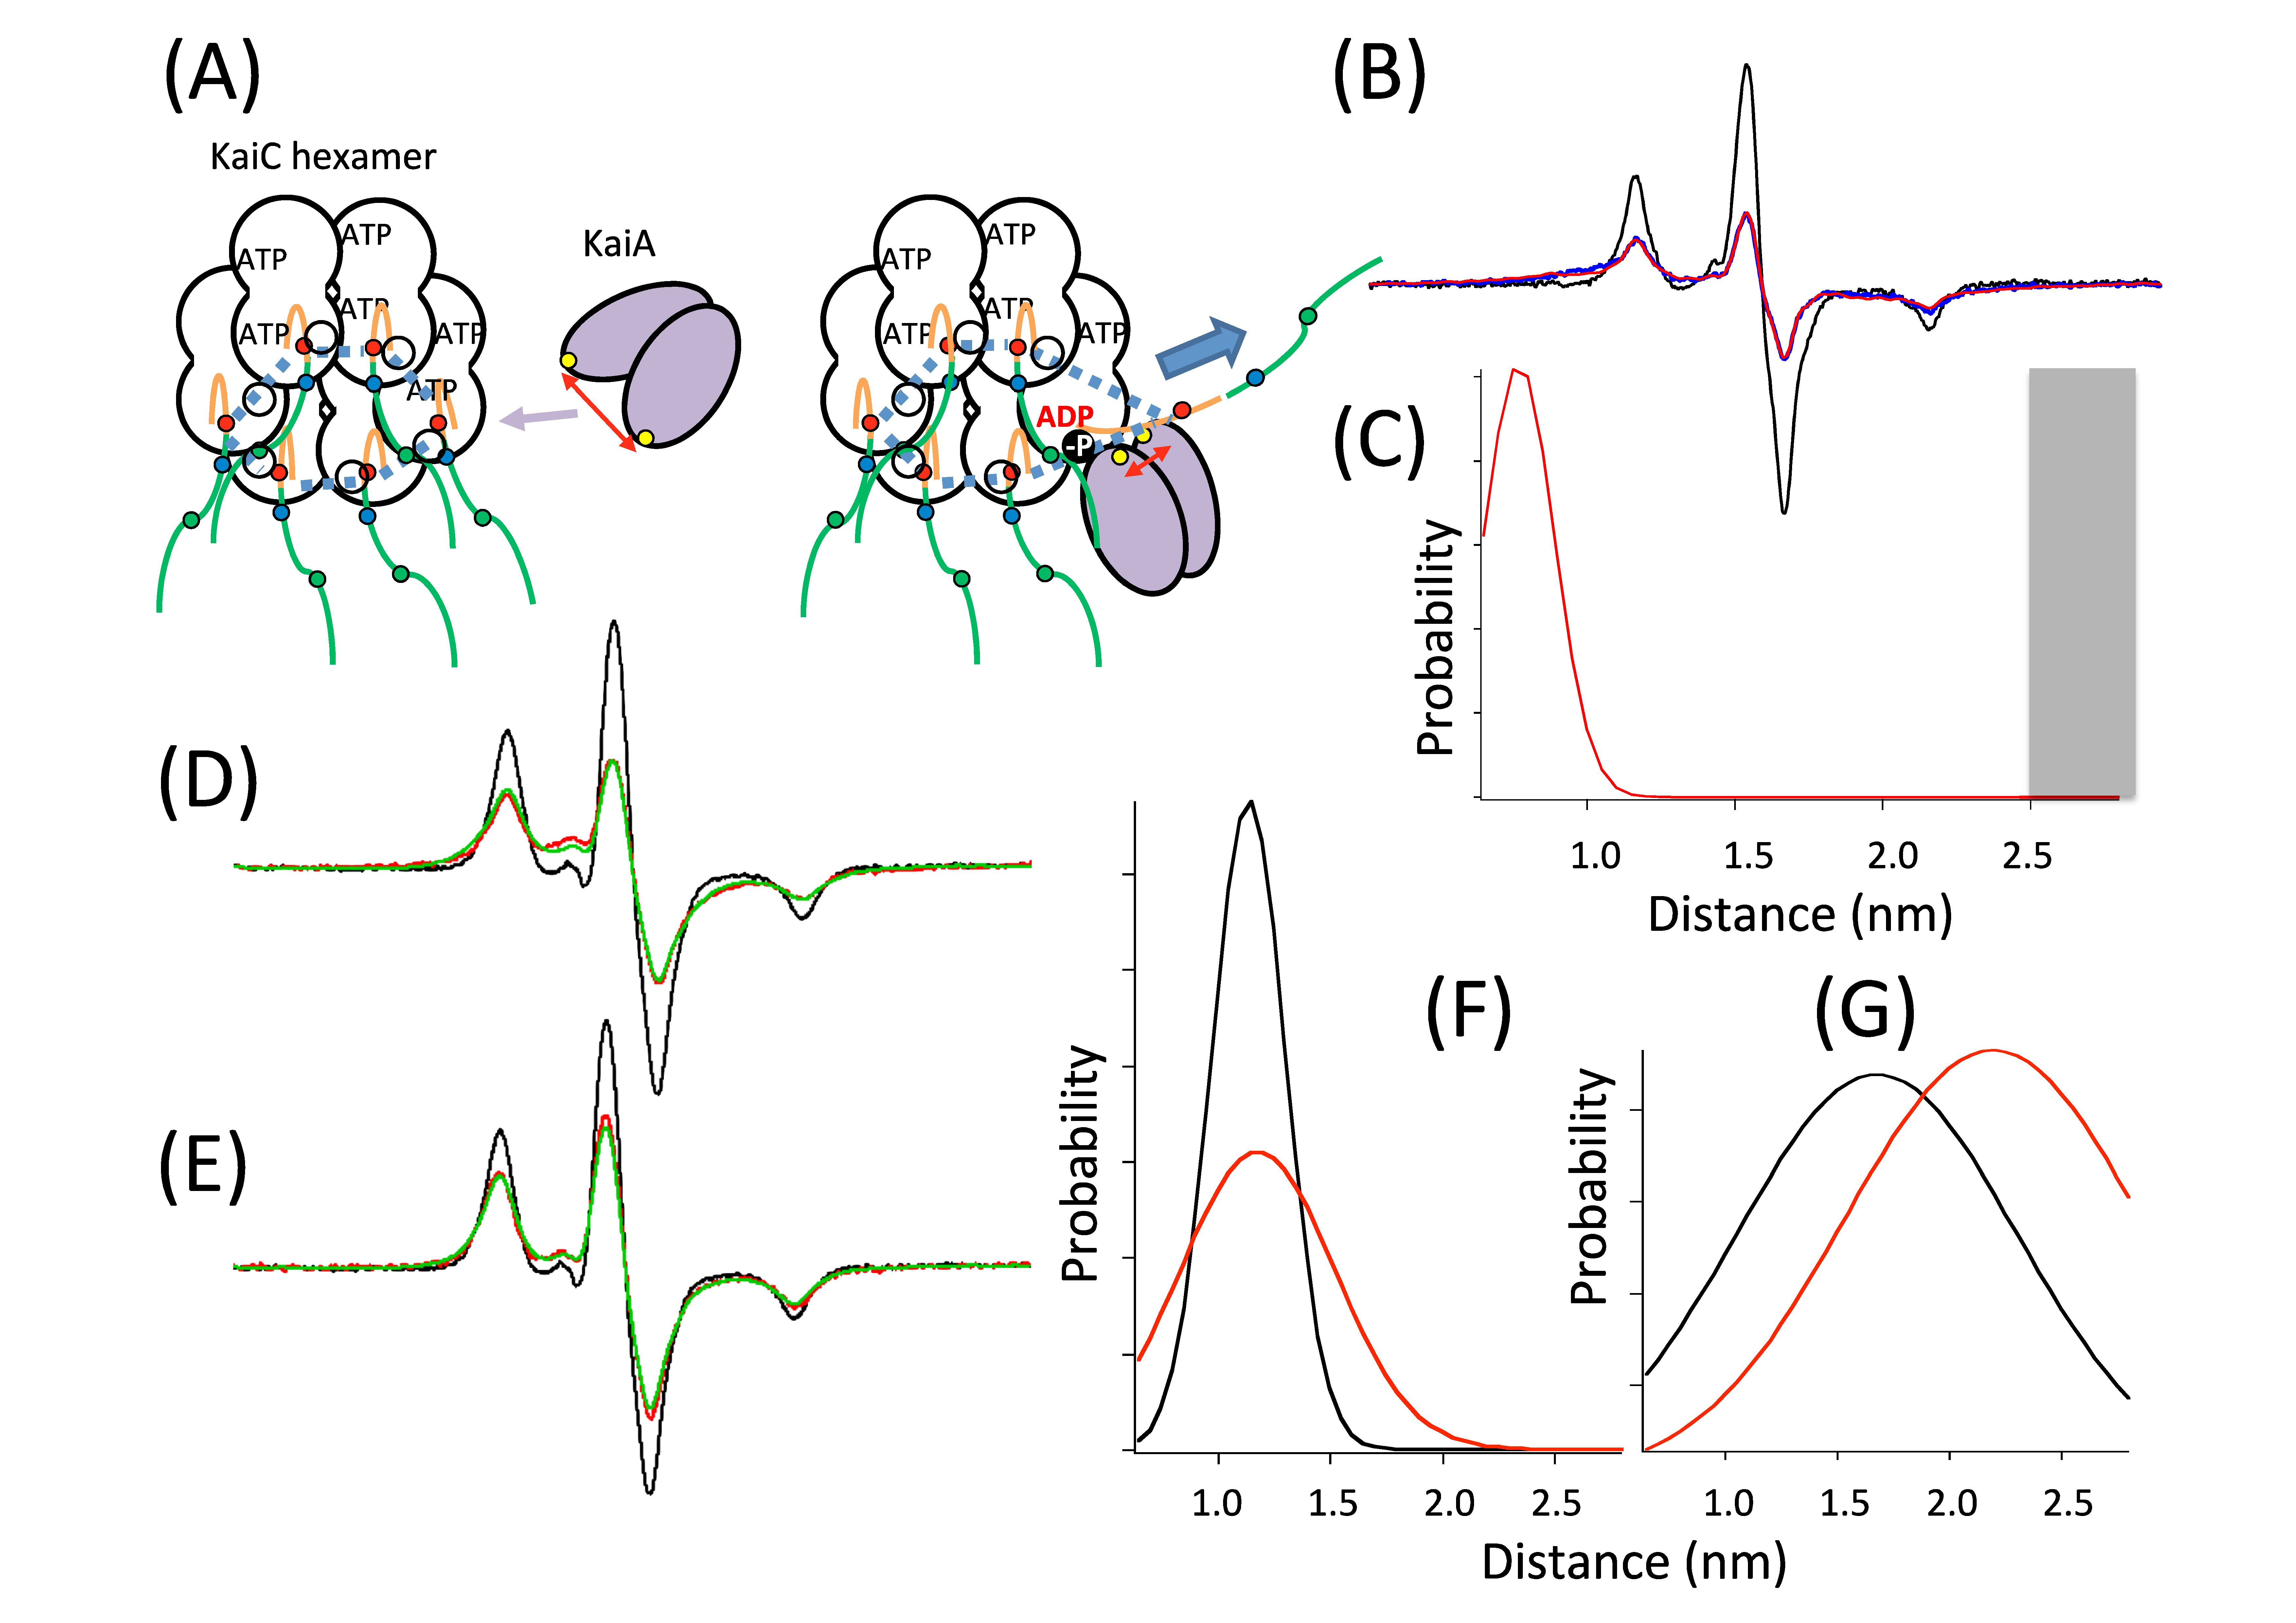
6. Clock ATPase
7. Ion Motive ATPase
8. Principle for Energy-Transducing Mechanisms
Funding
Acknowledgments
Conflicts of Interest
Abbreviations
| EPR | Electron paramagnetic resonance |
| Cys | Cysteine |
| RLC | Regulatory light chain |
| AM | Actin-myosin |
| FRET | Forster fluorescence resonance energy transfer |
| HMM | Heavy meromyosin |
| S1 | Subfragment-1 |
| NMR | Nuclear magnetic resonance |
| CW | Continuous wave |
| SDSL | Site directed spin-labeling |
| PELDOR | Pulsed electron double resonance |
| DEER | Double electron-electron resonance |
| DQC | Double quantum coherence |
| MSL | 4-maleimido-2,2,6,6-tetramethyl- 1-piperidinyloxy |
| IASL | N-(1-oxyl-2,2,6,6-tetramethyl-4-piperdinyl)iodoacetamide |
| MTSL | (1-oxyl-2,2,5,5-tetramethylpyrrolidin-3-yl)methylmethanethiosulfonate |
| PKA | Protein kinase A |
| PKC | Protein kinase C |
| IDP | Intrinsically disordered protein |
| Tn | Troponin |
| cTn | Cardiac troponin |
| Tm | Tropomyosin |
| K | Kinesin |
| MT | Microtubule |
| NL | Neck linker |
| NN | No nucleotide |
| ATPγS | Adenosine 5′-(γ-thio)triphosphate |
| AMPPNP | Adenosine 5′-(β,γ-imido)triphosphate |
| AMP-PCP | β,γ-Methyleneadenosine 5′-triphosphate |
| KaiAc | KaiA C-terminal domain |
| KaiC6mer | Hexameric KaiC |
References and Notes
- Fajer, P.G. Electron Spin Resonance Spectroscopy Labeling in Peptide and Protein Analysis. In Encyclopedia of Analytical Chemistry; Meyers, R.A., Ed.; John Wiley & Sons Ltd.: Chichester, NH, USA, 2000; pp. 5725–5761. [Google Scholar]
- Berliner, L.J.; Grunwald, J.; Hankovszky, H.O.; Hideg, K. A novel reversible thiol-specific spin label: Papain active site labeling and inhibition. Anal. Biochem. 1982, 119, 450–455. [Google Scholar] [CrossRef]
- Hubbell, W.L.; Altenbach, C.A. Investigation of structure and dynamics in membrane proteins using site-directed spin labeling. Curr. Opin. Struct. Biol. 1994, 4, 566–573. [Google Scholar] [CrossRef]
- Arata, T. The use of spin probes. In Methods in Muscle Physiology; Sugi, H., Ed.; Oxford University Press: Oxford, UK, 1998; pp. 223–239. [Google Scholar]
- Loll, B.; Kern, J.; Saenger, W.; Zouni, A.; Biesiadka, J. Towards complete cofactor arrangement in the 3.0 Å resolution structure of photosystem II. Nature 2005, 438, 1040–1044. [Google Scholar] [CrossRef] [PubMed]
- Guzenko, D.; Chernyatina, A.A.; Strelkov, S.V. Crystallographic studies of intermediate filament proteins. In Fibrous Proteins: Structures and Mechanisms; Parry, D.A.D., Squire, J.M., Eds.; Springer International Publishing: Cham, Switzerland, 2017; pp. 151–170. [Google Scholar]
- Nissen, P.; Hansen, J.; Ban, N.; Moore, P.B.; Steitz, T.A. The structural basis of ribosome activity in peptide bond synthesis. Science 2000, 289, 920–930. [Google Scholar] [CrossRef]
- Hara, H.; Kawamori, A.; Astashkin, A.V.; Ono, T. The distances from tyrosine D to redox-active components on the donor side of photosystem II determined by pulsed electron-electron double resonance. Biochim. Biophys. Acta 1996, 1276, 140–146. [Google Scholar] [CrossRef][Green Version]
- Jeschke, G. Distance measurements in the nanometer range by pulse EPR. Chem. Phys. Chem. 2002, 3, 927–932. [Google Scholar] [CrossRef]
- Borbat, P.P.; McHaourab, H.S.; Freed, J.H. Protein structure determination using long-distance constraints from double quantum coherence ESR: Study of T4 lysozyme. J. Am. Chem. Soc. 2002, 124, 5304–5314. [Google Scholar] [CrossRef]
- Fiori, W.R.; Millhauser, G.L. Exploring the Peptide 310-helix Reversible Alpha-helix Equilibrium with Double Label Electron Spin Resonance. Biopolymers 1995, 37, 243–250. [Google Scholar] [CrossRef]
- Chatani, S.; Nakamura, M.; Akahane, H.; Kohyama, N.; Taki, M.; Arata, T.; Yamamoto, Y. Synthesis of C2-chiral bifunctionalised spin labels and their application to troponin C. Chem. Commun. (Camb.) 2005, 14, 1880–1882. [Google Scholar] [CrossRef]
- Rayes, R.F.; Kálai, T.; Hideg, K.; Geeves, M.A.; Fajer, P.G. Dynamics of Tropomyosin in Muscle Fibers as Monitored by Saturation Transfer EPR of Bi-Functional Probe. PLoS ONE 2011, 6, e21277. [Google Scholar] [CrossRef]
- Cunningham, T.F.; Putterman, M.R.; Desai, A.; Horne, W.S.; Saxena, S. The double-histidine Cu2⁺-binding motif: A highly rigid, site-specific spin probe for electron spin resonance distance measurements. Angew. Chem. Int. Ed. Engl. 2015, 54, 6330–6334. [Google Scholar] [CrossRef] [PubMed]
- Inoue, A.; Takenaka, H.; Arata, T.; Tonomura, Y. Functional implications of the two-headed structure of myosin. Adv. Biophys. 1979, 13, 1–194. [Google Scholar] [PubMed]
- Aguirre, R.; Lin, S.H.; Gonsoulin, F.; Wang, C.K.; Cheung, H.C. Characterization of the ethenoadenosine diphosphate binding site of myosin subfragment Energetics of the equilibrium between two states of nucleotide.S1 and vanadate-induced global conformation changes detected by energy transfer. Biochemistry 1989, 28, 799–807. [Google Scholar] [CrossRef] [PubMed]
- Highsmith, S.; Eden, D. Ligand-induced myosin subfragment 1 global conformational change. Biochemistry 1990, 29, 4087–4093. [Google Scholar] [CrossRef]
- Wakabayashi, K.; Tokunaga, M.; Kohno, I.; Sugimoto, Y.; Hamanaka, T.; Takezawa, Y.; Wakabayashi, T.; Amemiya, Y. Small-angle synchrotron x-ray scattering reveals distinct shape changes of the myosin head during hydrolysis of ATP. Science 1992, 258, 443–447. [Google Scholar] [CrossRef]
- Houdusse, A.; Szent-Gyorgyi, A.G.; Cohen, C. Three conformational states of scallop myosin S1. Proc. Natl. Acad. Sci. USA 2000, 97, 11238–11243. [Google Scholar] [CrossRef]
- Arata, T.; Okumura, T.; Sugimoto, Y.; Takezawa, Y.; Wakabayashi, K. A new structure of myosin heads during ATP hydrolysis. In preparation.
- Okumura, T.; Arata, T.; Sugimoto, Y.; Takezawa, Y.; Kiyotoshi, M.; Wakabayashi, K. Photon Factory Activity Report 2001; High Energy Accelerator Research Organization: Tsukuba, Japan, 2001; Volume 19, Abstract 203. [Google Scholar]
- Kimori, Y.; Baba, N.; Katayama, E. Novel configuration of a myosin II transient intermediate analogue revealed by quick-freeze deep-etch replica electron microscopy. Biochem. J. 2013, 450, 23–35. [Google Scholar] [CrossRef][Green Version]
- Yanagida, T. Angles of nucleotides bound to cross-bridges in glycerinated muscle fiber at various concentrations of epsilon-ATP, epsilon-ADP and epsilon-AMPPNP detected by polarized fluorescence. J. Mol. Biol. 1981, 146, 539–560. [Google Scholar] [CrossRef]
- Cooke, R.; Crowder, M.S.; Thomas, D.D. Orientation of spin labels attached to cross-bridges in contracting muscle fibres. Nature 1982, 300, 776–778. [Google Scholar] [CrossRef]
- Fajer, P.G.; Fajer, E.A.; Schoenberg, M.; Thomas, D.D. Orientational disorder and motion of weakly attached cross-bridges. Biophys. J. 1991, 60, 42–49. [Google Scholar] [CrossRef]
- Arata, T. Structure of the actin-myosin complex produced by crosslinking in the presence of ATP. J. Mol. Biol. 1986, 191, 107–116. [Google Scholar] [CrossRef]
- Arata, T. Interaction of nonpolymerizable actins with myosin. J. Biochem. 1991, 109, 335–340. [Google Scholar] [PubMed]
- Arata, T. A myosin head can interact with two chemically modified G-actin monomers at ATP-modulated multiple sites. Biochemistry 1996, 35, 16061–16068. [Google Scholar] [CrossRef] [PubMed]
- Arata, T. Two G-Actin-Binding Sites of Myosin Head in the Absence and Presence of ATP. Biophys. J. 1995, 68, 325s. [Google Scholar]
- Arata, T. Electron microscopic observation of monomeric actin attached to a myosin head. J. Struct. Biol. 1998, 12, 8–16. [Google Scholar] [CrossRef]
- Arata, T.; Kimura, S.; Sugimoto, Y.; Takezawa, Y.; Iwasaki, N.; Wakabayashi, K. Structure of the monomeric actin-myosin head complex as revealed by X-ray solution scattering. Adv. Exp. Med. Biol. 1998, 453, 73–77. [Google Scholar]
- Arata, T. Orientation of spin-labeled light chain 2 of myosin heads in muscle fibers. In Proceedings of the XIII International Conferences of Magnetic Resonance in Biological Systems (ICMRBS), Madison, WI, USA, 14–19 August 1988. [Google Scholar]
- Arata, T. Orientation of spin-labeled light chain 2 of myosin heads in muscle fibers. J. Mol. Biol. 1990, 214, 471–478. [Google Scholar] [CrossRef]
- Irving, M.; Kendrick-Jones, J.; Shrimpton, C.; Sleep, J. The orientation of rhodamine probes attached to myosin light chain-2 (LC-2) in relaxing and rigor conditions in single fibers isolated from rabbit psoas muscle. J. Physiol. 1989, 418, 57. [Google Scholar]
- Irving, M.; Allen, T.S.C.; Sabido-David, C.; Craik, J.S.; Brandmeier, B.; Kendrick-Jones, J.; Corrie, J.E.; Trentham, D.R.; Goldman, Y.E. Tilting of the light-chain region of myosin during step length changes and active force generation in skeletal muscle. Nature 1995, 375, 688–691. [Google Scholar] [CrossRef]
- Quinlan, M.E.; Forkey, J.N.; Goldman, Y.E. Orientation of the myosin light chain region by single molecule total internal reflection fluorescence polarization microscopy. Biophys. J. 2005, 89, 1132–1142. [Google Scholar] [CrossRef]
- Arata, T. Orientation of spin-labeled light chain 2 of myosin heads in force-generating muscle fibres. Jpn. J. Physiol. 1995, 45 (Suppl. 2), S96. [Google Scholar]
- Arata, T.; Nakamura, M.; Akahane, H.; Aihara, T.; Ueki, S.; Sugata, K.; Kusuhara, H.; Morimoto, M.; Yamamoto, Y. Orientation and motion of myosin light chain and troponin in reconstituted muscle fibers as detected by ESR with a new bifunctional spin label. Adv. Exp. Med. Biol. 2003, 538, 279–284. [Google Scholar] [PubMed]
- Arata, T.; Nakamura, M.; Ueki, S.; Sugata, K.; Aihara, T.; Ueda, K.; Yasuda, S.; Narumi, R.; Kusuhara, H.; Yamamoto, Y. Dynamic structures of motor proteins myosin and kinesin, and switch protein troponin as detected by SDSL-ESR. J. Electron Microsc 2005, 54 (Suppl. 1), i47–i51. [Google Scholar] [CrossRef] [PubMed]
- Hambly, B.; Franks, K.; Cooke, R. Orientation of spin-labeled light chain-2 exchanged onto myosin cross-bridges in glycerinated muscle fibers. Biophys. J. 1991, 59, 127–138. [Google Scholar] [CrossRef]
- Hambly, B.; Franks, K.; Cooke, R. Paramagnetic probes attached to a light chain on the myosin head are highly disordered in active muscle fibers. Biophys. J. 1992, 63, 1306–1313. [Google Scholar] [CrossRef][Green Version]
- Baker, J.E.; Brust-Mascher, I.; Ramachandran, S.; LaConte, L.E.W.; Thomas, D.D. A large and distinct rotation of the myosin light chain domain occurs upon muscle contraction. Proc. Natl. Acad. Sci. USA 1998, 95, 2944–2949. [Google Scholar] [CrossRef]
- Baumann, B.A.J.; Liang, H.; Sale, K.; Hambly, B.D.; Fajer, P.G. Myosin Regulatory Domain Orientation in Skeletal Muscle Fibers: Application of Novel Electron Paramagnetic Resonance Spectral Decomposition and Molecular Modeling Methods. Biophys. J. 2004, 86, 3030–3041. [Google Scholar] [CrossRef]
- Mello, R.N.; Thomas, D.D. Three distinct actin-attached structural states of myosin in muscle fibers. Biophys. J. 2012, 102, 1088–1096. [Google Scholar] [CrossRef]
- Savich, Y.; Binder, B.P.; Thompson, A.R.; Thomas, D.D. Myosin lever arm orientation in muscle determined with high angular resolution using bifunctional spin labels. J. Gen. Physiol. 2019, 151, 1007–1016. [Google Scholar] [CrossRef]
- Houdusse, A.; Sweeney, H.L. How Myosin Generates Force on Actin Filaments. Trends Biochem. Sci. 2016, 41, 989–997. [Google Scholar] [CrossRef]
- Arata, T.; Shimizu, H. Spin-label study of actin-myosin-nucleotide interactions in contracting glycerinated muscle fibers. J. Mol. Biol. 1981, 151, 411–437. [Google Scholar] [CrossRef]
- Ostap, E.M.; Barnett, V.A.; Thomas, D.D. Resolution of three structural states of spin-labeled myosin in contracting muscle. Biophys. J. 1995, 69, 177–188. [Google Scholar] [CrossRef]
- Stone, D.B. Interaction of actin with spin-labeled heavy meromyosin in the presence of nucleotides. Biochemistry 1973, 12, 3672–3679. [Google Scholar] [CrossRef] [PubMed]
- Kirino, Y.; Nishimura, Y.; Shimizu, H. (University of Tokyo, Hongo, Bunkyo-ku, Tokyo 113, Japan). Personal Communication, 1980.
- Nagano, H.; Yanagida, T. Predominant attached state of myosin cross-bridges during contraction and relaxation at low ionic strength. J. Mol. Biol. 1984, 177, 769–785. [Google Scholar] [CrossRef]
- Muretta, J.M.; Rohde, J.A.; Johnsrud, D.O.; Cornea, S.; Thomas, D.D. Direct real-time detection of the structural and biochemical events in the myosin power stroke. Proc. Natl. Acad. Sci. USA 2015, 112, 14272–14277. [Google Scholar] [CrossRef]
- Huxley, A.F. Muscle structure and theories of contraction. Prog. Biophys. Biophys. Chem. 1957, 7, 255–318. [Google Scholar] [CrossRef]
- Arata, T.; Mukohata, Y.; Tonomura, Y. Structure and function of the two heads of the myosin molecule. VI. ATP hydrolysis, shortening, and tension development of myofibrils. J. Biochem. 1977, 82, 801–812. [Google Scholar] [CrossRef]
- Yanagida, T.; Arata, T.; Oosawa, F. Sliding distance of actin filament induced by a myosin crossbridge during one ATP hydrolysis cycle. Nature 1985, 316, 366–369. [Google Scholar] [CrossRef]
- Fujita, K.; Ohmachi, M.; Ikezaki, K.; Yanagida, T.; Iwaki, M. Direct visualization of human myosin II force generation using DNA origami-based thick filaments. Commun. Biol. 2019, 2, 437. [Google Scholar] [CrossRef]
- Gergely, J. Molecular switches in troponin. Adv. Exp. Med. Biol. 1998, 453, 169–176. [Google Scholar]
- Ebashi, S.; Endo, M. Calcium ion and muscle contraction. Prog. Biophys. Mol. Biol. 1968, 18, 123–183. [Google Scholar] [CrossRef]
- Takeda, S.; Yamashita, A.; Maeda, K.; Maéda, Y. Structure of the core domain of human cardiac troponin in the Ca2+-saturated form. Nature 2003, 24, 35–41. [Google Scholar] [CrossRef] [PubMed]
- Vinogradova, M.V.; Stone, D.B.; Malanina, G.G.; Karatzaferi, C.; Cooke, R.; Mendelson, R.A.; Fletterick, R.J. Ca2+-regulated structural changes in troponin. Proc. Natl. Acad. Sci. USA 2005, 102, 5038–5043. [Google Scholar] [CrossRef]
- Li, M.X.; Wang, X.; Sykes, B.D. Structural based insights into the role of troponin in cardiac muscle pathophysiology. J. Muscle Res. Cell Motil. 2004, 25, 559–579. [Google Scholar] [CrossRef] [PubMed]
- Jayasundar, J.J.; Xing, J.; Robinson, J.M.; Cheung, H.C.; Dong, W.J. Molecular dynamics simulations of the cardiac troponin complex performed with FRET distances as restraints. PLoS ONE 2014, 18, e87135. [Google Scholar] [CrossRef] [PubMed]
- Ferguson, R.E.; Sun, Y.B.; Mercier, P.; Brack, A.S.; Sykes, B.D.; Corrie, J.E.; Trentham, D.R.; Irving, M. In situ orientations of protein domains: Troponin C in skeletal muscle fibers. Mol. Cell 2003, 11, 865–874. [Google Scholar] [CrossRef]
- King, W.A.; Stone, D.B.; Timmins, P.A.; Narayanan, T.; von Brasch, A.A.; Mendelson, R.A.; Curmi, P.M. Solution structure of the chicken skeletal muscle troponin complex via small-angle neutron and X-ray scattering. J. Mol. Biol. 2005, 345, 797–815. [Google Scholar] [CrossRef]
- Howarth, J.W.; Meller, J.; Solaro, R.J.; Trewhella, J.; Rosevear, P.R. Phosphorylation-dependent conformational transition of the cardiac specific N-extension of troponin I in cardiac troponin. J. Mol. Biol. 2007, 373, 706–722. [Google Scholar] [CrossRef]
- Matsuo, T.; Takeda, S.; Oda, T.; Fujiwara, S. Structures of the troponin core domain containing the cardiomyopathy-causing mutants studied by small-angle X-ray scattering. Biophys. Physicobiol. 2015, 12, 145–158. [Google Scholar] [CrossRef]
- Matsuo, T.; Tominaga, T.; Kono, F.; Shibata, K.; Fujiwara, S. Modulation of the picosecond dynamics of troponin by the cardiomyopathy-causing mutation K247R of troponin T observed by quasielastic neutron scattering. Biochim. Biophys. Acta Proteins Proteom. 2017, 1865, 1781–1789. [Google Scholar] [CrossRef]
- Aihara, T.; Nakamura, M.; Ueki, S.; Hara, H.; Miki, M.; Arata, T. Switch action of troponin on muscle thin filament as revealed by spin labeling and pulsed EPR. J. Biol. Chem. 2010, 285, 10671–10677. [Google Scholar] [CrossRef] [PubMed]
- Aihara, T.; Ueki, S.; Nakamura, M.; Arata, T. Calcium-dependent movement of troponin I between troponin C and actin as revealed by spin-labeling EPR. Biochem. Biophys. Res. Commun. 2006, 340, 462–468. [Google Scholar] [CrossRef] [PubMed]
- Ueki, S.; Nakamura, M.; Komori, T.; Arata, T. Site-directed spin labeling electron paramagnetic resonance study of the calcium-induced structural transition in the N-domain of human cardiac troponin C complexed with troponin I. Biochemistry 2005, 44, 411–416. [Google Scholar] [CrossRef] [PubMed]
- Nakamura, M.; Ueki, S.; Hara, H.; Arata, T. Calcium structural transition of human cardiac troponin C in reconstituted muscle fibres as studied by site-directed spin labelling. J. Mol. Biol. 2005, 348, 127–137. [Google Scholar] [CrossRef]
- Abe, J.; Ueki, S.; Yamauchi, S.; Arata, T.; Ohba, Y. Double Quantum Coherence EPR Reveals the Structure-Function Relationships of the Cardiac Troponin C–Troponin I Complex Regulated by Ca2+ Ions and a Phosphomimetic. Appl. Magn. Reson. 2018, 49, 893–910. [Google Scholar] [CrossRef]
- Potluri, P.R.; Chamoun, J.; Cooke, J.A.; Badr, M.; Guse, J.A.; Rayes, R.; Cordina, N.M.; McCamey, D.; Fajer, P.G.; Brown, L.J. The concerted movement of the switch region of Troponin I in cardiac muscle thin filaments as tracked by conventional and pulsed (DEER) EPR. J. Struct. Biol. 2017, 200, 376–387. [Google Scholar] [CrossRef]
- Risi, C.; Eisner, J.; Belknap, B.; Heeley, D.H.; White, H.D.; Schröder, G.F.; Vitol, C.D.; Galkin, E. Ca2+-induced movement of tropomyosin on native cardiac thin filaments revealed by cryoelectron microscopy. Proc. Natl. Acad. Sci. USA 2017, 114, 6782–6787. [Google Scholar] [CrossRef]
- Abbott, M.B.; Dong, W.J.; Dvoretsky, A.; DaGue, B.; Caprioli, R.M.; Cheung, H.C.; Rosevear, P.R. Modulation of cardiac troponin C-cardiac troponin I regulatory interactions by the amino-terminus of cardiac troponin I. Biochemistry 2001, 40, 5992–6001. [Google Scholar] [CrossRef]
- Finley, N.; Abbott, M.B.; Abusamhadneh, E.; Gaponenko, V.; Dong, W.; Gasmi-Seabrook, G.; Howarth, J.W.; Rance, M.; Solaro, R.J.; Cheung, H.C.; et al. NMR analysis of cardiac troponin C-troponin I complexes: Effects of phosphorylation. FEBS Lett. 1999, 453, 107–112. [Google Scholar] [CrossRef]
- Abbott, M.B.; Gaponenko, V.; Abusamhadneh, E.; Finley, N.; Li, G.; Dvoretsky, A.; Rance, M.; Solaro, R.J.; Rosevear, P.R. Regulatory domain conformational exchange and linker region flexibility in cardiac troponin C bound to cardiac troponin I. J. Biol. Chem. 2000, 275, 20610–20617. [Google Scholar] [CrossRef]
- Ward, D.G.; Cornes, M.P.; Trayer, I.P. Structural Consequences of Cardiac Troponin I Phosphorylation. J. Biol. Chem. 2002, 277, 41795–41807. [Google Scholar] [CrossRef] [PubMed]
- Barbato, J.C.; Huang, Q.Q.; Hossain, M.M.; Bond, M.; Jin, J.P. Proteolytic N-terminal truncation of cardiac troponin I enhances ventricular diastolic function. J. Biol. Chem. 2005, 280, 6602–6609. [Google Scholar] [CrossRef] [PubMed]
- Biesiadecki, B.J.; Tachampa, K.; Yuan, C.; Jin, J.P.; de Tombe, P.P.; Solaro, R.J. Removal of the cardiac troponin I N-terminal extension improves cardiac function in aged mice. J. Biol. Chem. 2010, 285, 19688–19698. [Google Scholar] [CrossRef] [PubMed]
- Gunther, L.K.; Feng, H.-Z.; Wei, H.; Raupp, J.; Jin, J.-P.; Sakamoto, T. Effect of N-terminal extension of cardiac troponin I on the Ca2+ regulation of ATP-binding and ADP dissociation of myosin II in native cardiac myofibrils. Biochemistry 2016, 55, 1887–1897. [Google Scholar] [CrossRef] [PubMed]
- Solaro, R.J.; Rosevear, P.; Kobayashi, T. The unique functions of cardiac troponin I in the control of cardiac muscle contraction and relaxation. Biochem. Biophys. Res. Commun. 2008, 369, 82–87. [Google Scholar] [CrossRef]
- Ward, D.G.; Brewer, S.M.; Gallon, C.E.; Gao, Y.; Levine, B.A.; Trayer, I.P. NMR and mutagenesis studies on the phosphorylation region of human cardiac troponin I. Biochemistry 2004, 43, 5772–5781. [Google Scholar] [CrossRef]
- Hwang, P.M.; Cai, F.; Pineda-Sanabria, S.E.; Corson, D.C.; Sykes, B.D. The cardiac-specific N-terminal region of troponin I positions the regulatory domain of troponin C. Proc. Natl. Acad. Sci. USA 2014, 111, 14412–14417. [Google Scholar] [CrossRef]
- Dong, W.-J.; Chandra, M.; Xing, J.; She, M.; Solaro, R.J.; Cheung, H.C. Phosphorylation-induced distance change in a cardiac muscle troponin I mutant. Biochemistry 1997, 36, 6754–6761. [Google Scholar] [CrossRef]
- Chandra, M.; Dong, W.-J.; Pan, B.-S.; Cheung, H.C.; Solaro, R.J. Effects of Protein kinase A phosphorylation on signaling between cardiac troponin I and the N-terminal domain of cardiac troponin C. Biochemistry 1997, 36, 13305–13311. [Google Scholar] [CrossRef]
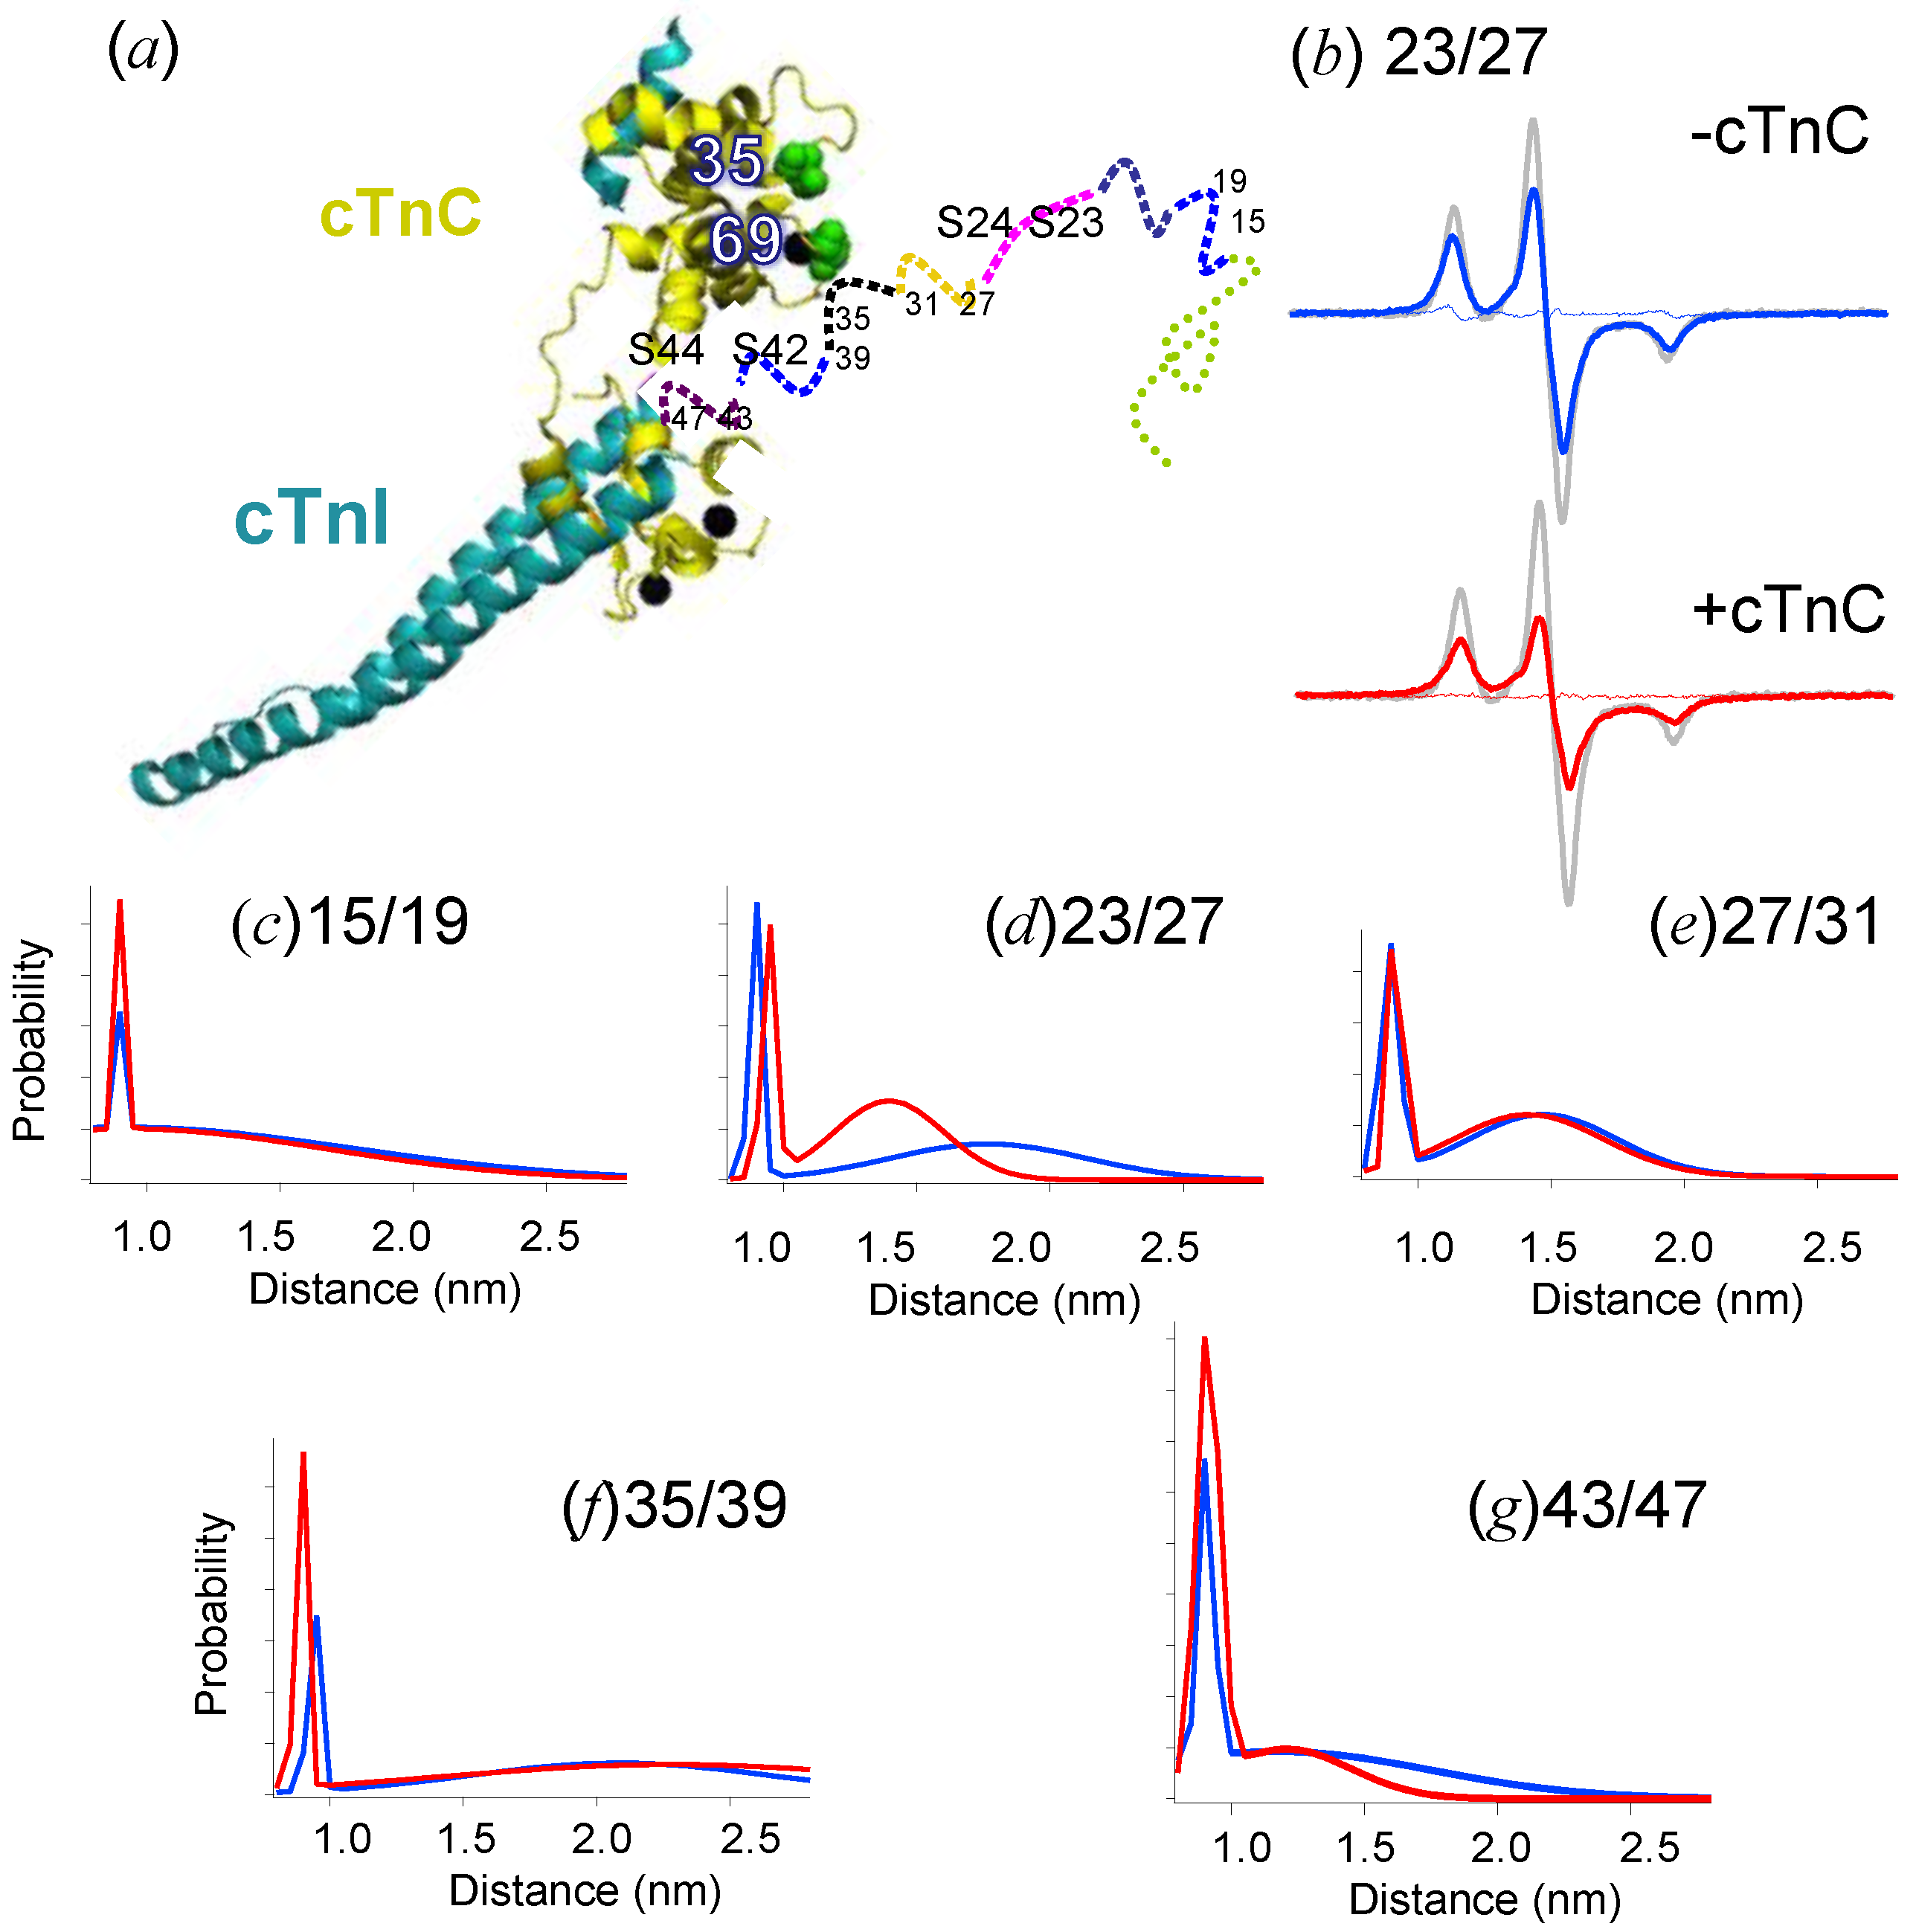
- Zhao, C.; Somiya, T.; Takai, S.; Ueki, S.; Arata, T. Structural Dynamics of the N-Extension of Cardiac Troponin I Complexed with Troponin C by Site-Directed Spin Labeling Electron Paramagnetic Resonance. Sci. Rep. 2019, 9, 15259. [Google Scholar] [CrossRef]
- Layland, J.; Solaro, R.J.; Shah, A.M. Regulation of cardiac contractile function by troponin I phosphorylation. Cardiovasc. Res. 2005, 66, 12–21. [Google Scholar] [CrossRef]
- Okawa, Y.; Ueki, S.; Inoue, A.; Arata, T. Structural dynamics of cardiac troponin C complexed with troponin I regulated by phosphorylation, as studied by spin-labeling dipolar EPR spectroscopy. In preparation.
- Somiya, T.; Ueki, S.; Arata, T. Structural Dynamics of Cardiac Troponin C-I Complex Regulated by Phosphorylation, as Studied by Spin-Labeling Dipolar EPR Spectroscopy, In preparation.
- Sumandea, M.P.; Pyle, W.G.; Kobayashi, T.; de Tombe, P.P.; Solaro, R.J. Identification of a functionally critical protein kinase C phosphorylation residue of cardiac troponin T. J. Biol. Chem. 2003, 278, 35135–35144. [Google Scholar] [CrossRef]
- Kimura, C.; Maeda, K.; Maéda, Y.; Miki, M. Ca2+- and S1-induced movement of troponin T on reconstituted skeletal muscle thin filaments observed by fluorescence energy transfer spectroscopy. J. Biochem. 2002, 132, 93–102. [Google Scholar] [CrossRef] [PubMed]
- Yamashita, H.; Matsuo, T.; Arata, T. Structural dynamics of cardiac troponin T in the thin filament, as studied by spin-labeling dipolar EPR spectroscopy. In preparation.
- Murakami, K.; Stewart, M.; Nozawa, K.; Tomii, K.; Kudou, N.; Igarashi, N.; Shirakihara, Y.; Wakatsuki, S.; Yasunaga, T.; Wakabayashi, T. Structural basis for tropomyosin overlap in thin (actin) filaments and the generation of a molecular swivel by troponin-T. Proc. Natl. Acad. Sci. USA 2008, 105, 7200–7205. [Google Scholar] [CrossRef] [PubMed]
- Sakai, K.; Matsuo, T.; Arata, T. Phosphorylation dependent structural dynamics of cardiac troponin T in the thin filament, as studied by spin-labeling dipolar EPR spectroscopy. In preparation.
- McLachlan, A.D.; Stewart, M. The troponin binding region of tropomyosin. Evidence for a site near residues 197 to 127. J. Mol. Biol. 1976, 106, 1017–1022. [Google Scholar] [CrossRef]
- Parry, D.A.D. Movement of tropomyosin during regulation of vertebrate skeletal muscle: A simple physical model. Biochem. Biophys. Res. Commun. 1976, 68, 323–328. [Google Scholar] [CrossRef]
- Phillips, G.N., Jr.; Fillers, J.P.; Cohen, C. Tropomyosin crystal structure and muscle regulation. J. Mol. Biol. 1986, 192, 111–131. [Google Scholar] [CrossRef]
- Narita, A.; Yasunaga, T.; Ishikawa, T.; Mayanagi, K.; Wakabayashi, T. Ca2+-induced switching of troponin and tropomyosin on actin filaments as revealed by electron cryo-microscopy. J. Mol. Biol. 2001, 308, 241–261. [Google Scholar] [CrossRef]
- Pirani, A.; Vinogradova, M.V.; Curmi, P.M.; King, W.A.; Fletterick, R.J.; Craig, R.; Tobacman, L.S.; Xu, C.; Hatch, V.; Lehman, W. An atomic model of the thin filament in the relaxed and Ca2+-activated states. J. Mol. Biol. 2006, 357, 707–717. [Google Scholar] [CrossRef]
- Poole, K.J.; Lorenz, M.; Evans, G.; Rosenbaum, G.; Pirani, A.; Craig, R.; Tobacman, L.S.; Lehman, W.; Holmes, K.C. A comparison of muscle thin filament models obtained from electron microscopy reconstructions and low-angle X-ray fibre diagrams from non-overlap muscle. J. Struct. Biol. 2006, 155, 273–284. [Google Scholar] [CrossRef]
- Wakabayashi, K.; Sugimoto, Y.; Takezawa, Y.; Ueno, Y.; Minakata, S.; Matsuo, T.; Kobayashi, T. Structural alterations of thin actin filaments in muscle contraction by synchrotron X-ray fibre diffraction. Adv. Exp. Med. Biol. 2007, 592, 327–340. [Google Scholar] [PubMed]
- Sugimoto, Y.; Takezawa, Y.; Matsuo, T.; Ueno, Y.; Minakata, S.; Tanaka, H.; Wakabayashi, K. Structural changes of the regulatory proteins bound to the thin filaments in skeletal muscle contraction by X-ray fiber diffraction. Biochem. Biophys. Res. Commun. 2008, 369, 100–108. [Google Scholar] [CrossRef] [PubMed]
- Von der Ecken, J.; Müller, M.; Lehman, W.; Manstein, D.J.; Penczek, P.A.; Raunser, S. Structure of the F-actin-tropomyosin complex. Nature 2015, 519, 114–117. [Google Scholar] [CrossRef] [PubMed]
- McKillop, D.F.; Geeves, M.A. Regulation of the interaction between actin and myosin subfragment 1: Evidence for three states of the thin filament. Biophys. J. 1993, 65, 693–701. [Google Scholar] [CrossRef]
- Maytum, R.; Lehrer, S.S.; Geeves, M.A. Cooperativity and switching within the three-state model of muscle regulation. Biochemistry 1999, 38, 1102–1110. [Google Scholar] [CrossRef]
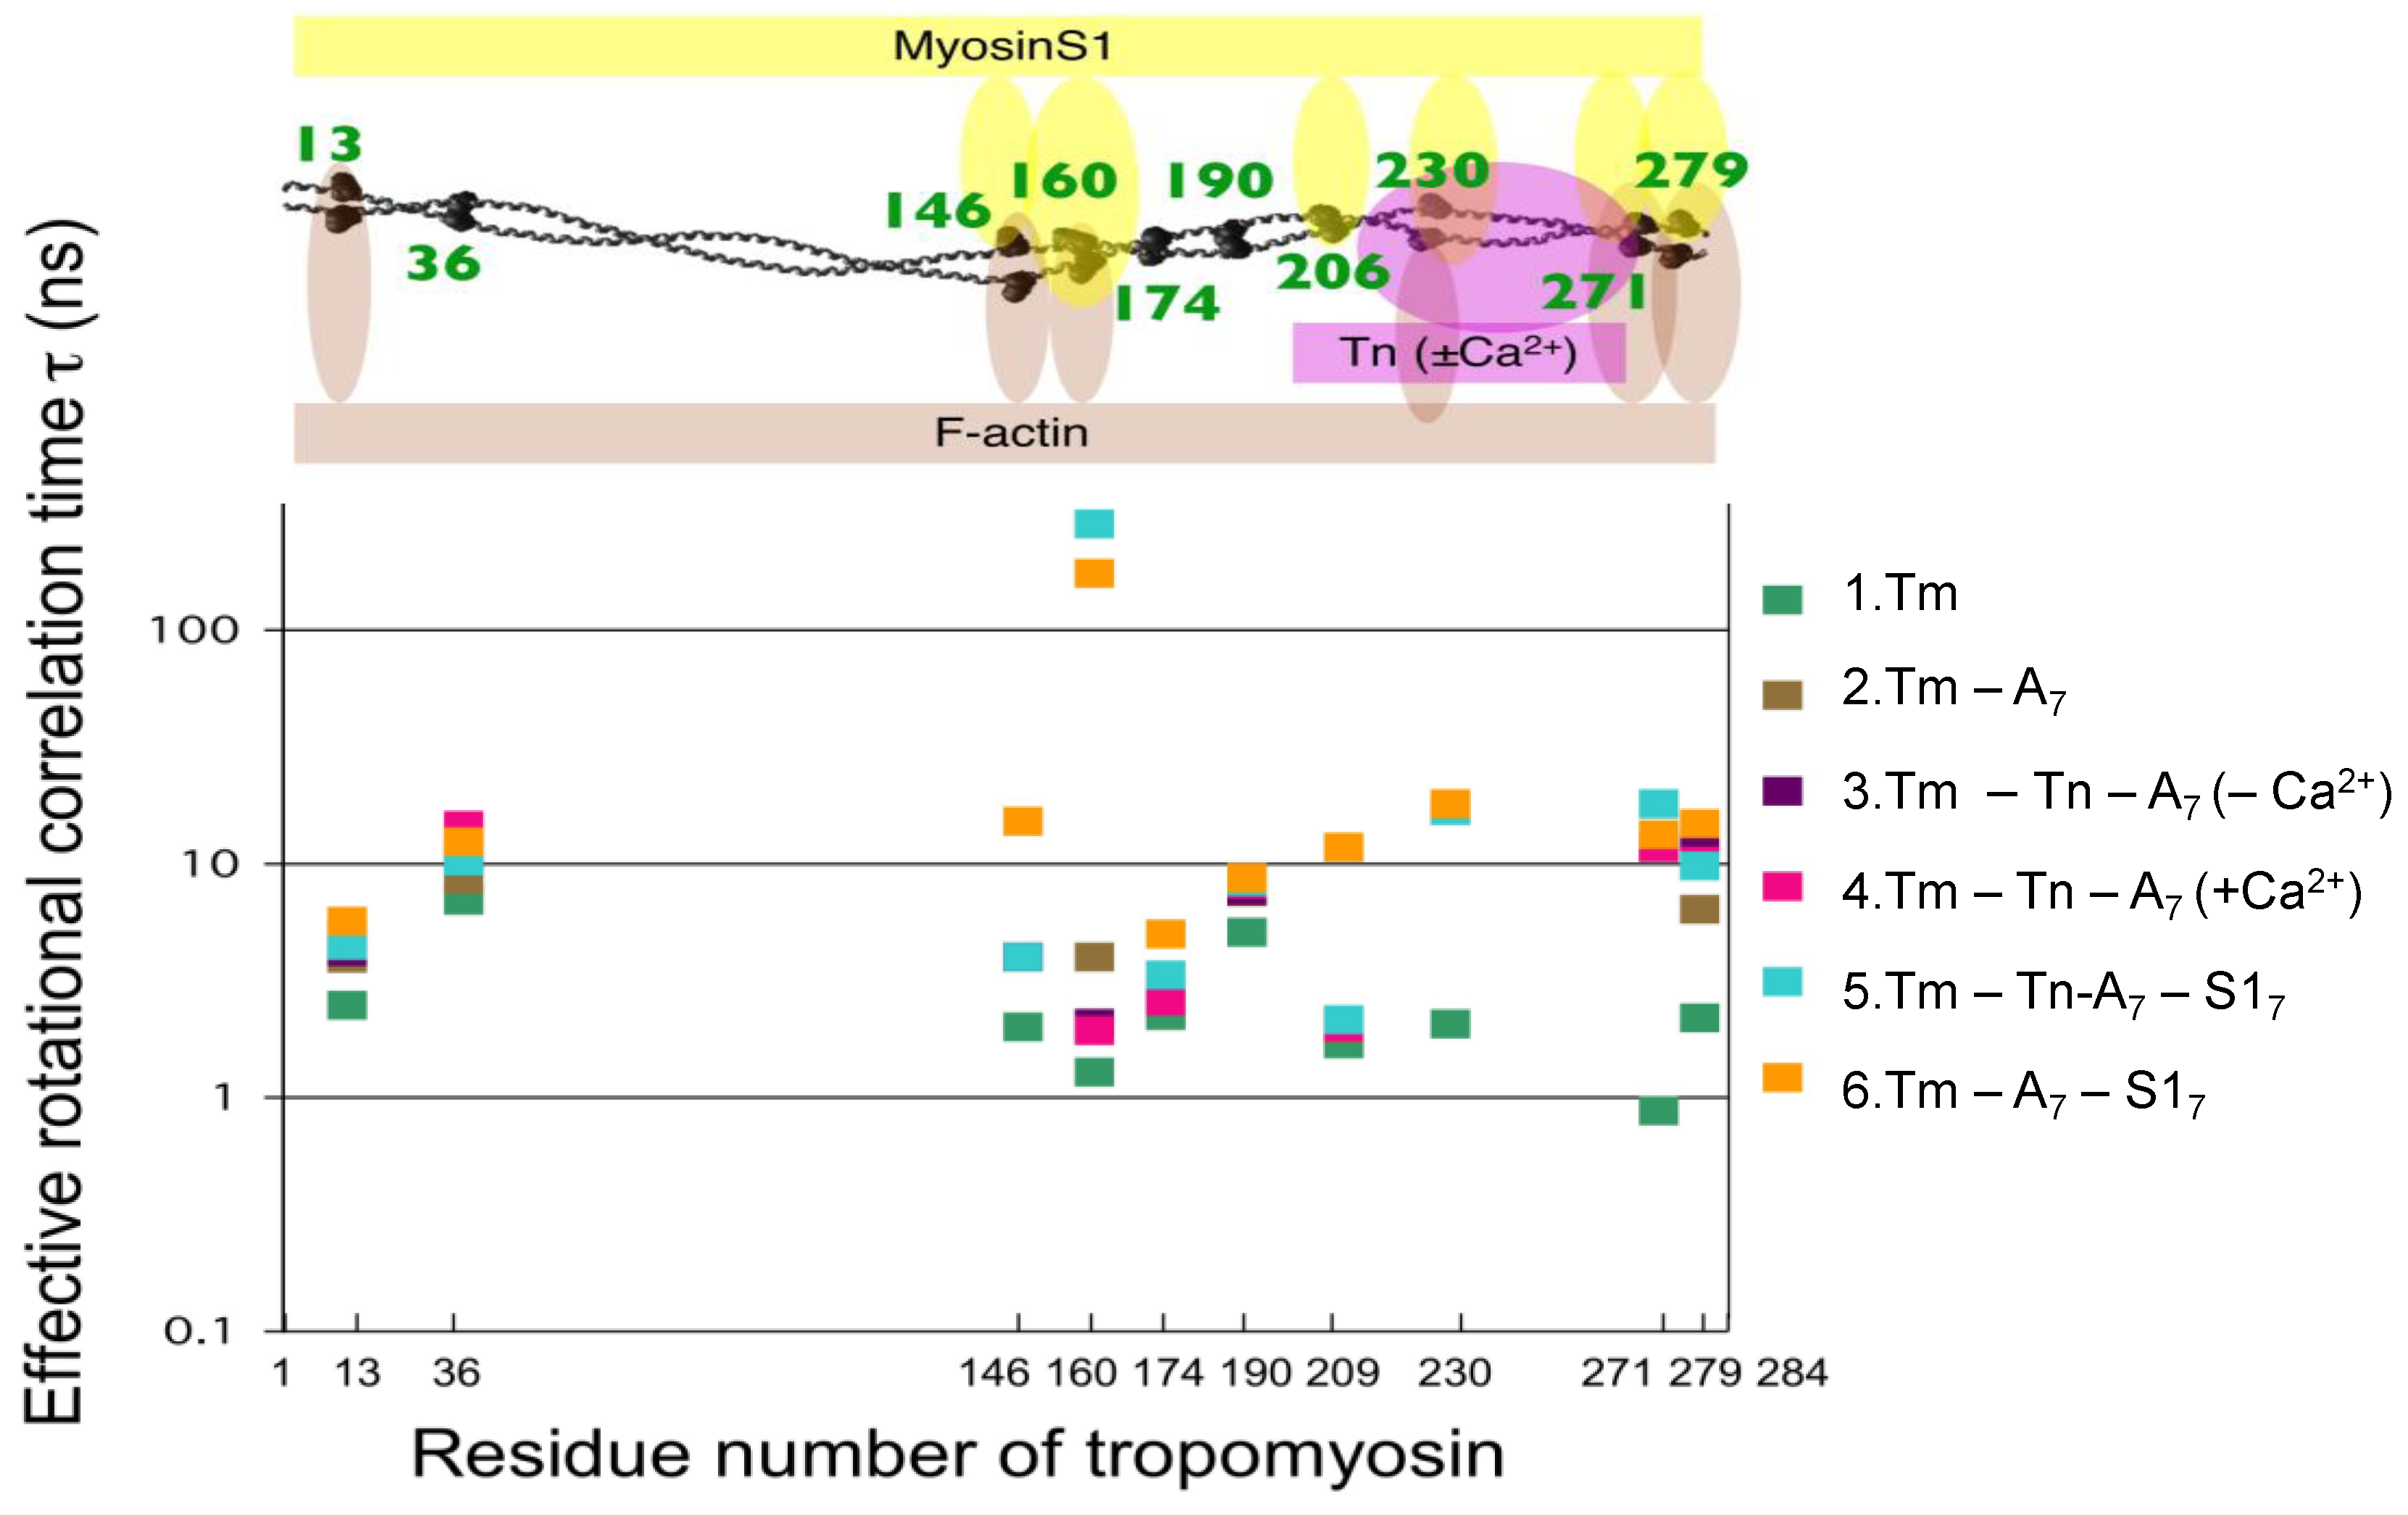
- Ueda, K.; Kimura-Sakiyama, C.; Aihara, T.; Miki, M.; Arata, T. Interaction Sites of Tropomyosin in Muscle Thin Filament as Identified by Site-Directed Spin-Labeling. Biophys. J. 2011, 100, 2432–2439. [Google Scholar] [CrossRef]
- Tao, T.; Lamkin, M.; Lehrer, S.S. Excitation energy transfer studies of the proximity between tropomyosin and actin in reconstituted skeletal muscle thin filaments. Biochemistry 1983, 22, 3059–3066. [Google Scholar] [CrossRef]
- Miki, M.; Miura, T.; Sano, K.; Kimura, H.; Kondo, H.; Ishida, H.; Mae’da, Y. Fluorescence resonance energy transfer between points on tropomyosin and actin in skeletal muscle thin filaments: Does tropomyosin move? J. Biochem. 1998, 123, 1104–1111. [Google Scholar] [CrossRef]
- Wang, H.; Mao, S.; Chalovich, J.M.; Marriott, G. Tropomyosin dynamics in cardiac thin filaments: A multisite forster resonance energy transfer and anisotropy study. Biophys. J. 2008, 94, 4358–4369. [Google Scholar] [CrossRef][Green Version]
- Miki, M.; Makimura, S.; Saitoh, T.; Bunya, M.; Sugahara, Y.; Ueno, Y.; Kimura-Sakiyama, C.; Tobita, H. A three-dimensional FRET analysis to construct an atomic model of the actin-tropomyosin complex on a reconstituted thin filament. J. Mol. Biol. 2011, 414, 765–782. [Google Scholar] [CrossRef]
- Ueda, K.; Miki, M.; Arata, T. Calcium-dependent distance between tropomyosin and actin on reconstituted muscle thin filaments by dipolar EPR using isotopic spin label. In preparation.
- Tsujimoto, Y.; Ueda, K.; Miki, M.; Arata, T. Calcium-dependent distance between tropomyosin and actin on reconstituted thin filaments as studied by site-directed spin-labeling using paramagnetic metal. In preparation.
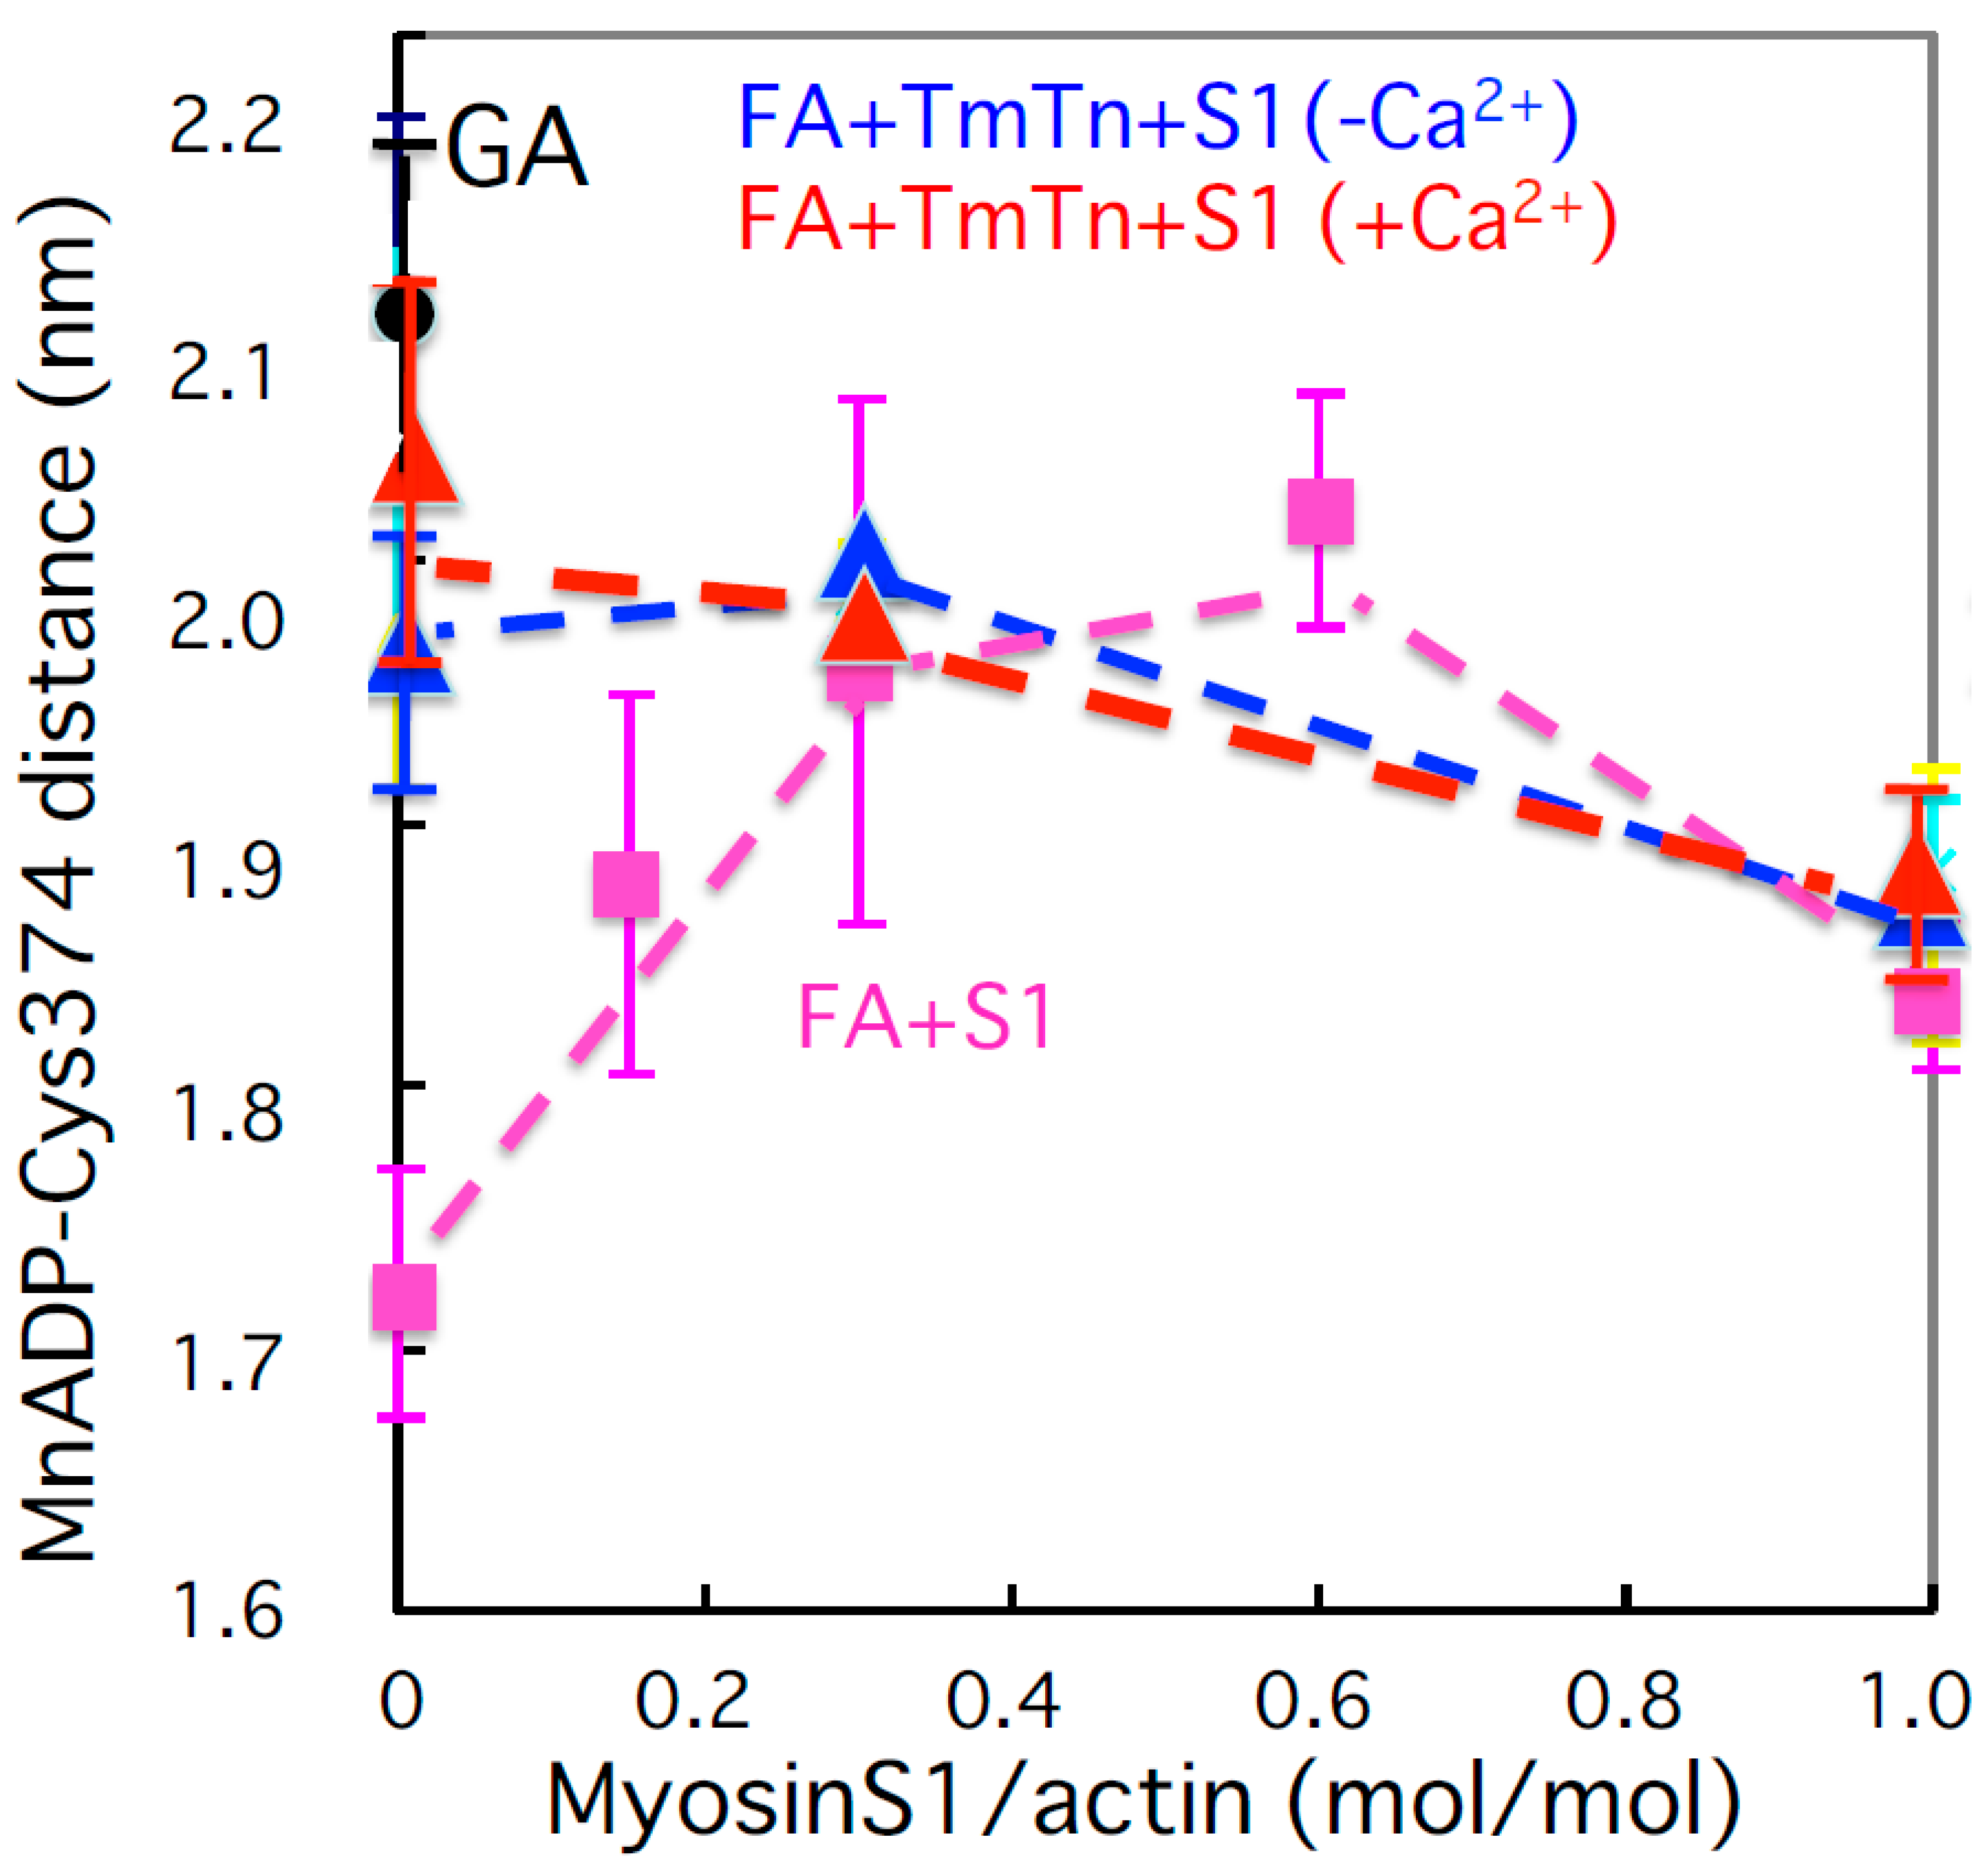
- Ueda, K.; Kimura-Sakiyama, C.; Aihara, T.; Miki, M.; Arata, T. Calcium-dependent distance of tropomyosin on reconstituted muscle thin filaments with bound myosin heads as studied by site-directed spin-labeling. Biophys. J. 2013, 105, 2366–2373. [Google Scholar] [CrossRef] [PubMed][Green Version]
- Yamamoto, A.; Fujita, S.; Inoue, A.; Arata, T. Structural dynamics of actin filament with bound S1 and troponin-tropomyosin as studied by site directed spin labeling. In preparation.
- Nishi, H.; Inoue, A.; Arata, T. Spin labeled phalloidin bound to F-actin. In preparation.
- Brady, S.T. A novel brain ATPase with properties expected for the fast axonal transport motor. Nature 1985, 317, 73–75. [Google Scholar] [CrossRef] [PubMed]
- Vale, R.D.; Schnapp, B.J.; Reese, T.S.; Sheetz, M.P. Movement of organelles along filaments dissociated from the axoplasm of the squid giant axon. Cell 1985, 40, 449–454. [Google Scholar] [CrossRef]
- Hirokawa, N. Kinesin and dynein superfamily proteins and the mechanism of organelle transport. Science 1998, 279, 519–526. [Google Scholar] [CrossRef] [PubMed]
- Yildiz, A.; Tomishige, M.; Vale, R.D.; Selvin, P.R. Kinesin walks hand-over-hand. Science 2004, 303, 676–678. [Google Scholar] [CrossRef] [PubMed]
- Kozielski, F.; Sack, S.; Marx, A.; Thormahlen, M.; Schonbrunn, E.; Biou, V.; Thompson, A.; Mandelkow, E.-M.; Mandelkow, E. The crystal structure of dimeric kinesin and implications for microtubule-dependent motility. Cell 1997, 91, 985–994. [Google Scholar] [CrossRef]
- Rice, S.; Lin, A.W.; Safer, D.; Hart, C.L.; Naber, N.; Carragher, B.O.; Cain, S.M.; Pechatnikova, E.; Wilson-Kubalek, E.M.; Whittaker, M.; et al. A structural change in the kinesin motor protein that drives motility. Nature 1999, 402, 778–784. [Google Scholar] [CrossRef]
- Kikkawa, M.; Sablin, E.P.; Okada, Y.; Yajima, H.; Fletterick, R.J.; Hirokawa, N. Switch-based mechanism of kinesin motors. Nature 2001, 411, 439–445. [Google Scholar] [CrossRef]
- Yamada, M.D.; Maruta, S.; Yasuda, S.; Kondo, K.; Maeda, H.; Arata, T. Conformational dynamics of loops L11 and L12 of kinesin as revealed by spin-labeling EPR. Biochem. Biophys. Res. Commun. 2007, 364, 620–626. [Google Scholar] [CrossRef]
- Rice, S.; Cui, Y.; Sindelar, C.; Naber, N.; Matuska, M.; Vale, R.; Cooke, R. Thermodynamic properties of the kinesin neck-region docking to the catalytic core. Biophys. J. 2003, 84, 1844–1854. [Google Scholar] [CrossRef]
- Sindelar, C.V.; Budny, M.J.; Rice, S.; Naber, N.; Fletterick, R.; Cooke, R. Two conformations in the human kinesin power stroke defined by X-ray crystallography and EPR spectroscopy. Nat. Struct. Mol. Biol. 2002, 9, 844–848. [Google Scholar]
- Takai, S.; Maruta, S.; Arata, T. Nucleotide-dependent neck linker strain of dimeric kinesin as measured by site-directed spin labeling and dipolar EPR. In preparation.
- Sugata, K.; Nakamura, M.; Ueki, S.; Fajer, P.G.; Arata, T. ESR reveals the mobility of the neck linker in dimeric kinesin. Biochem. Biophys. Res. Commun. 2004, 314, 447–451. [Google Scholar] [CrossRef] [PubMed]
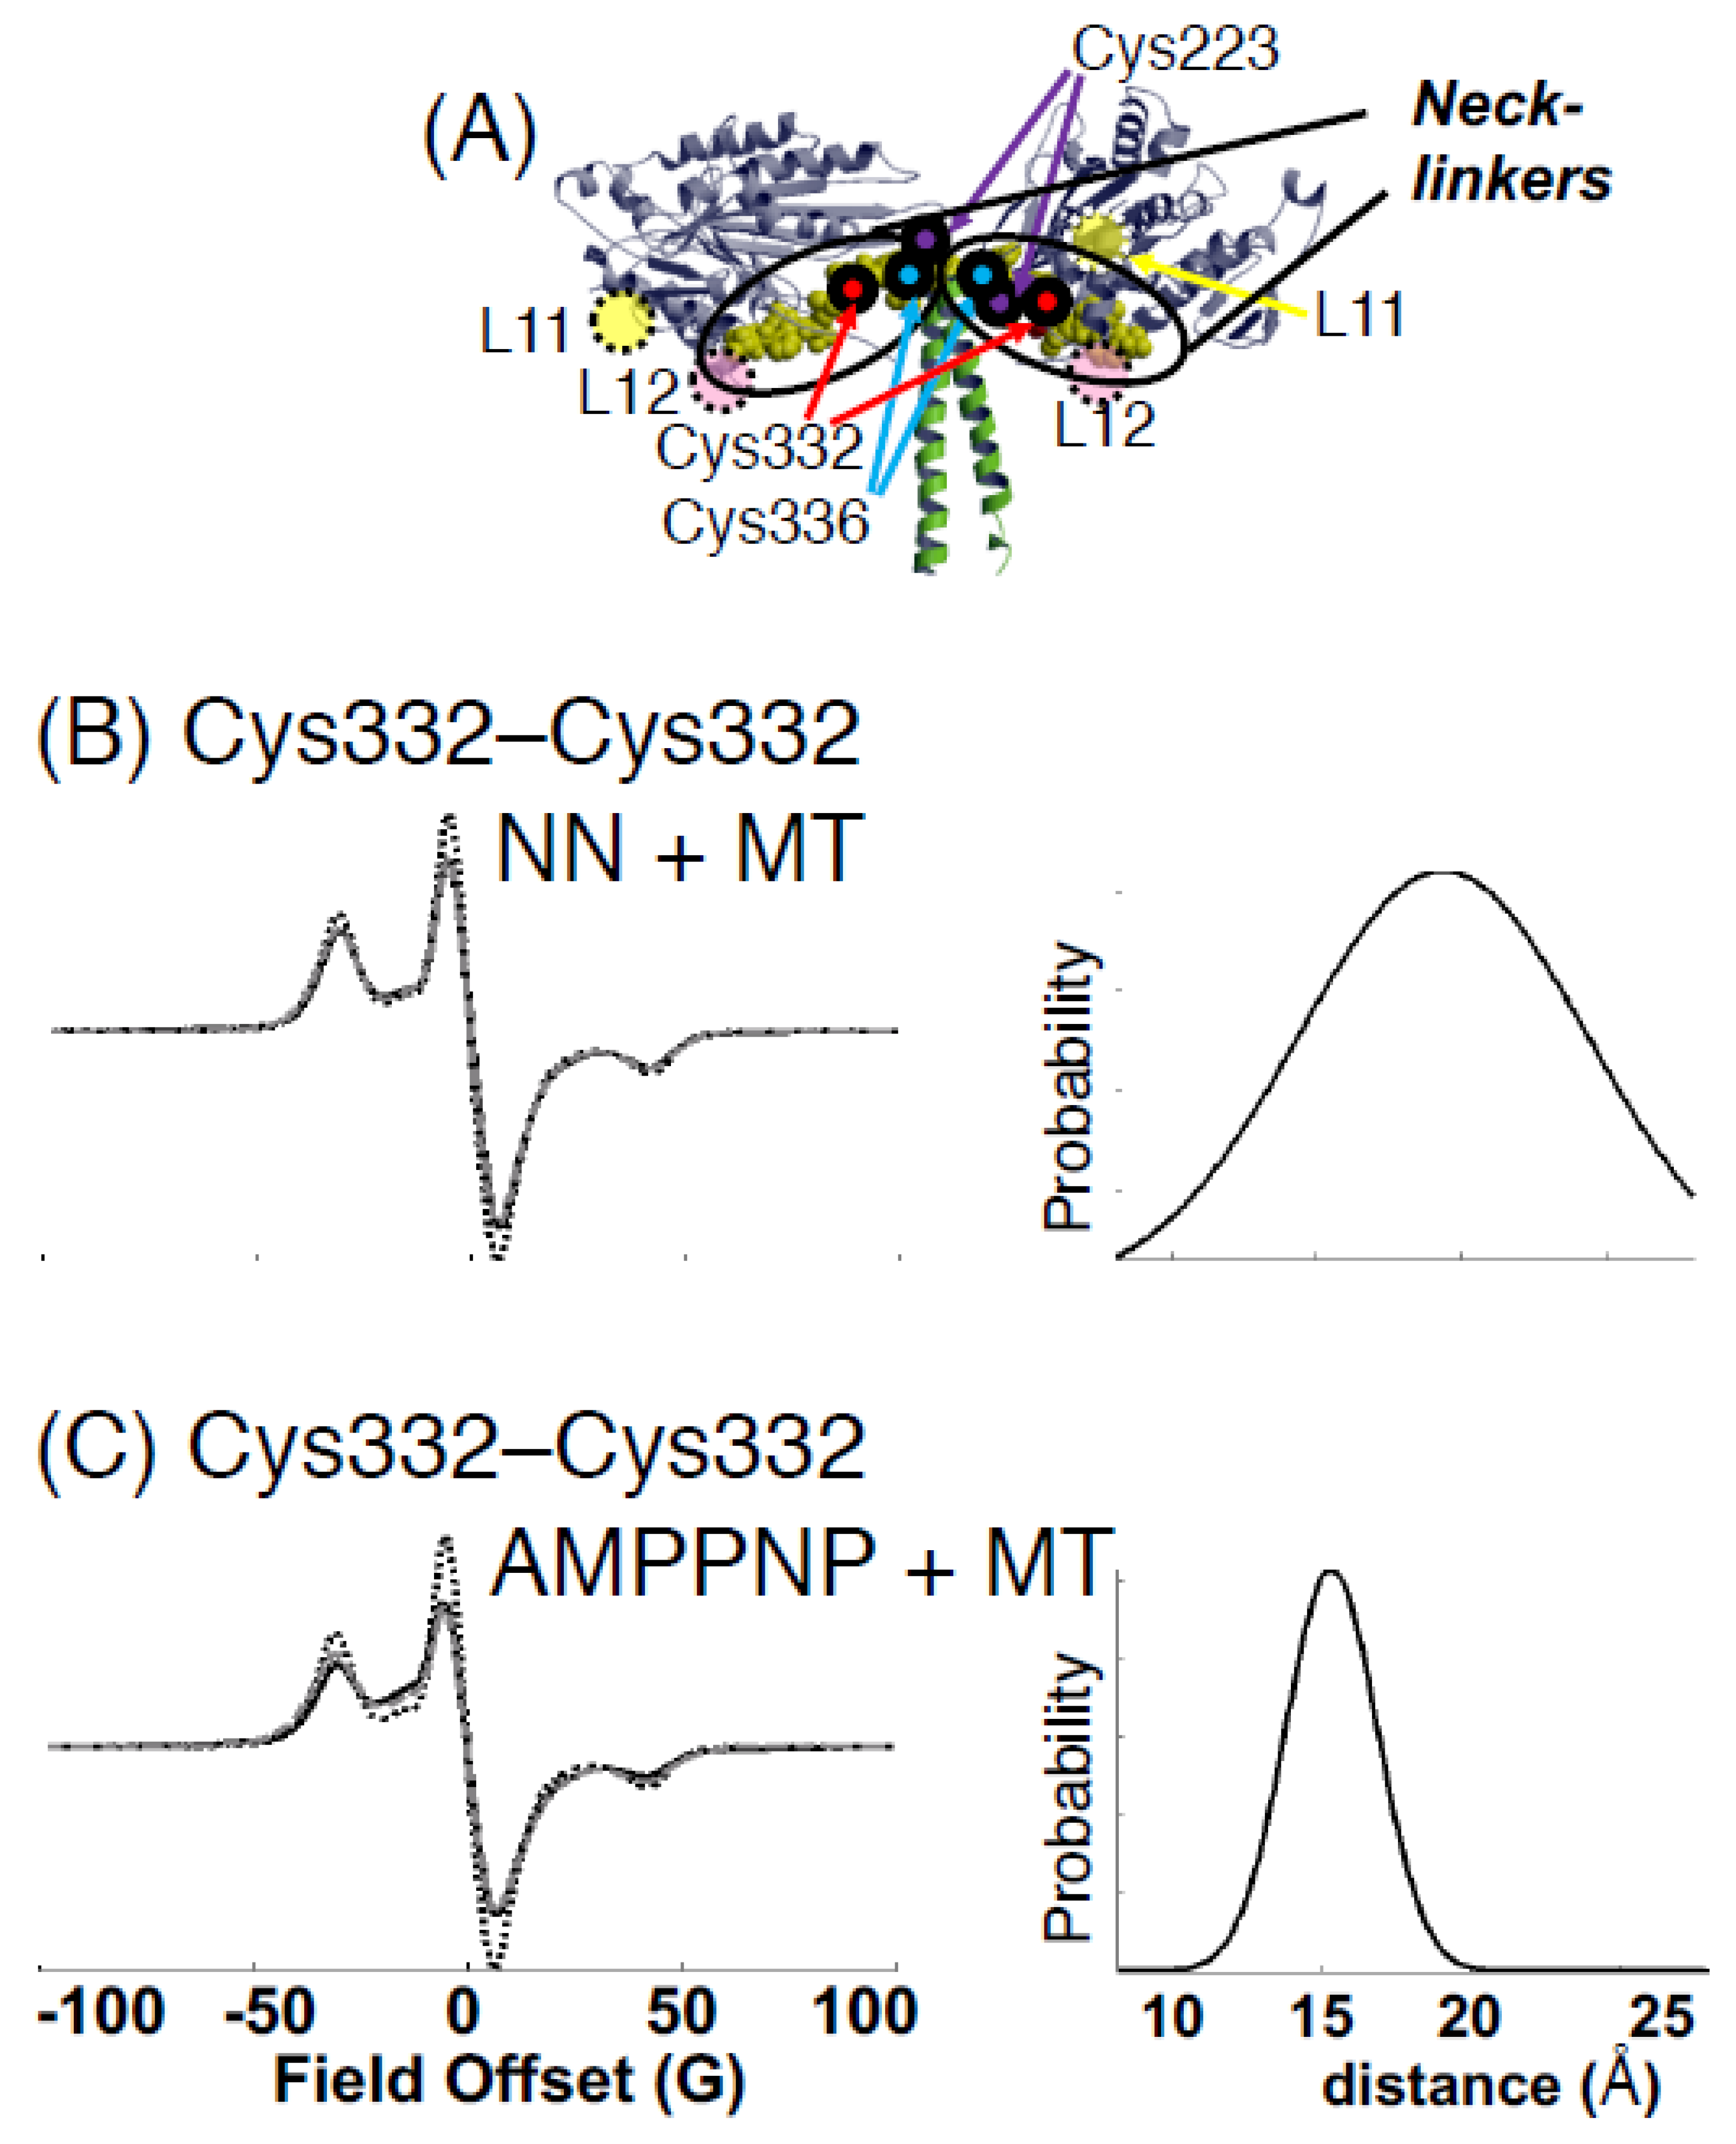
- Sugata, K.; Song, L.; Nakamura, M.; Ueki, S.; Fajer, P.G.; Arata, T. Nucleotide-induced flexibility change in neck linkers of Dimeric kinesin as detected by distance measurements using spin-labeling EPR. J. Mol. Biol. 2009, 38, 626–636. [Google Scholar] [CrossRef] [PubMed]
- Naber, N.; Rice, S.M.; Matuska, S.; Vale, R.D.; Cooke, R.; Pate, E. EPR spectroscopy shows a microtubule-dependent conformational change in the kinesin switch 1 domain. Biophys. J. 2003, 84, 3190–3196. [Google Scholar] [CrossRef]
- Vale, R.D. Switches, latches, and amplifiers: Common themes of G proteins and molecular motors. J. Cell Biol. 1996, 135, 291–302. [Google Scholar] [CrossRef]
- Hirose, K.; Akimaru, E.; Akiba, T.; Endow, S.A.; Amos, L.A. Large conformational changes in a kinesin motor catalyzed by interaction with microtubules. Mol. Cell 2006, 23, 913–923. [Google Scholar] [CrossRef]
- Sindelar, C.V.; Downing, K.H. An atomic-level mechanism for activation of the kinesin molecular motors. Proc. Natl. Acad. Sci. USA 2010, 107, 4111–4116. [Google Scholar] [CrossRef]
- Sack, S.; Muller, J.; Marx, A.; Thormählen, M.; Mandelkow, E.M.; Brady, S.T.; Mandelkow, E. X-ray structure of motor and neck domains from rat brain kinesin. Biochemistry 1997, 36, 16155–16165. [Google Scholar] [CrossRef]
- Yasuda, S.; Yanagi, T.; Yamada, M.D.; Ueki, S.; Maruta, S.; Inoue, A.; Arata, T. Nucleotide-dependent displacement and dynamics of the α-1 helix in kinesin revealed by site-directed spin labeling EPR. Biochem. Biophys. Res. Commun. 2014, 443, 911–916. [Google Scholar] [CrossRef]
- Iwasaki, H.; Nishiwaki, T.; Kitayama, Y.; Nakajima, M.; Kondo, T. KaiA-stimulated KaiC phosphorylation in circadian timing loops in cyanobacteria. Proc. Natl. Acad. Sci. USA 2002, 99, 15788–15793. [Google Scholar] [CrossRef]
- Williams, S.B.; Vakonakis, I.; Golden, S.S.; LiWang, A.C. Structure and function from the circadian clock protein KaiA of Synechococcus elongatus: A potential clock input mechanism. Proc. Natl. Acad. Sci. USA 2002, 99, 15357–15362. [Google Scholar] [CrossRef] [PubMed]
- Hayashi, F.; Suzuki, H.; Iwase, R.; Uzumaki, T.; Miyake, T.; Shen, J.R.; Imada, K.; Furukawa, Y.; Yonekura, K.; Namba, K.; et al. ATP-induced hexameric ring structure of the cyanobacterial circadian clock protein KaiC. Genes Cells 2003, 8, 287–296. [Google Scholar] [CrossRef] [PubMed]
- Uzumaki, T.; Fujita, M.; Nakatsu, T.; Hayashi, F.; Shibata, H.; Itoh, N.; Kato, H.; Ishiura, M. Crystal structure of the C-terminal clock-oscillator domain of the cyanobacterial KaiA protein. Nat. Struct. Mol. Biol. 2004, 11, 623–631. [Google Scholar] [CrossRef] [PubMed]
- Terauchi, K.; Kitayama, Y.; Nishiwaki, T.; Miwa, K.; Murayama, Y.; Oyama, T.; Kondo, T. ATPase activity of KaiC determines the basic timing for circadian clock of cyanobacteria. Proc. Natl. Acad. Sci. USA 2007, 104, 16377–16381. [Google Scholar] [CrossRef] [PubMed]
- Murakami, R.; Miyake, A.; Iwase, R.; Hayashi, F.; Uzumaki, T.; Ishiura, M. ATPase activity and its temperature compensation of the cyanobacterial clock protein KaiC. Genes Cells 2008, 13, 387–395. [Google Scholar] [CrossRef]
- Kitayama, Y.; Iwasaki, H.; Nishiwaki, T.; Kondo, T. KaiB functions as an attenuator of KaiC phosphorylation in the cyanobacterial circadian clock system. EMBO J. 2003, 22, 2127–2134. [Google Scholar] [CrossRef]
- Nakajima, M.; Imai, K.; Ito, H.; Nishiwaki, T.; Murayama, Y.; Iwasaki, H.; Oyama, T.; Kondo, T. Reconstitution of circadian oscillation of cyanobacterial KaiC phosphorylation in vitro. Science 2005, 308, 414–415. [Google Scholar] [CrossRef]
- Kageyama, H.; Nishiwaki, T.; Nakajima, M.; Iwasakai, H.; Oyama, T.; Kondo, T. Cyanobacterial circadian pacemaker: Kai protein complex dynamics in the KaiC phosphorylation cycle in vitro. Mol. Cell 2006, 23, 161–171. [Google Scholar] [CrossRef]
- Akiyama, S.; Nohara, A.; Ito, K.; Maeda, Y. Assembly and disassembly dynamics of the cyanobacterial periodosome. Mol. Cell 2008, 29, 703–716. [Google Scholar] [CrossRef]
- Ishii, K.; Terauchi, S.; Murakami, R.; Swain, J.V.; Mutoh, R.; Maki, K.; Arata, T.; Ishiura, M. Site-directed spin labeling-electron spin resonance mapping of the residues of cyanobacterial clock protein KaiA that are affected by KaiA–KaiC interaction. Genes Cells 2014, 19, 297–324. [Google Scholar] [CrossRef]
- Ishii, K.; Arata, T.; Ishiura, M. Site-directed spin labeling-ESR mapping of the residues of cyanobacterial clock protein KaiC that are affected by KaiA-KaiC interaction. In preparation.
- Hong, L.; Vani, B.P.; Thiede, E.H.; Rust, M.J.; Dinner, A.R. Molecular dynamics simulations of nucleotide release from the circadian clock protein KaiC reveal atomic-resolution functional insights. Proc. Natl. Acad. Sci. USA 2018, 115, E11475–E11484. [Google Scholar] [CrossRef] [PubMed]
- Yunoki, Y.; Ishii, K.; Yagi-Utsumi, M.; Murakami, R.; Uchiyama, S.; Yagi, H.; Kato, K. ATP hydrolysis by KaiC promotes its KaiA binding in the cyanobacterial circadian clock system. Life Sci. Alliance 2019, 2, e201900368. [Google Scholar] [CrossRef] [PubMed]
- Toyoshima, C. How Ca2+-ATPase pumps ions across the sarcoplasmic reticulum membrane. Biochim. Biophys. Acta 2009, 1793, 941–946. [Google Scholar] [CrossRef] [PubMed]
- Palmgren, M.G.; Nissen, P. P-type ATPases. Annu. Rev. Biophys. 2011, 40, 243–266. [Google Scholar] [CrossRef] [PubMed]
- Narumi, R.; Yamamoto, T.; Inoue, A.; Arata, T. Substrate-induced conformational changes in sarcoplasmic reticulum Ca2+-ATPase probed by surface modification using diethylpyrocarbonate with mass spectrometry. FEBS Lett. 2012, 586, 3172–3178. [Google Scholar] [CrossRef] [PubMed]
- Yamasaki, K.; Sano, N.; Ohe, M.; Yamamoto, T. Determination of the primary structure of intermolecular cross-linking sites on the Ca2+-ATPase of sarcoplasmic reticulum using 14C-labeled N,N-(1,4-phenylene)bismaleimide or N-ethylmaleimide. J. Biochem. 1990, 108, 918–925. [Google Scholar] [CrossRef]
- Blackwell, D.J.; Zak, T.J.; Robia, S.L. Cardiac calcium ATPase dimerization measured by cross-linking and fluorescence energy transfer. Biophys. J. 2016, 111, 1192–1202. [Google Scholar] [CrossRef]
- Yasuda, S.; Hara, H.; Tokunaga, F.; Arata, T. Spatial arrangement of rhodopsin in retinal rod outer segment membranes studied by spin-labeling and pulsed electron double resonance. Biochem. Biophys. Res. Commun. 2012, 425, 134–137. [Google Scholar] [CrossRef]
- Yasuda, S.; Ueda, Y.; Kuwabara, N.; Arata, T. Nucleotide-dependent dynamics of Cu2+ binding site in the P1B-3-type ATPase CopB as studied by EPR spectroscopy. In preparation.
- Kuwabara, N. (Photon Factory, KEK, Tsukuba, Ibaraki, Japan). Personal communication, 2010.
- Daimon, H.; Horimoto, T.; Kuwabara, N.; Arata, T. EPR spectroscopy of Cu2+ binding site in the P1B-3-type ATPase CopB. In preparation.
- Meloni, G.; Zhang, L.; Rees, D.C. Transmembrane type-2-like Cu2+ site in the P1B-3-type ATPase CopB: Implications for metal selectivity. ACS Chem. Biol. 2014, 9, 116–121. [Google Scholar] [CrossRef]
- Purohit, R.; Ross, M.O.; Batelu, S.; Kusowski, A.; Stemmler, T.L.; Hoffman, B.M.; Rosenzweig, A.C. Cu+-specific CopB transporter: Revising P1B-type ATPase classification. Proc. Natl. Acad. Sci. USA 2018, 115, 2108–2113. [Google Scholar] [CrossRef]
- Daiho, T.; Yamasaki, K.; Danko, S.; Suzuki, H. Glycine 105 as pivot for a critical knee-like joint between cytoplasmic and transmembrane segments of the second transmembrane helix in Ca2+-ATPase. J. Biol. Chem. 2016, 291, 24688–24701. [Google Scholar] [CrossRef] [PubMed]
- Dyla, M.; Terry, D.S.; Thomas, M.K.; Sørensen, L.-M.; Andersen, L.; Andersen, J.P.; Knudsen, C.R.; Altman, R.B.; Nissen, P.; Blanchard, S.C. Dynamics of P-type ATPase transport revealed by single-molecule FRET. Nature 2017, 551, 346–351. [Google Scholar] [CrossRef] [PubMed]
- Hill, T.L. Free Energy Transduction in Biology; Academic Press: New York, NY, USA, 1977. [Google Scholar]
- Hill, T.L. Free Energy Transduction and Biochemical Cycle Kinetics; Springer: New York, NY, USA, 1989; reprinted in Dover Publications: Mineola, NY, USA, 2005. [Google Scholar]
- Nishiyama, K.; Shimizu, H.; Kometani, K.; Chaen, S. The three-state model for the elementary process of energy conversion in muscle. Biochim. Biophys. Acta 1977, 460, 523–536. [Google Scholar] [CrossRef]
- Eisenberg, E.; Hill, T.L.; Chen, Y. Cross-bridge model of muscle contraction. Quantitative analysis. Biophys. J. 1980, 29, 195–227. [Google Scholar] [CrossRef]
- Eisenberg, E.; Hill, T.L. Muscle Contraction and Free Energy Transduction in Biological Systems. Science 1985, 277, 999–1006. [Google Scholar] [CrossRef] [PubMed]
- Howard, J. Mechanics of Motor Proteins and the Cytoskeleton; Sinauer Associates Inc.: Sunderland, MA, USA, 2001. [Google Scholar]
- Mogilner, A.; Fisher, A.J.; Baskin, R.J. Structural changes in the neck linker of kinesin explain the load dependence of the motors mechanical cycle. J. Theor. Biol. 2001, 211, 143–157. [Google Scholar] [CrossRef]
- Thomas, N.; Imafuku, Y.; Kamiya, T.; Tawada, K. Kinesin: A molecular motor with a spring in its step. Proc. R. Soc. Lond. Ser. B 2002, 269, 2363–2371. [Google Scholar] [CrossRef]
- Yanagida, T.; Ishii, Y. Muscle contraction mechanism based on single molecule measurements. J. Muscle Res. Cell Motil. 2012, 33, 395–402. [Google Scholar] [CrossRef][Green Version]
- Galburt, E.A.; Tomko, E.J. Conformational selection and induced fit as a useful framework for molecular motor mechanism. Biophys. Chem. 2017, 223, 11–16. [Google Scholar] [CrossRef]
- Wang, H.; Oster, G. Ratchets, power strokes, and molecular motors. Appl. Phys. A 2002, 75, 315–323. [Google Scholar] [CrossRef]


© 2020 by the author. Licensee MDPI, Basel, Switzerland. This article is an open access article distributed under the terms and conditions of the Creative Commons Attribution (CC BY) license (http://creativecommons.org/licenses/by/4.0/).
Share and Cite
Arata, T. Myosin and Other Energy-Transducing ATPases: Structural Dynamics Studied by Electron Paramagnetic Resonance. Int. J. Mol. Sci. 2020, 21, 672. https://doi.org/10.3390/ijms21020672
Arata T. Myosin and Other Energy-Transducing ATPases: Structural Dynamics Studied by Electron Paramagnetic Resonance. International Journal of Molecular Sciences. 2020; 21(2):672. https://doi.org/10.3390/ijms21020672
Chicago/Turabian StyleArata, Toshiaki. 2020. "Myosin and Other Energy-Transducing ATPases: Structural Dynamics Studied by Electron Paramagnetic Resonance" International Journal of Molecular Sciences 21, no. 2: 672. https://doi.org/10.3390/ijms21020672
APA StyleArata, T. (2020). Myosin and Other Energy-Transducing ATPases: Structural Dynamics Studied by Electron Paramagnetic Resonance. International Journal of Molecular Sciences, 21(2), 672. https://doi.org/10.3390/ijms21020672