BcMF30a and BcMF30c, Two Novel Non-Tandem CCCH Zinc-Finger Proteins, Function in Pollen Development and Pollen Germination in Brassica campestris ssp. chinensis

 , ,
, , 
Abstract
1. Introduction
2. Results
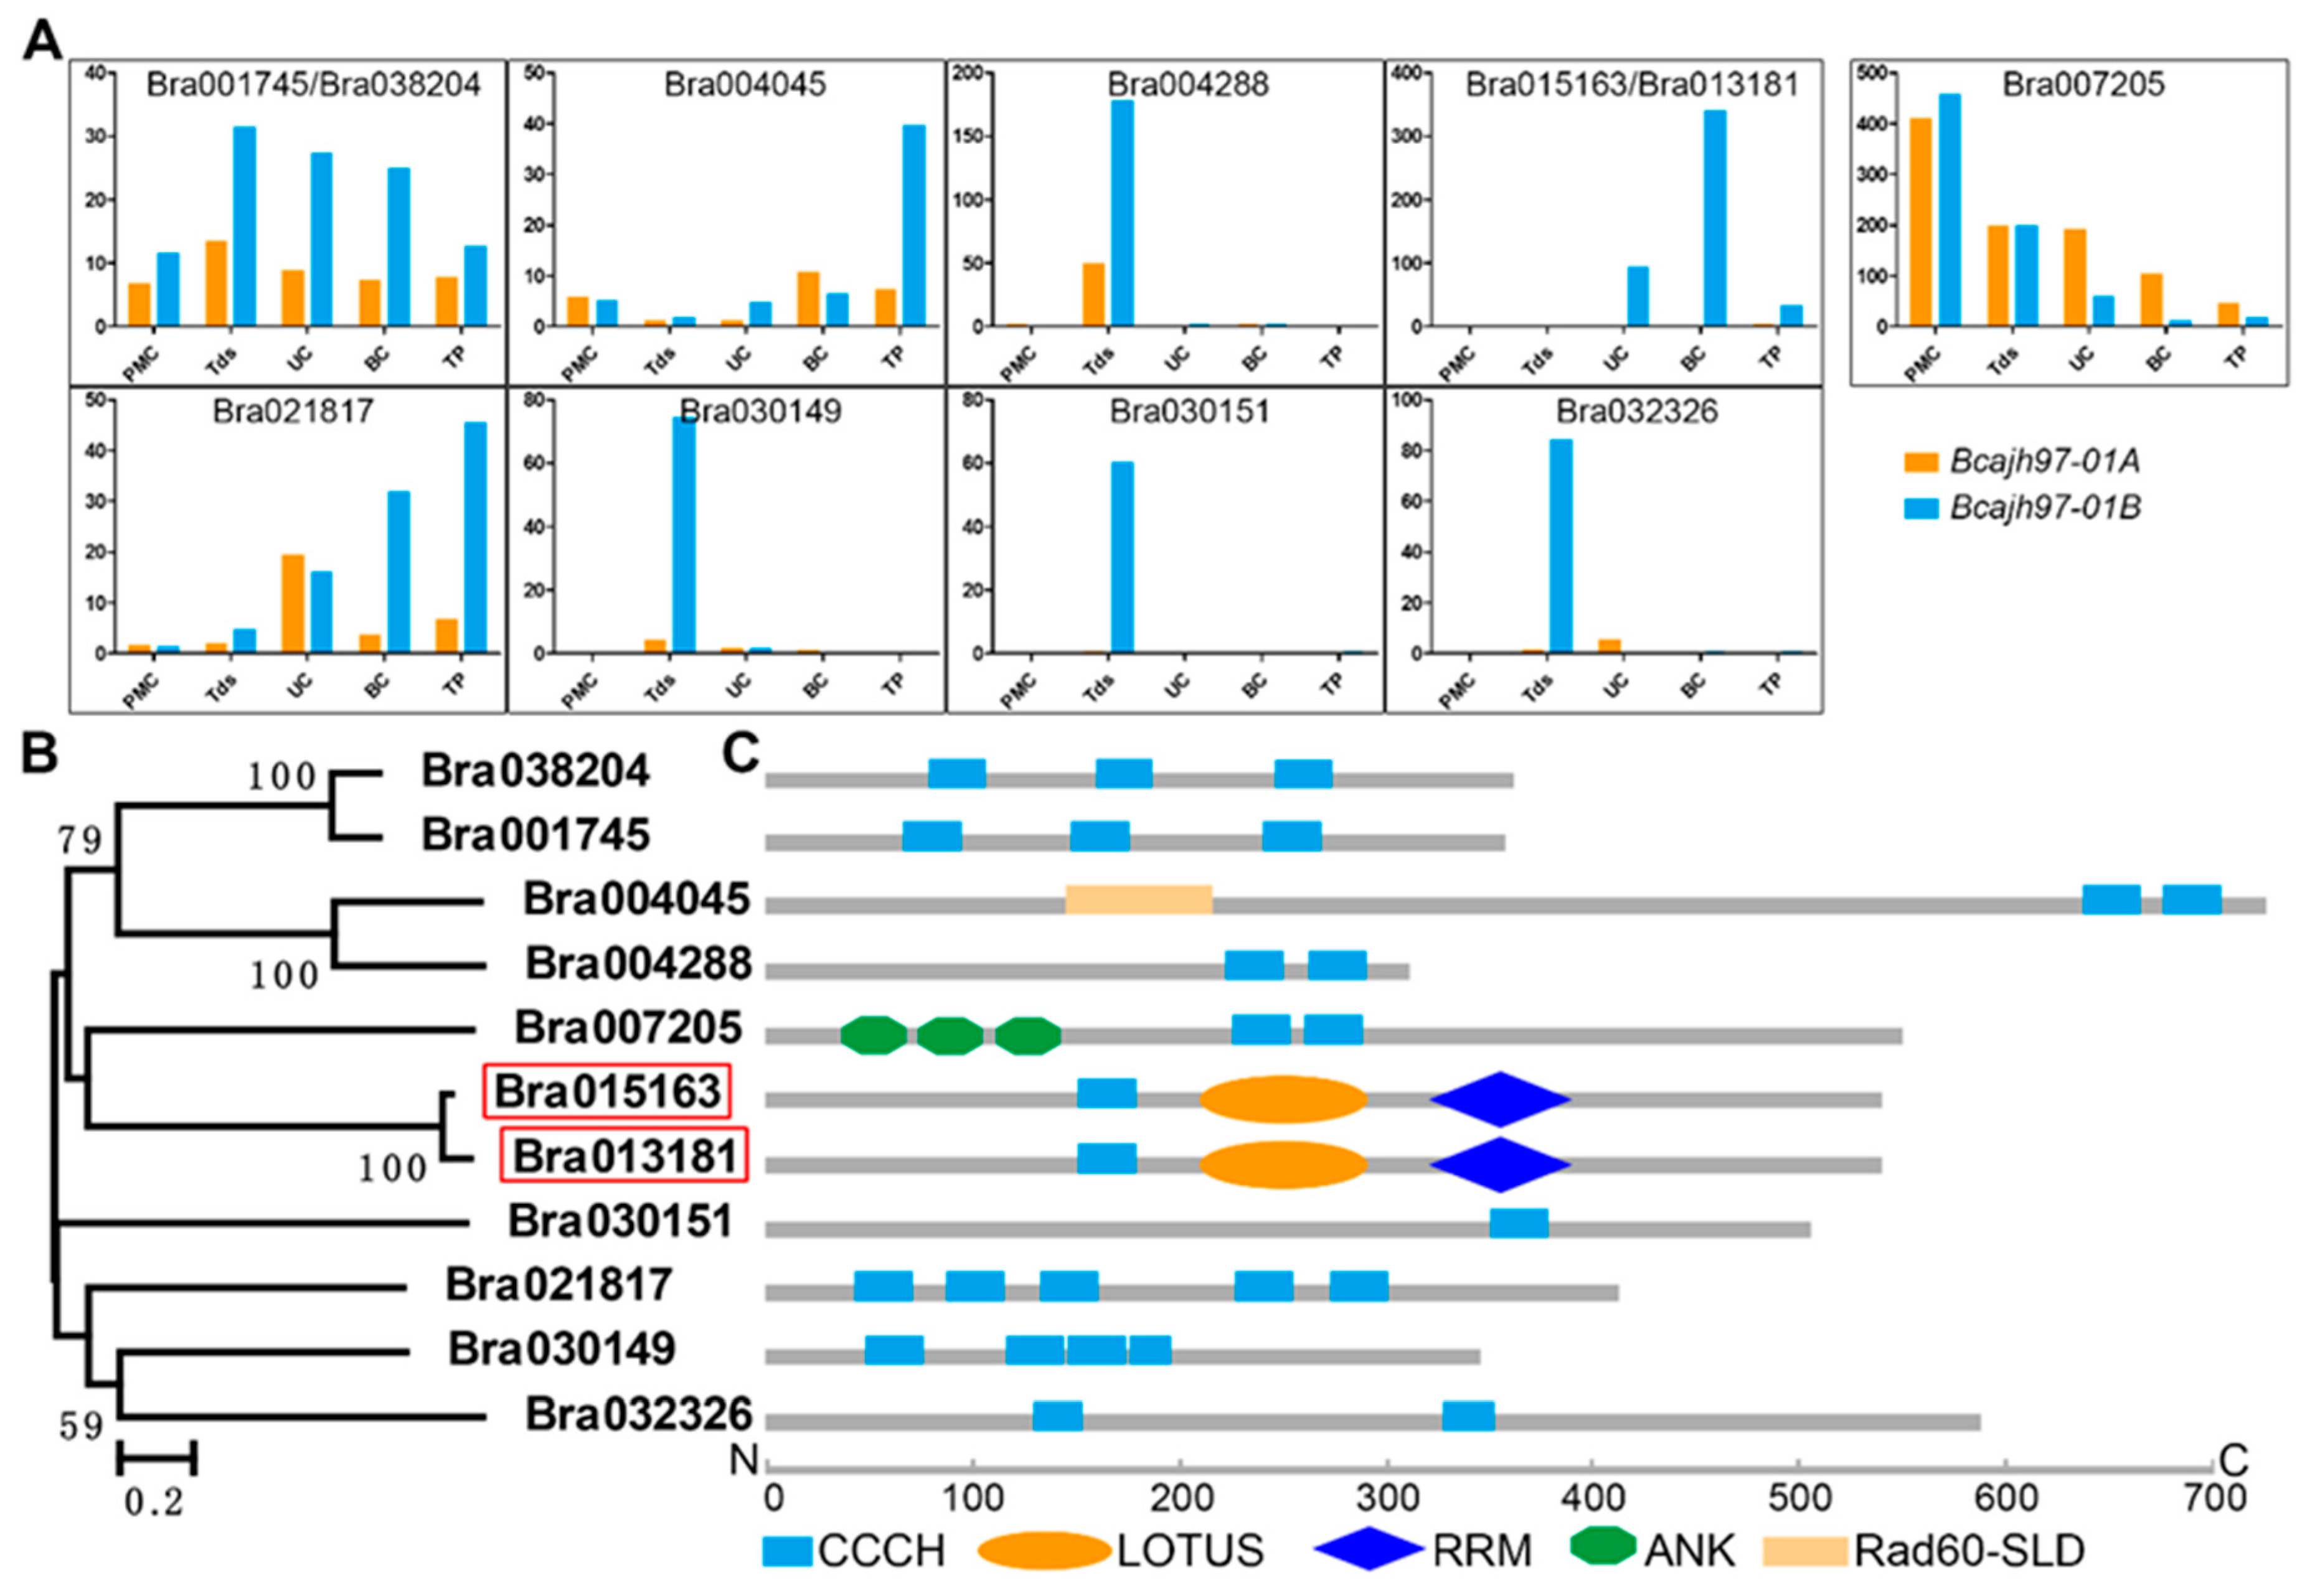
2.1. Identification of Male Fertility-Related CCCH Zinc-Finger Protein Genes in B. campestris
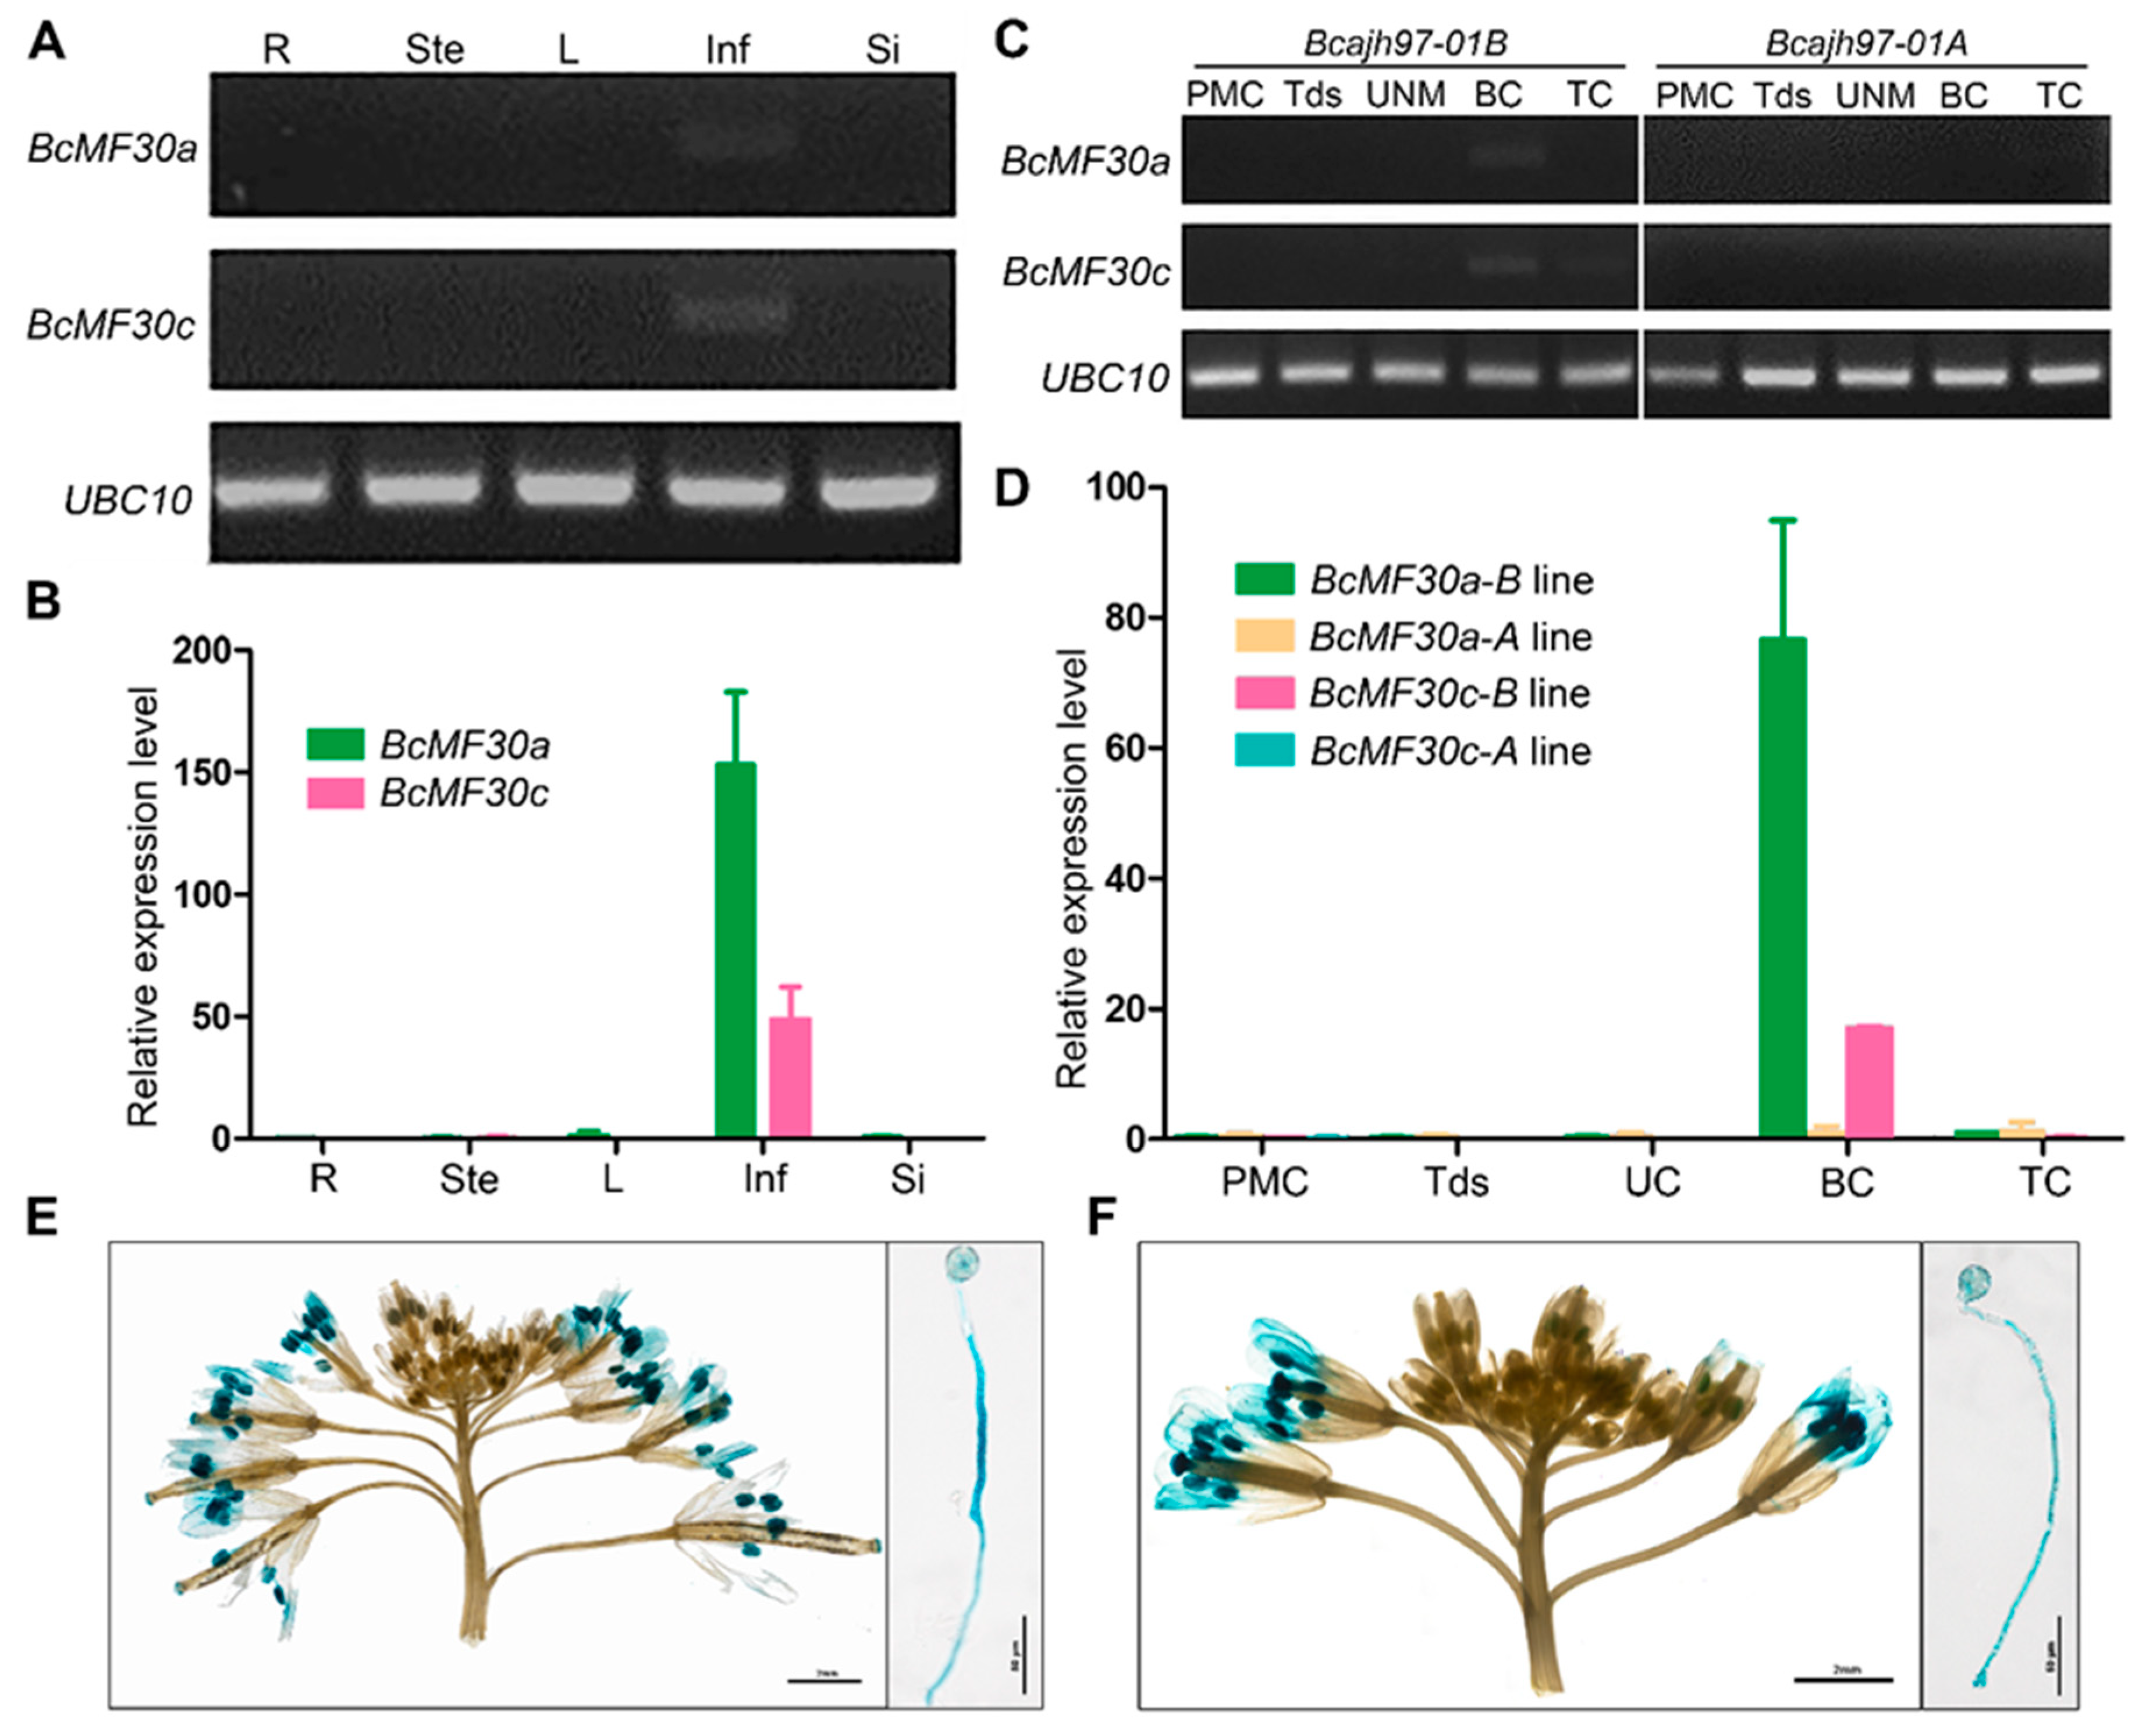
2.2. Expression Patterns of Two Novel Non-TZF Protein Genes, BcMF30a and BcMF30c
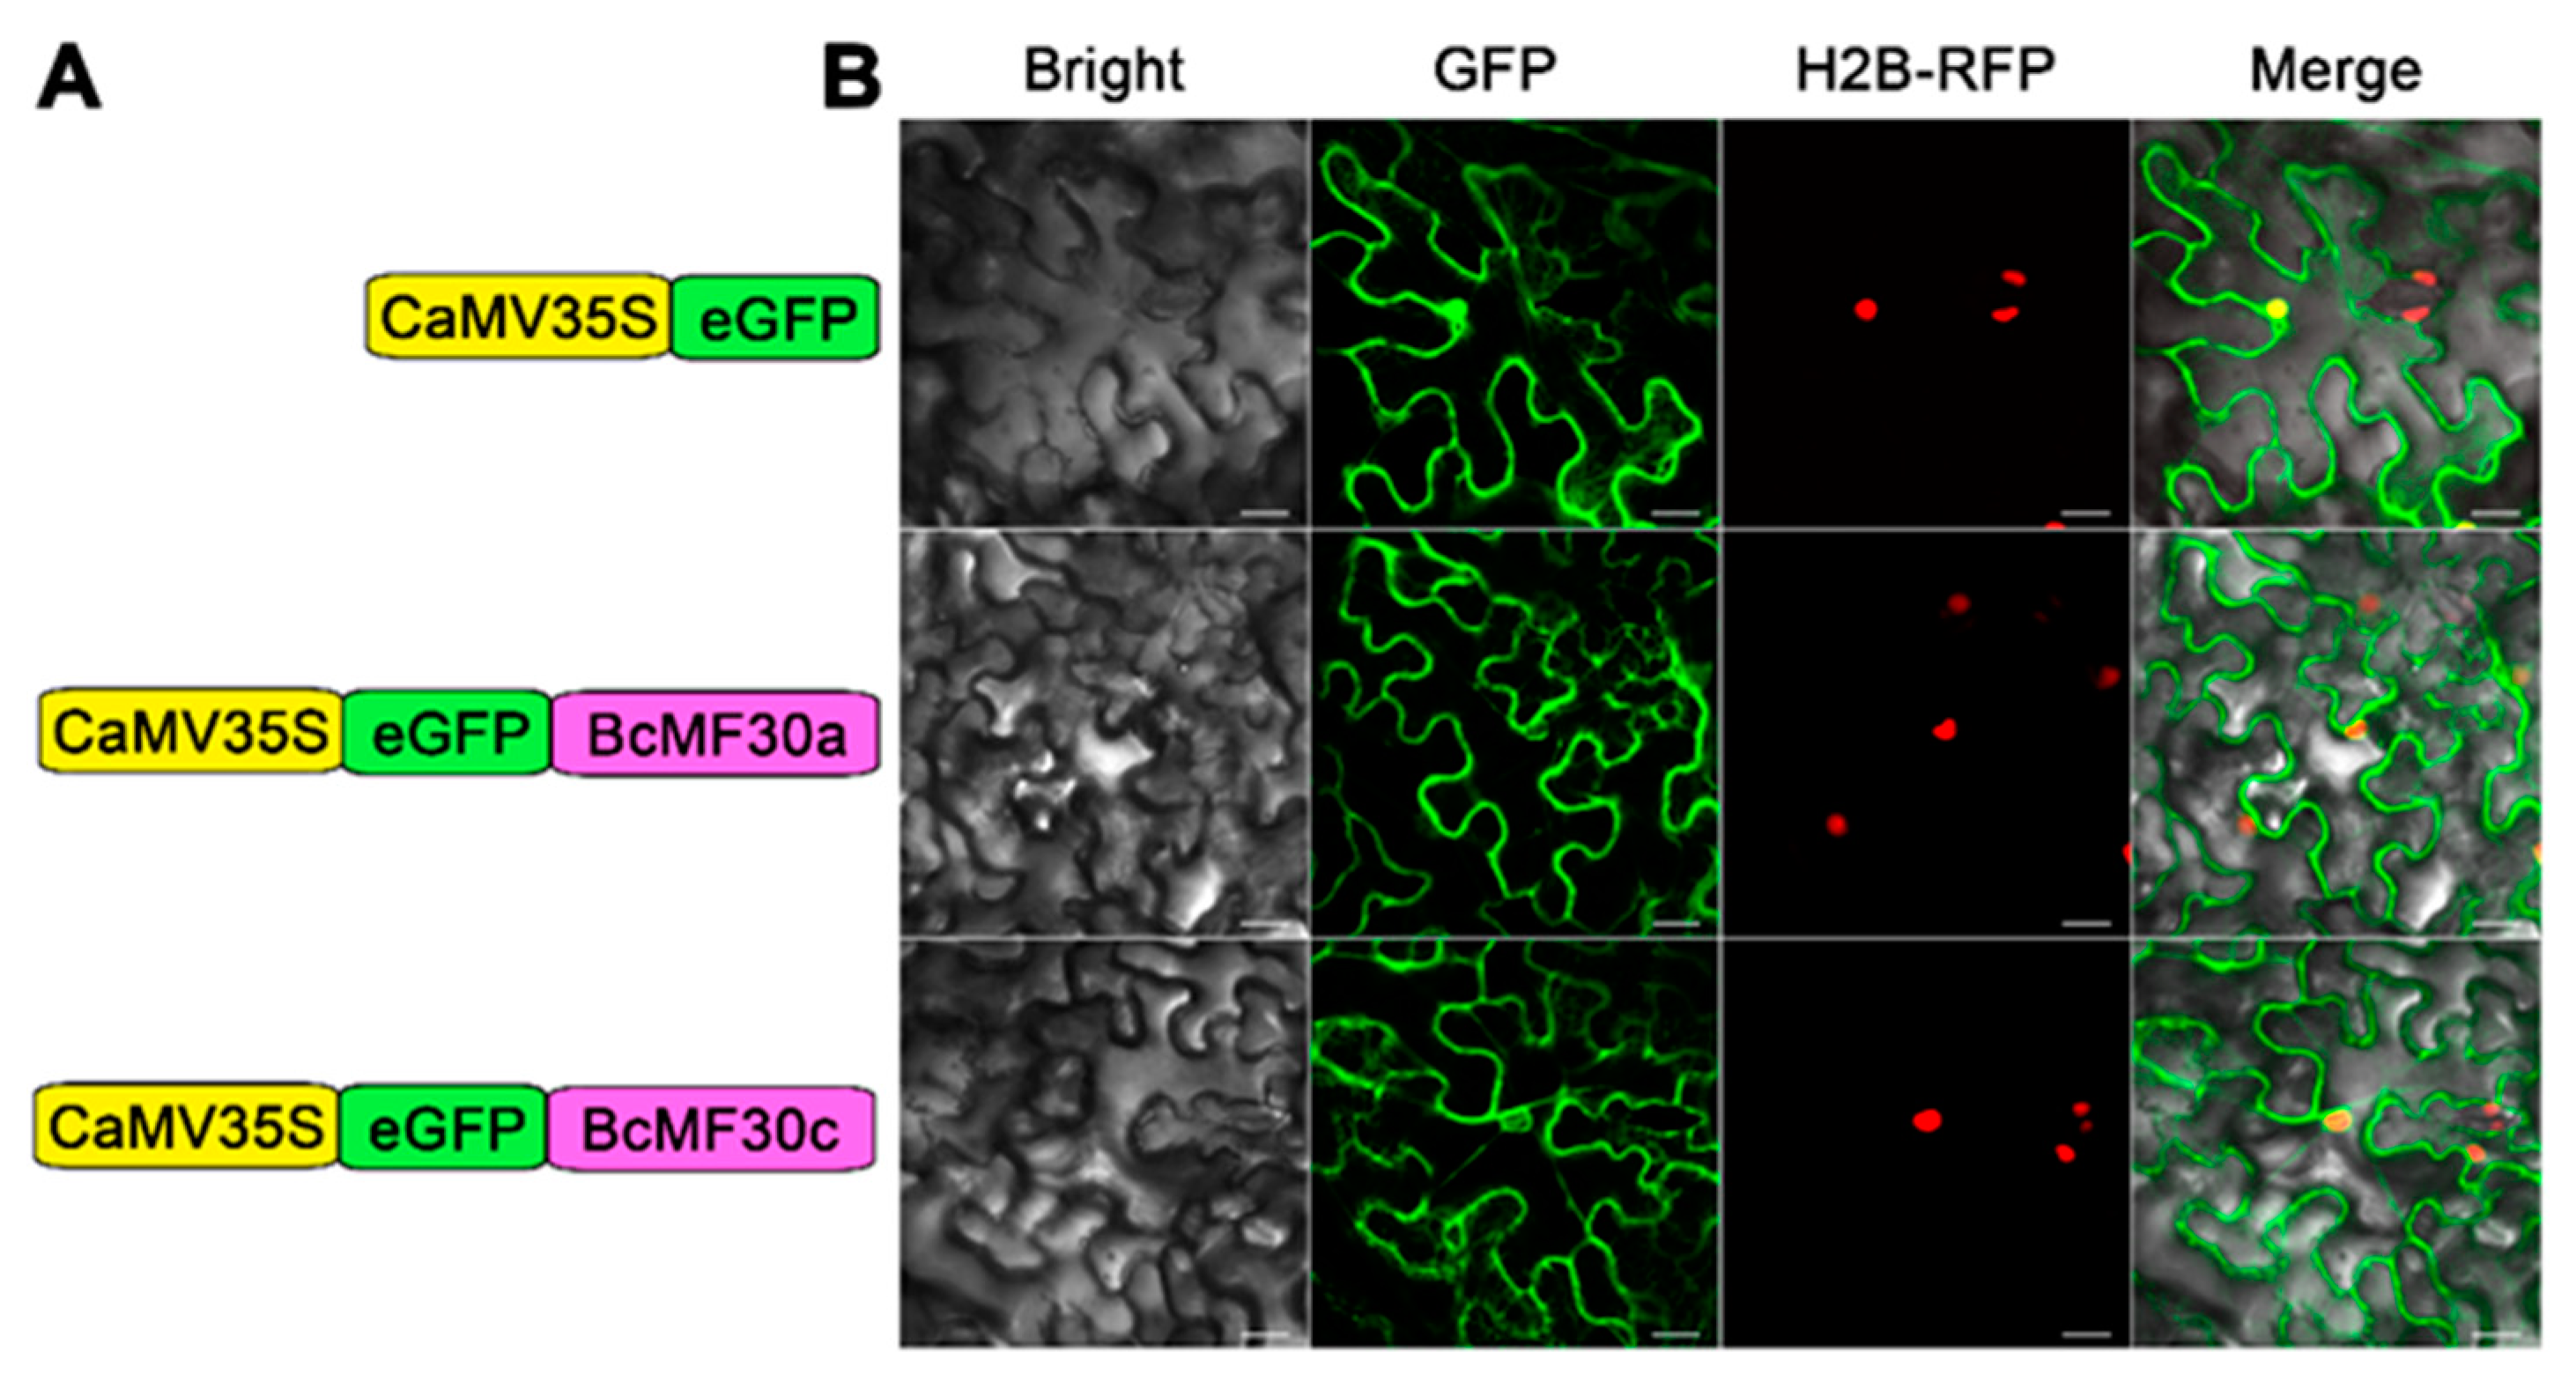
2.3. Transcriptional-Activation Assay and Subcellular Localization of BcMF30a and BcMF30c
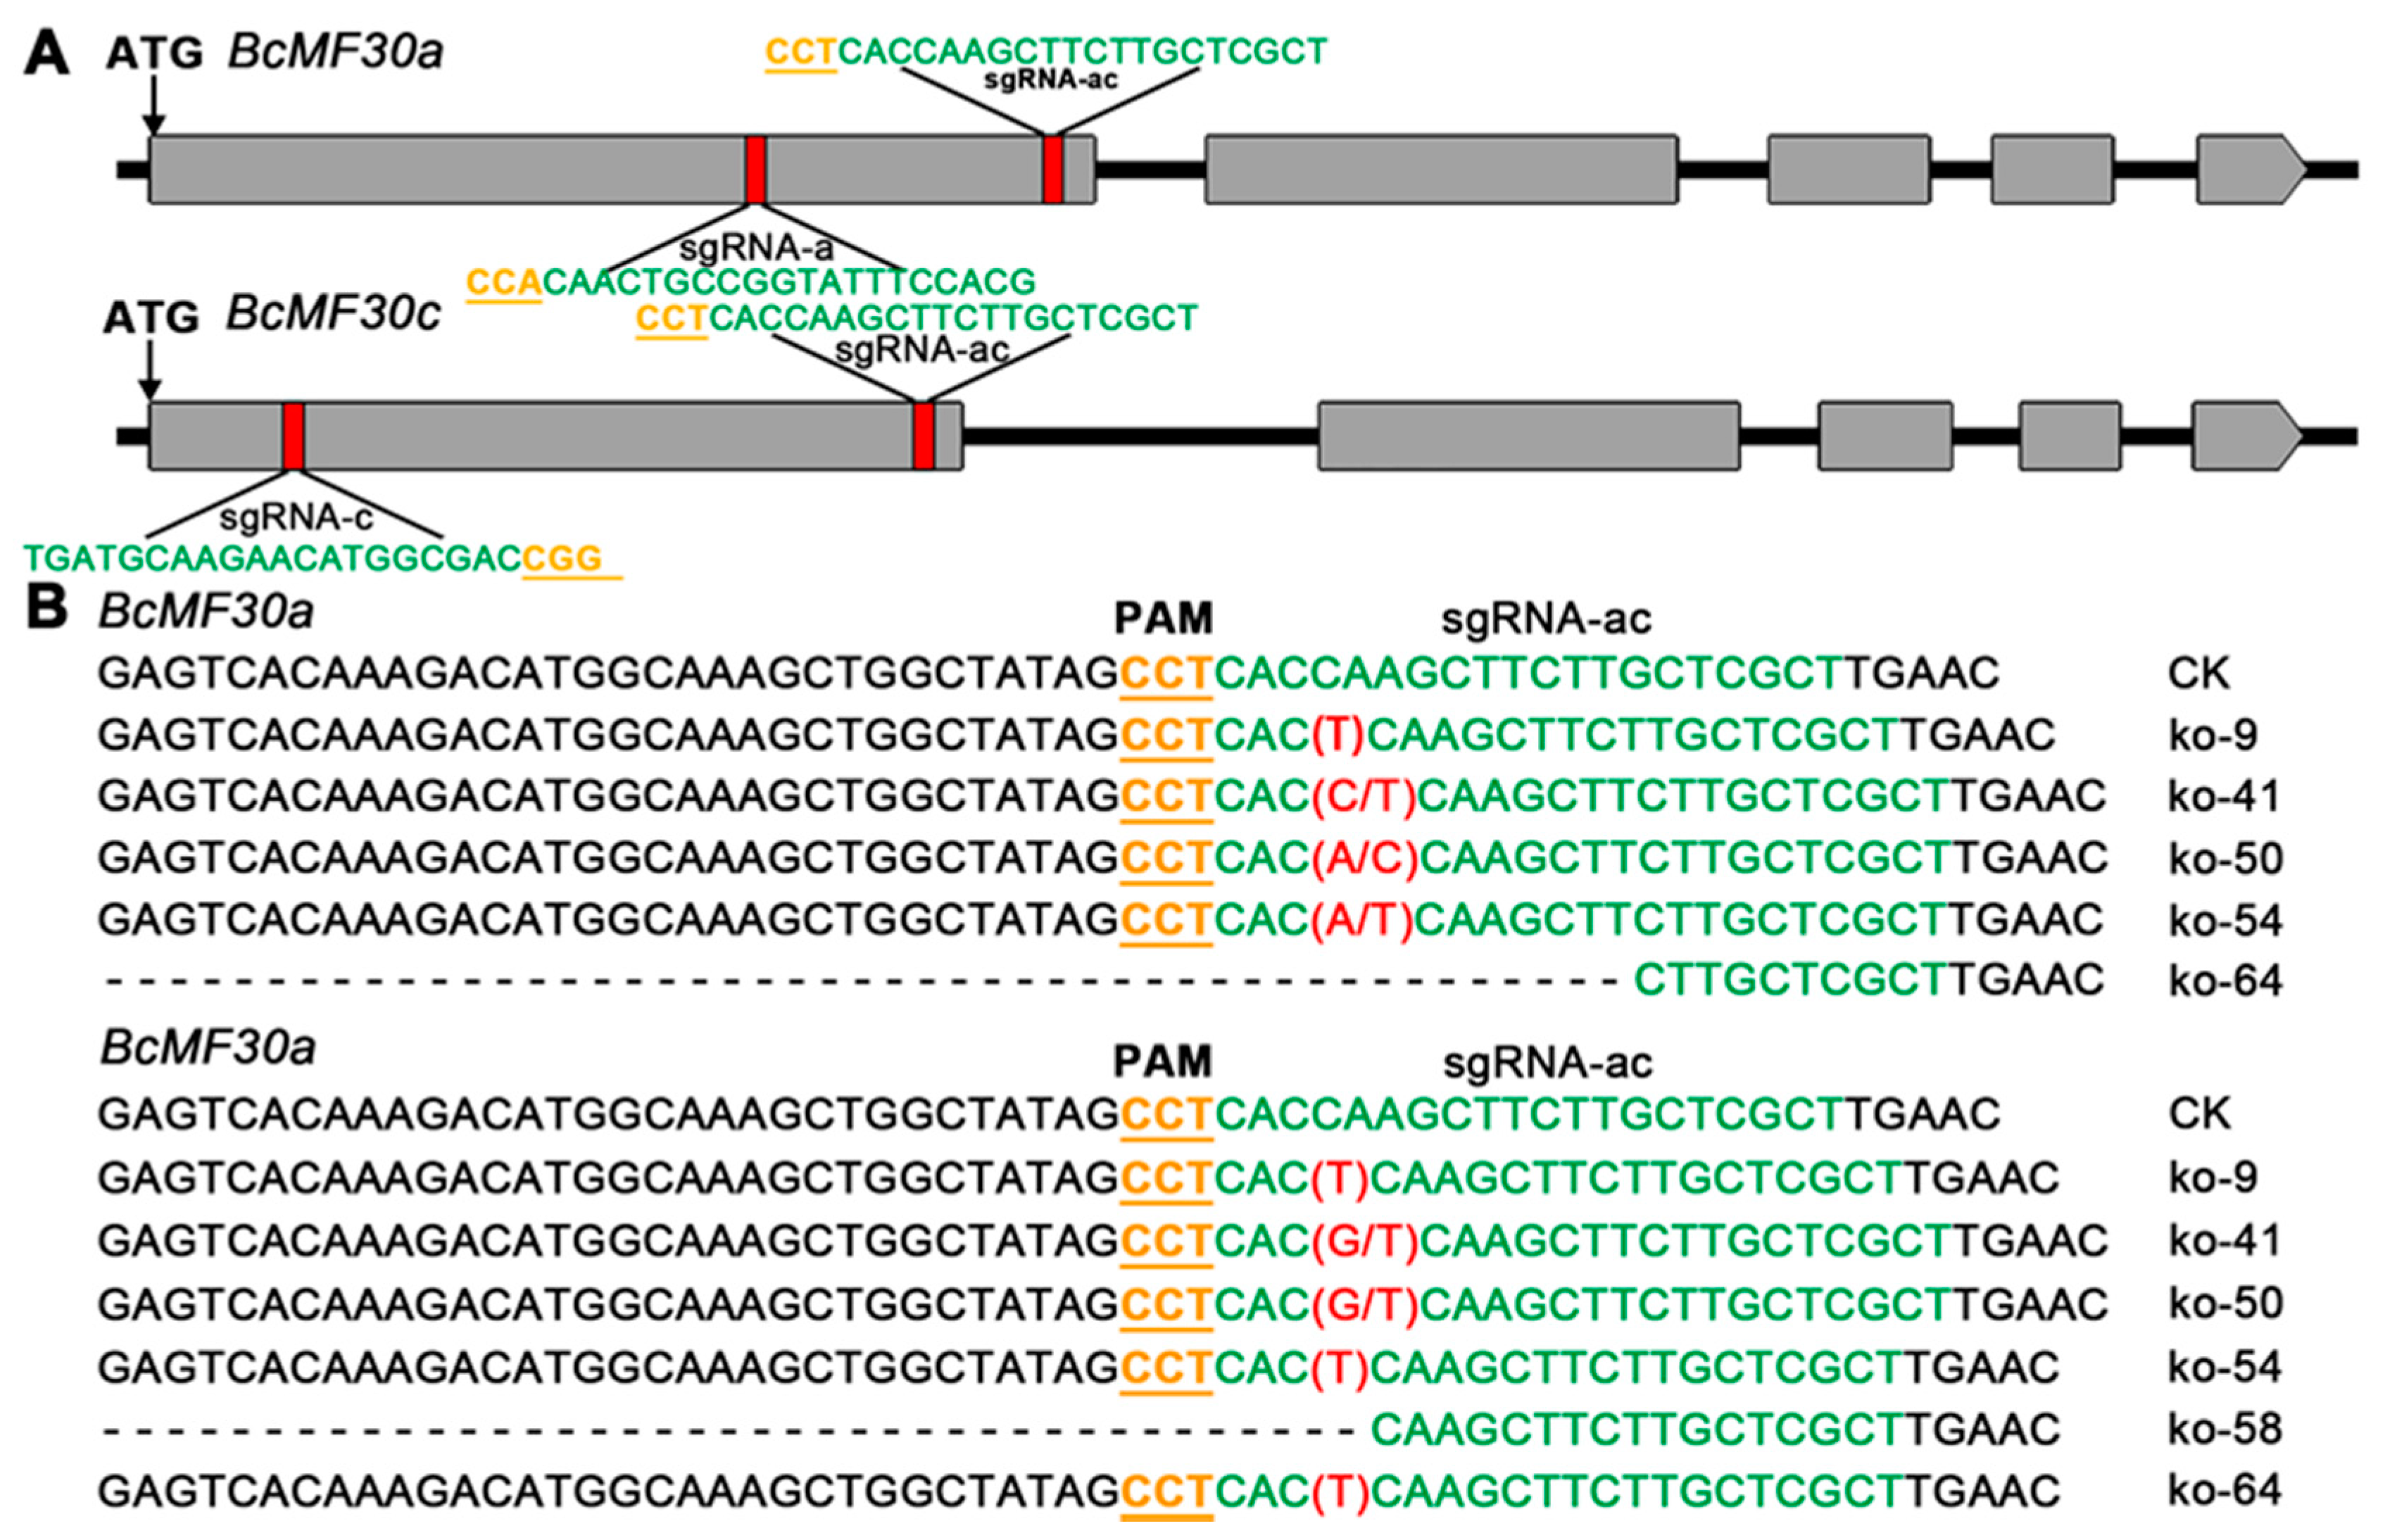
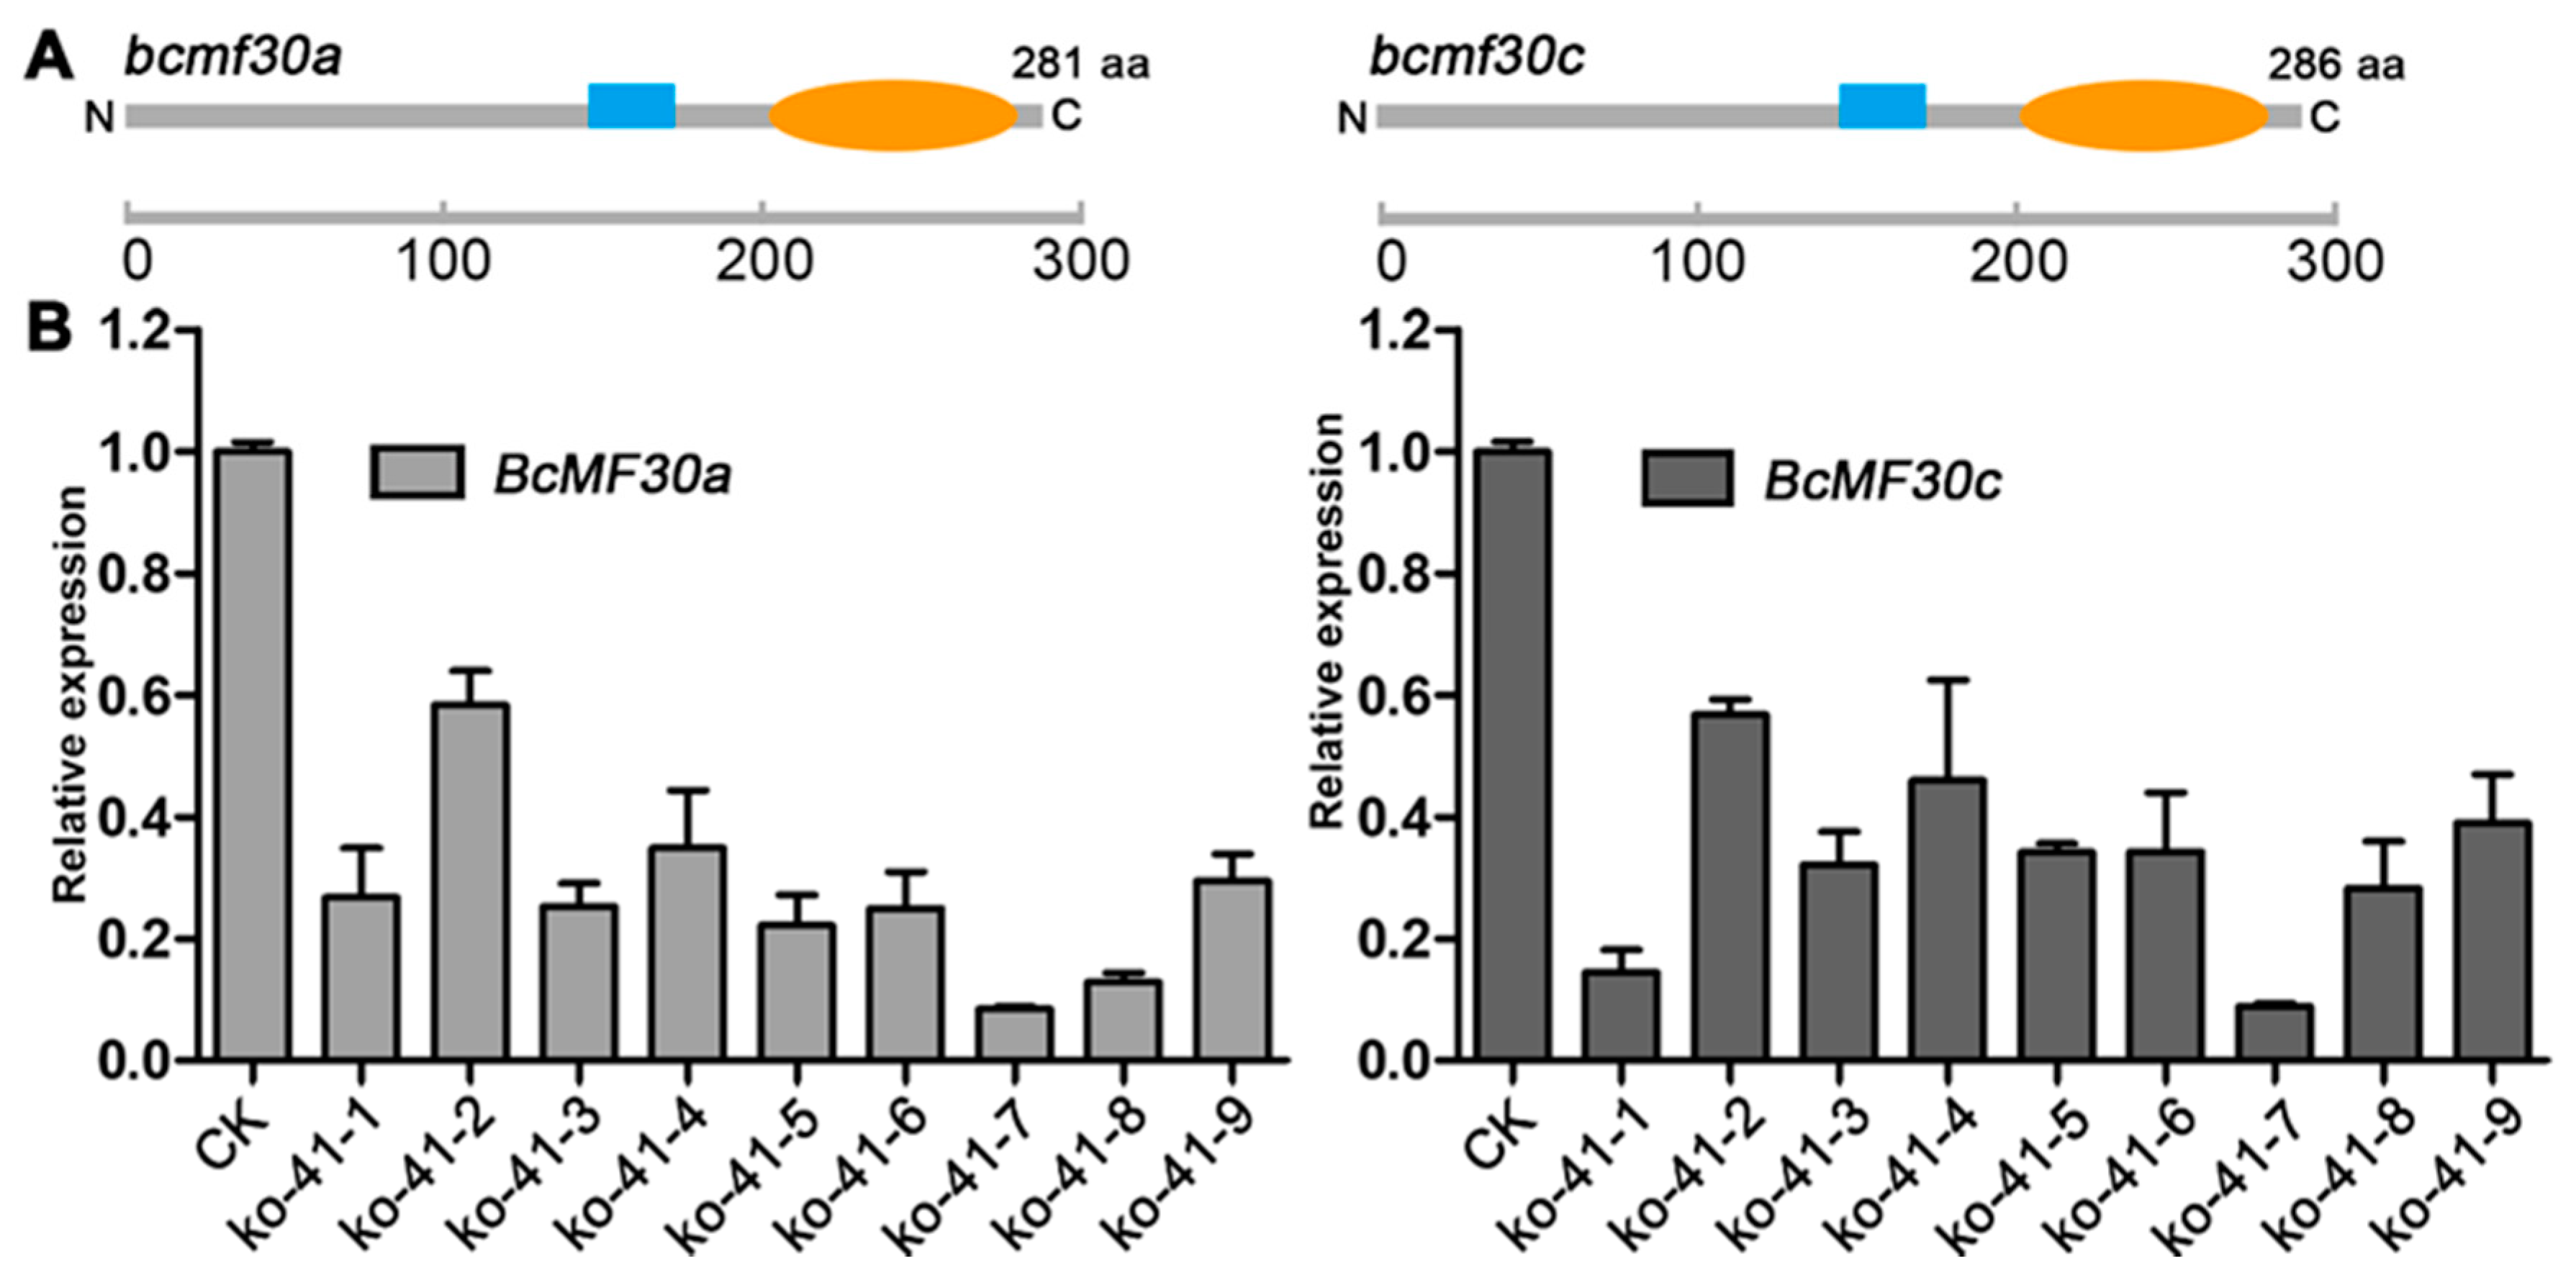
2.4. Construction of Knockout Mutant of Chinese Cabbage Based on CRISPR/Cas9 System
2.5. Mutations in BcMF30a and BcMF30c Do Not Affect Plant Vegetative Growth and Flower Formation
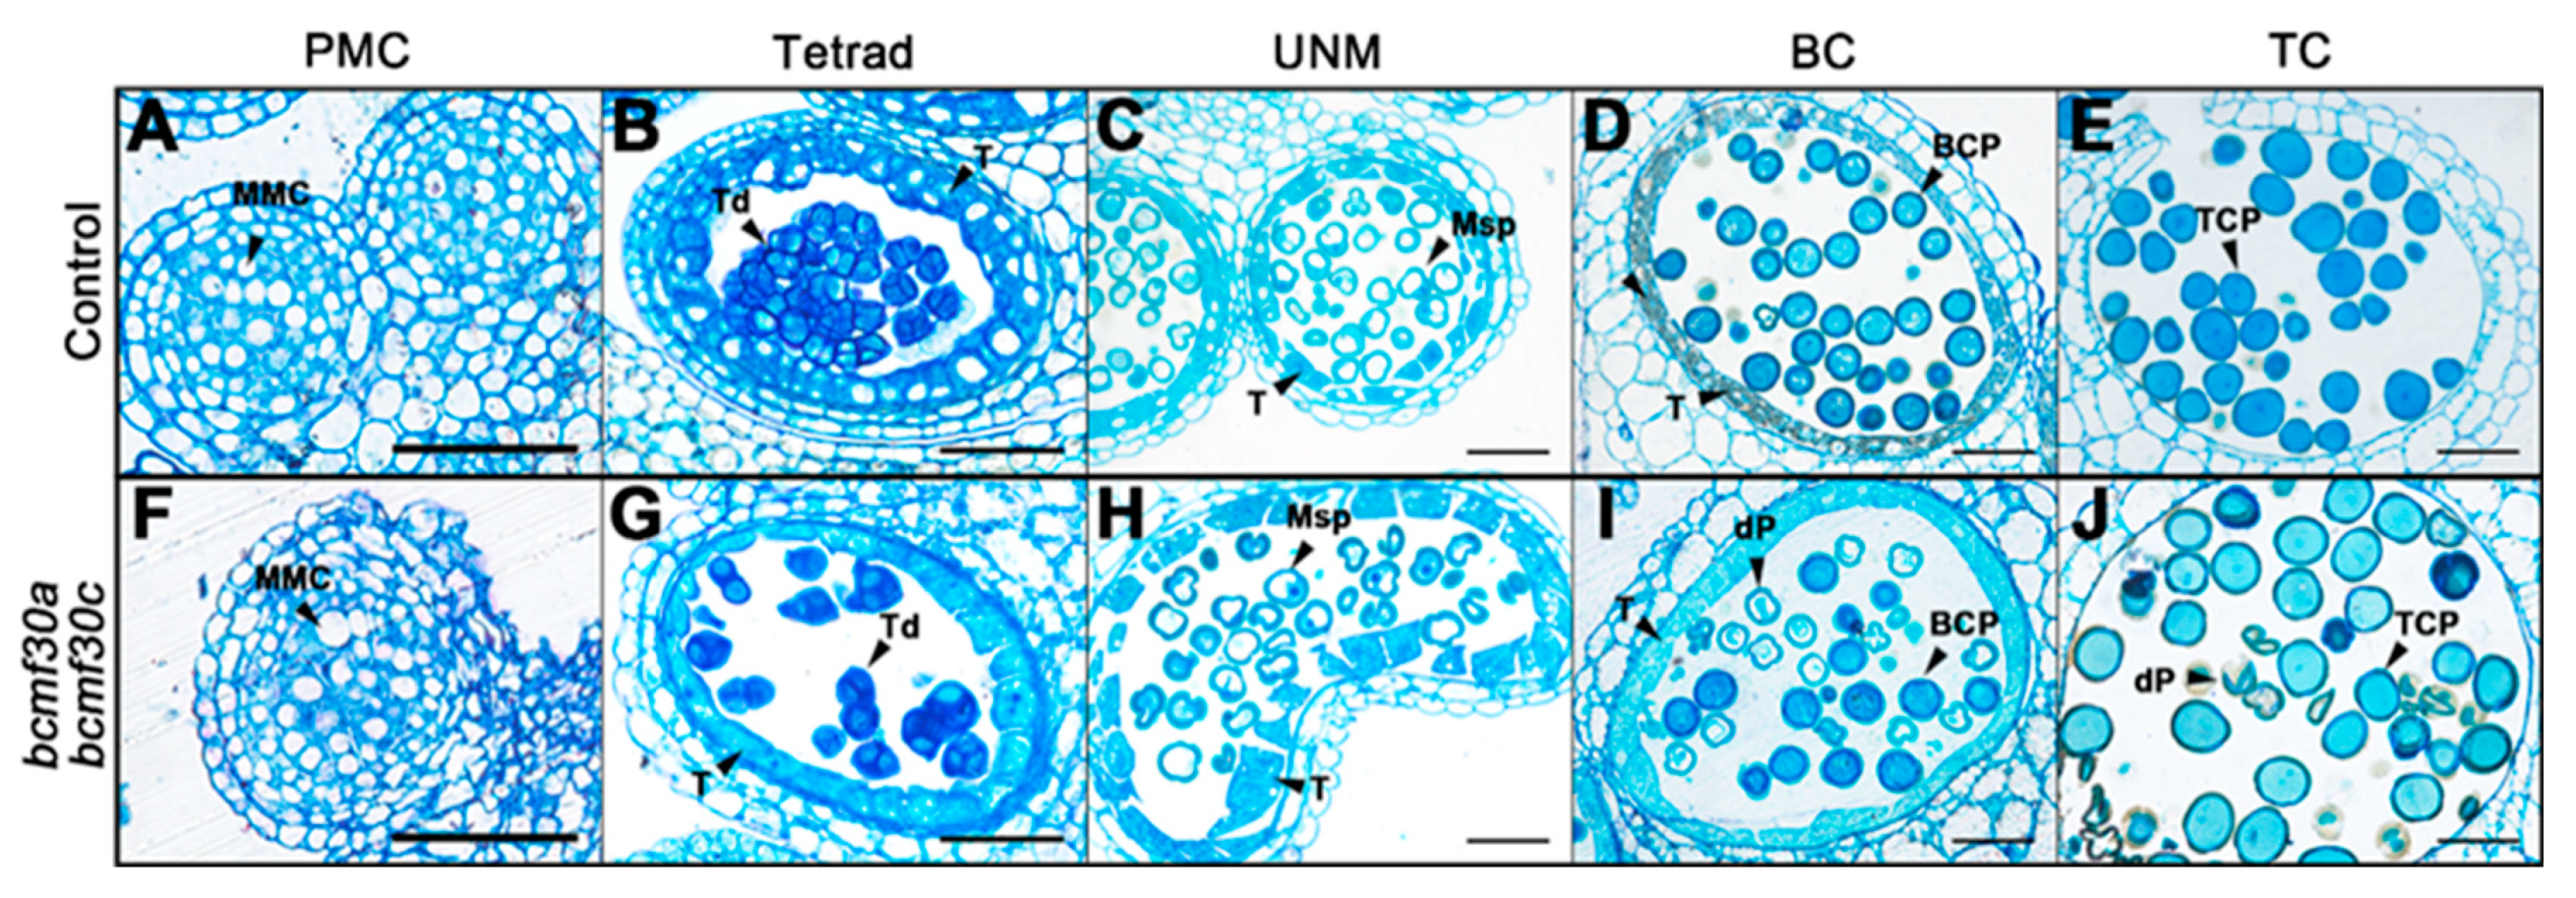
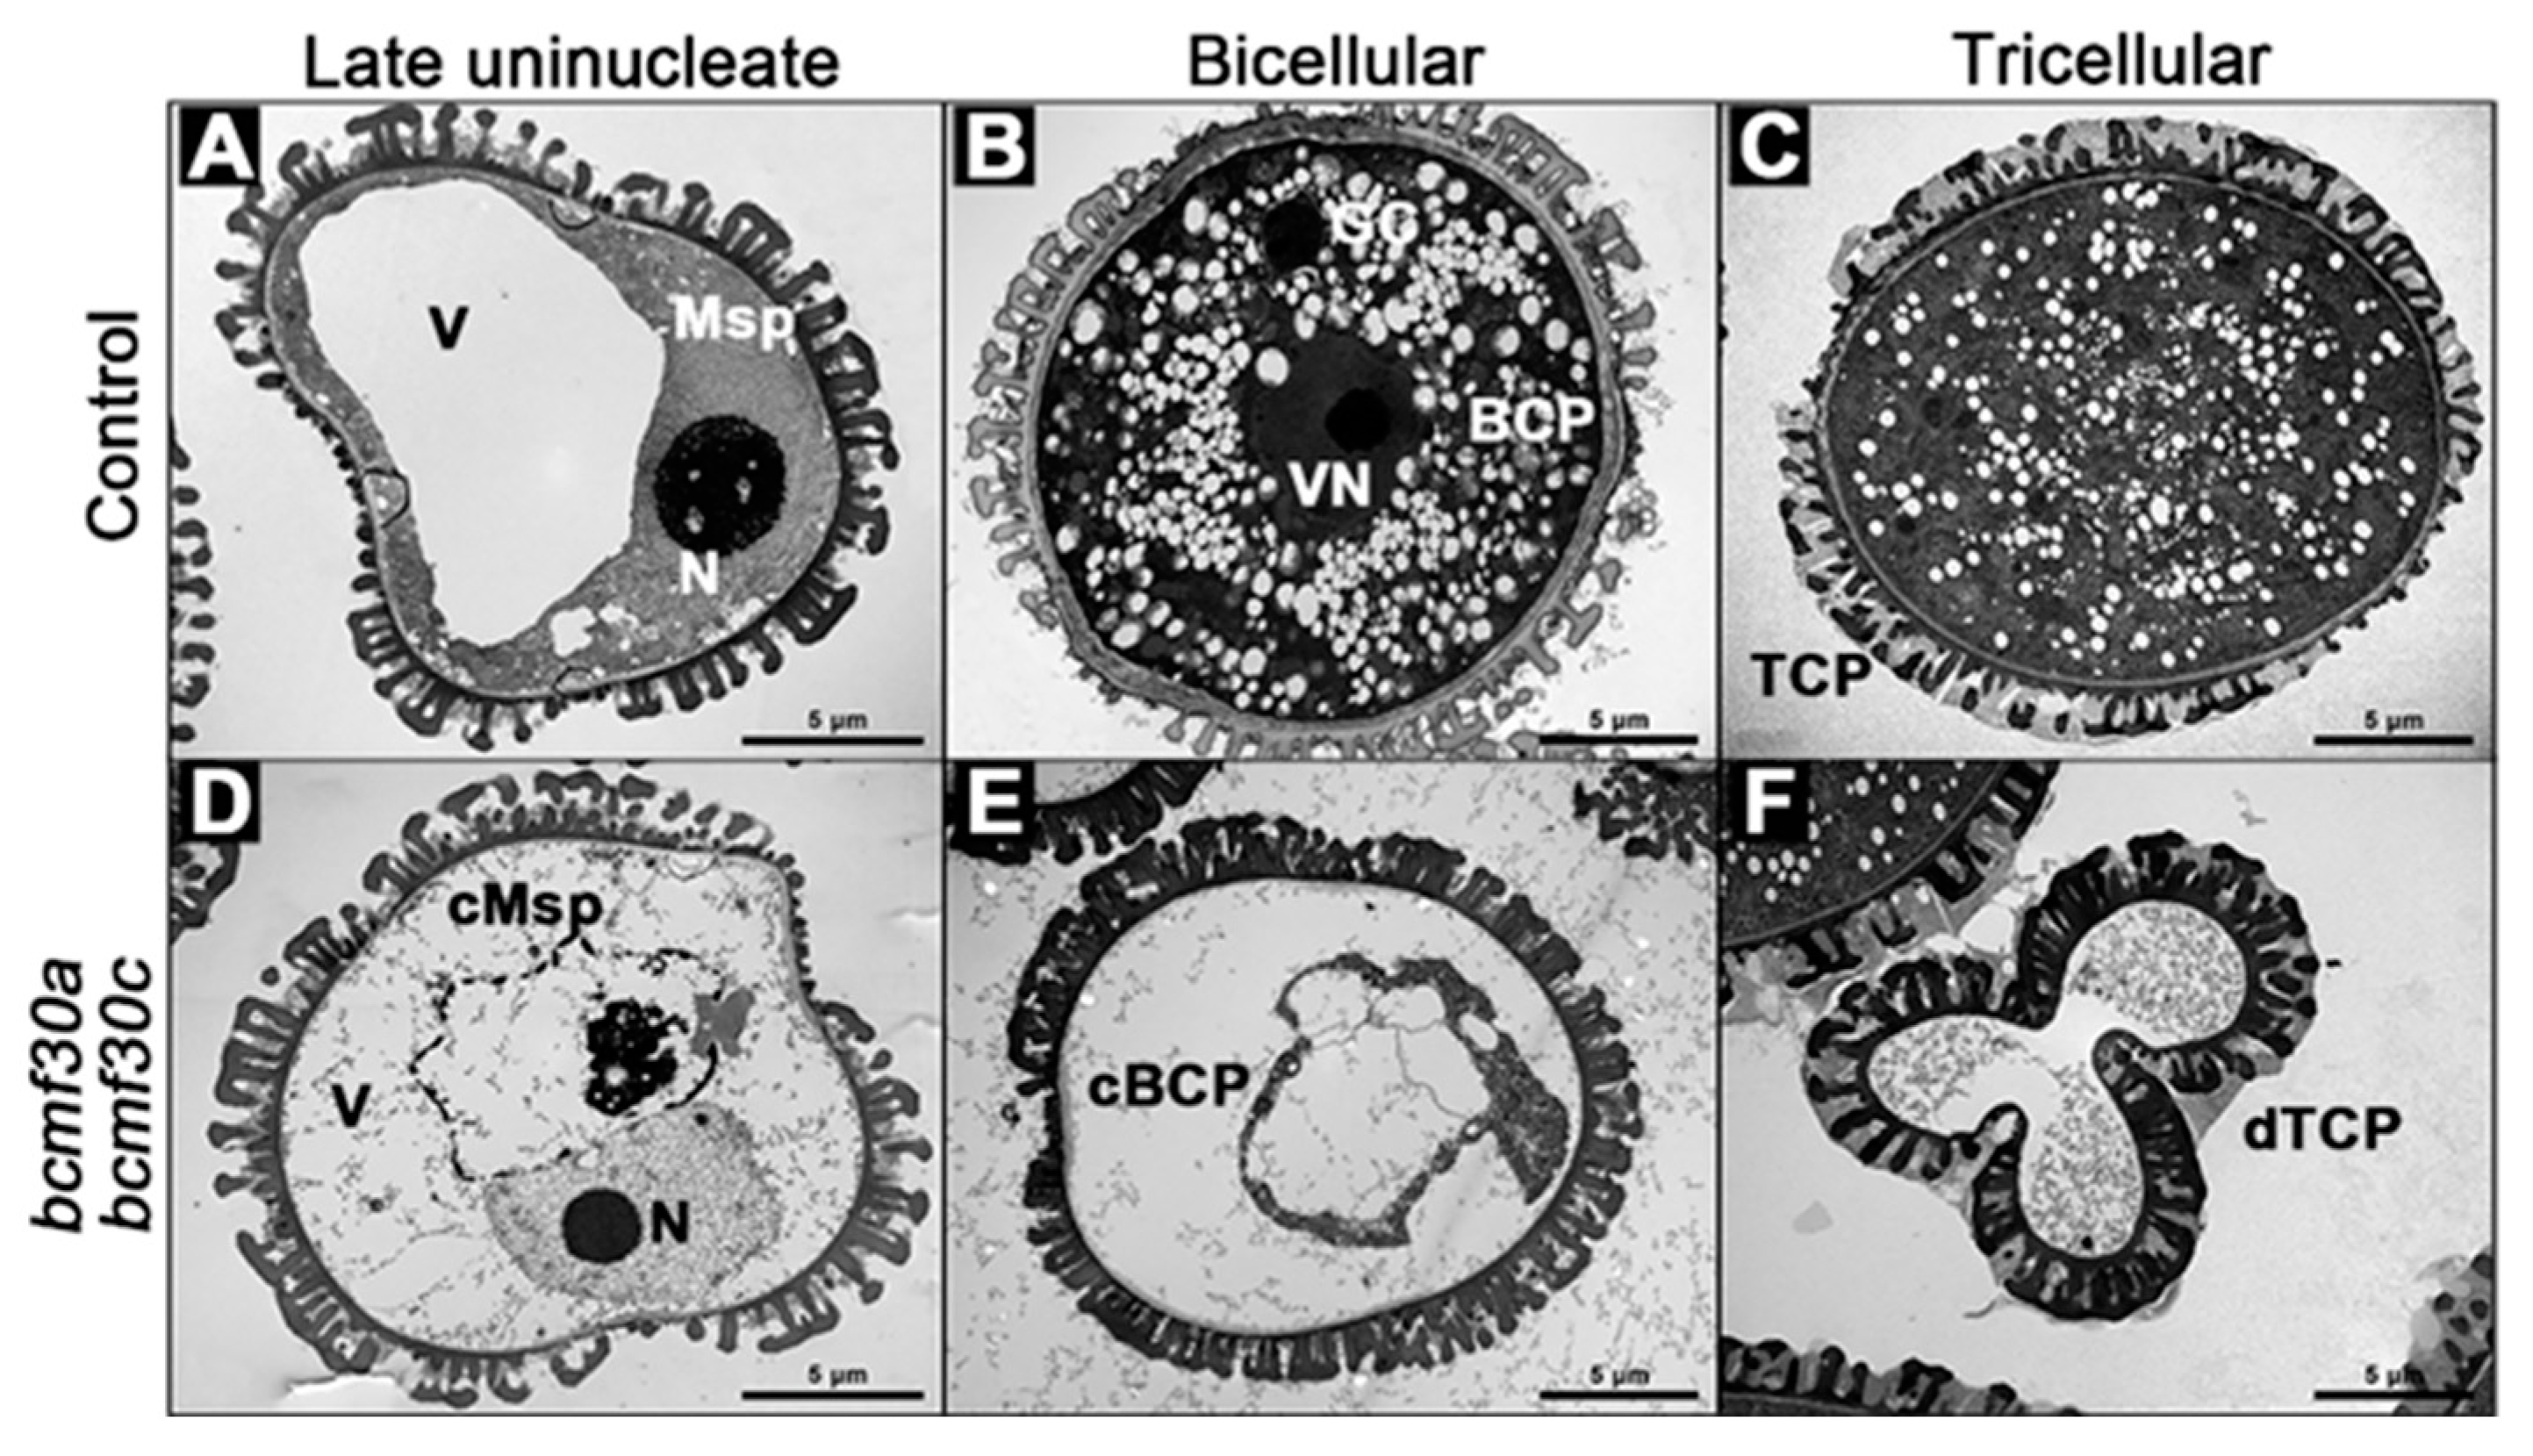
2.6. bcmf30a bcmf30c Exhibits Partial Male Sterility
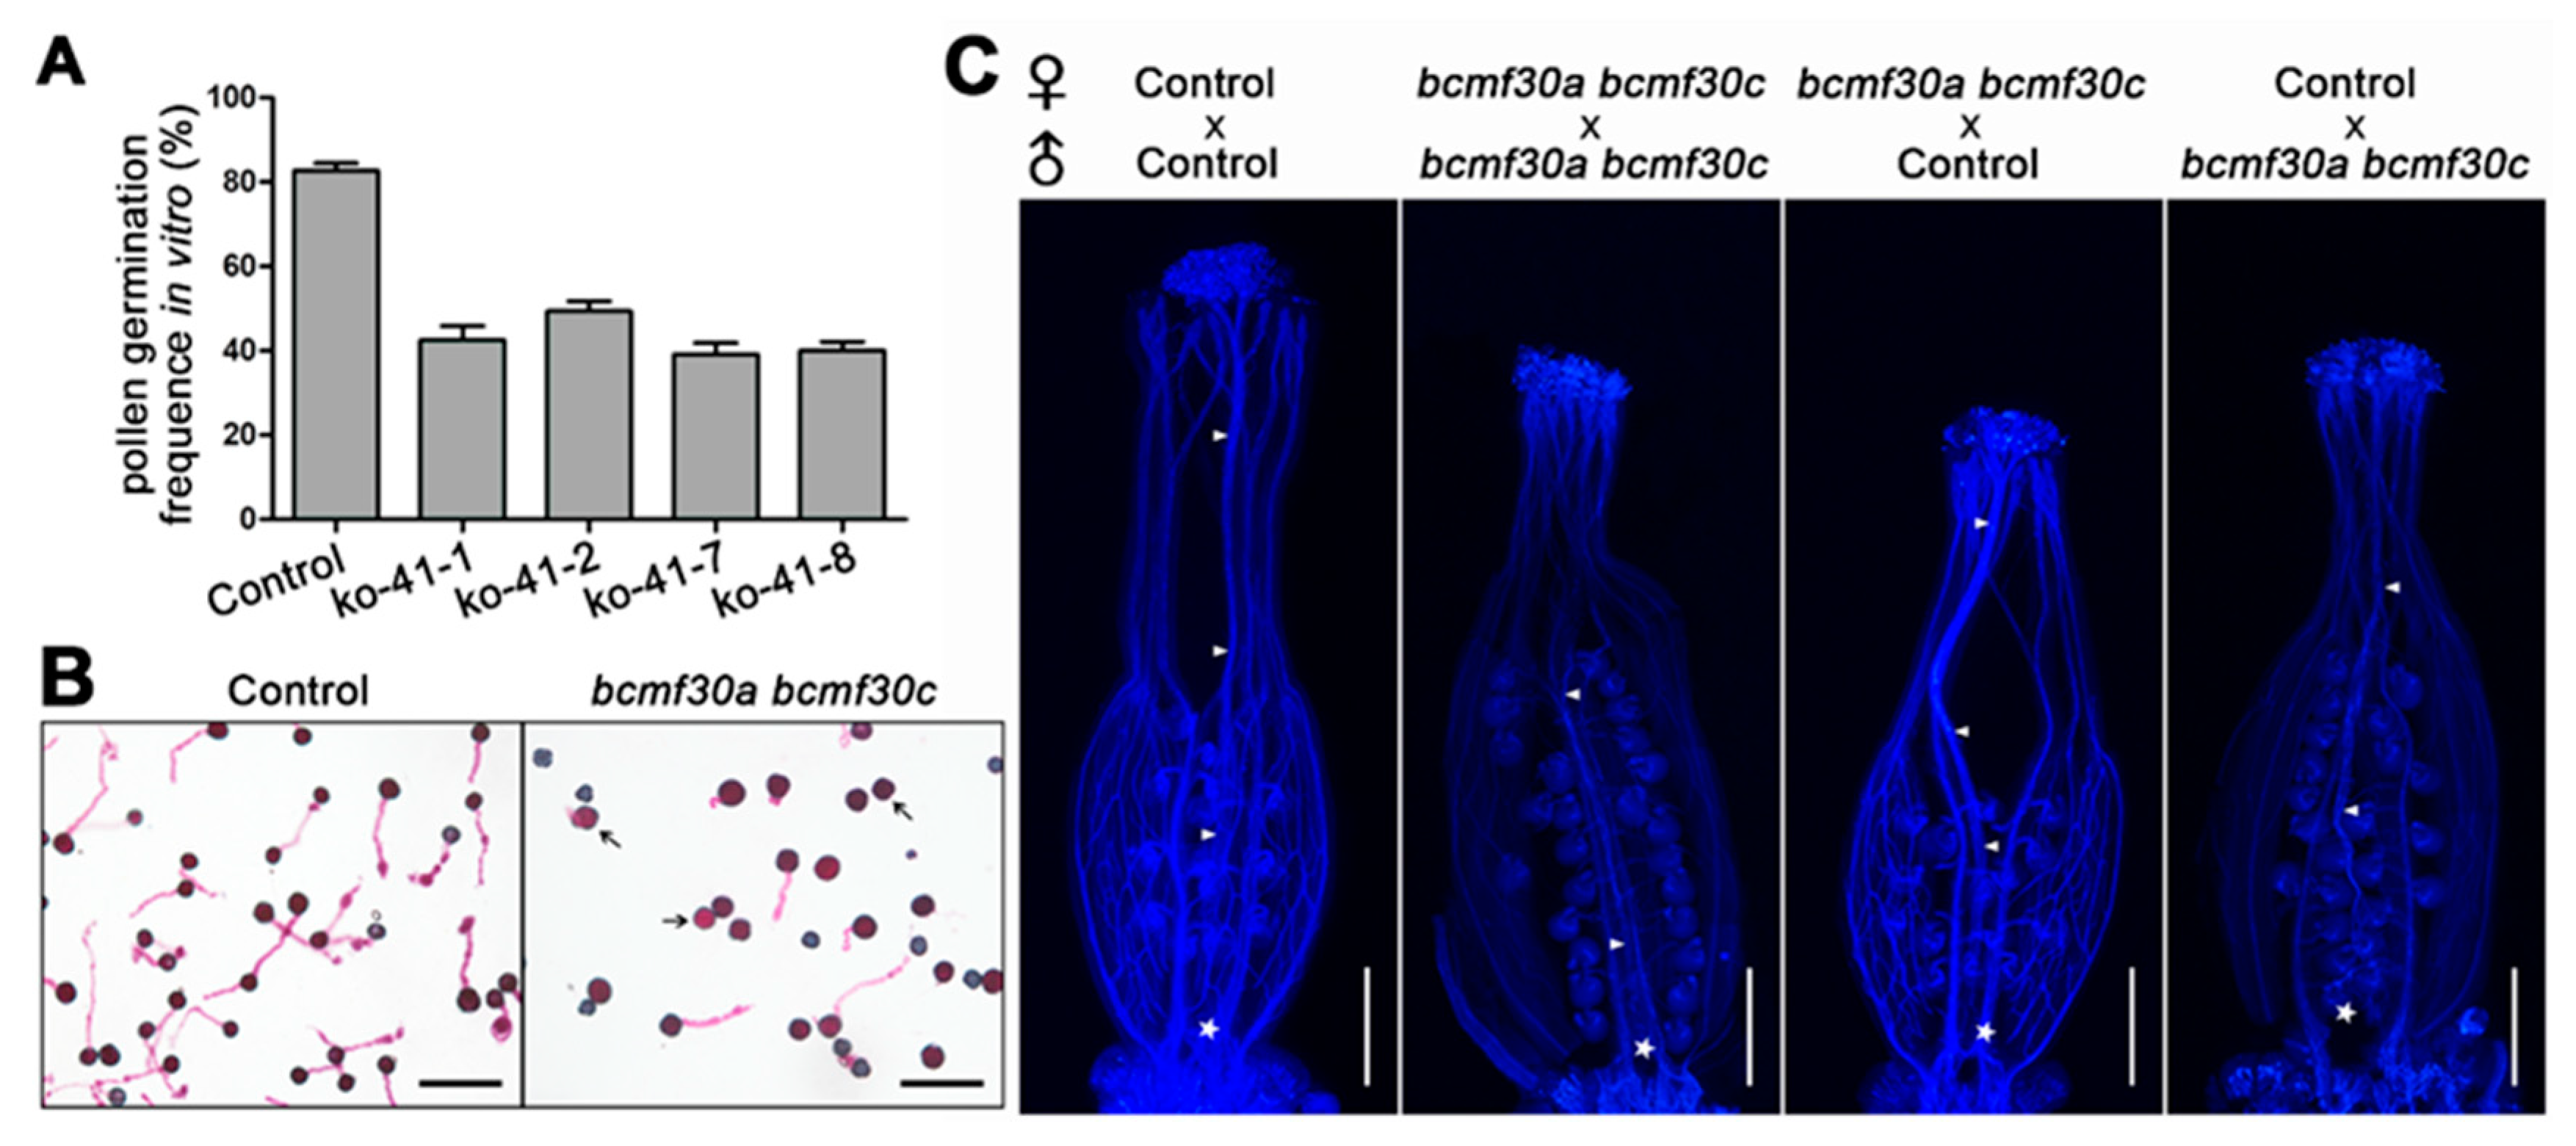
2.7. Pollen Germination Were Significantly Affected in bcmf30a bcmf30c
3. Discussion
3.1. Male Fertility-Related CCCH Zinc-Finger Protein Genes in B. campestris
3.2. BcMF30a and BcMF30c, Two Novel Non-TZF Proteins, May Play a Dual Role in Plant Cells
3.3. BcMF30a and BcMF30c Are Required for Microgametogenesis and Pollen Germination
4. Materials and Methods
4.1. Plant Material and Growth Conditions
4.2. Expression Analysis of Male Fertility-Related CCCH Zinc-Finger Protein Genes in B. campestris
4.3. RT-PCR and qRT-PCR
4.4. β-Glucuronidase (GUS) Histochemical Staining Assay
4.5. Transcriptional Activation Assay in Yeast
4.6. Subcellular Localization
4.7. Construction of CRISPR/Cas9 Vectors and Generation of Mutants
4.8. Phenotypic and Cytological Observation of Pollen and Pollen Germination Assays
5. Conclusions
Supplementary Materials
Author Contributions
Funding
Conflicts of Interest
Abbreviations
| ABA | abscisic acid |
| bp | base pair |
| GA | gibberellin |
| CaMV | cauliflower mosaic virus |
| CCCH | Cysteine-cysteine-cysteine-histidine |
| CRISPR/Cas9 | complementation and clustered regularly interspaced short palindromic repeat/CRISPR-associated 9 |
| GFP | green fluorescent protein |
| GMS | genetic male sterile |
| GUS | β-glucuronidase |
| LOTUS | Limkain, Oskar, and TUdor-containing proteins 5 and 7 |
| PAM | protospacer adjacent motif |
| PCR | polymerase chain reaction |
| PMI | pollen mitosis I |
| PMII | pollen mitosis II |
| Pre-mRNA | precursor messenger RNA |
| qRT-PCR | quantitative reverse transcriptase polymerase chain reaction |
| RNA-seq | RNA sequencing |
| RRM | RNA recognition motif |
| SEM | scanning electron microscopy |
| TEM | transmission electron microscopy |
| TZF | tandem CCCH zinc-finger |
References
- Takatsuji, H. Zinc-finger proteins: The classical zinc finger emerges in contemporary plant science. Plant Mol. Biol. 1999, 39, 1073–1078. [Google Scholar] [CrossRef] [PubMed]
- Ciftci-Yilmaz, S.; Mittler, R. The zinc finger network of plants. Cell. Mol. Life Sci. 2008, 65, 1150–1160. [Google Scholar] [CrossRef] [PubMed]
- Laity, J.H.; Lee, B.M.; Wright, P.E. Zinc finger proteins: New insights into structural and functional diversity. Curr. Opin. Struct. Biol. 2001, 11, 39–46. [Google Scholar] [CrossRef]
- Hall, T.M.T. Multiple modes of RNA recognition by zinc finger proteins. Curr. Opin. Struct. Biol. 2005, 15, 367–373. [Google Scholar] [CrossRef] [PubMed]
- Wang, D.; Guo, Y.; Wu, C.; Yang, G.; Li, Y.; Zheng, C. Genome-wide analysis of CCCH zinc finger family in Arabidopsis and rice. BMC Genom. 2008, 9, 44. [Google Scholar] [CrossRef] [PubMed]
- Peng, X.; Zhao, Y.; Cao, J.; Zhang, W.; Jiang, H.; Li, X.; Ma, Q.; Zhu, S.; Cheng, B. CCCH-type zinc finger family in maize: Genome-wide identification, classification and expression profiling under abscisic acid and drought treatments. PLoS ONE 2012, 7, e40120. [Google Scholar] [CrossRef]
- Yuan, S.; Xu, B.; Zhang, J.; Xie, Z.; Cheng, Q.; Yang, Z.; Cai, Q.; Huang, B. Comprehensive analysis of CCCH-type zinc finger family genes facilitates functional gene discovery and reflects recent allopolyploidization event in tetraploid switchgrass. BMC Genom. 2015, 16, 129. [Google Scholar] [CrossRef]
- Kramer, S.; Kimblin, N.C.; Carrington, M. Genome-wide in silico screen for CCCH-type zinc finger proteins of Trypanosoma brucei, Trypanosoma cruzi and Leishmania major. BMC Genom. 2010, 11, 283. [Google Scholar] [CrossRef]
- Xu, R. Genome-wide analysis and identification of stress-responsive genes of the CCCH zinc finger family in Solanum lycopersicum. Mol. Genet. Genom. 2014, 289, 965–979. [Google Scholar] [CrossRef]
- Pradhan, S.; Kant, C.; Verma, S.; Bhatia, S. Genome-wide analysis of the CCCH zinc finger family identifies tissue specific and stress responsive candidates in chickpea (Cicer arietinum L.). PLoS ONE 2017, 12, e0180469. [Google Scholar] [CrossRef]
- Pi, B.; He, X.; Ruan, Y.; Jang, J.-C.; Huang, Y. Genome-wide analysis and stress-responsive expression of CCCH zinc finger family genes in Brassica rapa. BMC Plant Biol. 2018, 18, 373. [Google Scholar] [CrossRef]
- Rameneni, J.J.; Dhandapani, V.; Paul, P.; Devaraj, S.P.; Choi, S.R.; Yi, S.Y.; Kim, M.-S.; Hong, S.; Oh, S.H.; Oh, M.-H.; et al. Comprehensive analysis of CCCH zinc-finger-type transcription factors in the Brassica rapa genome. Hortic. Environ. Biotechnol. 2018, 59, 729–747. [Google Scholar] [CrossRef]
- Pomeranz, M.C.; Hah, C.; Lin, P.-C.; Kang, S.G.; Finer, J.J.; Blackshear, P.J.; Jang, J.-C. The Arabidopsis tandem zinc finger protein AtTZF1 traffics between the nucleus and cytoplasmic foci and binds both DNA and RNA. Plant Physiol. 2010, 152, 151–165. [Google Scholar] [CrossRef]
- Bogamuwa, S.P.; Jang, J.-C. Tandem CCCH zinc finger proteins in plant growth, development and stress response. Plant Cell Physiol. 2014, 55, 1367–1375. [Google Scholar] [CrossRef]
- Jang, J.-C. Arginine-rich motif-tandem CCCH zinc finger proteins in plant stress responses and post-transcriptional regulation of gene expression. Plant Sci. 2016, 252, 118–124. [Google Scholar] [CrossRef]
- Li, Z.; Thomas, T.L. PEI1, an embryo-specific zinc finger protein gene required for heart-stage embryo formation in Arabidopsis. Plant Cell 1998, 10, 383–398. [Google Scholar] [CrossRef]
- Lin, P.-C.; Pomeranz, M.C.; Jikumaru, Y.; Kang, S.G.; Hah, C.; Fujioka, S.; Kamiya, Y.; Jang, J.-C. The Arabidopsis tandem zinc finger protein AtTZF1 affects ABA- and GA-mediated growth, stress and gene expression responses. Plant J. 2011, 65, 253–268. [Google Scholar] [CrossRef]
- Bogamuwa, S.; Jang, J.-C. The Arabidopsis tandem CCCH zinc finger proteins AtTZF4, 5 and 6 are involved in light-, abscisic acid- and gibberellic acid-mediated regulation of seed germination. Plant Cell Environ. 2013, 36, 1507–1519. [Google Scholar] [CrossRef]
- Yang, W.; Chen, Z.; Huang, Y.; Chang, G.; Li, P.; Wei, J.; Yuan, X.; Huang, J.; Hu, X. Powerdress as the novel regulator enhances Arabidopsis seeds germination tolerance to high temperature stress by histone modification of SOM locus. Plant Sci. 2019, 284, 91–98. [Google Scholar] [CrossRef]
- Lu, P.; Chai, M.; Yang, J.; Ning, G.; Wang, G.; Ma, H. The Arabidopsis CALLOSE DEFECTIVE MICROSPORE1 gene is required for male fertility through regulating callose metabolism during microsporogenesis. Plant Physiol. 2014, 164, 1893–1904. [Google Scholar] [CrossRef]
- Chai, G.; Kong, Y.; Zhu, M.; Yu, L.; Qi, G.; Tang, X.; Wang, Z.; Cao, Y.; Yu, C.; Zhou, G. Arabidopsis C3H14 and C3H15 have overlapping roles in the regulation of secondary wall thickening and anther development. J. Exp. Bot. 2015, 66, 2595–2609. [Google Scholar] [CrossRef]
- Kong, Z.; Li, M.; Yang, W.; Xu, W.; Xue, Y. A novel nuclear-localized CCCH-type zinc finger protein, OsDOS, is involved in delaying leaf senescence in rice. Plant Physiol. 2006, 141, 1376–1388. [Google Scholar] [CrossRef]
- Jan, A.; Maruyama, K.; Todaka, D.; Kidokoro, S.; Abo, M.; Yoshimura, E.; Shinozaki, K.; Nakashima, K.; Yamaguchi-Shinozaki, K. OsTZF1, a CCCH-tandem zinc finger protein, confers delayed senescence and stress tolerance in rice by regulating stress-related genes. Plant Physiol. 2013, 161, 1202–1216. [Google Scholar] [CrossRef]
- Chen, Y.; Sun, A.; Wang, M.; Zhu, Z.; Ouwerkerk, P.B.F. Functions of the CCCH type zinc finger protein OsGZF1 in regulation of the seed storage protein GluB-1 from rice. Plant Mol. Biol. 2014, 84, 621–634. [Google Scholar] [CrossRef]
- Zhang, D.; Xu, Z.; Cao, S.; Chen, K.; Li, S.; Liu, X.; Gao, C.; Zhang, B.; Zhou, Y. An uncanonical CCCH-tandem zinc-finger protein represses secondary wall synthesis and controls mechanical strength in rice. Mol. Plant. 2018, 11, 163–174. [Google Scholar] [CrossRef]
- Zhang, C.; Shen, Y.; Tang, D.; Shi, W.; Zhang, D.; Du, G.; Zhou, Y.; Liang, G.; Li, Y.; Cheng, Z. The zinc finger protein DCM1 is required for male meiotic cytokinesis by preserving callose in rice. PLoS Genet. 2018, 14, e1007769. [Google Scholar] [CrossRef]
- Lee, S.-j.; Jung, H.J.; Kang, H.; Kim, S.Y. Arabidopsis zinc finger proteins AtC3H49/AtTZF3 and AtC3H20/AtTZF2 are involved in ABA and JA responses. Plant Cell Physiol. 2012, 53, 673–686. [Google Scholar] [CrossRef]
- Wang, W.; Liu, B.; Xu, M.; Jamil, M.; Wang, G. ABA-induced CCCH tandem zinc finger protein OsC3H47 decreases ABA sensitivity and promotes drought tolerance in Oryza sativa. Biochem. Biophys. Res. Commun. 2015, 464, 33–37. [Google Scholar] [CrossRef]
- Maldonado-Bonilla, L.D.; Eschen-Lippold, L.; Gago-Zachert, S.; Tabassum, N.; Bauer, N.; Scheel, D.; Lee, J. The Arabidopsis tandem zinc finger 9 protein binds RNA and mediates pathogen-associated molecular pattern-triggered immune responses. Plant Cell Physiol. 2014, 55, 412–425. [Google Scholar] [CrossRef]
- Tabassum, N.; Eschen-Lippold, L.; Athmer, B.; Baruah, M.; Brode, M.; Maldonado-Bonilla, L.D.; Hoehenwarter, W.; Hause, G.; Scheel, D.; Lee, J. Phosphorylation-dependent control of an RNA granule-localized protein that fine-tunes defence gene expression at a post-transcriptional level. Plant J. 2020, 101, 1023–1039. [Google Scholar] [CrossRef]
- Guo, Y.-H.; Yu, Y.-P.; Wang, D.; Wu, C.-A.; Yang, G.-D.; Huang, J.-G.; Zheng, C.-C. GhZFP1, a novel CCCH-type zinc finger protein from cotton, enhances salt stress tolerance and fungal disease resistance in transgenic tobacco by interacting with GZIRD21A and GZIPR5. New Phytol. 2009, 183, 62–75. [Google Scholar] [CrossRef]
- Zhou, T.; Yang, X.; Wang, L.; Xu, J.; Zhang, X. GhTZF1 regulates drought stress responses and delays leaf senescence by inhibiting reactive oxygen species accumulation in transgenic Arabidopsis. Plant Mol. Biol. 2014, 85, 163–177. [Google Scholar] [CrossRef] [PubMed]
- Qiu, A.; Lei, Y.; Yang, S.; Wu, J.; Li, J.; Bao, B.; Cai, Y.; Wang, S.; Lin, J.; Wang, Y.; et al. CaC3H14 encoding a tandem CCCH zinc finger protein is directly targeted by CaWRKY40 and positively regulates the response of pepper to inoculation by Ralstonia solanacearum. Mol. Plant Pathol. 2018, 19, 2221–2235. [Google Scholar] [CrossRef] [PubMed]
- Chai, G.; Qi, G.; Cao, Y.; Wang, Z.; Yu, L.; Tang, X.; Yu, Y.; Wang, D.; Kong, Y.; Zhou, G. Poplar PdC3H17 and PdC3H18 are direct targets of PdMYB3 and PdMYB21, and positively regulate secondary wall formation in Arabidopsis and poplar. New Phytol. 2014, 203, 520–534. [Google Scholar] [CrossRef] [PubMed]
- Li, J.; Jia, D.; Chen, X. HUA1, a Regulator of Stamen and Carpel Identities in Arabidopsis, Codes for a Nuclear RNA Binding Protein. Plant Cell 2001, 13, 2269–2281. [Google Scholar] [CrossRef] [PubMed]
- Rodríguez-Cazorla, E.; Ripoll, J.J.; Andújar, A.; Bailey, L.J.; Martínez-Laborda, A.; Yanofsky, M.F.; Vera, A. K-homology nuclear ribonucleoproteins regulate floral organ identity and determinacy in Arabidopsis. PLoS Genet. 2015, 11, e1004983. [Google Scholar] [CrossRef]
- Seok, H.-Y.; Woo, D.-H.; Park, H.-Y.; Lee, S.-Y.; Tran, H.T.; Lee, E.-H.; Vu Nguyen, L.; Moon, Y.-H. AtC3H17, a non-tandem CCCH zinc finger protein, functions as a nuclear transcriptional activator and has pleiotropic effects on vegetative development, flowering and seed development in Arabidopsis. Plant Cell Physiol. 2016, 57, 603–615. [Google Scholar] [CrossRef]
- Seok, H.-Y.; Nguyen, L.V.; Park, H.-Y.; Tarte, V.N.; Ha, J.; Lee, S.-Y.; Moon, Y.-H. Arabidopsis non-TZF gene AtC3H17 functions as a positive regulator in salt stress response. Biochem. Biophys. Res. Commun. 2018, 498, 954–959. [Google Scholar] [CrossRef]
- Yan, Z.; Jia, J.; Yan, X.; Shi, H.; Han, Y. Arabidopsis KHZ1 and KHZ2, two novel non-tandem CCCH zinc-finger and K-homolog domain proteins, have redundant roles in the regulation of flowering and senescence. Plant Mol. Biol. 2017, 95, 549–565. [Google Scholar] [CrossRef]
- Yan, Z.; Shi, H.; Liu, Y.; Jing, M.; Han, Y. KHZ1 and KHZ2, novel members of the autonomous pathway, repress the splicing efficiency of FLC pre-mRNA in Arabidopsis. J. Exp. Bot. 2020, 71, 1375–1386. [Google Scholar] [CrossRef]
- Zhang, H.; Gao, X.; Zhi, Y.; Li, X.; Zhang, Q.; Niu, J.; Wang, J.; Zhai, H.; Zhao, N.; Li, J.; et al. A non-tandem CCCH-type zinc-finger protein, IbC3H18, functions as a nuclear transcriptional activator and enhances abiotic stress tolerance in sweet potato. New Phytol. 2019, 223, 1918–1936. [Google Scholar] [CrossRef]
- Huang, L.; Cao, J.; Ye, W.; Liu, T.; Jiang, L.; Ye, Y. Transcriptional differences between the male-sterile mutant bcms and wild-type Brassica campestris ssp. chinensis reveal genes related to pollen development. Plant Biol. 2008, 10, 342–355. [Google Scholar] [CrossRef] [PubMed]
- Huang, L.; Ye, W.-Z.; Liu, T.-T.; Cao, J.-S. Characterization of the male-sterile line bcajh97-01a/b and identification of candidate genes for genic male sterility in chinese cabbage-pak-choi. J. Am. Soc. Hortic. Sci. 2009, 134, 632–640. [Google Scholar] [CrossRef]
- Shen, X.; Xu, L.; Liu, Y.; Dong, H.; Zhou, D.; Zhang, Y.; Lin, S.; Cao, J.; Huang, L. Comparative transcriptome analysis and ChIP-sequencing reveals stage-specific gene expression and regulation profiles associated with pollen wall formation in Brassica rapa. BMC Genom. 2019, 20, 264. [Google Scholar] [CrossRef]
- Honys, D.; Twell, D. Transcriptome analysis of haploid male gametophyte development in Arabidopsis. Genome Biol. 2004, 5, R85. [Google Scholar] [CrossRef] [PubMed]
- Jung, N.Y.; Bae, W.J.; Chang, J.H.; Kim, Y.C.; Cho, Y. Cloning, expression, purification, crystallization and preliminary X-ray diffraction analysis of the central zinc-binding domain of the human Mcm10 DNA-replication factor. Acta Crystallogr. F-Struct. Biol. Commun. 2008, 64, 495–497. [Google Scholar] [CrossRef] [PubMed]
- Hwang, E.S.; Choi, A.; Ho, I.-C. Transcriptional regulation of GATA-3 by an intronic regulatory region and fetal liver zinc finger protein 1. J. Immunol. 2002, 169, 248–253. [Google Scholar] [CrossRef]
- Wang, L.; Xu, Y.; Zhang, C.; Ma, Q.; Joo, S.-H.; Kim, S.-K.; Xu, Z.; Chong, K. OsLIC, a Novel CCCH-type zinc finger protein with transcription activation, mediates rice architecture via brassinosteroids signaling. PLoS ONE 2008, 3, e3521. [Google Scholar] [CrossRef]
- Lai, W.S.; Kennington, E.A.; Blackshear, P.J. Tristetraprolin and its family members can promote the cell-free deadenylation of AU-rich element-containing mRNAs by poly (A) ribonuclease. Mol. Cell. Biol. 2003, 23, 3798–3812. [Google Scholar] [CrossRef]
- Delaney, K.J.; Xu, R.; Zhang, J.; Li, Q.Q.; Yun, K.-Y.; Falcone, D.L.; Hunt, A.G. Calmodulin interacts with and regulates the RNA-binding activity of an Arabidopsis polyadenylation factor subunit. Plant Physiol. 2006, 140, 1507–1521. [Google Scholar] [CrossRef]
- Birney, E.; Kumar, S.; Krainer, A.R. Analysis of the RNA-recognition motif and RS and RGG domains: Conservation in metazoan pre-mRNA splicing factors. Nucleic Acids Res. 1993, 21, 5803–5816. [Google Scholar] [CrossRef] [PubMed]
- Callebaut, I.; Mornon, J.-P. LOTUS, a new domain associated with small RNA pathways in the germline. Bioinformatics 2010, 26, 1140–1144. [Google Scholar] [CrossRef] [PubMed]
- Anantharaman, V.; Zhang, D.; Aravind, L. OST-HTH: A novel predicted RNA-binding domain. Biol. Direct 2010, 5, 13. [Google Scholar] [CrossRef]
- Twell, D. Male gametophyte development. In Plant Developmental Biology-Biotechnological Perspectives, 1st ed.; Pua, E.C., Davey, M.R., Eds.; Springer: Berlin/Heidelberg, Germany; New York, NY, USA, 2010; Volume 1, pp. 225–244. [Google Scholar]
- Scott, R.J.; Spielman, M.; Dickinson, H.G. Stamen structure and function. Plant Cell 2004, 16, S46–S60. [Google Scholar] [CrossRef]
- Twell, D.; Park, S.K.; Lalanne, E. Mechanisms of asymmetric division and cell fate determination in developing pollen. Trends Plant Sci. 1998, 3, 305–310. [Google Scholar] [CrossRef]
- Twell, D.; Oh, S.; Honys, D. Pollen development, a genetic and transcriptomic view. In The Pollen Tube: A Cellular and Molecular Perspective, 1st ed.; Malho, R., Ed.; Springer: Berlin/Heidelberg, Germany; New York, NY, USA, 2006; Volume 3, pp. 15–45. [Google Scholar]
- Borg, M.; Brownfield, L.; Khatab, H.; Sidorova, A.; Lingaya, M.; Twell, D. The R2R3 MYB transcription factor DUO1 activates a male germline-specific regulon essential for sperm cell differentiation in Arabidopsis. Plant Cell 2011, 23, 534–549. [Google Scholar] [CrossRef]
- Borg, M.; Rutley, N.; Kagale, S.; Hamamura, Y.; Gherghinoiu, M.; Kumar, S.; Sari, U.; Esparza-Franco, M.A.; Sakamoto, W.; Rozwadowski, K.; et al. An EAR-Dependent Regulatory Module Promotes Male Germ Cell Division and Sperm Fertility in Arabidopsis. Plant Cell 2014, 26, 2098–2113. [Google Scholar] [CrossRef]
- Sorensen, A.-M.; Kroeber, S.; Saedler, H. The ABNORMAL GAMETOPHYTES (AGM) gene product of Arabidopsis demonstrates a role in mitosis during gamete development. Plant Cell Physiol. 2004, 45, 905–913. [Google Scholar] [CrossRef]
- Teng, C.; Dong, H.; Shi, L.; Deng, Y.; Mu, J.; Zhang, J.; Yang, X.; Zuo, J. Serine palmitoyltransferase, a key enzyme for de novo synthesis of sphingolipids, is essential for male gametophyte development in Arabidopsis. Plant Physiol. 2008, 146, 1322–1332. [Google Scholar] [CrossRef]
- Persson, S.; Paredez, A.; Carroll, A.; Palsdottir, H.; Doblin, M.; Poindexter, P.; Khitrov, N.; Auer, M.; Somerville, C.R. Genetic evidence for three unique components in primary cell-wall cellulose synthase complexes in Arabidopsis. Proc. Natl. Acad. Sci. USA 2007, 104, 15566–15571. [Google Scholar] [CrossRef]
- Golovkin, M.; Reddy, A.S.N. A calmodulin-binding protein from Arabidopsis has an essential role in pollen germination. Proc. Natl. Acad. Sci. USA 2003, 100, 10558–10563. [Google Scholar] [CrossRef] [PubMed]
- Ju, Y.; Guo, L.; Cai, Q.; Ma, F.; Zhu, Q.-Y.; Zhang, Q.; Sodmergen. Arabidopsis JINGUBANG is a negative regulator of pollen germination that prevents pollination in moist environments. Plant Cell 2016, 28, 2131–2146. [Google Scholar] [CrossRef] [PubMed]
- Yang, X.; Zhang, Q.; Zhao, K.; Luo, Q.; Bao, S.; Liu, H.; Men, S. The Arabidopsis GPR1 gene negatively affects pollen germination, pollen tube growth, and gametophyte senescence. Int. J. Mol. Sci. 2017, 18, 1303. [Google Scholar] [CrossRef] [PubMed]
- Zhang, X.; Henriques, R.; Lin, S.-S.; Niu, Q.-W.; Chua, N.-H. Agrobacterium-mediated transformation of Arabidopsis thaliana using the floral dip method. Nat. Protoc. 2006, 2, 641–646. [Google Scholar] [CrossRef] [PubMed]
- Mudunkothge, J.M.; Mudunkothge, B.A. The GUS reporter system in flower development studies. In Flower Development: Methods and Protocols, 1st ed.; Riechmann, J.L., Wellmer, F., Eds.; Springer: Berlin/Heidelberg, Germany; New York, NY, USA, 2014; Volume 1110, pp. 295–304. [Google Scholar]
- Xiong, X.; Liu, W.; Jiang, J.; Xu, L.; Huang, L.; Cao, J. Efficient genome editing of Brassica campestris based on the CRISPR/Cas9 system. Mol. Genet. Genom. 2019, 294, 1251–1261. [Google Scholar] [CrossRef] [PubMed]
- Alexander, M.P. Differential staining of aborted and non-aborted pollen. Stain Technol. 1969, 44, 117–122. [Google Scholar] [CrossRef]
- Regan, S.M.; Moffatt, B.A. Cytochemical analysis of pollen development in wild-type Arabidopsis and a male-sterile mutant. Plant Cell 1990, 2, 877–889. [Google Scholar] [CrossRef]
- Lin, S.; Dong, H.; Zhang, F.; Qiu, L.; Wang, F.; Cao, J.; Huang, L. BcMF8, a putative arabinogalactan protein-encoding gene, contributes to pollen wall development, aperture formation and pollen tube growth in Brassica campestris. Ann. Bot. 2014, 113, 777–788. [Google Scholar] [CrossRef]
- Lin, S.; Yue, X.; Miao, Y.; Yu, Y.; Dong, H.; Huang, L.; Cao, J. The distinct functions of two classical arabinogalactan proteins BcMF8 and BcMF18 during pollen wall development in Brassica campestris. Plant J. 2018, 94, 60–76. [Google Scholar] [CrossRef]


© 2020 by the authors. Licensee MDPI, Basel, Switzerland. This article is an open access article distributed under the terms and conditions of the Creative Commons Attribution (CC BY) license (http://creativecommons.org/licenses/by/4.0/).
Share and Cite
Xu, L.; Xiong, X.; Liu, W.; Liu, T.; Yu, Y.; Cao, J. BcMF30a and BcMF30c, Two Novel Non-Tandem CCCH Zinc-Finger Proteins, Function in Pollen Development and Pollen Germination in Brassica campestris ssp. chinensis. Int. J. Mol. Sci. 2020, 21, 6428. https://doi.org/10.3390/ijms21176428
Xu L, Xiong X, Liu W, Liu T, Yu Y, Cao J. BcMF30a and BcMF30c, Two Novel Non-Tandem CCCH Zinc-Finger Proteins, Function in Pollen Development and Pollen Germination in Brassica campestris ssp. chinensis. International Journal of Molecular Sciences. 2020; 21(17):6428. https://doi.org/10.3390/ijms21176428
Chicago/Turabian StyleXu, Liai, Xingpeng Xiong, Weimiao Liu, Tingting Liu, Youjian Yu, and Jiashu Cao. 2020. "BcMF30a and BcMF30c, Two Novel Non-Tandem CCCH Zinc-Finger Proteins, Function in Pollen Development and Pollen Germination in Brassica campestris ssp. chinensis" International Journal of Molecular Sciences 21, no. 17: 6428. https://doi.org/10.3390/ijms21176428
APA StyleXu, L., Xiong, X., Liu, W., Liu, T., Yu, Y., & Cao, J. (2020). BcMF30a and BcMF30c, Two Novel Non-Tandem CCCH Zinc-Finger Proteins, Function in Pollen Development and Pollen Germination in Brassica campestris ssp. chinensis. International Journal of Molecular Sciences, 21(17), 6428. https://doi.org/10.3390/ijms21176428