Abstract
Cytoplasmic calcium ([Ca2+]cyt) is a well-characterized second messenger in eukaryotic cells. An elevation in [Ca2+]cyt levels is one of the earliest responses in plant cells after exposure to a range of environmental stimuli. Advances in understanding the role of [Ca2+]cyt in plant development has been facilitated by the use of genetically-encoded reporters such as GCaMP. Most of these studies have relied on promoters such as Cauliflower Mosaic Virus (35S) and Ubiquitin10 (UBQ10) to drive expression of GCaMP in all cell/tissue types. Plant organs such as roots consist of various cell types that likely exhibit unique [Ca2+]cyt responses to exogenous and endogenous signals. However, few studies have addressed this question. Here, we introduce a set of Arabidopsis thaliana lines expressing GCaMP3 in five root cell types including the columella, endodermis, cortex, epidermis, and trichoblasts. We found similarities and differences in the [Ca2+]cyt signature among these root cell types when exposed to adenosine tri-phosphate (ATP), glutamate, aluminum, and salt, which are known to trigger [Ca2+]cyt increases in root cells. These cell type-targeted GCaMP3 lines provide a new resource that should enable more in depth studies that address how a particular environmental stimulus is linked to specific root developmental pathways via [Ca2+]cyt.
1. Introduction
Calcium (Ca2+) plays a vital role as a second messenger system in plant development and stress response. Because Ca2+ acts as a stress signal, it is one of the first responses plants have to environmental stimuli. This fast response is achieved through an influx of extracellular Ca2+ and an efflux of stored Ca2+ from the vacuole, endoplasmic reticulum (ER), and mitochondria that is achieved via a concentration gradient between the intracellular Ca2+ stores and the cytoplasm [1]. In non-stimulated conditions, the concentration of Ca2+ in the cytoplasm rests around 100 nM [1,2,3]. This low concentration is maintained through H+/Ca2+ antiporters and Ca2+-ATPases that move Ca2+ into the apoplast or into intracellular stores [3,4]. Once the response in the cell is initiated, the cell will return to homeostasis by storing excess Ca2+ back in the vacuole, ER, or mitochondria through active transport [2], or by pumping it out into extracellular space through gated-ion channels in the plasma membrane.
Once Ca2+ enters the cytoplasm in high concentrations, it binds with Ca2+-binding proteins to initiate a second messenger cascade [4,5]. Part of this signaling cascade is the activation of Ca2+-dependent protein kinases and the regulation of transcription factors to increase tolerance to the stress that caused the initial Ca2+ response. Much of our understanding about Ca2+ as a second messenger has come from the development of technologies that enable monitoring of free cytosolic Ca2+ ([Ca2+]cyt) changes in living cells. Early on, these technologies consisted of indicator dyes that had to be chemically or physically loaded into the cell, such as Calcium Green or Indo-1. When Ca2+ levels in the cell became elevated upon exposing the cell to a specific stimulus, these indicator dyes increased fluorescence [6]. However, use of these indicator dyes in plant cells were often met with technical challenges including uneven dye loading, loss of cell viability after dye loading, and cells failing to take up the dyes [6,7].
Problems with these early indicator dyes were mitigated with the discovery of a suite of fluorescent proteins from jellyfish and other marine organisms [8,9]. Using molecular cloning techniques, selected regions of Ca2+-binding proteins could be fused with these fluorescent proteins to generate genetically-encoded Ca2+ sensors that change conformation upon Ca2+ binding [8]. Ca2+ binding induced changes in the conformation of fluorescent protein-based sensors result in enhanced fluorescence emission. One example of a genetically-encoded Ca2+ sensor is GCaMP. GCaMP consists of an enhanced green fluorescent protein (eGFP) fused to calmodulin (CaM) and myosin light-chain kinase (M13) [1,10]. GCaMP3 is a modified form of GCaMP that features a circularly permutated enhanced GFP (eGFP) flanked by CaM and M13 that gives low fluorescence in the absence of Ca2+, which increases upon reversible binding of Ca2+ to the CaM domain [11].
To date, expression of CGaMP and other genetically-encoded Ca2+ sensors in plants are driven by constitutive promoters such as Cauliflower Mosaic Virus 35S (35S) and Ubiquitin 10 (UBQ10) [12,13]. Although plant lines constitutively expressing genetically-encoded Ca2+ sensors enabled the functional study of [Ca2+]cyt changes across entire plant organs [5,13,14], it is likely that each cell type within the organ is characterized by a unique [Ca2+]cyt signature. While [Ca2+]cyt changes typically observed in the entire plant organ likely originate from more than one cell type, we lack tools to monitor these changes within specific tissues or cells [15]. To address this need, we generated a set of lines in the model plant Arabidopsis thaliana, expressing GCaMP3 targeted to the columella, endodermis, epidermis, cortex, and trichoblast using cell-type specific promoters [16]. We demonstrate the utility of these new GCaMP3 lines in reporting cell-type [Ca2+]cyt changes in roots treated with chemicals previously shown to induce [Ca2+]cyt increases in plants.
2. Results
2.1. Expression of GCaMP3 in Different Root Cell Types of A. thaliana
To the best of our knowledge, plant lines expressing genetically encoded [Ca2+]cyt sensors that are available to the scientific community are driven by constitutive promoters. A. thaliana lines expressing the UBQ10:GCaMP3 construct, which we generated and used previously to study [Ca2+]cyt oscillations in root hairs [17], is one example. In addition to root hairs, GCaMP3 fluorescence was detected in all cell-types of the primary root of A. thaliana expressing the UBQ10:GCaMP3 construct (Figure 1). Using confocal microscopy, strong fluorescence was observed in cells located at the root surface, such as the peripheral root cap and epidermis (Figure 1A,B,D). Moderate levels of fluorescence could also be detected in the underlying cortex (Figure 1C). However, in cells located deeper within the root, such as the columella and endodermis, fluorescence was obscured by the fluorescence from surface cells (Figure 1A,B).
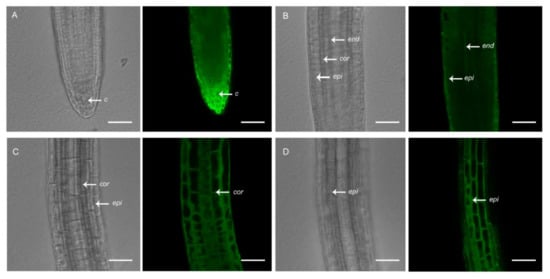
Figure 1.
Confocal imaging of primary roots of 5-day-old A. thaliana seedlings expressing UBQ10:GCaMP3. Representative bright-field and corresponding single-optical section confocal images of the root tip with a focus on the root cap (A), meristem (B), and elongation zone (C,D). c = columella; end = endodermis; epi = epidermis; cor = cortex. Scale bar: 50 μm.
This prompted us to generate a set of constructs that drive GCaMP3 expression in specific root cell types. For this purpose, we used promoters described in the SWELL promoter collection including ATHB8 (columella), SCARECROW (SCR, endodermis), Pin-Formed 2 (PIN2, epidermis and cortex), PEP (cortex), and Proline rich protein 3(PRP3, trichoblasts) [16]. For the five constructs, we found that GCaMP3 signal was most prominent in the expected cell types (Figure 2). For example, ATHB8 and SCR promoters drove strong GCaMP3 expression in the columella and endodermis, respectively (Figure 2A,B). For ATHB8:GCaMP3-expressing lines, we also observed weak fluorescence in the peripheral cap cells and the stele. For SCR:GCaMP3, fluorescence in the endodermis was observed in all root developmental zones from the meristem and elongation zone, continuing into the maturation zone. Roots of PEP:GCaMP3- and PRP3:GCaMP3-expressing seedlings also showed fluorescence in the expected cell types (i.e., cortex and trichoblast, respectively) (Figure 2C,D). On the other hand, fluorescence was detected in the epidermis and cortex of PIN2:GCaMP3-expressing lines, consistent with observations of Marques-Bueno et al. (2016) [16] (Figure 2E).
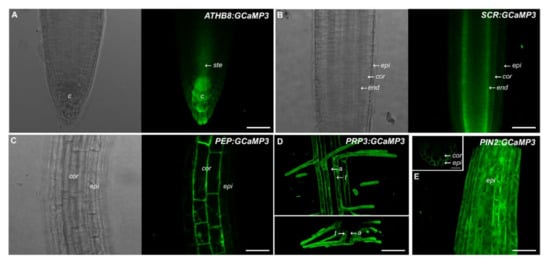
Figure 2.
Expression of GCaMP3 in specific root cell types. Representative bright-field and confocal images of primary roots of 5-day-old A. thaliana seedlings expressing ATHB8:GCaMP3 (A), SCR:GCaMP3 (B), and PEP:GCaMP3 (C), respectively. ATHB8:GCaMP3 is expressed in the columella with some fluorescence visible in the stele. SCR:GCaMP3 is expressed in the endodermis and PEP:GCaMP3 is expressed in the cortex. Maximum projection images (top panel in (D)) and computer reconstructed transverse section (lower panel in (D)) of the root maturation zone of seedlings expressing PRP3:GCaMP3 show fluorescence confined to the trichoblasts. A maximum projection image of the root elongation zone of seedlings expressing PIN2:GCaMP3 (E). The small box on the upper right corner of panel E shows a computer reconstructed cross-section of the primary root of a PIN2:GCaMP3-expressing line. The image was generated from 50 optical sections taken at 0.50 μm intervals. Note that GCaMP3 is predominantly expressed in the epidermis and cortex. c = columella; ste = stele; epi = epidermis; cor = cortex; end = endodermis; t = trichoblast; a = atrichoblasts. Scale bar: 50 μm.
2.2. Chemical Treatments of Cell-Type Specific GCaMP3 Constructs
Studies on Ca2+ signaling in plants over several years have revealed various stimuli that can trigger a rapid elevation in [Ca2+]cyt including cold, touch, wounding, hormones, reactive oxygen species, cyclic nucleotides, amino acids and nutrient/ionic stress [5,18,19,20,21,22,23]. We used some of these known [Ca2+]cyt triggers to test the responsiveness of our root cell-specific GCaMP3 lines.
We first analyzed the response of the GCaMP3 lines to adenosine tri-phosphate (ATP) (Figure 3). In mammalian systems, ATP is a neurotransmitter that is perceived by plasma membrane bound purinergic receptors, and its signaling role is facilitated through increases in [Ca2+]cyt [24]. While plants do not have the canonical purinergic receptors found in mammals, they perceive ATP via lectin receptor-like kinases and, similar to mammals, ATP elicits a rapid increase in [Ca2+]cyt [25,26,27]. Comparable to previous reports, application of ATP to the elongation zone of roots expressing UBQ10:GCaMP3 elicited a rapid rise in [Ca2+]cyt-dependent fluorescence followed by a gradual decline (Figure 3A) [5,25]. To determine if the increase in [Ca2+]cyt was due exclusively to ATP, we applied the solvent control solution, which consisted of 0.5× Murashige Skoog (MS) solution without ATP to roots. We found that applying MS solution triggered a rise in [Ca2+]cyt that was delayed and lower in amplitude compared to the [Ca2+]cyt change caused by ATP (Figure 3A). This observation suggests that under our growing conditions, adding a drop of solvent control solution to the root can induce an increase in [Ca2+]cyt, which could be the result of a touch or hypoosmotic response [19,20,27,28]. Therefore, in testing the cell-type GCaMP3 lines, we included solvent control applications in all of the experiments so we could tease apart [Ca2+]cyt changes due to the desired stimulus from those resulting from a touch or hypoosmotic response.

Figure 3.
Time course of [Ca2+]cyt changes in A. thaliana roots after 1 mM ATP application. The leftmost panel shows an inverted fluorescence image of the terminal 300 μm of an A. thaliana primary root to illustrate different cells in which GCaMP3 was expressed. Cell types are color coded with green = epidermis; blue = cortex; orange = endodermis; purple = columella; and the pink cells in the inset in panel C = trichoblast. (A–F) Quantification of [Ca2+]cyt -dependent fluorescence of various lines expressing GCaMP3 after ATP and solvent control (0.5× MS) application. Black arrows indicate the time of treatment. Plotted values represent the average normalized fluorescence intensity from 3–6 regions of interest (ROI) per line with standard error bars every fifth time point. Fluorescence values were normalized to the lowest fluorescence value.
Upon applying ATP to roots expressing cell-specific GCaMP3 lines, we found similarities and differences in the resulting [Ca2+]cyt signatures. For example, the PIN2:GCaMP3 lines, which expressed GCaMP3 in the epidermis and cortex (Figure 2), displayed similar [Ca2+]cyt signatures as UBQ10:GCaMP3-expressing lines in response to ATP and the solvent control solution (Figure 3A,B). This is not surprising given that GCaMP3 is strongly expressed in both the epidermis and cortex under the control of the UBQ10 and PIN2 promoters (Figure 1 and Figure 2). For lines expressing GCaMP3 in the trichoblasts, application of both ATP and MS control solution triggered a small increase in [Ca2+]cyt that had similar patterns (Figure 3C). For lines expressing GCaMP3 in cells located in the root interior such as the cortex, endodermis, and columella (supplementary video 1), ATP-induced [Ca2+]cyt increases resembled the patterns of UBQ10:GCaMP3 and PIN2:GCaMP3-expressing lines. However, the [Ca2+]cyt increases triggered by application of MS control solution were not as prominent in these lines when compared to those lines in which GCaMP3 was expressed in the epidermis (Figure 3D–F).
The next chemical we used to test the cell-specific GCaMP3 lines was glutamic acid (Figure 4). Like ATP, glutamic acid (glutamate) is a neurotransmitter in mammalian cells that can trigger a [Ca2+]cyt increase [5,14]. Application of glutamate to the elongation zone of roots expressing the UBQ10:GCaMP3 construct induced a strong initial [Ca2+]cyt increase with a quick return to equilibrium (Figure 4A). The [Ca2+]cyt spikes induced by application of MS controls were also observed in this dataset. Compared to glutamate, the onset of [Ca2+]cyt increase was delayed in roots treated with MS solution. In this case, however, the [Ca2+]cyt spikes triggered by glutamate and the MS control solution were similar in amplitude (Figure 4A). Like the ATP treatment, [Ca2+]cyt response of roots expressing PIN2:GCaMP3 to glutamate was similar to roots expressing UBQ10:GCaMP3. Furthermore, [Ca2+]cyt changes in the root elongation zone of PIN2:GCaMP3-expressing seedlings in response to the MS control solution was delayed, but exhibited a lower amplitude (Figure 4B). Lines expressing PRP3:GCaMP3 also had a strong initial [Ca2+]cyt peak after glutamate treatment with a rapid return to equilibrium that resembled UBQ10:GCaMP3 and PIN2:GCaMP3 lines. Like UBQ10:GCaMP3 and PIN2:GCaMP3 lines, application of MS control solution elicited a [Ca2+]cyt response that was delayed when compared to glutamate exposure (Figure 4C). By contrast, PEP:GCaMP3-expressing lines showed a dampened response to glutamate compared to lines in which GCaMP3 was expressed in the root surface (Figure 4D). Close examination of the time course of [Ca2+]cyt signals in the cortex after glutamate application revealed a triphasic response, with two larger peaks and a delayed smaller peak. Surprisingly, the amplitude of glutamate-triggered [Ca2+]cyt increases in the cortex was less than that of MS treated roots (Figure 4D). The lines expressing SCR:GCaMP3 and ATHB8:GCaMP3 showed monophasic responses to glutamate with a gradual return to equilibrium, similar to lines in which GCaMP3 was expressed in root surface cells. Furthermore, unlike lines with GCaMP expressed in the cortex and root surface cells, the MS control solution response for endodermis- and columella- targeted GCaMP3 had delayed responses and lower amplitudes (Figure 4E,F).
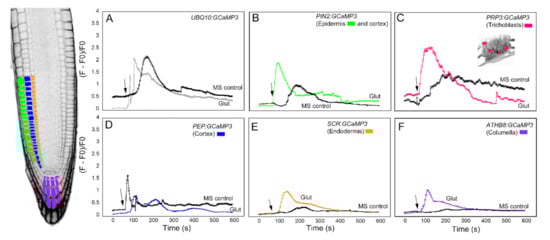
Figure 4.
Time course of [Ca2+]cyt changes in A. thaliana roots after 1 mM glutamate (Glu) application. The leftmost panel shows an inverted fluorescence image of the terminal 300 μm of an A. thaliana primary root to illustrate different cell types in which GCaMP3 was expressed. Cell types are color coded with green = epidermis; blue = cortex; orange = endodermis; purple = columella; and the pink cells in the inset in panel C = trichoblast. (A–F) Quantification of [Ca2+]cyt-dependent fluorescence of various lines expressing GCaMP3 after Glu and solvent control (0.5× MS) application. Black arrows indicate the time of treatment. Plotted values represent the average normalized fluorescence intensity from 3–4 regions of interest (ROI) per line with standard error bars every fifth time point. Fluorescence values were normalized to the lowest fluorescence value.
The third chemical we tested against the cell-type specific GCaMP3 lines was Al3+ in the form of aluminum chloride (Figure 5). Al3+ is a toxic tri-valent cation that competes with both Mg2+ and Ca2+ to increase the activity of Ca2+-ATPases while disrupting transport of Ca2+ through the plasma membrane [5,29]. Similar to previous treatments, the root elongation zone of seedlings expressing UBQ10:GCaMP3 showed a monophasic [Ca2+]cyt response to Al3+ (Figure 5A). The onset of the [Ca2+]cyt increase after Al3+ treatment was delayed and lower in amplitude compared to ATP, glutamate and solvent control application (Figure 3A, Figure 4A and Figure 5A) [5]. In roots expressing PIN2:GCaMP3, Al3+ application elicited a biphasic [Ca2+]cyt response that consisted of an initial small peak that was quickly followed by a second larger peak, which was broader than the first peak. The onset of the [Ca2+]cyt response in PIN2:GCaMP3-expressing roots after Al3+ treatment occurred earlier than the [Ca2+]cyt response triggered by solvent controls (Figure 5B). In roots expressing PRP3:GCaMP3, Al3+-induced [Ca2+]cyt increase was larger in amplitude and had a broader peak compared to those observed in UBQ10:GCaMP3- and PIN2:GCaMP3-expressing roots (Figure 5C). The [Ca2+]cyt increases in roots expressing GCaMP3 in interior root tissues were less than roots expressing GCaMP3 in the surface tissues. Among the three lines in which GCaMP3 was expressed in the interior cell types, the columella-specific GCaMP3 line did not show an Al3+-induced [Ca2+]cyt peak (Figure 5F). The PEP:GCaMP3-expressing lines showed a biphasic [Ca2+]cyt response with a distinct first peak followed by a second peak with lower amplitude. Although the amplitude of the [Ca2+]cyt peak induced by application of MS solution was similar to the amplitude of the first Al3+-triggered [Ca2+]cyt peak, the onset of the latter was delayed (Figure 5D). SCR:GCaMP3-expressing roots exhibited an Al3+-induced [Ca2+]cyt response characterized by a broad peak and with a lower amplitude than peaks observed in the root surface- and cortex GCaMP3-expressing lines (Figure 5E).
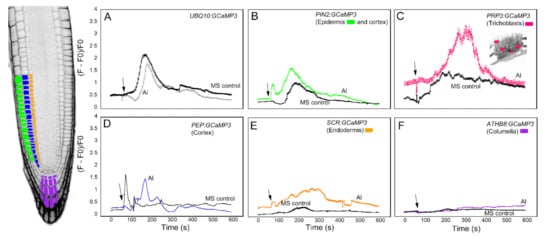
Figure 5.
Time course of [Ca2+]cyt changes in A. thaliana roots after 1 mM aluminum (Al3+) chloride application. The leftmost panel shows an inverted fluorescence image of the terminal 300 μm of an A. thaliana primary root to illustrate different cell types in which GCaMP3 was expressed. Cell types are color coded with green = epidermis; blue = cortex; orange = endodermis; purple = columella; and the pink cells in the inset in panel C = trichoblast. (A–F) Quantification of [Ca2+]cyt-dependent fluorescence of various lines expressing GCaMP3 after Al3+ and solvent control (0.5× MS) application. Black arrows indicate the time of treatment. Plotted values represent the average normalized fluorescence intensity from 3–7 regions of interest (ROI) per line with standard error bars every fifth time point. Fluorescence values were normalized to the lowest fluorescence value.
The final stimulus we used to test the cell-type specific GCaMP3 lines was salt in the form of NaCl. Na+ is used to regulate the voltage equilibrium in cells, but also has direct effects on the efflux of K+ into the cytosol [30]. Ca2+ is a regulator for the K+ efflux channels [30], so disruption of K+ into the cytosol may cause variation in the resting concentration of Ca2+. In roots expressing the fluorescent-based [Ca2+]cyt sensor Yellow Cameleon 3.60 (YC3.60), NaCl treatment resulted in cell-specific [Ca2+]cyt transients in the early elongation zone [31]. Consistent with the results of Feng et al. (2018) [31], roots expressing UBQ10:GCaMP3 exhibited late-onset [Ca2+]cyt transients (i.e., >10 min) in cells of the elongation zone (Figure 6A; supplementary video 2). These NaCl-triggered [Ca2+]cyt transients were observed in the cell-targeted GCaMP3 lines except for the endodermis-localized GCaMP3 line (Figure 6A–D). In certain lines, the onset of [Ca2+]cyt transients occurred much earlier after NaCl application when compared to UBQ10:GCaMP3-expressing lines. The onset of NaCl-induced [Ca2+]cyt transients was fastest in roots of PRP3:GCaMP3-expressing lines followed by PEP:GCaMP3-expressing lines. The [Ca2+]cyt transients in the columella were only observed several minutes after NaCl application (i.e., 12 min after NaCl application; Figure 6C).
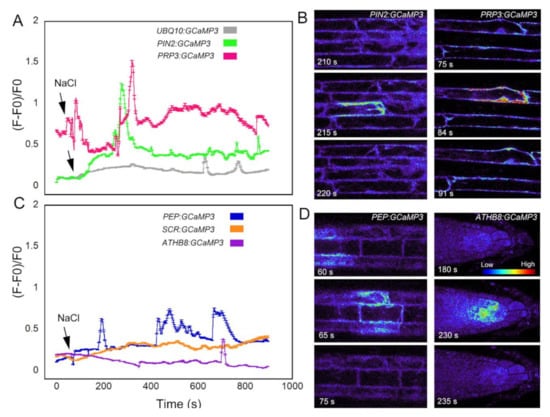
Figure 6.
NaCl-triggered [Ca2+]cyt transients in cell type-specific GCaMP3 lines. Time course (A) and representative heat maps (B) of [Ca2+]cyt transients in roots expressing UBQ10:GCaMP3 and root surface cell-targeted GCaMP3 lines. Time course (C) and representative heat maps (D) of [Ca2+]cyt transients in roots where GCaMP3 is expressed in interior root cell types. Colors of the line graphs in A and C correspond to the cell types shown in preceding figures. The grey line shows the time course of UBQ10:GCaMP3-expressing lines. The arrows indicate time of application of sodium chloride. Intensity bar in panel D correspond to high (red) and low (blue) fluorescence with red indicating elevated [Ca2+]cyt.
2.3. Modification of Growth Conditions and Chemical Application Methods to Mitigate Solvent Control-Induced [Ca2+]cyt Transients
As shown in the preceding sections, the 0.5X MS control solution induced [Ca2+]cyt changes in UBQ10:GCaMP3 and lines in which GCaMP3 was expressed in cells on the root surface and cortex (Figure 3, Figure 4 and Figure 5). Although the MS-induced [Ca2+]cyt responses were clearly distinct from ATP, glutamate, and Al3+ treatments, we were concerned that the growth conditions in which these first experiments were conducted made roots more sensitive to osmotic changes and/or mechanical perturbation due to the process of adding the solutions. We argued that MS-induced [Ca2+]cyt transients could be dampened relative to the chemical applications by: (1) using freshly prepared MS plates for planting seeds and (2) pretreating roots two times with MS solution prior to application of the actual chemical solution. These modifications in our treatment protocols were tested using ATP which typically generated peaks with the highest amplitude.
Compared to the datasets shown in Figure 3, Figure 4 and Figure 5, the [Ca2+]cyt transients triggered by the MS solution were significantly dampened when fresh plates were used for the experiments (Figure 7). The dampened MS-induced [Ca2+]cyt transients were observed in the two sequential MS applications. Pretreatment with MS solution had the added benefit of allowing roots to adapt prior to ATP application (adapted ATP = ATP:MS). Under these modified growth and pretreatment conditions, the ATP-induced [Ca2+]cyt increases were lower in amplitude when compared to the [Ca2+]cyt increases shown in Figure 3. Despite the lower ATP-induced [Ca2+]cyt transients, these [Ca2+]cyt responses were better separated from the [Ca2+]cyt responses induced by MS solution, particularly in lines expressing UBQ10:GCaMP3 and those in which GCaMP3 was expressed in root surface cell types and the cortex (Figure 7). In addition to the dampened response, [Ca2+]cyt response to ATP:MS for UBQ10:GCaMP3 and PIN2:GCaMP3 lines had broader peaks than those shown in Figure 3. For PRP3:GCaMP3-expressing lines, the [Ca2+]cyt response was markedly different from the initial ATP treatment (Figure 3C and Figure 7C). Application of ATP after 0.5X MS adaptation caused a strong, monophasic response earlier than either UBQ10:GCaMP3 or PIN2:GCaMP3 lines. Lines expressing PEP:GCaMP3 showed a continued elevated [Ca2+]cyt response that oscillated throughout the 10 min time course compared to either UBQ10:GCaMP3 lines or the previous ATP treatment (Figure 3D and Figure 7D). For lines expressing SCR:GCaMP3 or ATHB8:GCaMP3, the response was similar to previous ATP treatments, but without the strong transient peak (Figure 3E,F and Figure 7E,F). After the cell-type specific lines were adapted to the 0.5× MS control solution, the response time for ATP:MS was initiated later than the previous ATP treatment (Table 1).
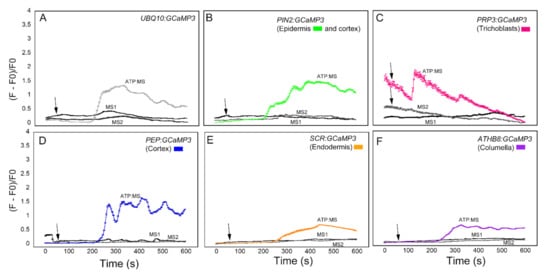
Figure 7.
ATP-triggered [Ca2+]cyt responses in cell type-specific GCaMP3 lines planted on fresh MS plates and pre-treated twice with MS. MS pretreatment 1 (MS1) time course (black) of [Ca2+]cyt in roots show construct treatment with MS control solution. MS pretreatment 2 (MS2) time course (grey) shows construct treatment with a second dose of MS control solution 15 min after first treatment. ATP:MS time course of [Ca2+]cyt in roots show cell-type specific response 10 min after MS1 and MS2 treatment. Colors of the line graphs in (A–F) correspond to the cell types shown in preceding figures with standard error bars every fifth time point. Black arrows indicate the time of application of ATP.

Table 1.
Reaction time analysis of [Ca2+]cyt response where reaction time is the time elapsed from chemical application to maximum GCaMP3 fluorescence (reaction time ± SE; n = sample size; reaction time is in seconds). Statistical analysis using Analysis of Variance (ANOVA) with Tukey Post-Hoc test (p ≤ 0.05 for reported significance) was performed for differences in chemical treatments only due to the lack of comparable ROI sections between cell-type lines. Due to limited sample size, significance may indicate a general trend rather than actual significance. ATP = adenosine tri-phosphate; Glu = glutamate; Al3+ = aluminum; MS = control solution; ATP:MS = adapted ATP.
To further tease out the differences among GCaMP3-expressing lines, we obtained the time elapsed from chemical application to maximum GCaMP3 fluorescence (referred to as reaction time), and analyzed the relationship between chemicals using Analysis of Variance (ANOVA) with Tukey Post-Hoc test (Table 1). Our analysis showed that reaction time was delayed in lines where GCaMP3 was expressed in inner cell types. When comparing the different chemical treatments, ATP, glutamate, and Al3+ showed similar responses (except ATHB8:GCaMP3 to Al3+) while adapted ATP:MS showed significantly slower reaction times to both ATP and glutamate (Table 1). However, with such a small sample size, statistical significance may indicate a trend rather than actual significance. NaCl reaction time was not included due to the large variation in responses across each line.
2.4. Evaluation of [Ca2+]cyt Signatures from Similar Root Development Regions and Cell Types
In comparing UBQ10:GCaMP3 lines with the other cell-type specific GCaMP3 lines, a ROI was selected and the average of normalized fluorescence intensity was plotted. For the most part, the ROI in UBQ10:GCaMP3 lines was from the root epidermis and the average normalized fluorescence intensity from this ROI was compared with that of individual or groups of cells from the cell-type specific GCaMP3 lines. This process did not enable direct comparisons of [Ca2+]cyt signatures between the same cell types or root developmental regions. To address this issue, we conducted another set of imaging experiments using ATP-treated UBQ10:GCaMP3 and PIN2:GCaMP3 lines. For these experiments, a more direct comparison was conducted by drawing ROIs in epidermal cells from similar positions along the root longitudinal axis encompassing the meristem, distal elongation zone, and central elongation zone (Figure 8A). In doing so, we found similarities and differences in [Ca2+]cyt signatures between UBQ10:GCaMP3 and PIN2:GCaMP3 lines. For example, the ATP-induced [Ca2+]cyt signatures of UBQ10:GCaMP3 in all root developmental regions were identical to those in the distal and central elongation zone of PIN2:GCaMP3 lines. In PIN2:GCaMP3 lines, however, the ATP-induced [Ca2+]cyt signature had a much greater amplitude in the meristem (Figure 8A,B).
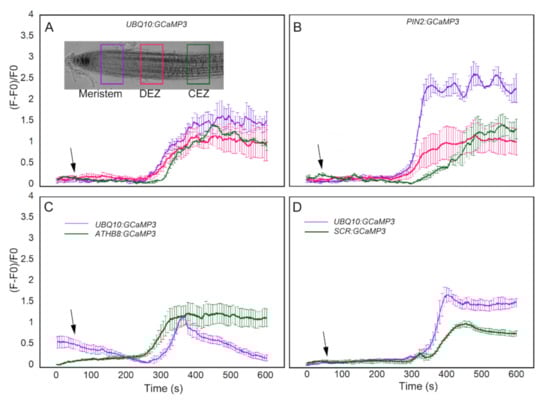
Figure 8.
Direct comparison of ATP-induced [Ca2+]cyt signatures in equivalent root developmental regions between UBQ10:GCaMP3 and cell-type specific GCaMP3 lines. Regions of interest (ROIs) were drawn in the meristem, distal elongation zone (DEZ), and central elongation zone (CEZ) in UBQ10:GCaMP3 (A) and PIN2:GCaMP3 (B) roots (inset in A). Comparison of ATP-induced [Ca2+]cyt signatures in presumptive columella and endodermis of UBQ10:GCaMP3 lines with ATHB8:GCaMP3 (C) and SCR:GCaMP3 (D). Black arrows indicate the time of treatment. Plotted values represent the average normalized fluorescence intensity from 3-4 ROI per line with standard error bars every fifth time point. Fluorescence values were normalized to the lowest fluorescence value.
We extended our analysis by drawing ROIs in presumptive columella or endodermis of UBQ10:GCaMP3 and comparing the resulting [Ca2+]cyt signatures from these ROIs with those of ATHB8:GCaMP3 and SCR:GCaMP3. For the columella, we found that ATHB8:GCaMP3 lines displayed an ATP-triggered [Ca2+]cyt signature with a sustained peak throughout the 10 min time course. On the other hand, the ATP-induced [Ca2+]cyt signature from the presumptive columella region of UBQ10:GCaMP3 lines was transient (Figure 8C). For the endodermis, the peak of ATP-induced [Ca2+]cyt increase was higher in UBQ10:GCaMP3 when compared to SCR:GCaMP3 (Figure 8D).
3. Discussion
In this paper, we introduced a set of A. thaliana lines expressing the intensiometric [Ca2+]cyt reporter GCaMP3 targeted to specific root cell types. Roots of these cell type specific GCaMP3 lines responded to chemical treatments such as ATP, glutamate, Al3+, and NaCl by exhibiting increases in [Ca2+]cyt-dependent CGaMP3 fluorescence. Imaging [Ca2+]cyt changes in cell types in response to some of these chemicals using lines in which genetically-encoded [Ca2+]cyt reporters are expressed ubiquitously have been attempted previously. This was done by drawing a region of interest corresponding to a particular tissue/cell type. For example, it was shown that Al3+-induced biphasic [Ca2+]cyt signatures in the root elongation zone occurred predominantly in the cortex when compared with the epidermis [5]. While this has proven effective for marking developmental regions along the longitudinal axis of the root [5,27], specifying a region of interest to designate root tissue/cell types along the radial axis for fluorescence-based measurements of [Ca2+]cyt can be problematic because this does not guarantee complete separation of signals from adjacent cell types. This problem becomes even more challenging for cell types located in the innermost regions of the root such as the columella and endodermis. Moreover, the ability to consistently draw a region of interest to outline the root cortex requires that the root grew in a particular orientation during the imaging experiments [5]. Here, we documented some of the advantages of the cell type specific GCaMP3 lines by comparing [Ca2+]cyt signatures from ROIs marking presumptive columella and endodermis in UBQ10:GCaMP3 lines with those of ATHB8:GCaMP3 and SCR:GCaMP3. This analysis revealed stark differences in both the amplitude and shape of [Ca2+]cyt signatures. Differences were also uncovered when equivalent root developmental regions were compared, particularly with regard to the amplitude of [Ca2+]cyt signatures in the meristem (Figure 8). The differences are likely due to contaminating signals from other cell types in UBQ10:GCaMP3 lines. The use of cell type specific GCaMP3 lines described here could potentially mitigate such problems.
The [Ca2+]cyt transients in the cell type specific lines induced by these various chemicals had various patterns when compared with lines in which GCaMP3 was expressed ubiquitously. A similarity in patterns occurred within the root surface cells’ responses to the different chemical treatments and again within the root inner cell types. Lines in which GCaMP3 was expressed in innermost root cell types such as the columella and endodermis generally had slower response times when compared to lines with GCaMP3 expressed in root surface cells. The delayed response times in lines with GCaMP3 expressed in the columella and endodermis was observed in all chemical treatments (Table 1; Figure 6). One could argue that because of the innermost location of the columella and endodermis, the delay in the response times might be due to the longer time it takes for the chemical to make contact with the target cells. The fact that columella and endodermis exhibit minimal or no [Ca2+]cyt increase after application of 0.5X MS supports this possibility. An alternative hypothesis is that the delayed [Ca2+]cyt response in the innermost cell types is due to an inward moving [Ca2+]cyt wave, which is not easily revealed when GCaMP3 is expressed ubiquitously or on the root surface. From our data, these inward-directed [Ca2+]cyt waves appear to be most prominent in ATP- and glutamate-treated roots (Figure 3, Figure 4 and Figure 7). The GCaMP3 lines described here could present a significant tool for better understanding the radial direction of [Ca2+]cyt waves in roots. A meaningful set of experiments with GCaMP3 lines expressed in innermost cell types will be to locally apply a small volume of the chemical stimulus to the root epidermis.
The line that was most similar to UBQ10:GCaMP3 with regard to chemical-induced [Ca2+]cyt transients was PIN2:GCaMP3. This was not surprising given that the PIN2 promoter drives GCaMP3 expression in root epidermal cells, which is the cell type that is readily imaged in UBQ10:GCaMP3 lines due to its location on the root surface. With the PEP:GCaMP3 lines described here, we were able observe biphasic, triphasic and oscillatory [Ca2+]cyt signatures after Al3+ treatment that were reminiscent of some of the observations made by Rincon-Zachary et al. (2010) [5] (Figure 5). The cortex- and trichoblast-targeted GCaMP3 lines also revealed an earlier onset of NaCl-induced [Ca2+]cyt transients when compared to UBQ10:GCaMP3 lines (Figure 6). It has been shown that [Ca2+]cyt transients in roots exposed to NaCl is part of the cellular machinery that prevents root cells from rupturing under salinity stress. The plasma membrane-localized receptor-like kinase, Feronia (FER), is required for root growth recovery after encountering high salinity conditions [31]. Because fer mutants displayed a high incidence of cortical cell rupture when compared to wild type after exposure to NaCl, it is tempting to speculate that earlier onset of [Ca2+]cyt transients in the cortex revealed by the PEP:GCaMP3-expressing lines could be a mechanism to maintain root growth integrity. The cell type GCaMP3 lines described here should be useful in testing this hypothesis.
While testing the various cell type specific GCaMP3 lines, we encountered a number of technical challenges brought about by our seedling growth conditions. In several experiments, we found that applying the 0.5X MS control solution alone could trigger a rise in [Ca2+]cyt. The MS only-induced [Ca2+]cyt transients were most prominent in the UBQ10:GCaMP3-expressing lines and those in which GCaMP3 was expressed in root surface cell types (e.g., PIN2:GCaMP3 and PRP3:GCaMP3). The [Ca2+]cyt transients observed after MS treatment were reminiscent of touch-induced [Ca2+]cyt responses [20], and recent studies on ATP-induced [Ca2+]cyt signaling [27], suggesting that we might have been eliciting a touch response as the various solutions were added to the root. In support of this hypothesis, our method for root [Ca2+]cyt imaging involved planting seed of the reporter lines on a thin layer of agarose to secure the root while at the same time allowing for the root cells to be accessible to the various chemical treatments ([5]; see Methods). It is possible that some of the [Ca2+]cyt transients observed in response to MS application resulted from roots that were not securely anchored to the agarose medium. Alternatively, the prevalence of MS-induced [Ca2+]cyt increases in some of our experiments could be due to osmotic changes when the solution was applied. Because agar for imaging roots was poured in advance, it was possible that liquid in some of the plates may have evaporated during storage. This could have led to some plates having an MS solution that was more concentrated than the treatment solution.
To test the possibility that MS-induced [Ca2+]cyt changes were due to touch or hypoosmotic shock, we repeated the ATP application experiments using roots that emerged from seeds planted on plates with freshly prepared MS-supplemented agarose. Furthermore, roots were pretreated with MS solution prior to ATP treatment. Under these modified growth and treatment conditions, we found that MS-induced [Ca2+]cyt increases were significantly dampened (Figure 3 and Figure 7). Given that [Ca2+]cyt changes are responses that can be elicited by a wide range of stimuli, the results described here highlight the need to carefully consider the growth and treatment conditions, and to include appropriate controls when conducting [Ca2+]cyt imaging experiments. Based on these observations, it is imperative that fresh plates be prepared prior to planting the reporter lines and that roots be pretreated with the solvent control solution for a few hours to allow seedlings to adapt.
Some studies have shown [Ca2+]cyt signals propagate along the longitudinal axis of roots [5,26]. Meanwhile, another study has indicated that [Ca2+]cyt signal propagation from the apical into the sub-apical can also occur [27]. The cell type specific GCaMP3 lines described here, particularly those lines in which GCaMP3 is expressed in inner root cells such as the cortex-, endodermis- and columella-specific lines could shed new insights into the direction of [Ca2+]cyt signal propagation within the roots. The MS-induced [Ca2+]cyt responses in lines in which GCaMP3 was expressed in the endodermis and columella were not observed. However, these cell types exhibited [Ca2+]cyt increases in response to some of the chemicals, indicating that these [Ca2+]cyt changes can be attributed to the chemical itself. In this regard, it is noteworthy that columella-targeted GCaMP3 lines did not exhibit a [Ca2+]cyt increase after Al3+ treatment while those lines with GCaMP3 expressed in the endodermis lacked a [Ca2+]cyt response to NaCl. With the establishment of response patterns from the cell type specific GCaMP3 lines when exposed to various chemical treatments, investigation into unique aspects of different root tissues/cells, such as signal propagation direction and response intensity, can be more readily explored.
4. Materials and Methods
4.1. Generation of Cell-Type Specific Promoter GCaMP Lines
Each promoter was amplified from genomic DNA extracted from wild-type Arabidopsis thaliana seedlings using the Plant DNAzol Reagent (Invitrogen, Carlsbad, CA, USA) (Table S1). The sequence preceding the start codon for each gene was used in each instance. The resulting fragments were digested with PstI and SalI (New England Biolabs, Ipswich, MA, USA; http://neb.com) and cloned into a modified pCAMBIA1390 vector [32]. GCaMP3 was amplified from plasmid DNA and digested with XmaI and BstEII (New England Biolabs, Ipswich, MA, USA; http://neb.com) and then cloned behind each promoter construct in pCAMBIA1390. To generate UBQ10:GCaMP3, a similar approach was taken. GCaMP3 was again amplified from plasmid DNA and then digested with EcoRI and SpeI (New England Biolabs, Ipswich, MA, USA; http://neb.com) and cloned behind the Ubiquitin 10 promoter in a previously described pCAMIA1390 vector [33]. Plasmid containing GCaMP3 was a gift from Loren Looger (Addgene plasmid # 22692; http://n2t.net/addgene:22692; RRID:Addgene_22692; [34]). Agrobacterium tumefaciens-mediated transformation using the floral dip method was used to generate Arabidopsis ecotype Col-0 plants expressing the GCaMP3 constructs [35]. All primers used in this study are listed in Table S2.
4.2. Preparation of A. thaliana Seedlings for Imaging
Seeds of the various A. thaliana GCaMP3 lines were planted on coverslips coated with a thin layer of MS-supplemented low-melting agarose. This set-up was prepared by pouring 3 mL of autoclaved 0.5% low-melting agarose in 0.5X MS solution (pH 5.7) on 48 × 60 mm No. 1 coverslips (Thermo Scientific, gold seal cover glass reorder no. 3334, Waltham, MA, USA; www.thermoscientific.com) as described in Rincon-Zachary et al. (2010) [5]. Coverslips with polymerized agarose were placed in 9 cm diameter round Petri dishes and stored at 4 °C prior to planting seeds. In another set of experiments, seeds were planted as soon as the agarose polymerized. Petri dishes and coverslips with the planted seeds were kept in 4 °C for 2 days and transferred to a Conviron growth chamber (Controlled Environments Ltd., Winnipeg, MB, Canada) set to 24 °C with 14 h/10 h day/night cycle. Petri dishes with the coverslips were kept vertical to enable the roots to grow down and straight along the surface of the agarose. Seedlings were imaged when primary roots were about 3–4 cm long, which was 5–6 days after transfer to the Conviron.
4.3. Validation of GCaMP3 Expression in Root Cell Types
Validation of GCaMP3 expression in the target root cell types was conducted with an inverted Leica TCS SP8-X Confocal Laser Scanning Microscope (Leica Microsystems, Wetzlar, Germany; http://leica-microsystems.com). Seedlings from the Conviron were secured in a horizontal orientation on the stage of the microscope. Seedling roots were illuminated with the 488 nm line of the Argon laser using a 40× (numerical aperture 1.1) water immersion objective and emitted light detected at 510 nm. For some lines, single optical images were acquired at a pixel resolution of 1024 × 1024. For other lines, a Z-series was acquired by capturing 81 images at 0.4 µm intervals and 3-D images were generated using the LAS visualization software of the Leica confocal microscope.
4.4. Chemical Treatments and Measurement of Ca2+-Dependent GCaMP3 Fluorescence
Stock solutions of 1 M ATP (Sigma-Aldrich, St. Louis, MO, USA; A7699-1G), glutamate (Sigma-Aldrich, St. Louis, MO, USA; G1149-100G), aluminum chloride (Sigma-Aldrich, St. Louis, MO, USA; Cas. No. 7784-13-6) and sodium chloride (J.T. Baker, Phillipsburg, NJ, USA; 3624-19) were made with deionized water and stored at 4 °C prior to use. Working solutions of 1 mM Al3+, 1 mM ATP, 1 mM Glu, and 150 mM NaCl were made by adding the appropriate volume of the stock solution in 0.5X MS at pH 5.7. Working solutions were made fresh prior to the imaging experiments.
To measure [Ca2+]cyt-dependent GCaMP3 fluorescence, images of growing roots were acquired every 1 s for 10 to 15 min using the Leica SP8-X confocal microscope. Images were captured at a scanning speed of 600 MHz and pixel resolution of 512 × 300. Baseline GCaMP3 fluorescence of the roots was first acquired for 1 min after placing seedlings on the stage of the microscope. Twenty µL of the treatment solution was then added on top of the agarose medium where the root was growing using an adjustable volume pipette while imaging continued. From the collected images, the average fluorescence intensity was acquired by marking a rectangular region of interest corresponding to the specific cell type using the rectangular selection tool of the SPX-8 LAS software. GCaMP3 fluorescence (F) values were normalized using the formula where F is the fluorescence intensity at some time point and F0 is the lowest fluorescence intensity point for the data set. Normalized fluorescence values were reported as the mean ± SE of at least three independent seedlings per GCaMP3 construct [36]. Another round of intensity video imaging was taken for the 0.5× MS control solution to generate the MS control fluorescence curves.
Supplementary Materials
The following are available online at https://www.mdpi.com/1422-0067/21/17/6385/s1, Supplementary video 1 Time lapse video of [Ca2+]cyt changes in the columella cells of ATHB8:GCaMP3 lines in response to ATP. Red indicates elevated [Ca2+]cyt. Total elapsed time is 5 min with images captured every 1 s. Video was sped up to 30 frames per second. Supplementary video 2 Time lapse video of [Ca2+]cyt changes in the cortex of PEP:GCaMP3 lines in response to salt. Red indicates elevated [Ca2+]cyt. Total elapsed time is 10 min with images captured every 1 s. Video was sped up to 60 frames per second. Table S1 Promoters used for development of GCaMP3 constructs that target to specific cell types in Arabidopsis thaliana roots. Table S2 Primer sequences used to generate the GCaMP3 constructs in Arabidopsis thaliana.
Author Contributions
All authors conceived and designed the research. W.K. and J.A.S. performed confocal microscopy of GCaMP lines. W.K., J.A.S. and E.B.B. analyzed the data and wrote the manuscript. J.A.S. made the GCaMP constructs and performed the floral dip transformations to generate the transgenic Arabidopsis lines. All authors have read and agreed to the published version of the manuscript.
Funding
This work was supported by the National Aeronautics and Space Administration (NASA grants 80NSSC18K1462 and 80NSSC19KO129) and the Noble Research Institute LLC.
Conflicts of Interest
The authors declare no conflict of interest.
References
- Luo, J.; Chen, L.; Huang, F.; Gao, P.; Zhao, H.; Wang, Y.; Han, S. Intraorganellar calcium imaging in Arabidopsis seedling roots using the GCaMP variants GCaMP6m and R-CEPIA1er. J. Plant Physiol. 2020, 246, 153127. [Google Scholar] [CrossRef] [PubMed]
- Qian, D.; Xiang, Y. Actin cytoskeleton as actor in upstream and downstream of calcium signaling in plant cells. Int. J. Mol. Sci. 2019, 20, 1403. [Google Scholar] [CrossRef] [PubMed]
- Thor, K. Calcium—Nutrient and messenger. Front. Plant Sci. 2019, 10, 440. [Google Scholar] [CrossRef] [PubMed]
- Tuteja, N.; Mahajan, S. Calcium signaling network in plants. Plant Signal. Behav. 2007, 2, 79–85. [Google Scholar] [CrossRef] [PubMed]
- Rincon-Zachary, M.; Teaster, N.D.; Sparks, J.A.; Valaster, A.H.; Motes, C.M.; Blancaflor, E.B. Fluorescence resonance energy transfer—Sensitized emission of yellow cameleon 3.60 reveals root zone—Specific calcium signatures in Arabidopsis in response to aluminum and other trivalent cations. Plant Physiol. 2010, 152, 1442–1458. [Google Scholar] [CrossRef] [PubMed]
- Rudd, J.J.; Franklin-Tong, V.E. Calcium signaling in plants. Cell. Mol. Life Sci. 1999, 55, 214–232. [Google Scholar] [CrossRef]
- Plieth, C. Plant calcium signaling and monitoring: Pros and cons and recent experimental approaches. Protoplasma 2001, 218, 1–23. [Google Scholar] [CrossRef]
- Robert, V.; Pinton, P.; Tosello, V.; Rizzuto, R.; Pozzan, T. Recombinant aequorin as tool for monitoring calcium concentration in subcellular compartments. Method Enzymol. 2000, 327, 400–456. [Google Scholar]
- Shimomura, O.; Johnson, F.H. Properties of the bioluminescent protein aequorin. Biochemistry 1969, 8, 3991–3997. [Google Scholar] [CrossRef]
- Nakai, J.; Ohkura, M.; Imoto, K. A high signal-to-noise Ca2+ probe composed of a single green fluorescent protein. Nat. Biotechnol. 2001, 19, 137–141. [Google Scholar] [CrossRef]
- Defalco, T.A.; Toyota, M.; Phan, V.; Karia, P.; Moeder, W.; Gilroy, S.; Yoshioka, K. Using GCaMP3 to study Ca2+ signaling in Nicotiana species. Plant Cell Physiol. 2017, 58, 1173–1184. [Google Scholar] [CrossRef] [PubMed]
- Grefen, C.; Donald, N.; Hashimoto, K.; Kudla, J.; Schumacher, K.; Blatt, M.R. A ubiquitin-10 promoter-based vector set for fluorescent protein tagging facilitates temporal stability and native protein distribution in transient and stable expression studies. Plant J. 2010, 64, 355–365. [Google Scholar] [CrossRef] [PubMed]
- Vincent, T.R.; Canham, J.; Toyota, M.; Avramova, M.; Mugford, S.T.; Gilroy, S.; Miller, A.J.; Hogenhout, S.; Sanders, D. Real-time In Vivo recording of Arabidopsis calcium signals during insect feeding using a fluorescent biosensor. J. Vis. Exp. 2017, 126, 56142. [Google Scholar] [CrossRef] [PubMed]
- Toyota, M.; Spencer, D.; Sawai-Toyota, S.; Jiaqi, W.; Zhang, T.; Koo, A.J.; Howe, G.A.; Gilroy, S. Glutamate triggers long-distance, calcium-based plant defense signaling. Science 2018, 361, 1112–1115. [Google Scholar] [CrossRef]
- Vigani, G.; Costa, A. Harnessing the new emerging imaging technologies to uncover the role of Ca2+ signaling in plant nutrient homeostasis. Plant Cell Environ. 2019, 42, 2885–2901. [Google Scholar] [CrossRef]
- Marques-Bueno, M.M.; Karina Morao, A.; Cayrel, A.; Pierre Platre, M.; Barberon, M.; Caillieux, E.; Colot, V.; Jaillais, Y.; Roudier, F.; Vert, G. A versatile Multisite Gateway-compatible promoter and transgenic line collection for cell type-specific functional genomics in Arabidopsis. Plant J. 2016, 85, 320–333. [Google Scholar] [CrossRef]
- Kwon, T.; Sparks, J.A.; Liao, F.; Blancaflor, E.B. ERULUS is a plasma membrane-localized receptor-like kinase that specifies root hair growth by maintaining tip-focused cytoplasmic calcium oscillations. Plant Cell. 2018, 30, 1173–1177. [Google Scholar] [CrossRef]
- Plieth, C.; Hansen, U.P.; Knight, H.; Knight, M.R. Temperature sensing by plants: The primary characteristics of signal perception and calcium response. Plant J. 1999, 18, 491–497. [Google Scholar] [CrossRef]
- Legue, V.; Blancaflor, E.; Wymer, C.; Perbal, G.; Fantin, D.; Gilroy, S. Cytoplasmic free Ca2+ in Arabidopsis roots changes in response to touch but not gravity. Plant Physiol. 1997, 114, 789–800. [Google Scholar] [CrossRef]
- Fasano, J.M.; Massa, G.D.; Gilroy, S. Ionic signaling in plant responses to gravity and touch. J. Plant Growth Regul. 2002, 21, 71–88. [Google Scholar] [CrossRef]
- Li, T.; Yan, A.; Bhatia, N.; Altinok, A.; Afik, E.; Durand-Smet, P.; Tarr, P.T.; Schroeder, J.I.; Heisler, M.G.; Meyerowitz, E.M. Calcium signals are necessary to establish auxin transporter polarity in a plant stem cell niche. Nat. Commun. 2019, 10, 726. [Google Scholar] [CrossRef] [PubMed]
- Sierla, M.; Waszczak, C.; Vahisalu, T.; Kangasjarvi, J. Reactive oxygen species in the regulation of stomatal movements. Plant Physiol. 2016, 171, 1569–1580. [Google Scholar] [CrossRef] [PubMed]
- Wilkins, K.A.; Matthus, E.; Swarbreck, S.M.; Davies, J.M. Calcium-mediated abiotic stress signaling in roots. Front. Plant Sci. 2016, 7, 1296. [Google Scholar] [CrossRef] [PubMed]
- Dubyak, G.R.; El-Moatassim, C. Signal transduction via P2-purinergic receptors for extracellular ATP and other nucleotides. Am. J. Physiol. 1993, 265, 577–606. [Google Scholar] [CrossRef] [PubMed]
- Tanaka, K.; Gilroy, S.; Jones, A.M.; Stacey, G. Extracellular ATP signaling in plants. Trends Cell Biol. 2010, 20, 601–608. [Google Scholar] [CrossRef]
- Choi, W.; Toyota, M.; Kim, S.; Hilleary, R.; Gilroy, S. Salt stress-induced Ca2+ waves are associated with rapid, long distance root-to-shoot signaling in plants. Proc. Natl. Acad. Sci. USA 2014, 111, 6497–6502. [Google Scholar] [CrossRef]
- Matthus, E.; Sun, J.; Wang, L.; Bhat, M.G.; Mohammad-Sidik, A.B.; Wilkins, K.A.; Leblanc-Fournier, N.; Legue, V.; Moulia, B.; Stacey, G.; et al. DORN1/P2K1 and purino-calcium signalling in plants: Making waves with extracellular ATP. Ann. Bot. 2020, 124, 1227–1242. [Google Scholar] [CrossRef]
- Erickson, G.R.; Northrup, D.L.; Guilak, F. Hypo-osmotic stress induces calcium-dependent actin reorganization in articular chondrocytes. Osteoarthr. Cartil. 2003, 11, 187–197. [Google Scholar] [CrossRef]
- Mundy, W.R.; Kodavanti, P.R.S.; Dulchinos, V.F.; Tilson, H.A. Aluminum alters calcium transport in plasma membrane and endoplasmic reticulum from rat brain. J. Biochem. Toxic. 1994, 9, 17–23. [Google Scholar] [CrossRef]
- Shabala, S.; Demidchik, V.; Shabala, L.; Cuin, T.A.; Smith, S.J.; Miller, A.J.; Davies, J.M.; Newman, I.A. Extracellular Ca2+ ameliorates NaCl-induced K+ loss from Arabidopsis root and leaf cells by controlling plasma membrane K+-permeable channels. Plant Physiol. 2006, 141, 1653–1665. [Google Scholar] [CrossRef]
- Feng, W.; Kita, D.; Peaucelle, A.; Cartwright, H.N.; Doan, V.; Duan, Q.; Liu, M.; Maman, J.; Steinhorst, L.; Schmitz-Thom, I.; et al. The FERONIA receptor kinase maintains cell-wall integrity during salt stress through Ca2+ signaling. Curr. Biol. 2018, 28, 666–675. [Google Scholar] [CrossRef] [PubMed]
- Wang, Y.S.; Yoo, C.M.; Blancaflor, E.B. Improved imaging of actin filaments in transgenic Arabidopsis plants expressing a green fluorescent protein fusion to the C- and N-termini of the fimbrin actin-binding domain 2. New Phytol. 2008, 177, 525–536. [Google Scholar] [CrossRef] [PubMed]
- Dyachok, J.; Sparks, J.A.; Liao, F.; Wang, Y.S.; Blancaflor, E.B. Fluorescent protein-based reporters of the actin cytoskeleton in living plant cells: Fluorophore variant, actin binding domain, and promoter considerations. Cytoskeleton 2014, 71, 311–327. [Google Scholar] [CrossRef] [PubMed]
- Tian, L.; Hires, S.A.; Mao, T.; Huber, D.; Chiappe, M.E.; Chalasani, S.H.; Petreanu, L.; Akerboom, J.; McKinney, S.A.; Schreiter, E.R.; et al. Imaging neural activity in worms, flies and mice with improved GCaMP calcium indicators. Nat. Methods 2009, 6, 875–881. [Google Scholar] [CrossRef]
- Clough, S.J.; Bent, A.F. Floral dip: A simplified method for Agrobacterium-mediated transformation of Arabidopsis thaliana. Plant J. 1998, 16, 735–743. [Google Scholar] [CrossRef]
- Leitao, N.; Dangeville, P.; Carter, R.; Charpentier, M. Nuclear calcium signatures are associated with root development. Nat. Commun. 2019, 10, 4865. [Google Scholar] [CrossRef]


© 2020 by the authors. Licensee MDPI, Basel, Switzerland. This article is an open access article distributed under the terms and conditions of the Creative Commons Attribution (CC BY) license (http://creativecommons.org/licenses/by/4.0/).