Antimicrobial and Amyloidogenic Activity of Peptides Synthesized on the Basis of the Ribosomal S1 Protein from Thermus Thermophilus

 , ,
, , 

Abstract
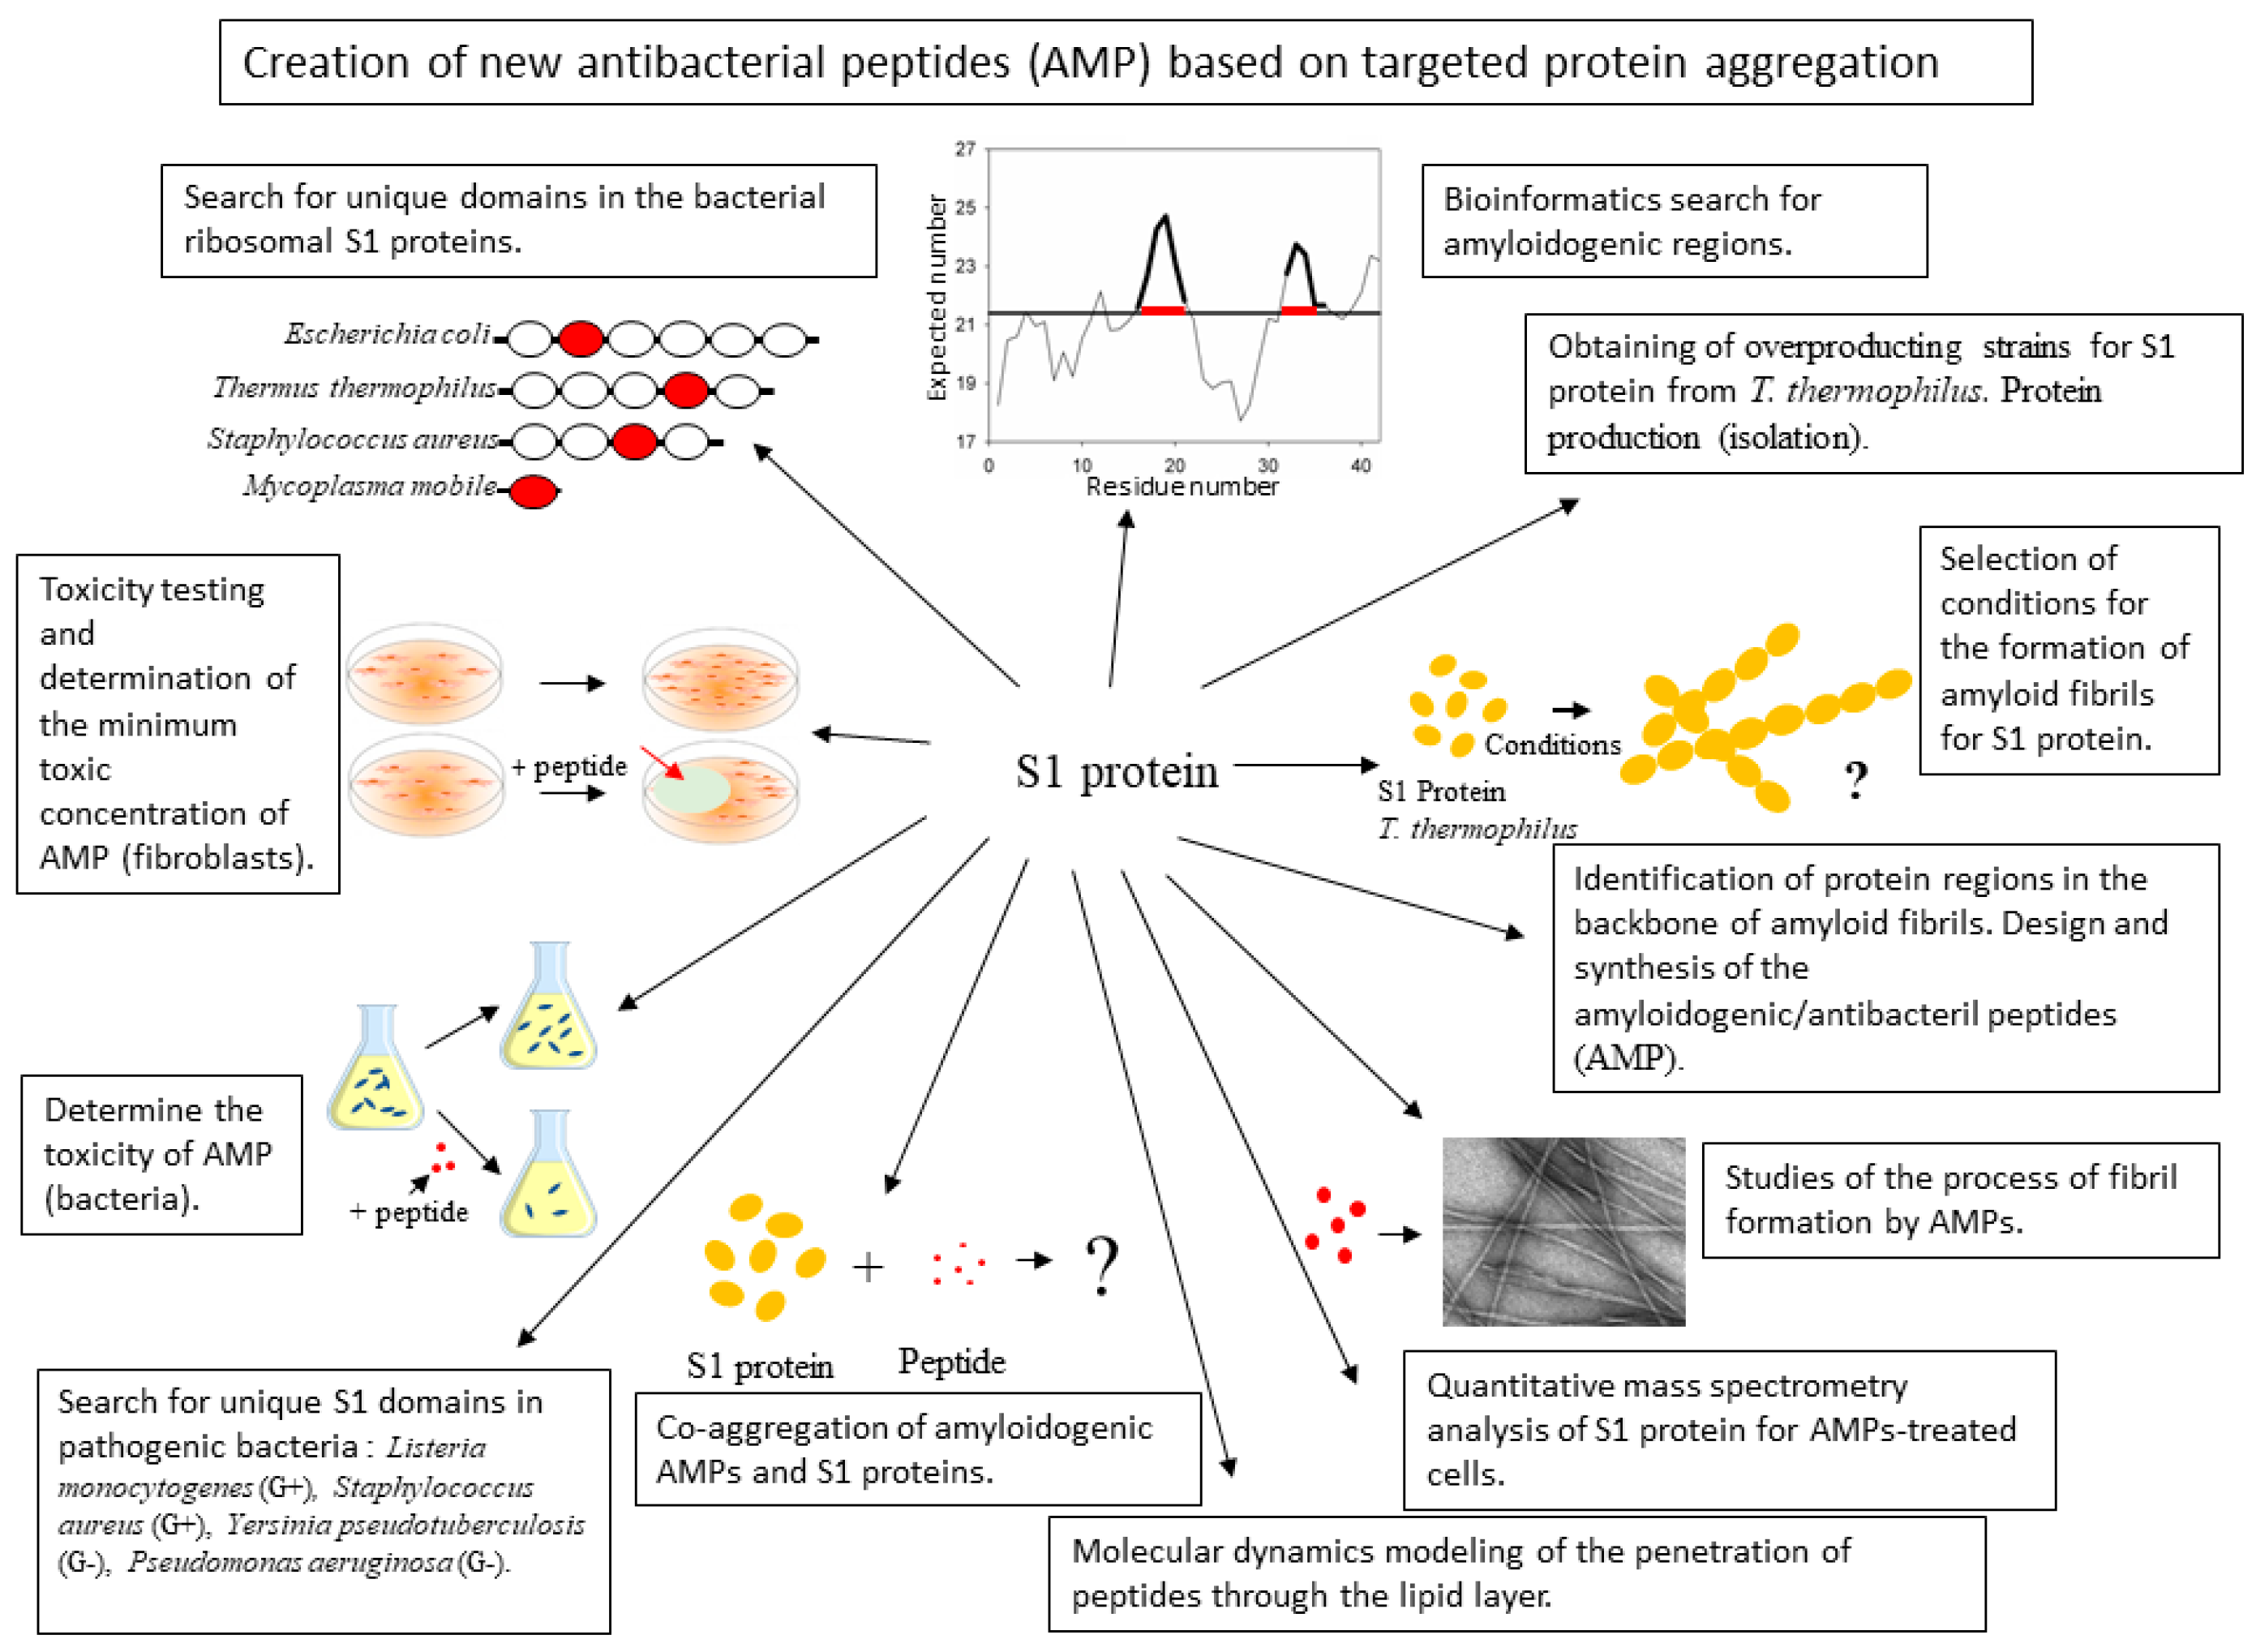
1. Introduction
2. Results and Discussion
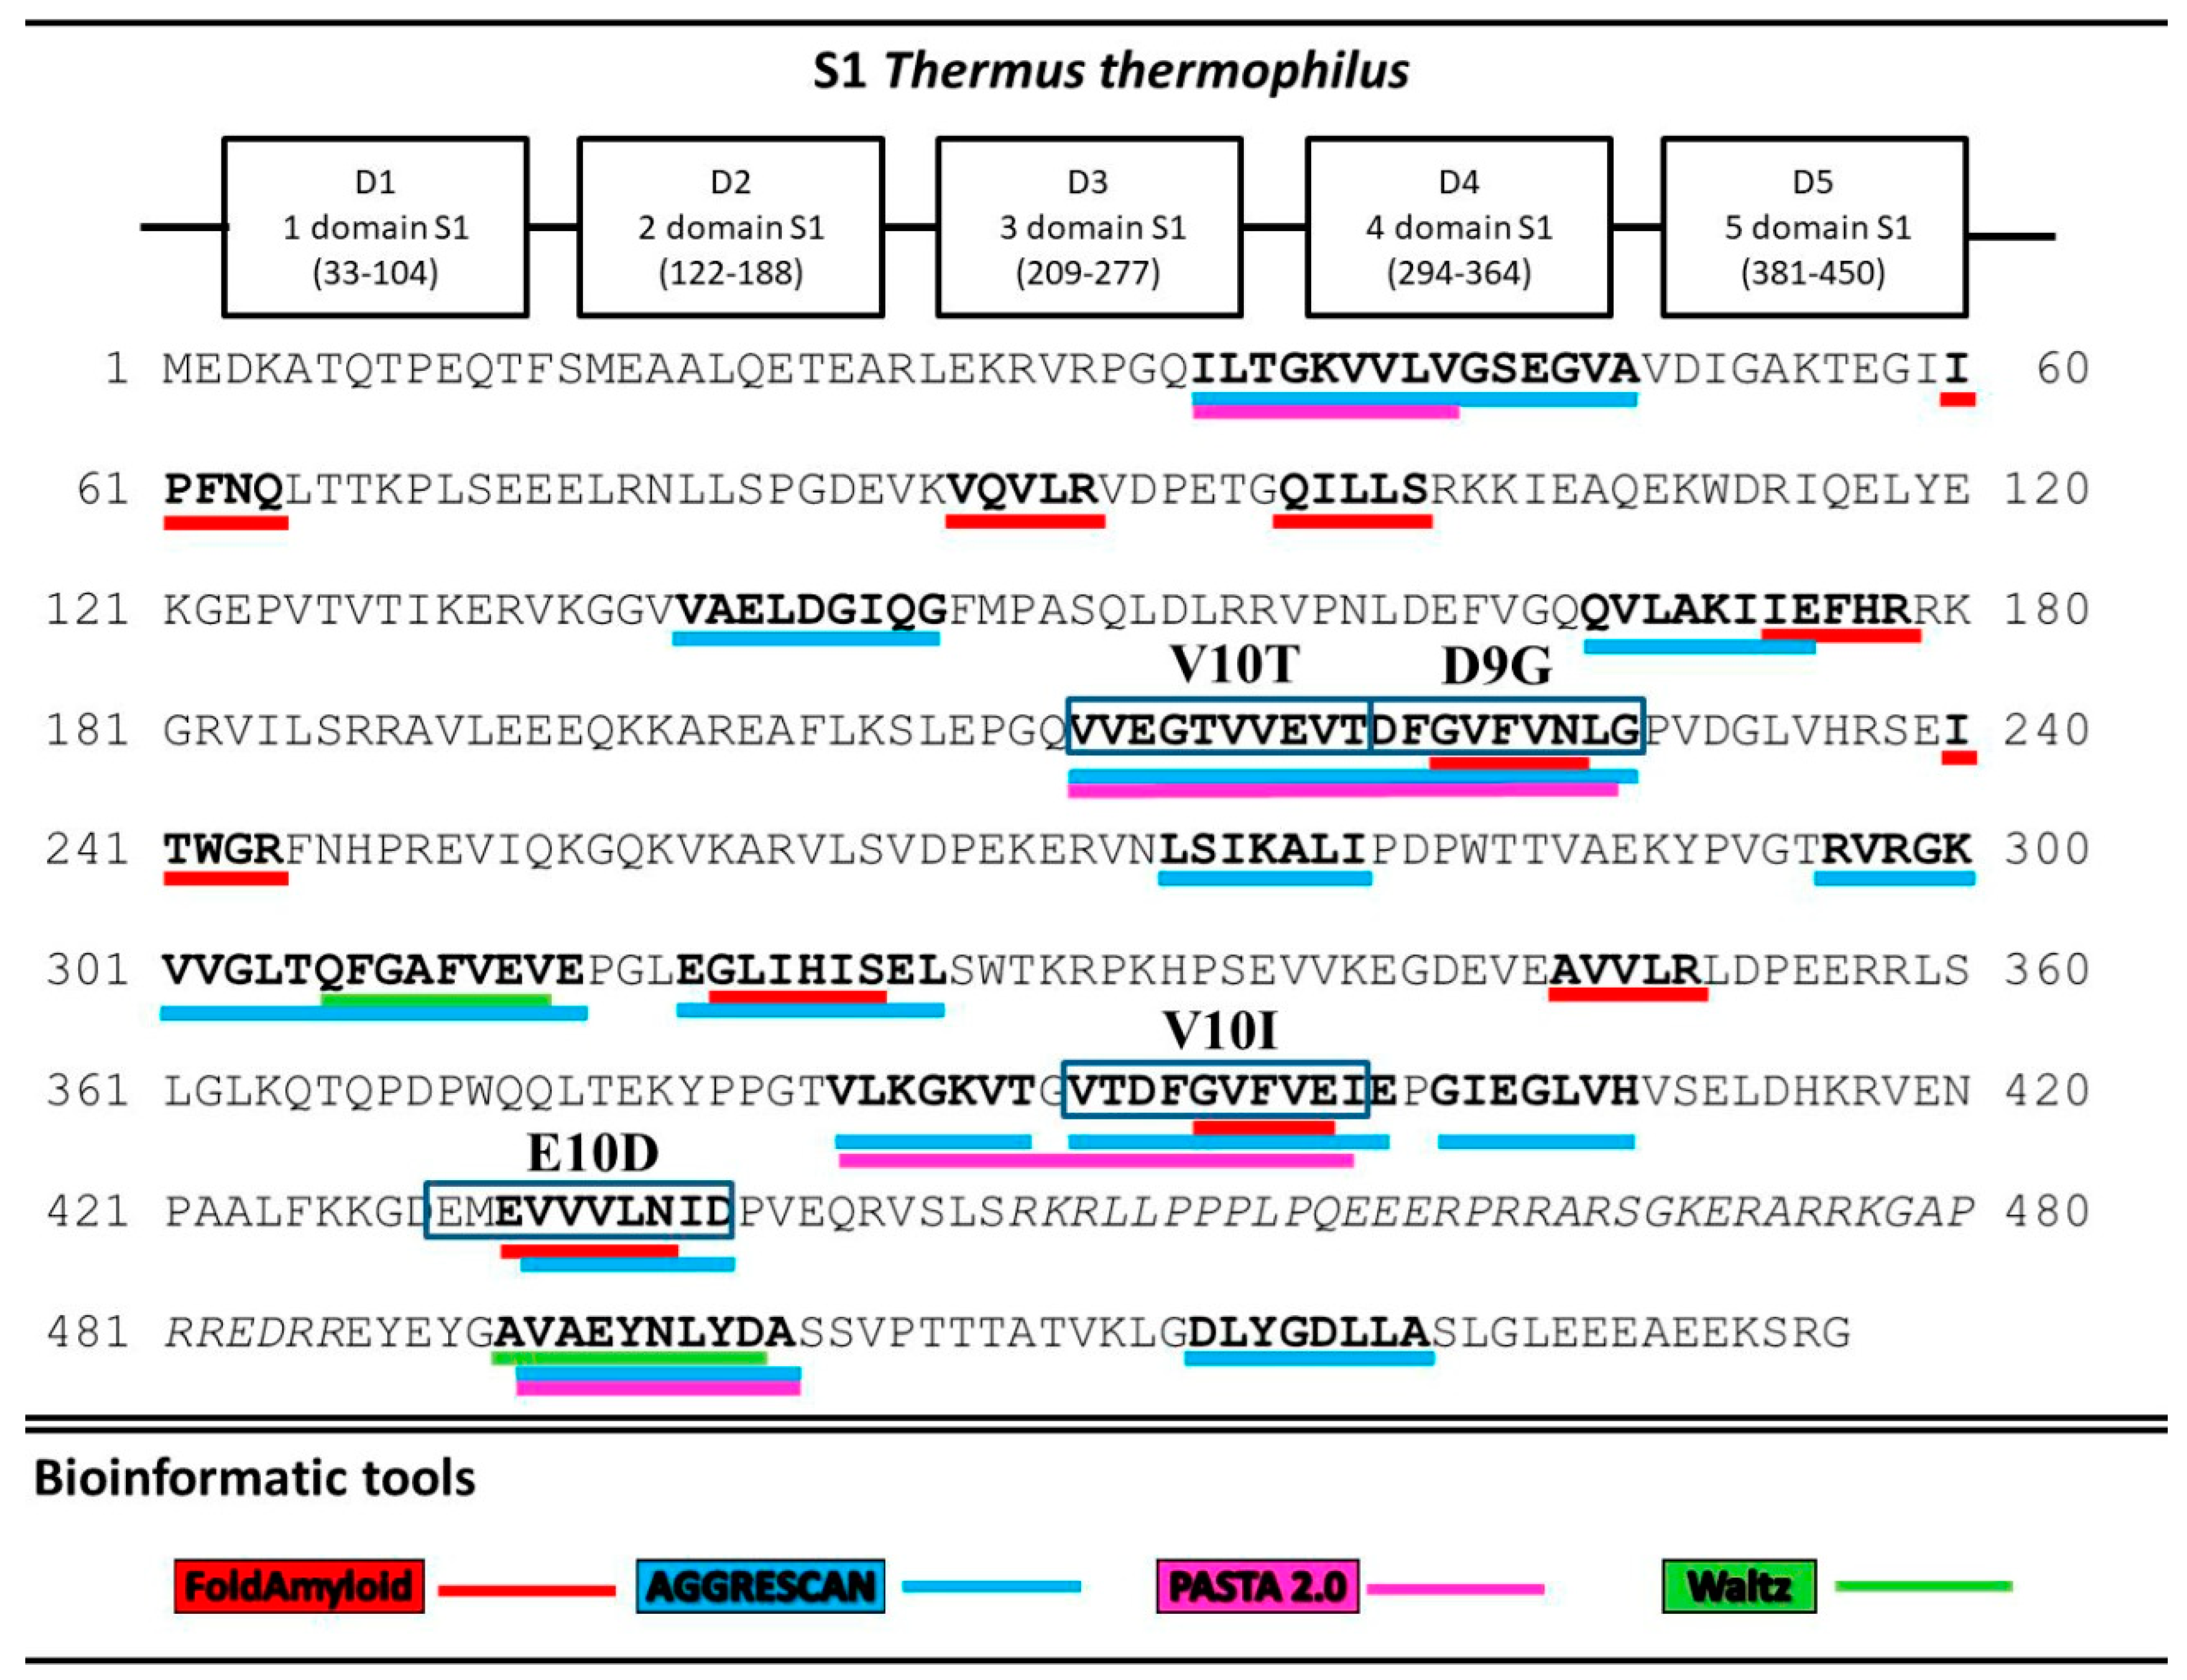
2.1. Analysis of Amyloidogenic Regions and Tendency for Antimicrobial Activity
2.2. Coagregation of Amyloidogenic Peptides and Ribosomal S1 Protein
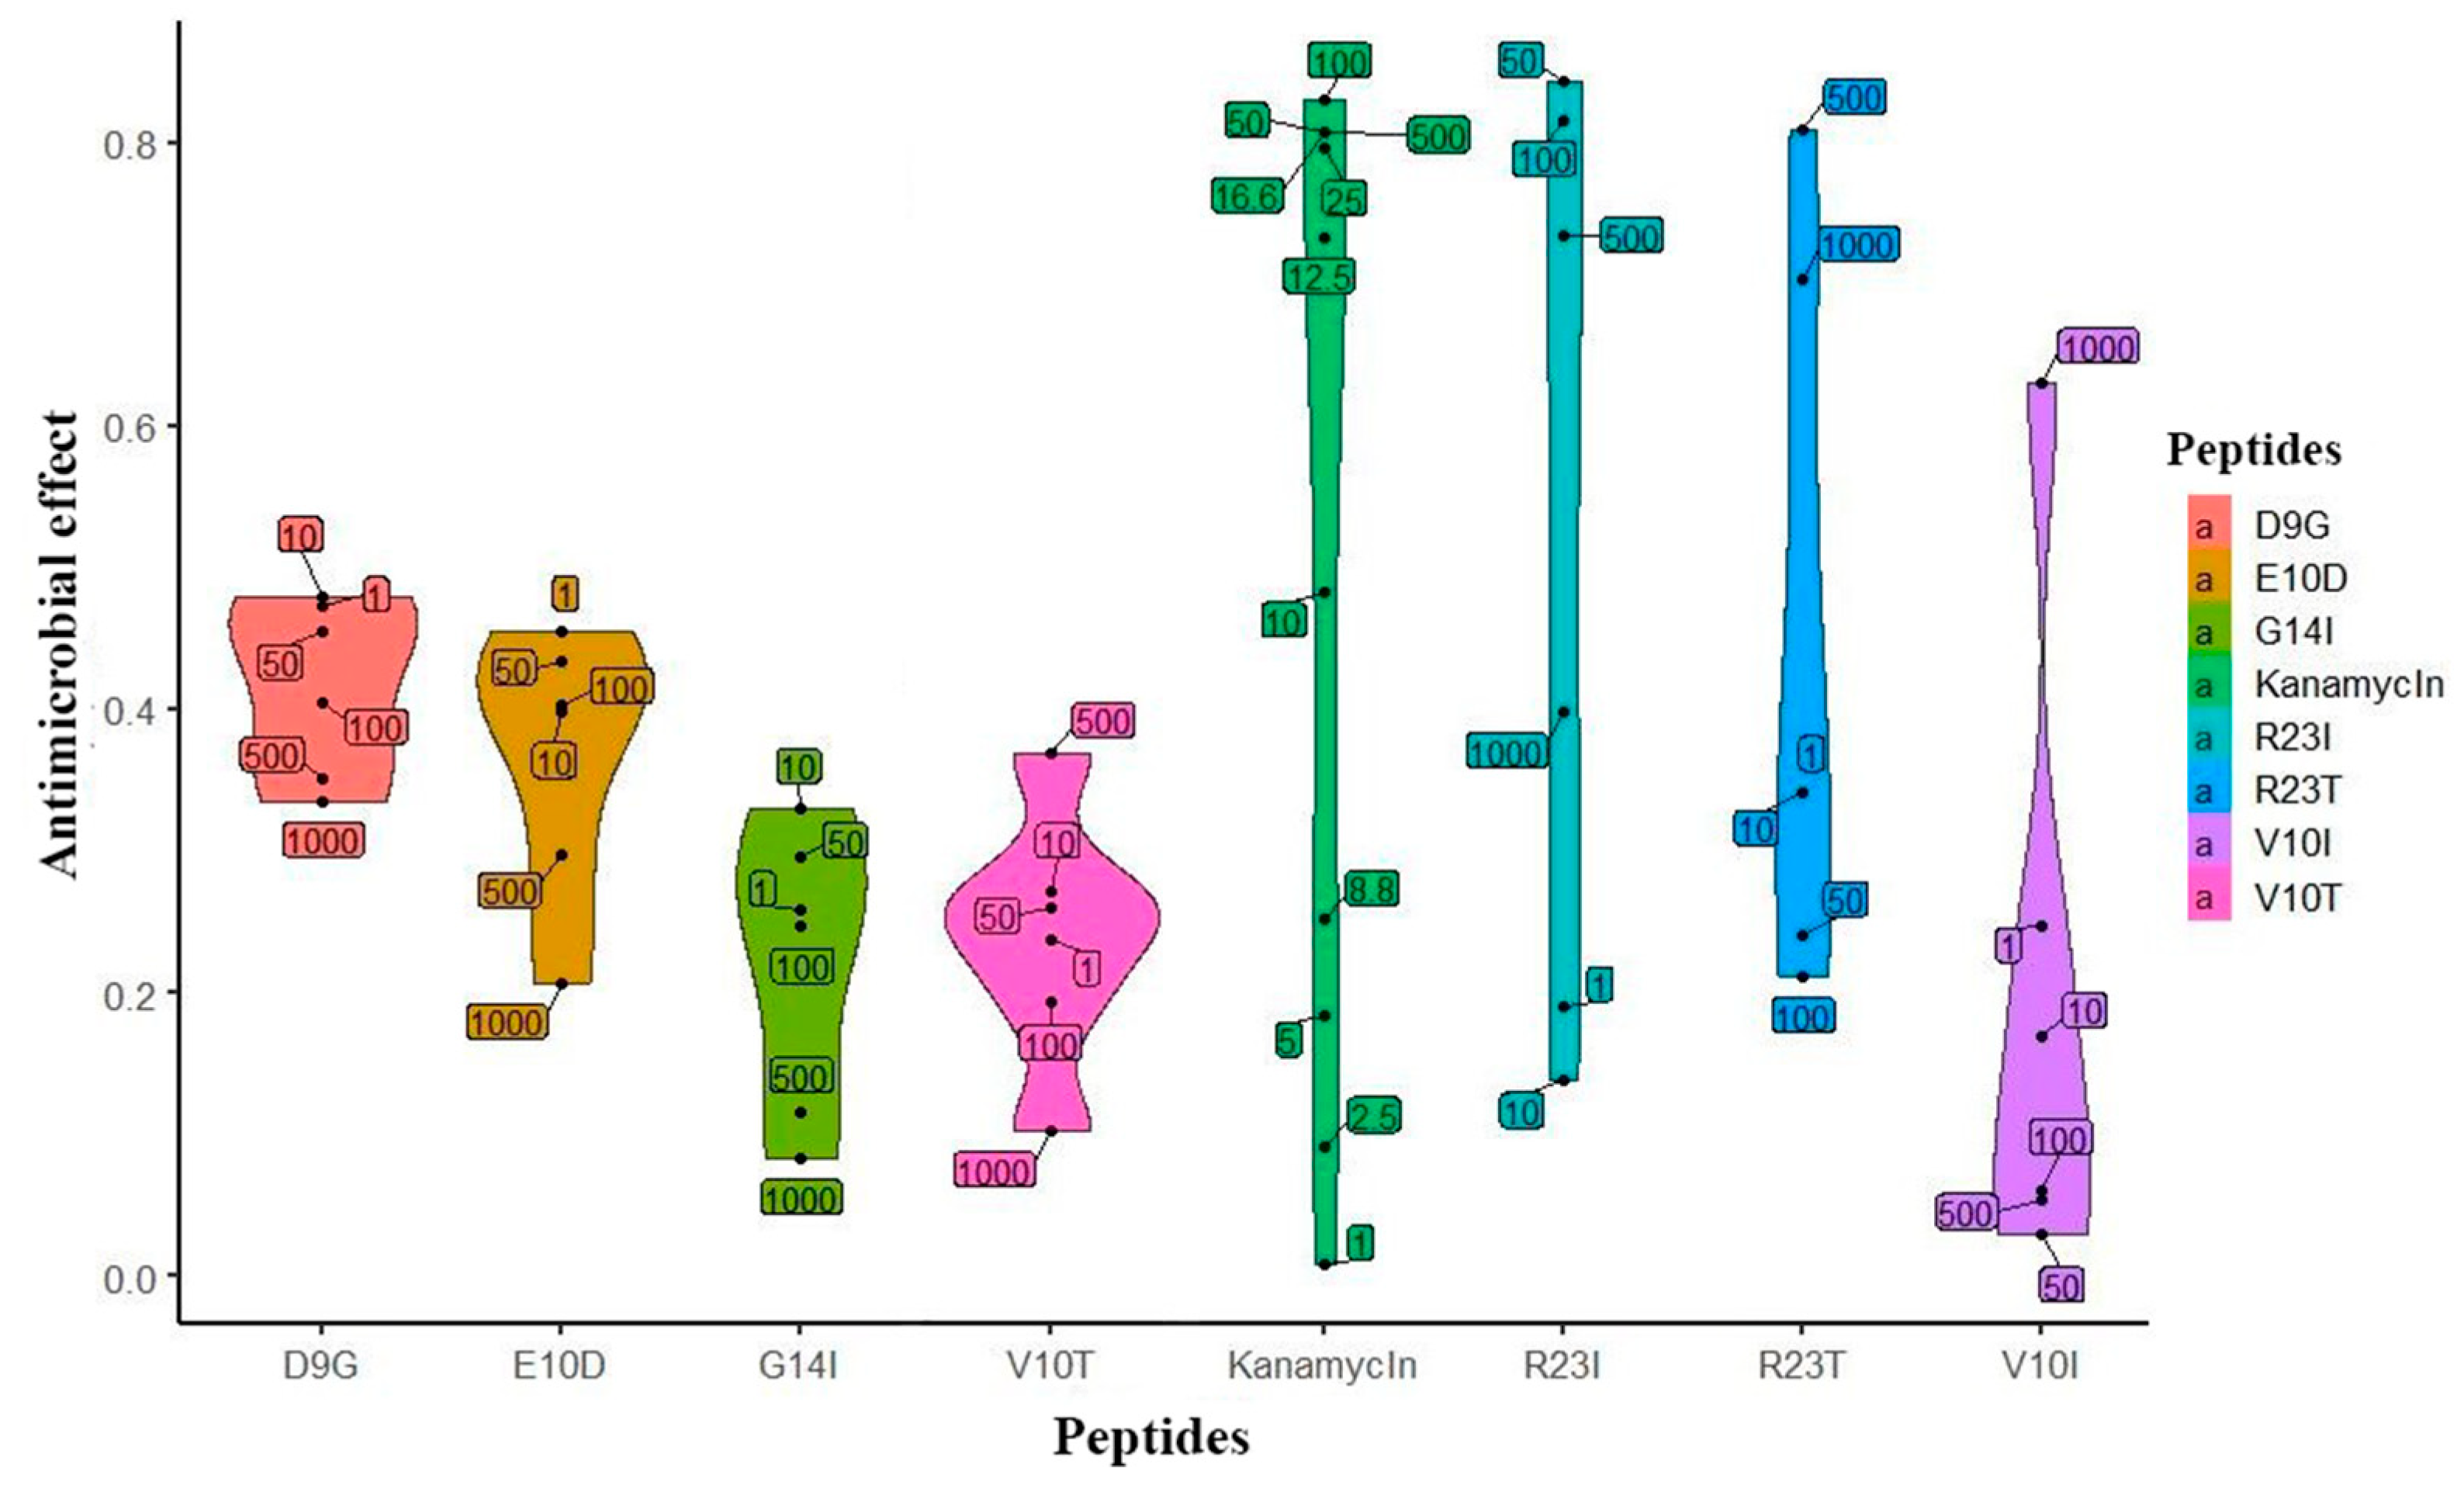
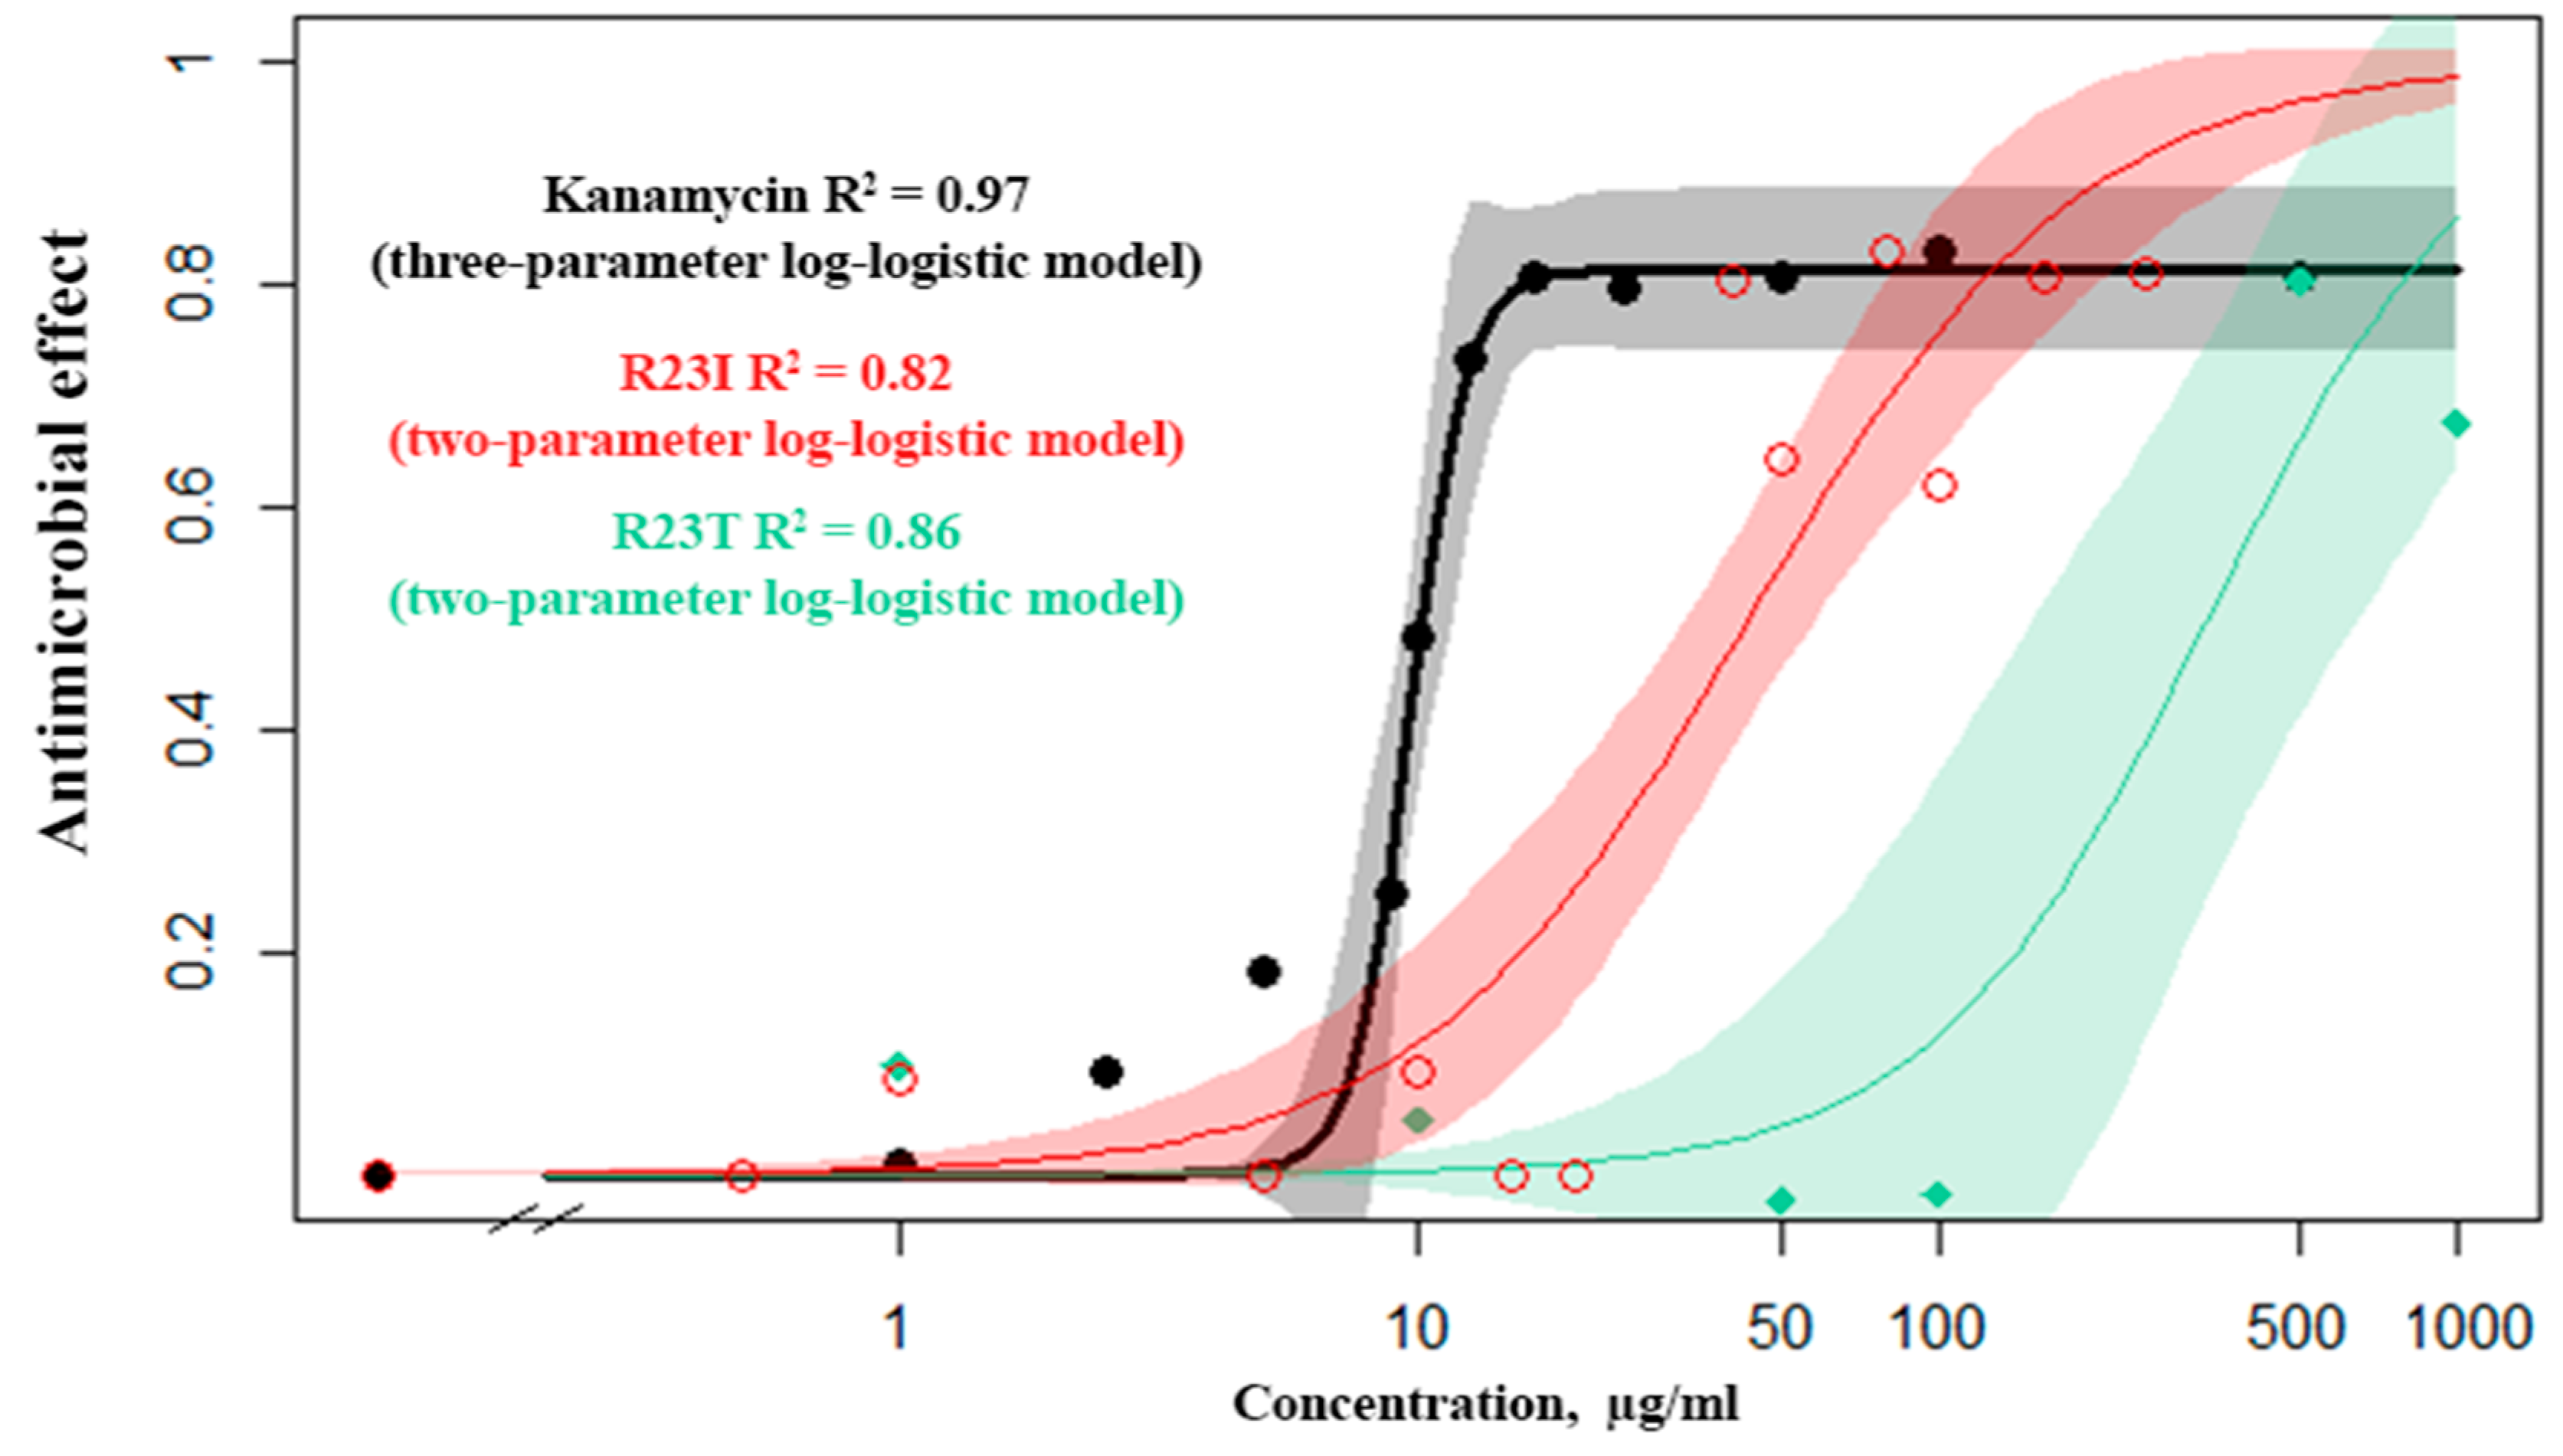
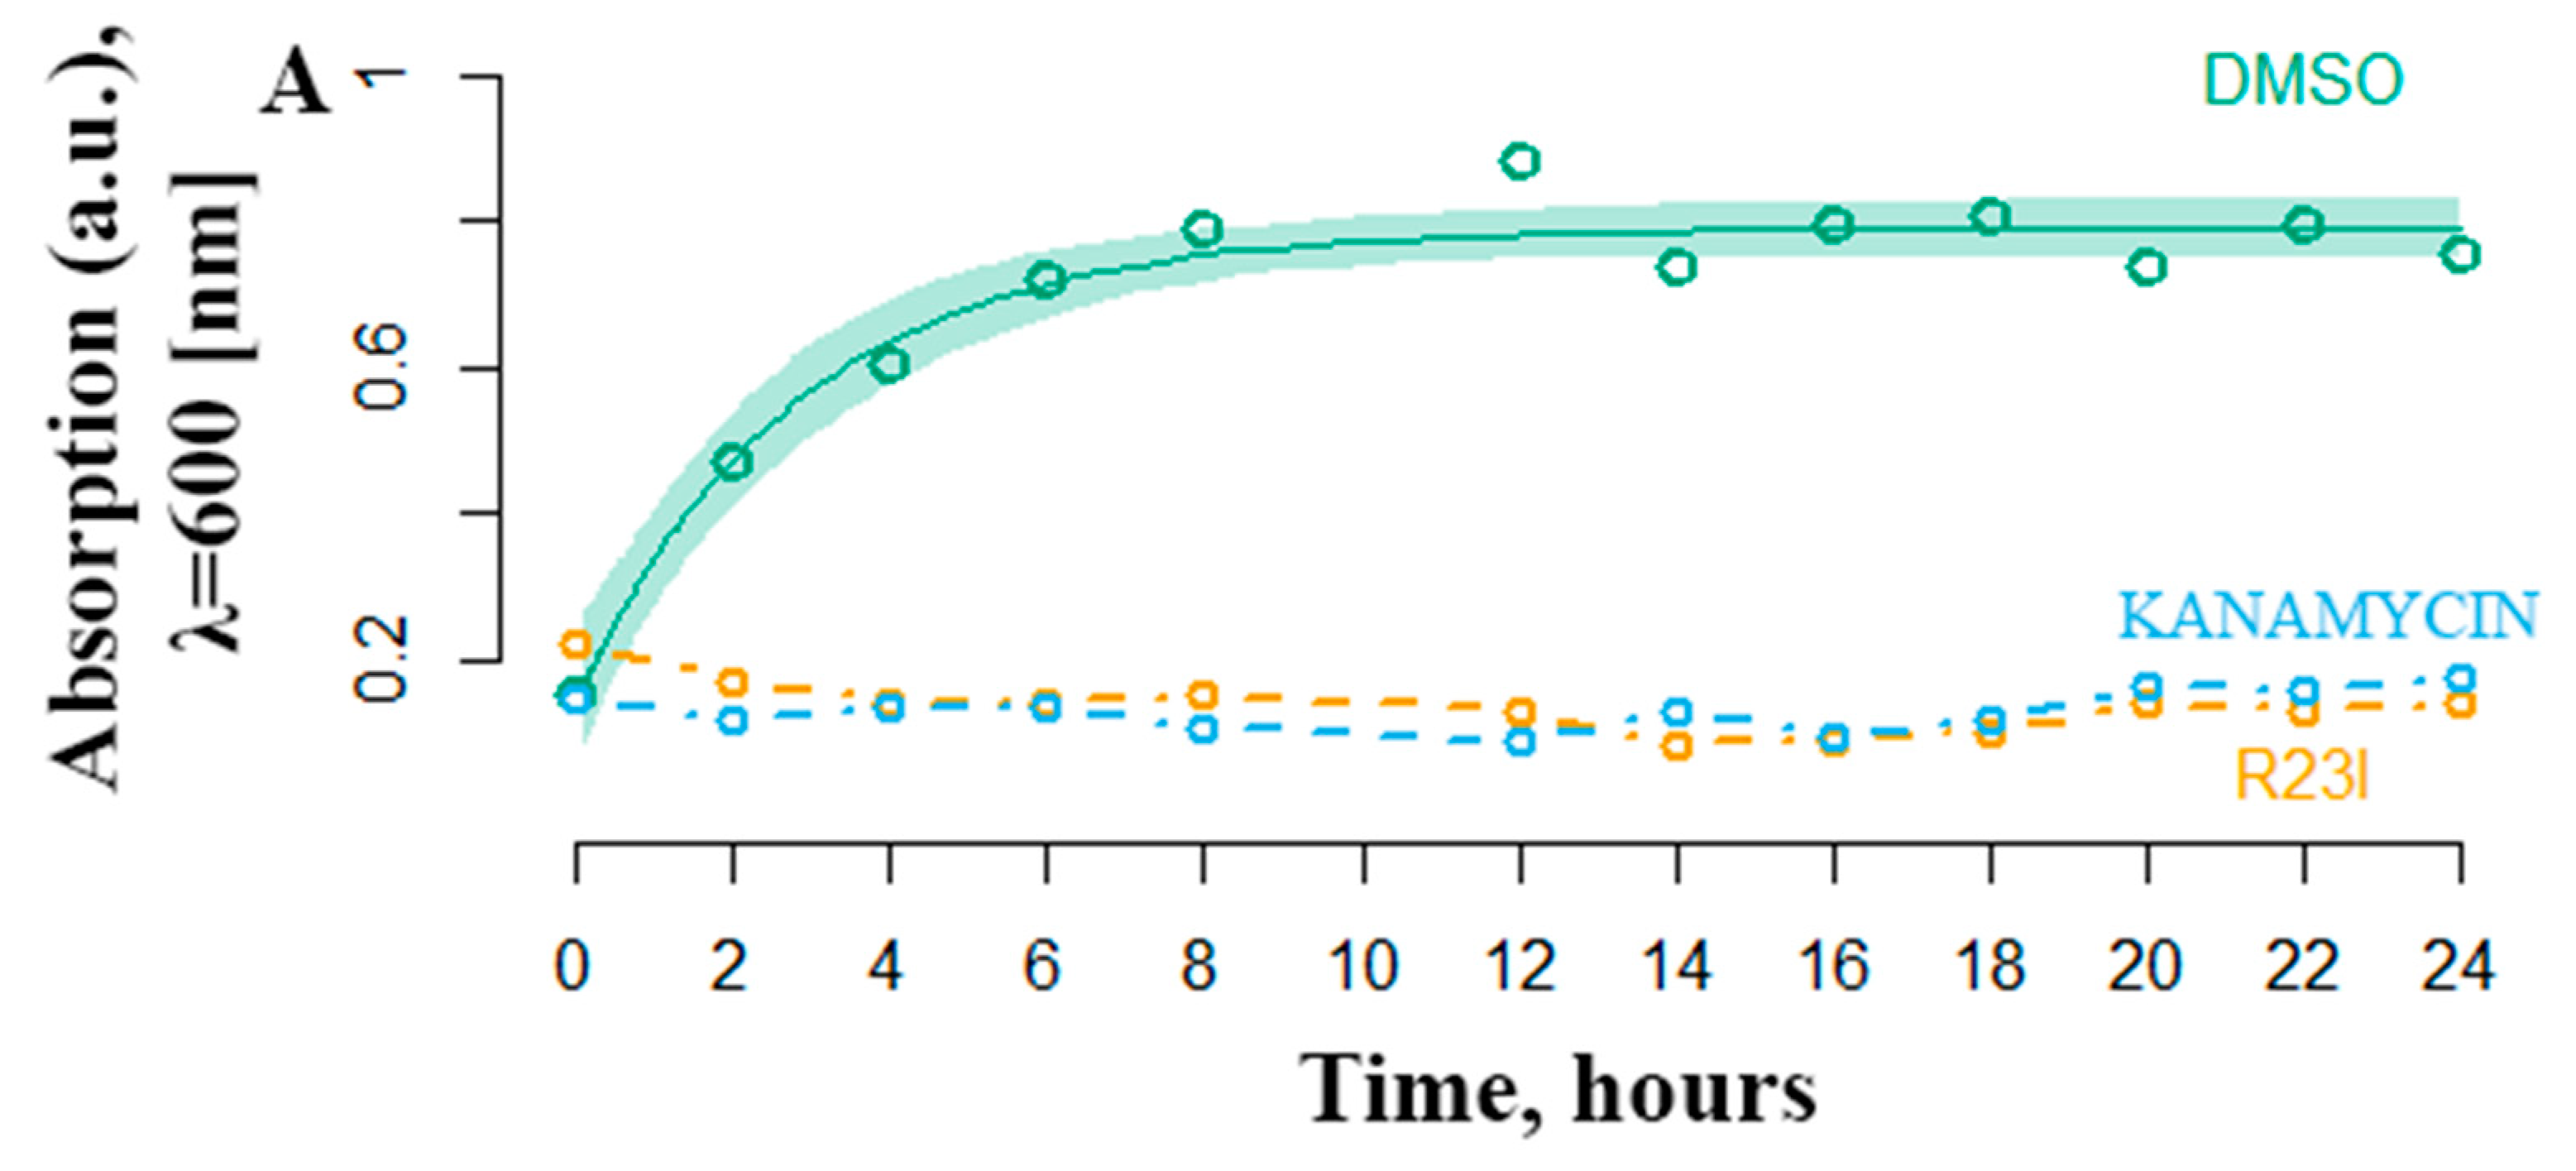
2.3. Evaluation of the Aantimicrobial Activity of Synthesized Peptides by Spectrophotometry
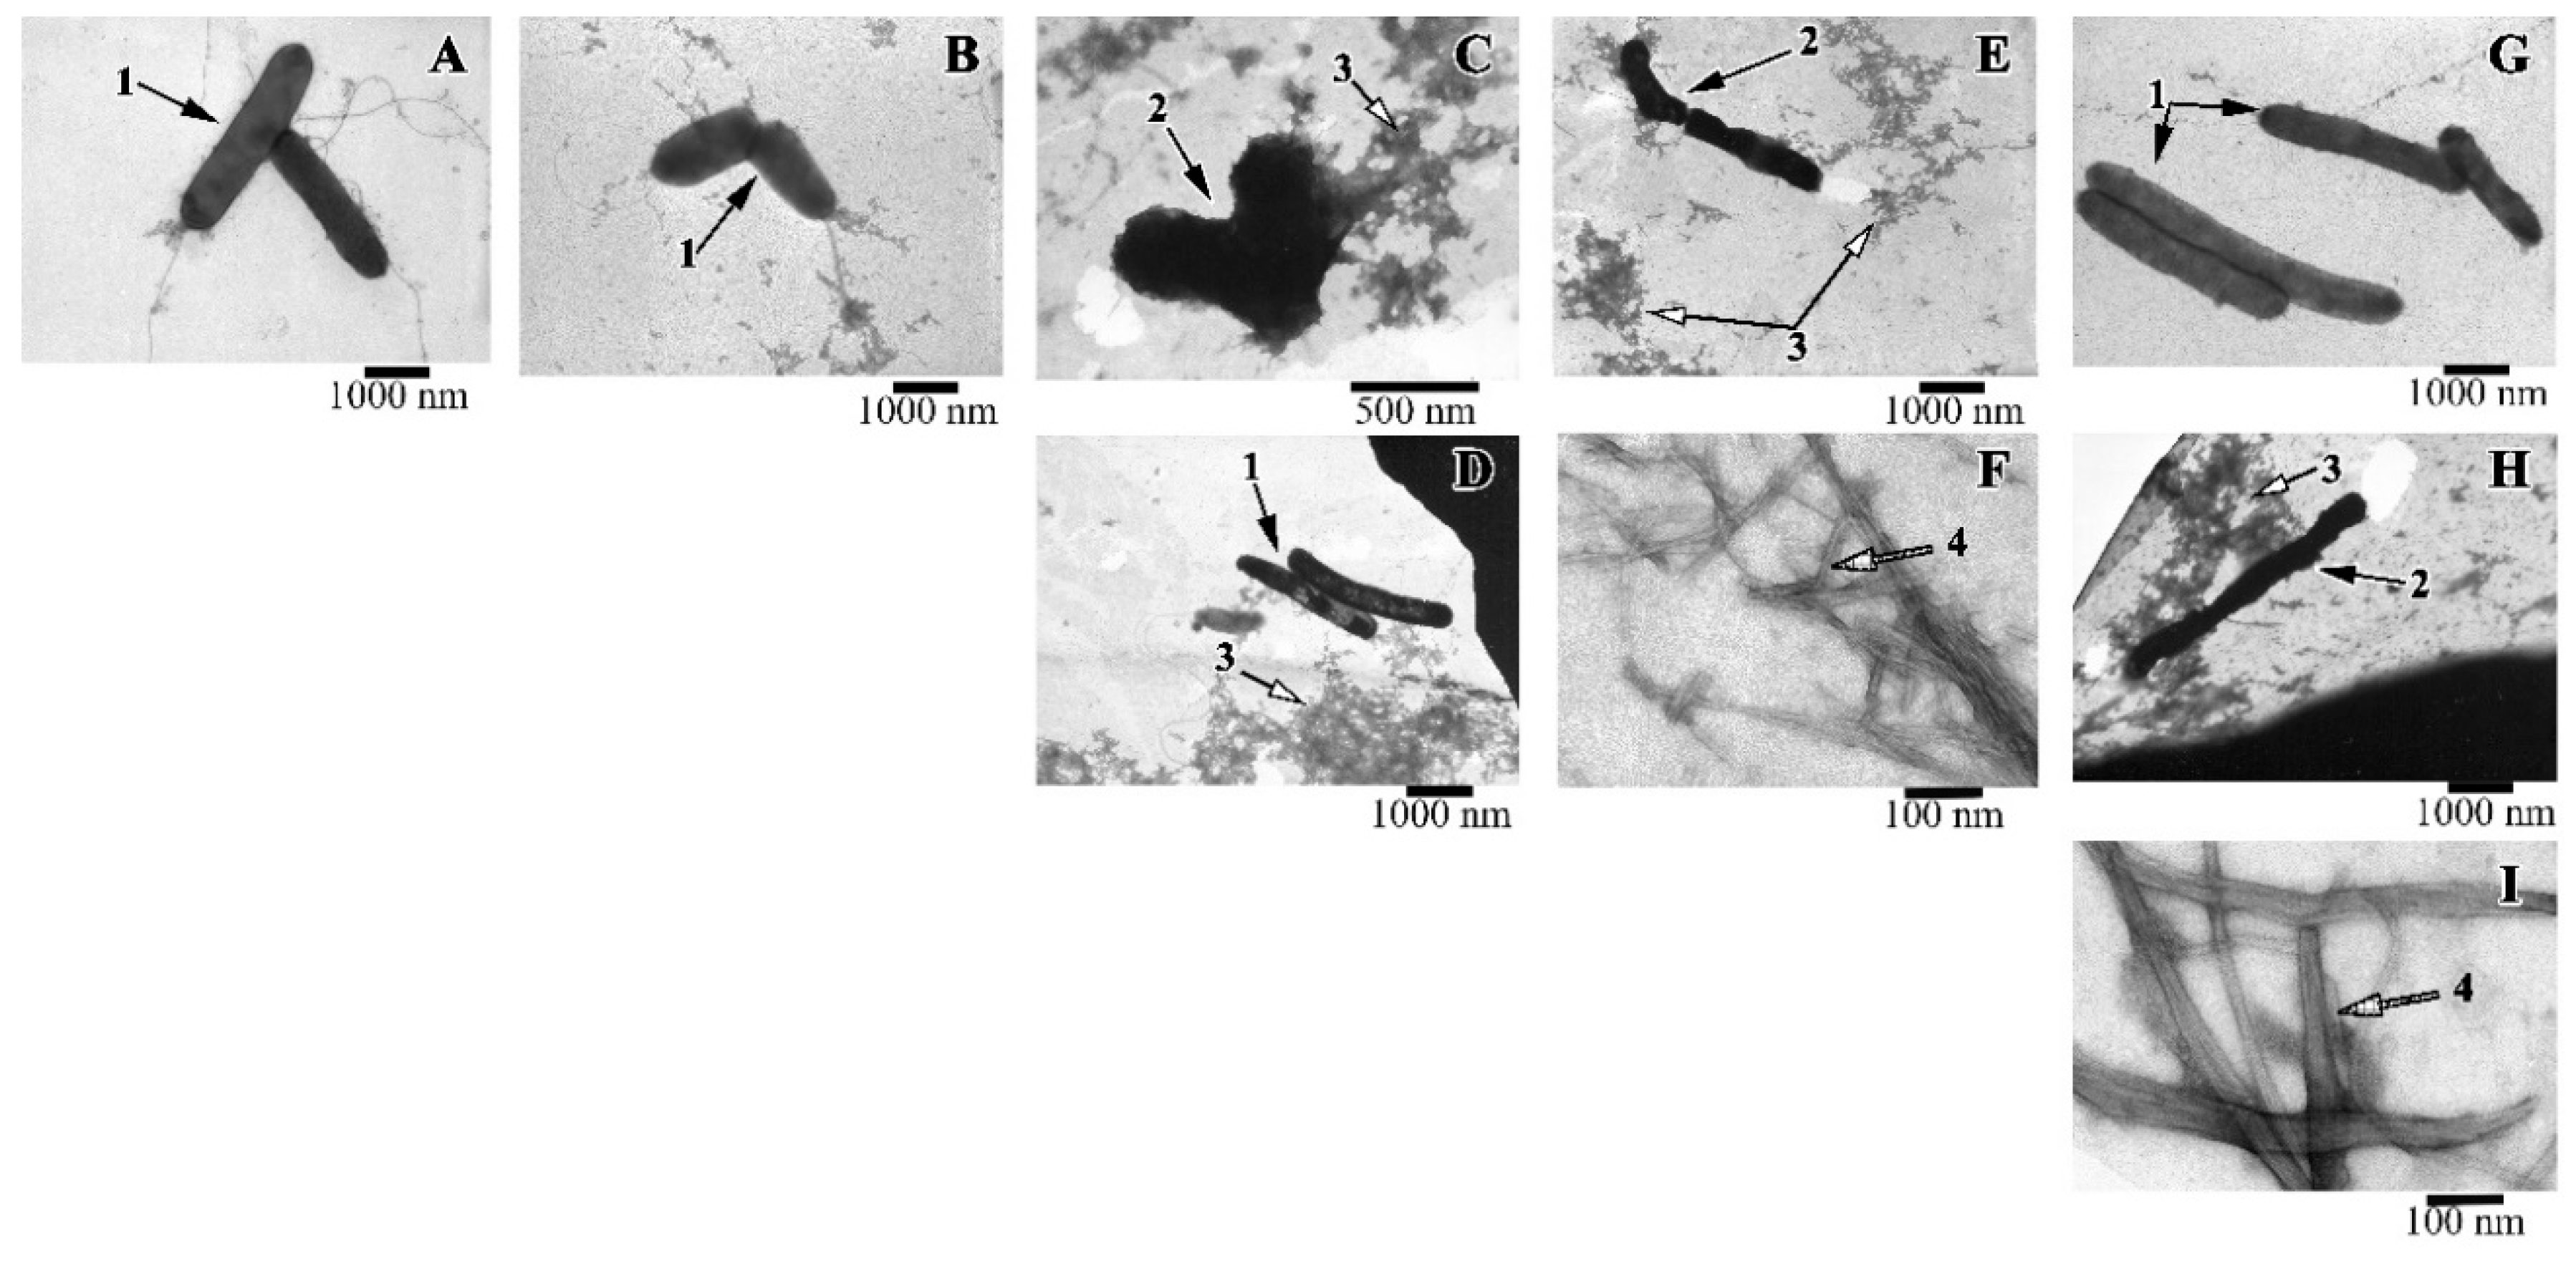
2.4. Morphology of Intact and Peptide-treated T. Thermophilus Cells
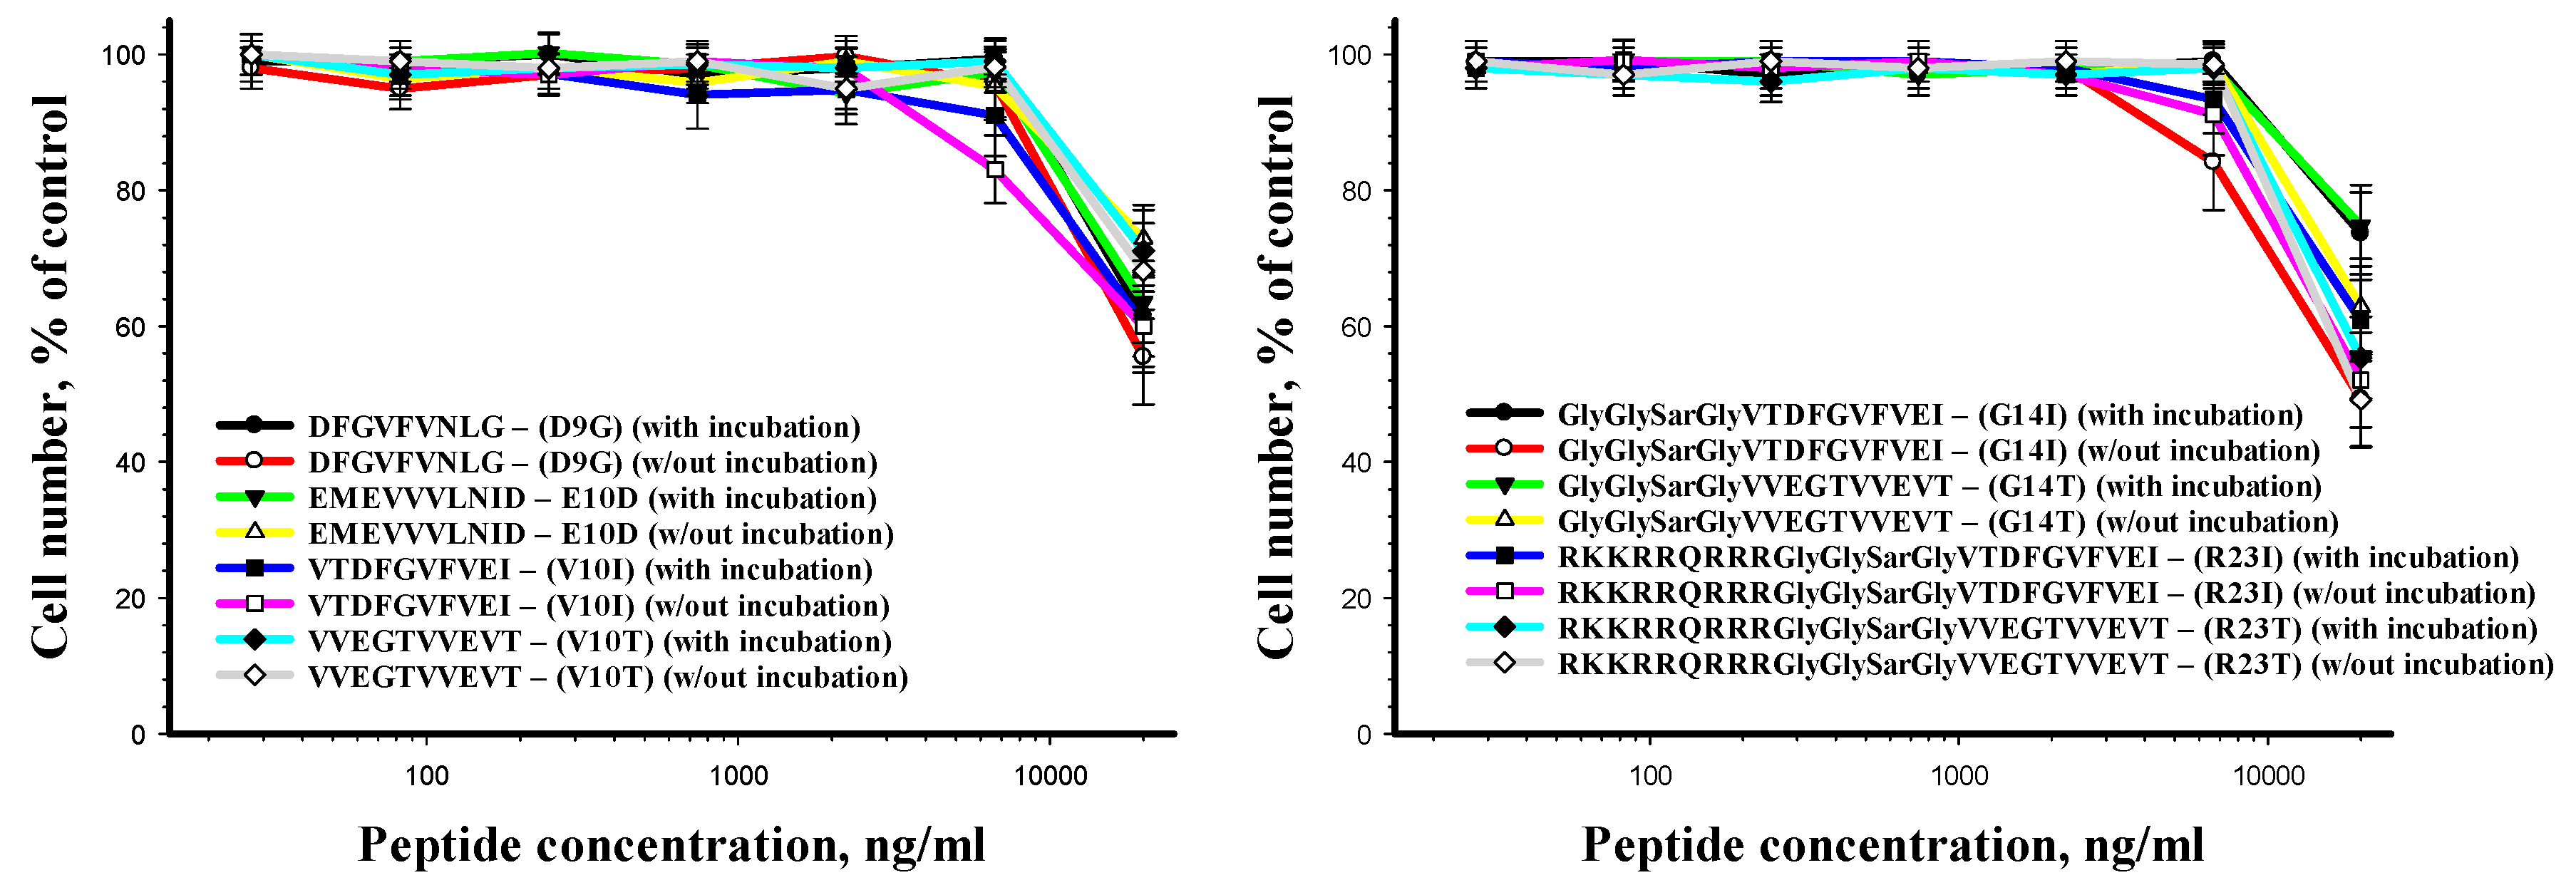
2.5. Cytotoxicity of the Studied Peptides
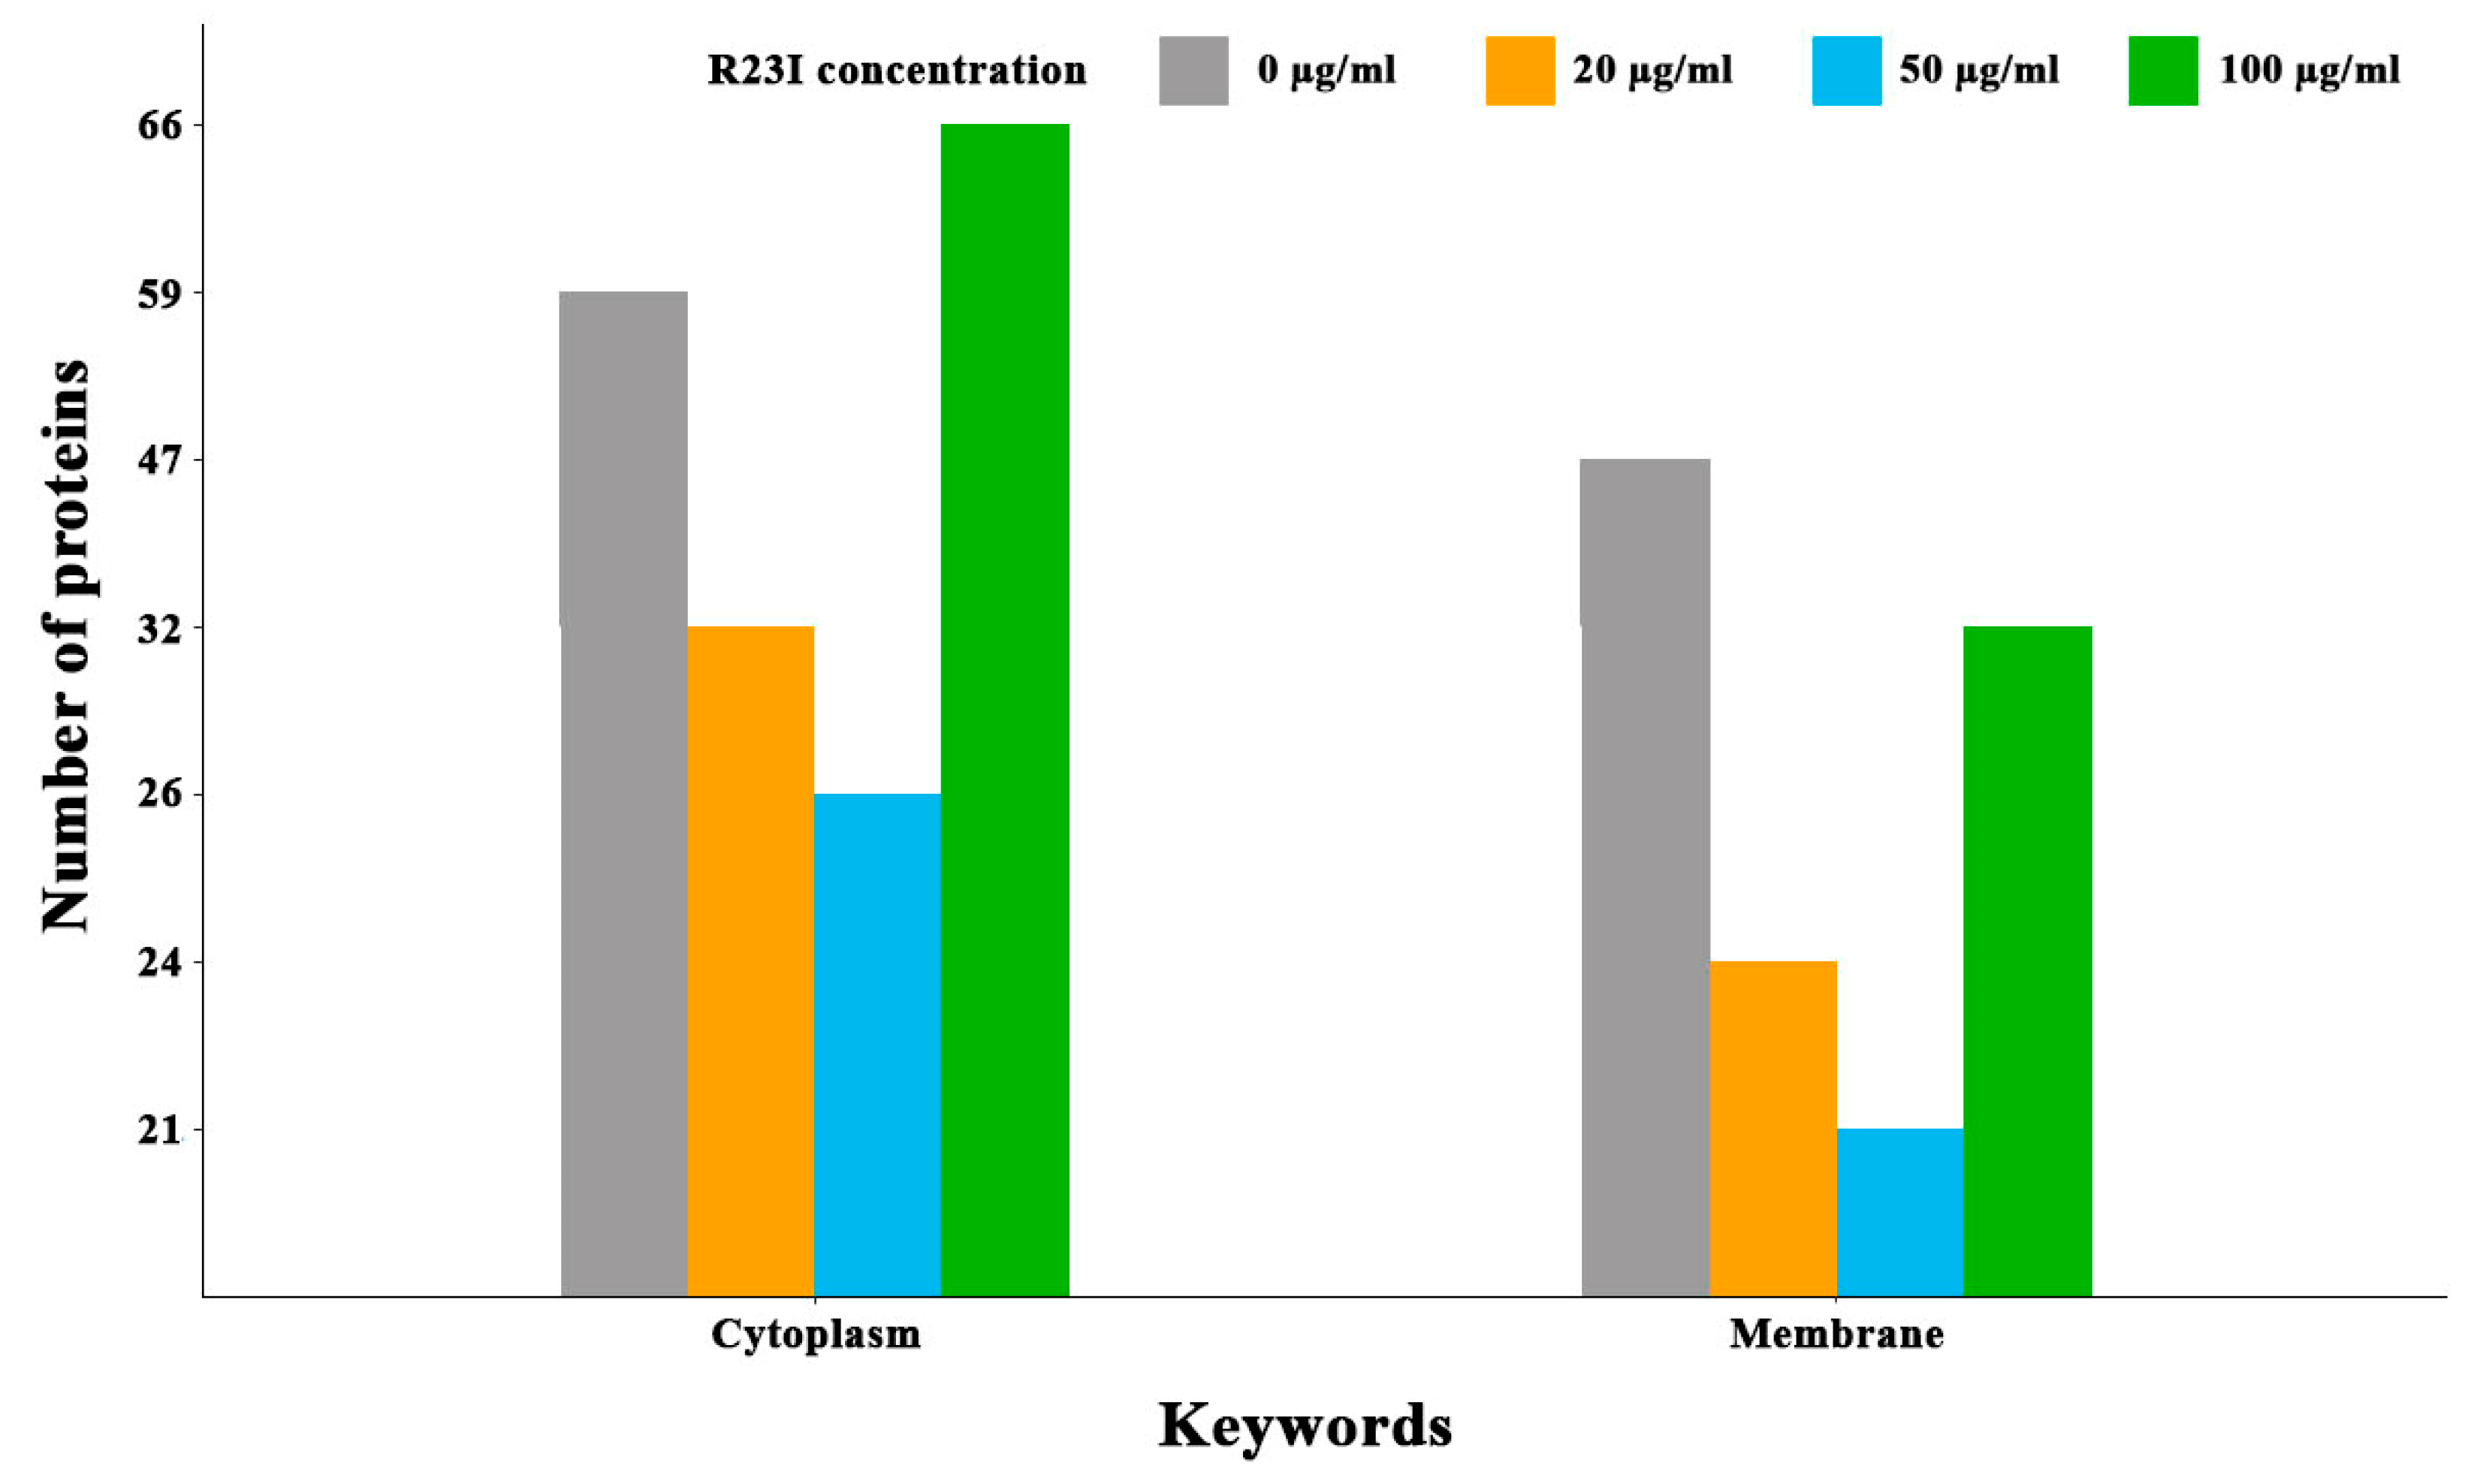
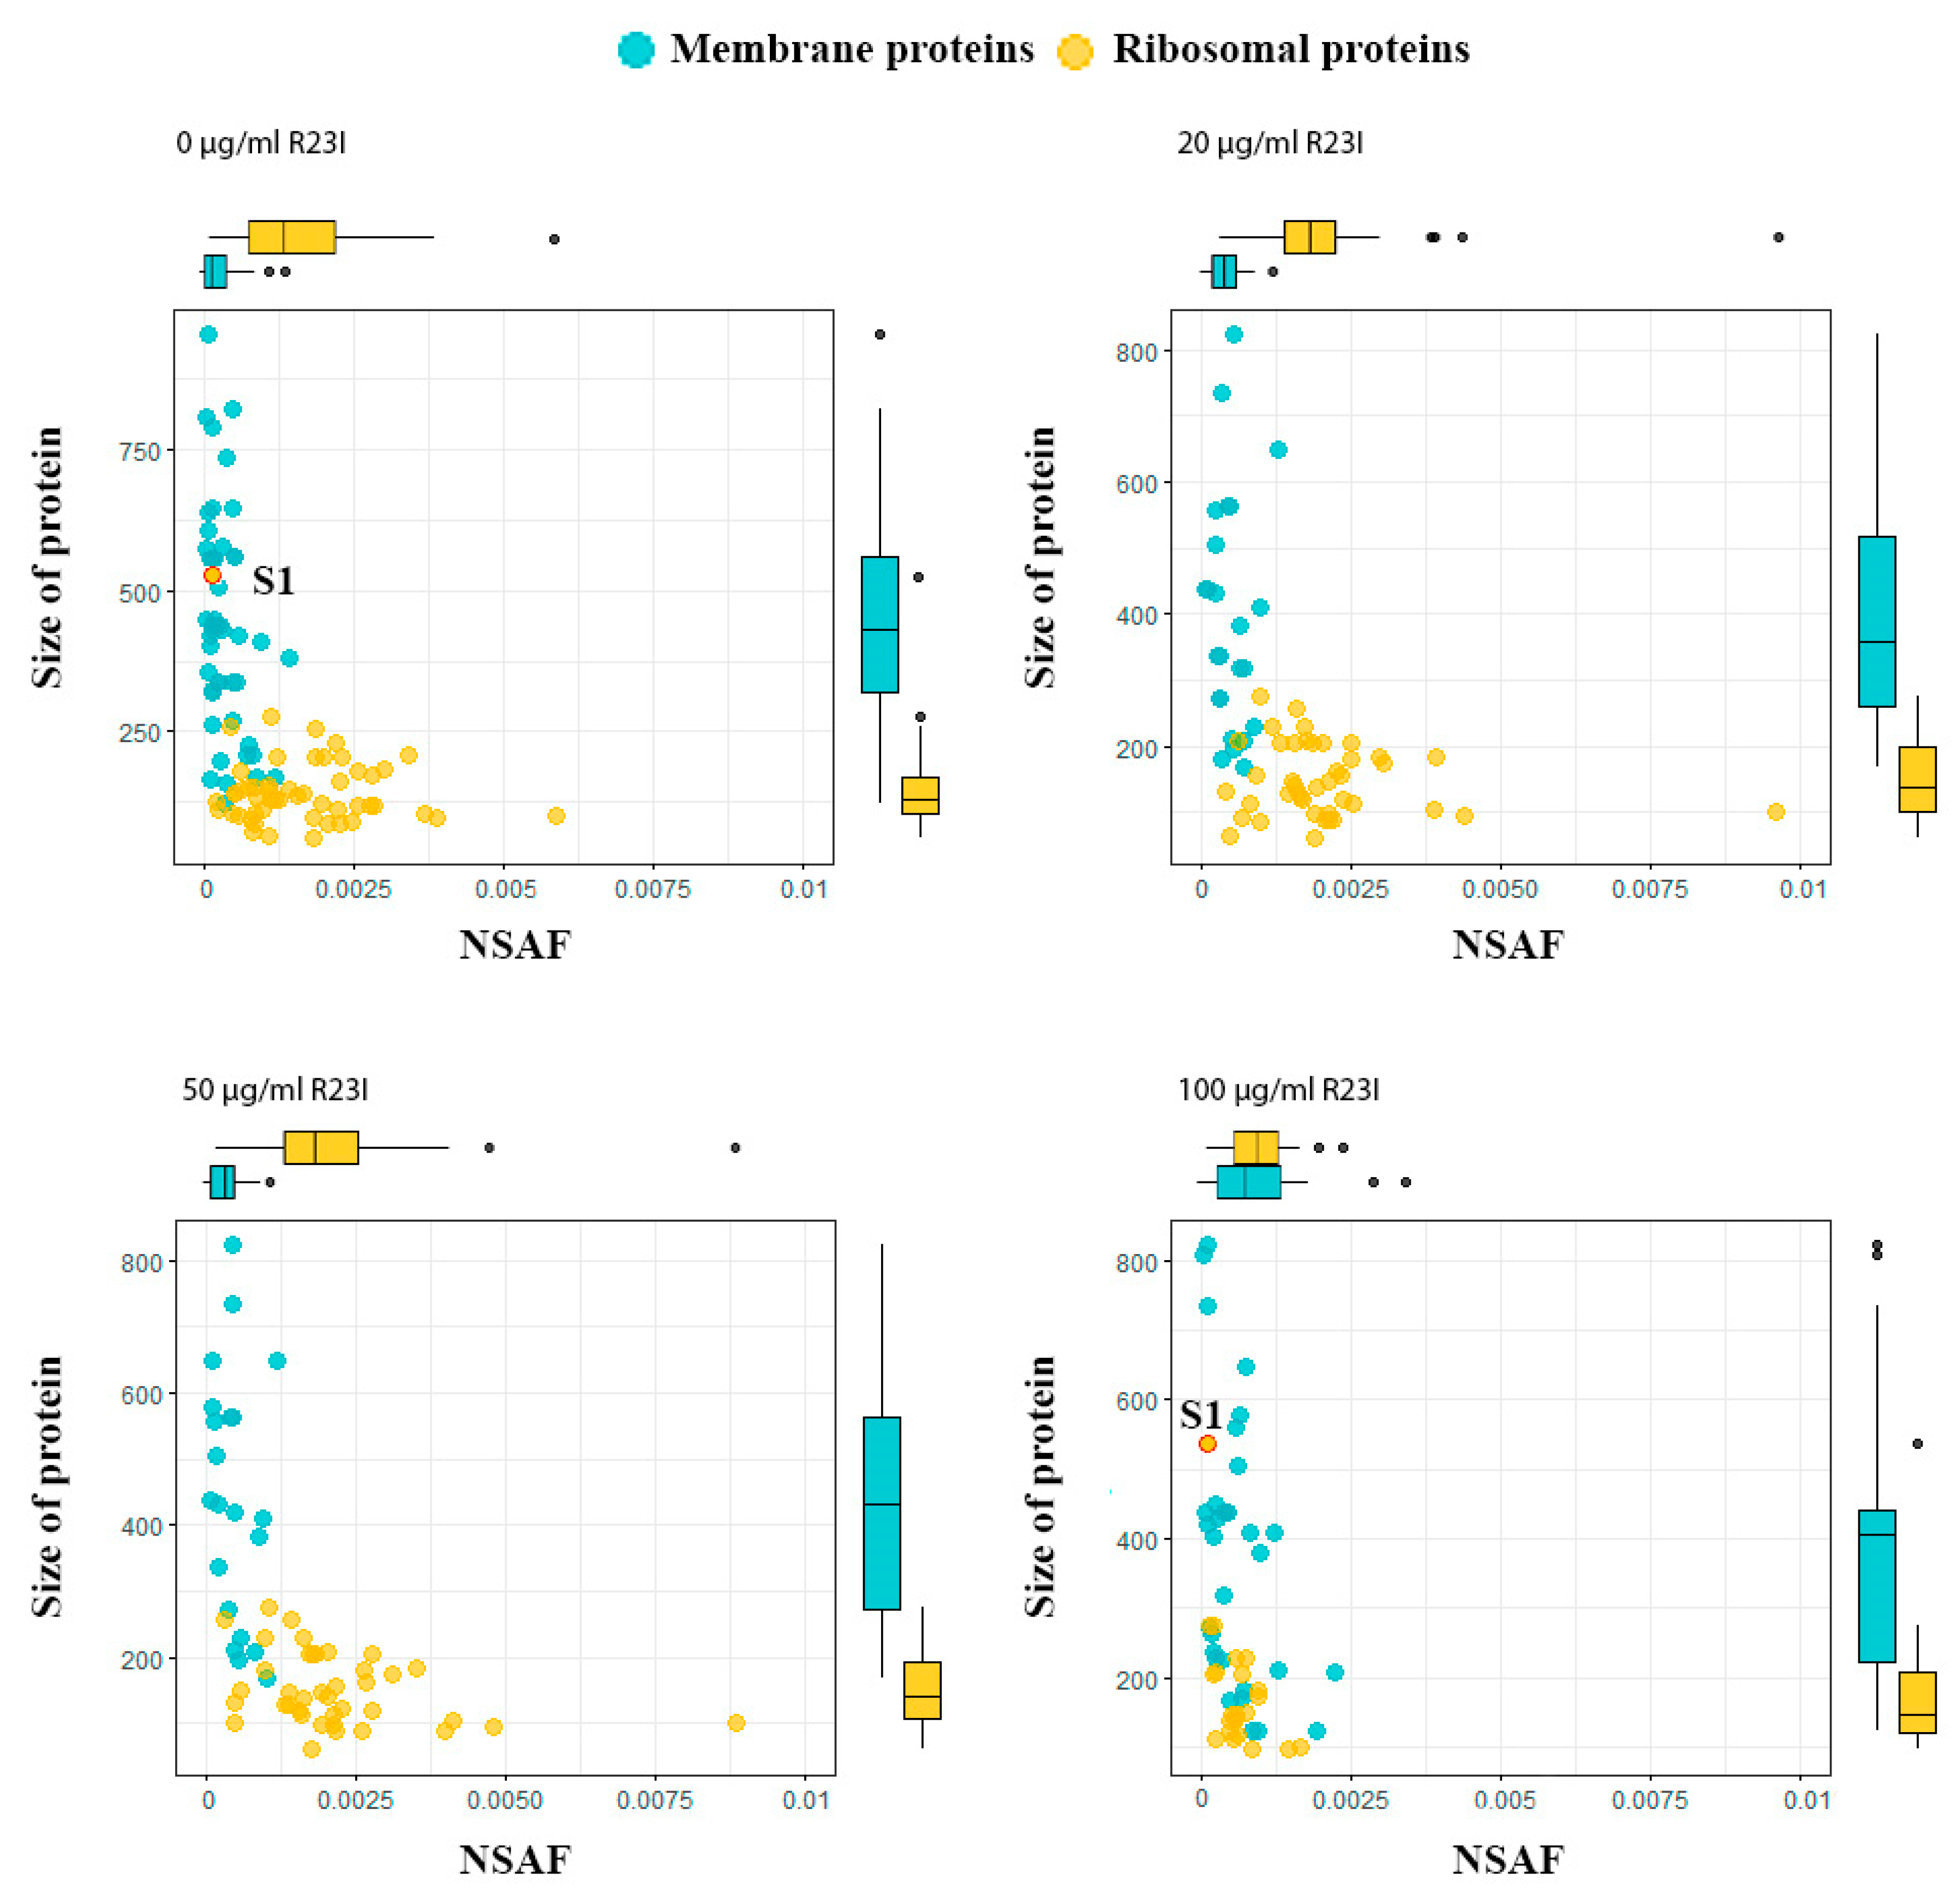
2.6. Study of the Proteome of Intact and Peptide-Treated T. Thermophilus Cells
3. Materials and Methods
3.1. Analysis of Amyloidogenic Regions and Tendency for Antimicrobial Activity
3.2. Chemical Synthesis of Unmodified Peptides and Peptides Modified by HIV Transcription Factor Fragment
3.3. Coagregation of Amyloidogenic Peptides and Ribosomal S1 Protein
3.3.1. Thioflavine T Fluorescence Assay
3.3.2. Transmission Electron Microscopy
3.4. Evaluation of Antimicrobial Activity of Synthesized Peptides by Spectrophotometry
3.5. Construction of Response Curves and Evaluation of the Antimicrobial Effect of the Peptide
3.6. Toxicity Determination to Eukaryotic Cells
3.6.1. Cell Isolation Human Skin Fibroblasts
3.6.2. Cell Viability Analysis
3.6.3. Live and Dead Cell Assay
3.6.4. Caspase-3 Activity Analysis
3.6.5. Cell Cycle Phase Distribution Analysis
3.6.6. Analysis of Mitotic Activity
3.6.7. Analysis of Ki-67 Expression
3.6.8. Cell Migration Analysis
3.6.9. Statistical Analysis
3.7. Mass Spectrometry Analysis
4. Conclusions
Supplementary Materials
Author Contributions
Funding
Acknowledgments
Conflicts of Interest
Abbreviations
| AMP | Antimicrobial Peptide |
| MIC | Minimum Inhibitory Concentration |
| PstB | phosphate import ATP-binding protein |
| TEM | transmission electron microscopy |
| ThT | thioflavine T |
References
- Wang, G. Antimicrobial Peptides: Discovery, Design and Novel Therapeutic Strategies, 2nd ed.; CABI: Oxfordshire, UK; Boston, MA, USA, 2017; ISBN 978-1-78639-041-7. [Google Scholar]
- Dovidchenko, N.V.; Leonova, E.I.; Galzitskaya, O.V. Mechanisms of amyloid fibril formation. Biochem. Mosc. 2014, 79, 1515–1527. [Google Scholar] [CrossRef] [PubMed]
- Zhang, M.; Zhao, J.; Zheng, J. Molecular understanding of a potential functional link between antimicrobial and amyloid peptides. Soft Matter 2014, 10, 7425–7451. [Google Scholar] [CrossRef] [PubMed]
- Gosztyla, M.L.; Brothers, H.M.; Robinson, S.R. Alzheimer’s Amyloid-β is an antimicrobial peptide: A review of the evidence. JAD 2018, 62, 1495–1506. [Google Scholar] [CrossRef] [PubMed]
- Kagan, B.L.; Jang, H.; Capone, R.; Teran Arce, F.; Ramachandran, S.; Lal, R.; Nussinov, R. Antimicrobial properties of amyloid peptides. Mol. Pharm. 2012, 9, 708–717. [Google Scholar] [CrossRef] [PubMed]
- Wower, I.K.; Zwieb, C.W.; Guven, S.A.; Wower, J. Binding and cross-linking of tmRNA to ribosomal protein S1, on and off the Escherichia coli ribosome. EMBO J. 2000, 19, 6612–6621. [Google Scholar] [CrossRef] [PubMed]
- Machulin, A.V.; Deryusheva, E.I.; Selivanova, O.M.; Galzitskaya, O.V. The number of domains in the ribosomal protein S1 as a hallmark of the phylogenetic grouping of bacteria. PLoS ONE 2019, 14, e0221370. [Google Scholar] [CrossRef]
- Garbuzynskiy, S.O.; Lobanov, M.Y.; Galzitskaya, O.V. FoldAmyloid: A method of prediction of amyloidogenic regions from protein sequence. Bioinformatics 2010, 26, 326–332. [Google Scholar] [CrossRef]
- Maurer-Stroh, S.; Debulpaep, M.; Kuemmerer, N.; Lopez de la Paz, M.; Martins, I.C.; Reumers, J.; Morris, K.L.; Copland, A.; Serpell, L.; Serrano, L.; et al. Exploring the sequence determinants of amyloid structure using position-specific scoring matrices. Nat. Methods 2010, 7, 237–242. [Google Scholar] [CrossRef]
- Trovato, A.; Seno, F.; Tosatto, S.C.E. The PASTA server for protein aggregation prediction. Protein Eng. Des. Sel. 2007, 20, 521–523. [Google Scholar] [CrossRef]
- Conchillo-Solé, O.; de Groot, N.S.; Avilés, F.X.; Vendrell, J.; Daura, X.; Ventura, S. AGGRESCAN: A server for the prediction and evaluation of “hot spots” of aggregation in polypeptides. BMC Bioinform. 2007, 8, 65. [Google Scholar] [CrossRef]
- Waghu, F.H.; Barai, R.S.; Gurung, P.; Idicula-Thomas, S. CAMPR3: A database on sequences, structures and signatures of antimicrobial peptides. Nucleic Acids Res. 2016, 44, D1094–D1097. [Google Scholar] [CrossRef] [PubMed]
- Console, S.; Marty, C.; García-Echeverría, C.; Schwendener, R.; Ballmer-Hofer, K. Antennapedia and HIV transactivator of transcription (TAT) “protein transduction domains” promote endocytosis of high molecular weight cargo upon binding to cell surface glycosaminoglycans. J. Biol. Chem. 2003, 278, 35109–35114. [Google Scholar] [CrossRef]
- Zhu, W.L.; Shin, S.Y. Effects of dimerization of the cell-penetrating peptide Tat analog on antimicrobial activity and mechanism of bactericidal action. J. Pept. Sci. 2009, 15, 345–352. [Google Scholar] [CrossRef] [PubMed]
- Hategan, A.; Bianchet, M.A.; Steiner, J.; Karnaukhova, E.; Masliah, E.; Fields, A.; Lee, M.-H.; Dickens, A.M.; Haughey, N.; Dimitriadis, E.K.; et al. HIV Tat protein and amyloid-β peptide form multifibrillar structures that cause neurotoxicity. Nat. Struct. Mol. Biol. 2017, 24, 379–386. [Google Scholar] [CrossRef] [PubMed]
- Wilkins, M.R.; Lindskog, I.; Gasteiger, E.; Bairoch, A.; Sanchez, J.C.; Hochstrasser, D.F.; Appel, R.D. Detailed peptide characterization using PEPTIDEMASS—A World-Wide-Web-accessible tool. Electrophoresis 1997, 18, 403–408. [Google Scholar] [CrossRef]
- Grishin, S.Y.; Deryusheva, E.I.; Machulin, A.V.; Selivanova, O.M.; Glyakina, A.V.; Gorbunova, E.Y.; Mustaeva, L.G.; Azev, V.N.; Rekstina, V.V.; Kalebina, T.S.; et al. Amyloidogenic propensities of ribosomal S1 proteins: Bioinformatics screening and experimental checking. Int. J. Mol. Sci. 2020, 21, 5199. [Google Scholar] [CrossRef]
- Grishin, S.Y.; Dzhus, U.F.; Selivanova, O.M.; Balobanov, V.A.; Surin, A.K.; Galzitskaya, O.V. Comparative analysis of aggregation of Thermus Thermophilus ribosomal protein bS1 and its stable fragment. Biochem. Mosc. 2020, 85, 344–354. [Google Scholar] [CrossRef]
- Bubis, J.A.; Levitsky, L.I.; Ivanov, M.V.; Tarasova, I.A.; Gorshkov, M.V. Comparative evaluation of label-free quantification methods for shotgun proteomics. Rapid Commun. Mass Spectrom. 2017, 31, 606–612. [Google Scholar] [CrossRef]
- Pagels, M.; Fuchs, S.; Pané-Farré, J.; Kohler, C.; Menschner, L.; Hecker, M.; McNamarra, P.J.; Bauer, M.C.; von Wachenfeldt, C.; Liebeke, M.; et al. Redox sensing by a Rex-family repressor is involved in the regulation of anaerobic gene expression in Staphylococcus aureus. Mol. Microbiol. 2010, 76, 1142–1161. [Google Scholar] [CrossRef]
- Shih, T.-W.; Pan, T.-M. Stress responses of thermophilic Geobacillus sp. NTU 03 caused by heat and heat-induced stress. Microbiol. Res. 2011, 166, 346–359. [Google Scholar] [CrossRef]
- Gray, M.J.; Wholey, W.-Y.; Wagner, N.O.; Cremers, C.M.; Mueller-Schickert, A.; Hock, N.T.; Krieger, A.G.; Smith, E.M.; Bender, R.A.; Bardwell, J.C.A.; et al. Polyphosphate is a primordial chaperone. Mol. Cell 2014, 53, 689–699. [Google Scholar] [CrossRef] [PubMed]
- Huang, Q.-Y.; Fang, C.-W.; Huang, H.-Q. Alteration of heart tissue protein profiles in acute cadmium-treated scallops Patinopecten yessoensis. Arch. Environ. Contam. Toxicol. 2011, 60, 90–98. [Google Scholar] [CrossRef] [PubMed][Green Version]
- Segatore, B.; Massidda, O.; Satta, G.; Setacci, D.; Amicosante, G. High specificity of cphA-encoded metallo-beta-lactamase from Aeromonas hydrophila AE036 for carbapenems and its contribution to beta-lactam resistance. Antimicrob. Agents Chemother. 1993, 37, 1324–1328. [Google Scholar] [CrossRef] [PubMed]
- Chakraborti, P.K.; Bhatt, K.; Banerjee, S.K.; Misra, P. Role of an ABC importer in mycobacterial drug resistance. Biosci. Rep. 1999, 19, 293–300. [Google Scholar] [CrossRef] [PubMed]
- Surolia, N.; Surolia, A. Triclosan offers protection against blood stages of malaria by inhibiting enoyl-ACP reductase of Plasmodium falciparum. Nat. Med. 2001, 7, 167–173. [Google Scholar] [CrossRef]
- Ritz, C.; Streibig, J.C. Bioassay analysis using R. J. Stat. Soft. 2005, 12. [Google Scholar] [CrossRef]
- Knezevic, S.Z.; Streibig, J.C.; Ritz, C. Utilizing R software package for dose-response studies: The concept and data analysis. Weed Technol. 2007, 21, 840–848. [Google Scholar] [CrossRef]
- Zhang, J.; Xin, L.; Shan, B.; Chen, W.; Xie, M.; Yuen, D.; Zhang, W.; Zhang, Z.; Lajoie, G.A.; Ma, B. PEAKS DB: De novo sequencing assisted database search for sensitive and accurate peptide identification. Mol. Cell Proteom. 2012, 11, M111.010587. [Google Scholar] [CrossRef]
- Levitsky, L.I.; Ivanov, M.V.; Lobas, A.A.; Bubis, J.A.; Tarasova, I.A.; Solovyeva, E.M.; Pridatchenko, M.L.; Gorshkov, M.V. IdentiPy: An extensible search engine for protein identification in shotgun proteomics. J. Proteome Res. 2018, 17, 2249–2255. [Google Scholar] [CrossRef]
- Wickham, H. Reshaping Data with the reshape Package. J. Stat. Soft. 2007, 21. [Google Scholar] [CrossRef]
- Wickham, H. Ggplot2: Elegant Graphics for Data Analysis; Use R! Springer: New York, NY, USA, 2009; ISBN 978-0-387-98140-6. [Google Scholar]
- Hasan, A.; Saxena, V.; Castelletto, V.; Zimbitas, G.; Seitsonen, J.; Ruokolainen, J.; Pandey, L.M.; Sefcik, J.; Hamley, I.W.; Lau, K.H.A. Chain-end modifications and sequence arrangements of antimicrobial Peptoids for mediating activity and Nano-assembly. Front. Chem. 2020, 8, 416. [Google Scholar] [CrossRef] [PubMed]


| Peptide | Sequence | Mw | pI | CAMPR3 Method | |||
|---|---|---|---|---|---|---|---|
| Support Vector Machine (svm) | Random Forest (rf) | Artificial Neural Network (ann) | Discriminant Analysis (da) | ||||
| D9G | DFGVFVNLG | 967.1 | 3.8 | 0.00 * | 0.41 | ** | 0.03 |
| E10D | EMEVVVLNID | 1160.3 | 3.4 | 0.10 | 0.45 | * | 0.01 |
| V10I | VTDFGVFVEI | 1125.3 | 3.5 | 0.80 ** | 0.44 | * | 0.03 |
| V10T | VVEGTVVEVT | 1031.2 | 3.5 | 0.08 | 0.50 | * | 0.00 |
| G14I | GGSar#(A)GVTDFGVFVEI | 1367.5 | 3.7 | 0.134 | 0.405 | * | 0.367 |
| G14T | GGSar#(A)G VVEGTVVEVT | 1273.4 | 3.8 | 0.04 | 0.39 | * | 0.01 |
| R23I | RKKRRQRRRGGSar#(A)GVTDFGVFVEI | 2689.1 | 12.0 | 0.03 | 0.51 | * | 0.99 |
| R23T | RKKRRQRRRGGSar#(A)GVVEGTVVEVT | 2595.0 | 12.0 | 0.01 | 0.47 | * | 0.59 |
| G1 Phase | S Phase | G2 Phase | M Phase | |
|---|---|---|---|---|
| Peptides | 83 ± 4% | 12 ± 3% | 5 ± 1% | 0% |
| Control | 62 ± 3% | 21 ± 3%% | 12 ± 2% | 5 ± 1% |
| Concentration of R23I, μg/ml | Ribosomal Proteins | All Proteins |
|---|---|---|
| 0 | 51 (with S1) | 386 |
| 20 | 42 (without S1) | 232 |
| 50 | 39 (without S1) | 201 |
| 100 | 23 (with S1) | 395 |
| Model | Function | Description |
|---|---|---|
| Log-logistic model with three parameters (d, b, e) | Individual sensitivity is the same for both low and high doses | |
| Log-logistic model with two parameters (b, e) | ||
| Exponential model with two parameters (d, e) | Description of unknown dependency types | |
| Model Michaelis-Menten with two parameters (d, e) | Universal hyperbolic dependence of a decrease in growth rate | |
| Weibull model-1 with three parameters | Sensitivity is not the same for low and high concentrations. The Weibull-1 curve slowly decreases in the region of the upper limit, but faster approaches a lower limit |
© 2020 by the authors. Licensee MDPI, Basel, Switzerland. This article is an open access article distributed under the terms and conditions of the Creative Commons Attribution (CC BY) license (http://creativecommons.org/licenses/by/4.0/).
Share and Cite
Kurpe, S.R.; Grishin, S.Y.; Surin, A.K.; Selivanova, O.M.; Fadeev, R.S.; Dzhus, U.F.; Gorbunova, E.Y.; Mustaeva, L.G.; Azev, V.N.; Galzitskaya, O.V. Antimicrobial and Amyloidogenic Activity of Peptides Synthesized on the Basis of the Ribosomal S1 Protein from Thermus Thermophilus. Int. J. Mol. Sci. 2020, 21, 6382. https://doi.org/10.3390/ijms21176382
Kurpe SR, Grishin SY, Surin AK, Selivanova OM, Fadeev RS, Dzhus UF, Gorbunova EY, Mustaeva LG, Azev VN, Galzitskaya OV. Antimicrobial and Amyloidogenic Activity of Peptides Synthesized on the Basis of the Ribosomal S1 Protein from Thermus Thermophilus. International Journal of Molecular Sciences. 2020; 21(17):6382. https://doi.org/10.3390/ijms21176382
Chicago/Turabian StyleKurpe, Stanislav R., Sergei Yu. Grishin, Alexey K. Surin, Olga M. Selivanova, Roman S. Fadeev, Ulyana F. Dzhus, Elena Yu. Gorbunova, Leila G. Mustaeva, Vyacheslav N. Azev, and Oxana V. Galzitskaya. 2020. "Antimicrobial and Amyloidogenic Activity of Peptides Synthesized on the Basis of the Ribosomal S1 Protein from Thermus Thermophilus" International Journal of Molecular Sciences 21, no. 17: 6382. https://doi.org/10.3390/ijms21176382
APA StyleKurpe, S. R., Grishin, S. Y., Surin, A. K., Selivanova, O. M., Fadeev, R. S., Dzhus, U. F., Gorbunova, E. Y., Mustaeva, L. G., Azev, V. N., & Galzitskaya, O. V. (2020). Antimicrobial and Amyloidogenic Activity of Peptides Synthesized on the Basis of the Ribosomal S1 Protein from Thermus Thermophilus. International Journal of Molecular Sciences, 21(17), 6382. https://doi.org/10.3390/ijms21176382