Article

Potential Associations Among Alteration of Salivary miRNAs, Saliva Microbiome Structure, and Cognitive Impairments in Autistic Children

by
Marco Ragusa
1,2,‡,
Maria Santagati
3,‡,
Federica Mirabella
1,‡,
Giovanni Lauretta
1,
Matilde Cirnigliaro
1,
Duilia Brex
1,
Cristina Barbagallo
1,
Carla Noemi Domini
4,
Mariangela Gulisano
4,
Rita Barone
4,
Laura Trovato
3,
Salvatore Oliveri
3,
Gino Mongelli
3,5,
Ambra Spitale
3,
Davide Barbagallo
1,
Cinzia Di Pietro
1,†,
Stefania Stefani
3,†,
Renata Rizzo
4,† and
Michele Purrello
1,*
1
Department of Biomedical and Biotechnological Sciences, Section of Biology and Genetics G. Sichel, University of Catania, 95123 Catania, Italy
2
Oasi Research Institute—IRCCS, 94018 Troina, Italy
3
Department of Biomedical and Biotechnological Sciences, Section of Microbiology, University of Catania, 95123 Catania, Italy
4
Department of Clinical and Experimental Medicine, Section of Child and Adolescent Psychiatry, University of Catania, 95123 Catania, Italy
5
Bio-nanotech Research and Innovation Tower (BRIT), University of Catania, 95123 Catania, Italy
*
Author to whom correspondence should be addressed.
Senior Authors.
These authors contributed equally to this work.
Int. J. Mol. Sci. 2020, 21(17), 6203; https://doi.org/10.3390/ijms21176203
Submission received: 14 July 2020 / Revised: 16 August 2020 / Accepted: 25 August 2020 / Published: 27 August 2020
(This article belongs to the Special Issue Medical Genetics, Genomics and Bioinformatics – 2020)

Abstract

:
Recent evidence has demonstrated that salivary molecules, as well as bacterial populations, can be perturbed by several pathological conditions, including neuro-psychiatric diseases. This relationship between brain functionality and saliva composition could be exploited to unveil new pathological mechanisms of elusive diseases, such as Autistic Spectrum Disorder (ASD). We performed a combined approach of miRNA expression profiling by NanoString technology, followed by validation experiments in qPCR, and 16S rRNA microbiome analysis on saliva from 53 ASD and 27 neurologically unaffected control (NUC) children. MiR-29a-3p and miR-141-3p were upregulated, while miR-16-5p, let-7b-5p, and miR-451a were downregulated in ASD compared to NUCs. Microbiome analysis on the same subjects revealed that Rothia, Filifactor, Actinobacillus, Weeksellaceae, Ralstonia, Pasteurellaceae, and Aggregatibacter increased their abundance in ASD patients, while Tannerella, Moryella and TM7-3 decreased. Variations of both miRNAs and microbes were statistically associated to different neuropsychological scores related to anomalies in social interaction and communication. Among miRNA/bacteria associations, the most relevant was the negative correlation between salivary miR-141-3p expression and Tannerella abundance. MiRNA and microbiome dysregulations found in the saliva of ASD children are potentially associated with cognitive impairments of the subjects. Furthermore, a potential cross-talking between circulating miRNAs and resident bacteria could occur in saliva of ASD.

1. Introduction

Autism Spectrum Disorder (ASD) is a heterogeneous group of complex neurodevelopmental disorders characterized by impaired social communication and the presence of stereotyped and repetitive behaviors [1]. The etiopathogenesis of ASD is still unclear but is believed to be the complex result of a combination of genetic, epigenetic and environmental factors [2,3,4]. ASD is genetically highly heterogeneous. Both inherited and de novo ASD-associated variants have been characterized in hundreds of genes [5,6,7,8,9,10,11,12]. Immune dysregulation and gastrointestinal abnormalities are of particular interest in the light of several papers reporting ASD-associated disturbances in the peripheral, enteric and neuro-immune systems [13,14]. This association of ASD with a great prevalence of immune and gastrointestinal dysregulations led to investigations on the gut microbiome of ASD patients, which is emerging as a key regulator of intestinal physiology, neuroimmunity, and host behavior. Intriguingly, reports on gnotobiotic animals and probiotic studies have shown that microbiome dysregulation can directly induce behavioral and neuropathological endophenotypes of human ASD [15,16,17,18,19]. The gut microbiota represents a barrier against the proliferation of pathogenic organisms [20], playing a key role in the functioning of the host immune system [21], modulating gene expression [22], and reducing inflammation [23]. Alterations of brain structure and function development are related to modifications of the gut microbial composition because the interactions between this and the Central Nervous System (CNS) are already established during fetal life and maintained in adults [24]. Despite several reports about gut microbiota dysbiosis in ASD patients, there is little consensus across independent studies on specific bacterial species that are similarly altered [25]. Moreover, whether microbiome alteration is caused by ASD symptoms or whether it contributes to the ASD gut phenotypes is still unclear. While mounting evidence suggests a key role for the gut microbiota in ASD, the etiopathogenetic contribution of microorganisms living in the oral cavity has not been satisfactorily explored. The oral cavity represents the major gateway of bacteria into the human body: it is a unique and complex habitat [26], which harbors approximately 700 predominant taxa [27]. In addition, biologically relevant interactions between the saliva microbiome and other microbiomes in the human body may occur [28]. Several studies have shown that saliva microbiome is dysregulated in patients affected by systemic diseases, such as liver cirrhosis, diabetes, rheumatoid arthritis, and cancer [29,30,31,32,33]. The oral microbiome is modulated in response to several intrinsic and extrinsic factors that may in turn affect brain functionality [34]. The oral cavity is considered an important source of alterations that manifest at distant body sites, including the neural system [27]. Indeed, some studies reported the effects of the oral microbiome on neural functions. Accordingly, oral dysbiosis has been associated with Parkinson’s disease, Alzheimer’s disease, multiple sclerosis, and migraine [35,36,37,38,39]. Saliva also represents an important reservoir of molecules, including proteins and microRNAs (miRNAs), associated with the pathological development of neurological diseases and brain dysfunctions [40,41,42,43,44,45,46]. Recently, fourteen miRNAs were found differentially expressed in the saliva of ASD patients and showed significant correlations with Vineland neurodevelopmental scores [47]. Based on these premises, we report the miRnome and microbiome analysis from saliva of ASD children with the aim to verify the existence of a molecular correlation between miRNA dysregulation and salivary dysbiosis and their contribution to ASD pathogenesis.

2. Results

2.1. Demographic and Neuropsychological Characteristics

We recruited a total of 115 children from various socio-economic contexts (age range: 4–8 years): 76 treatment-naïve patients affected by ASD (M:F 62:15), mean age 7 (SD ± 1.5), which were compared to 39 neurologically unaffected controls (NUC) (M:F 29:11), mean age 6.75 (SD ± 1.51). Demographic, neuropsychological and hematological characteristics of the clinical sample are shown in Table 1.

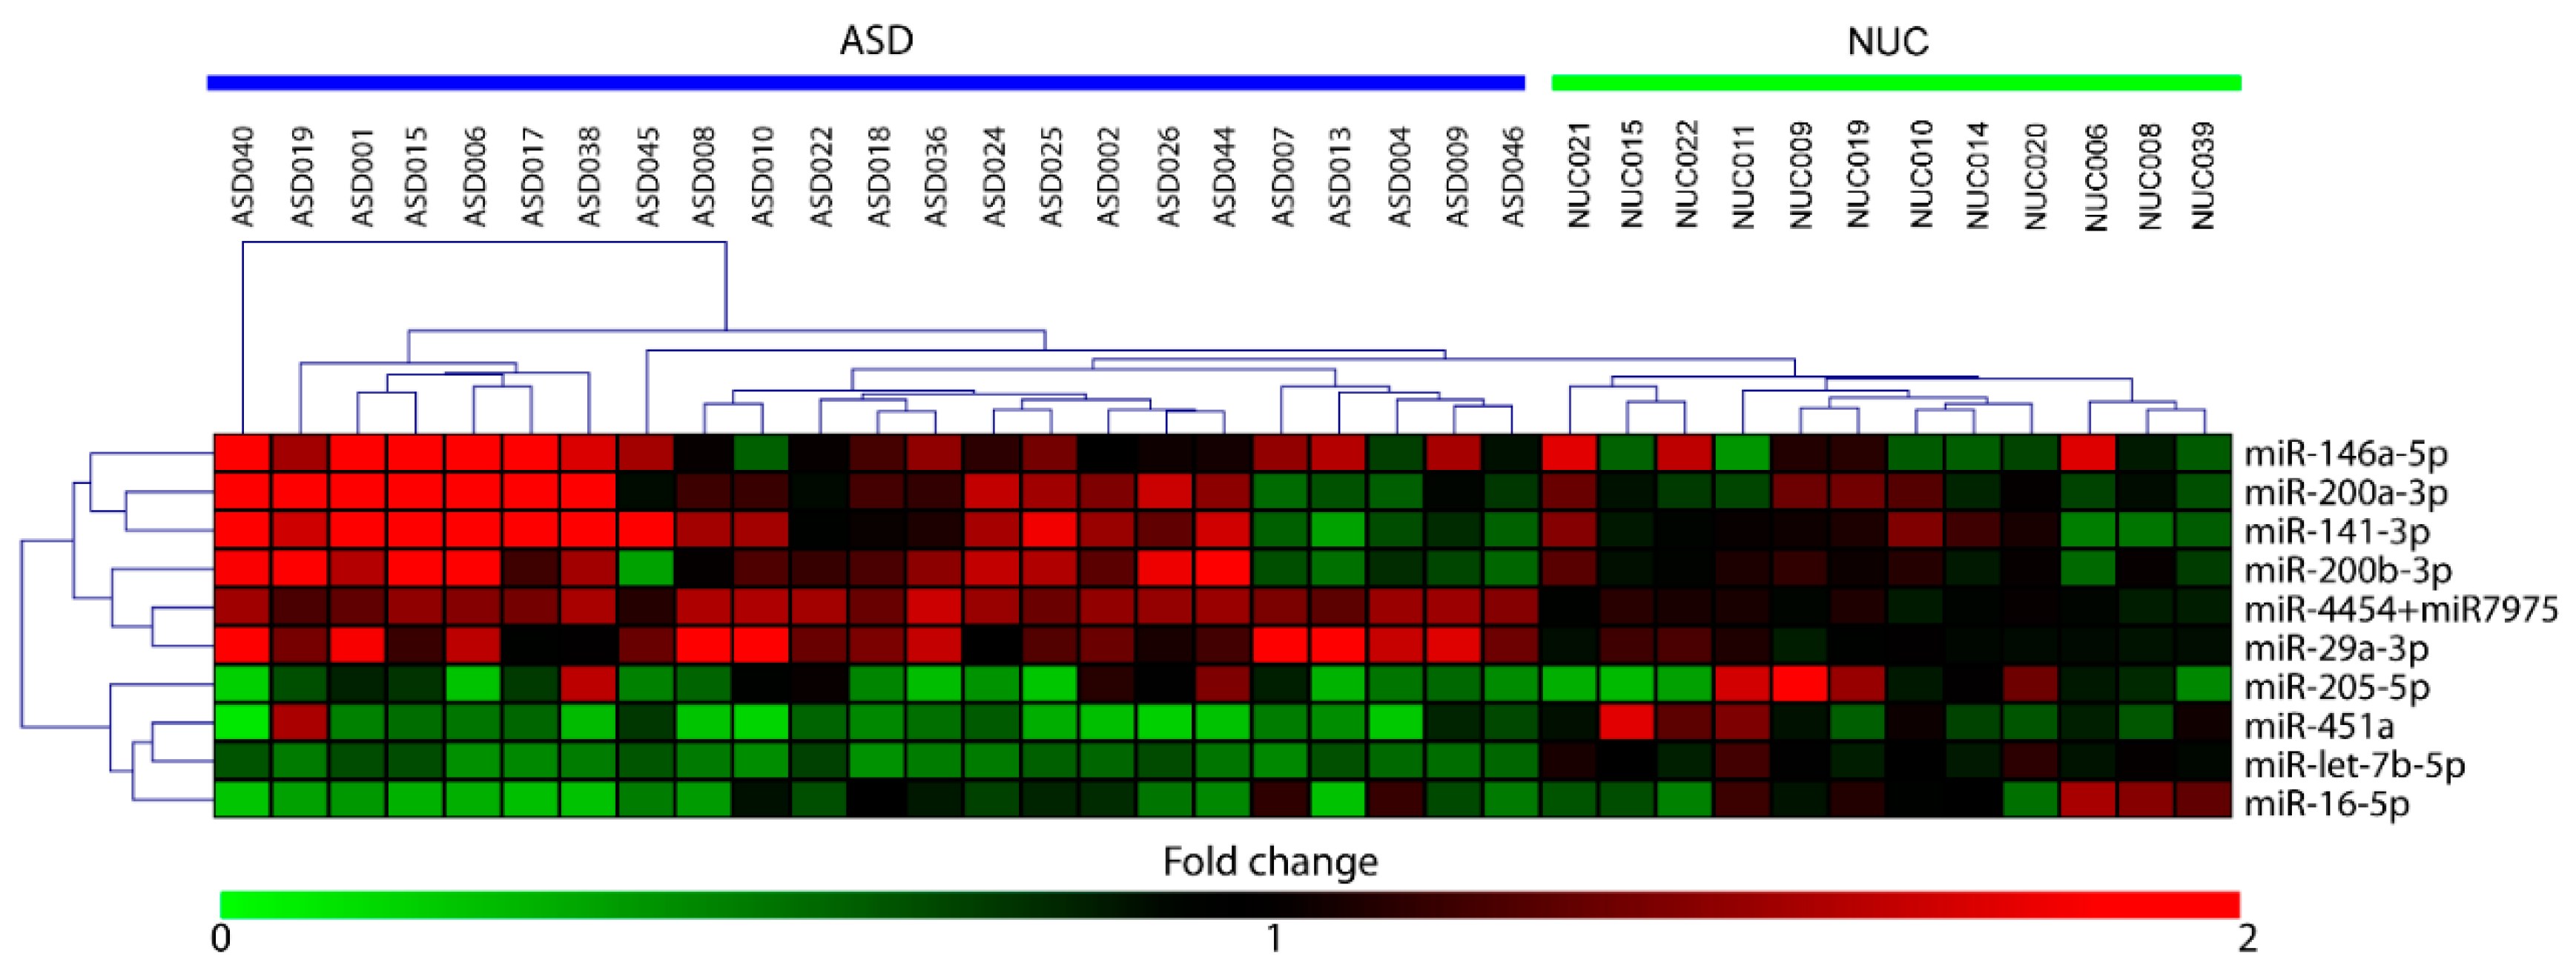
2.2. Salivary miRNA Expression Profiling

By using the nCounter NanoString technology we performed a high-throughput expression analysis of 800 microRNAs in saliva of 23 ASD patients and 12 NUC subjects. We identified 10 miRNAs as significantly differentially expressed (DE) in ASD patients compared to negative controls, six upregulated (miR-29a-3p, miR-141-3p, miR-146a-5p, miR-200a-3p, miR-200b-3p, miR-4454, and miR-7975) and four downregulated (miR-16-5p, miR-205-5p, miR-451a, and let-7b-5p). The relative expression of DE miRNAs is shown as heat-map in Figure 1.

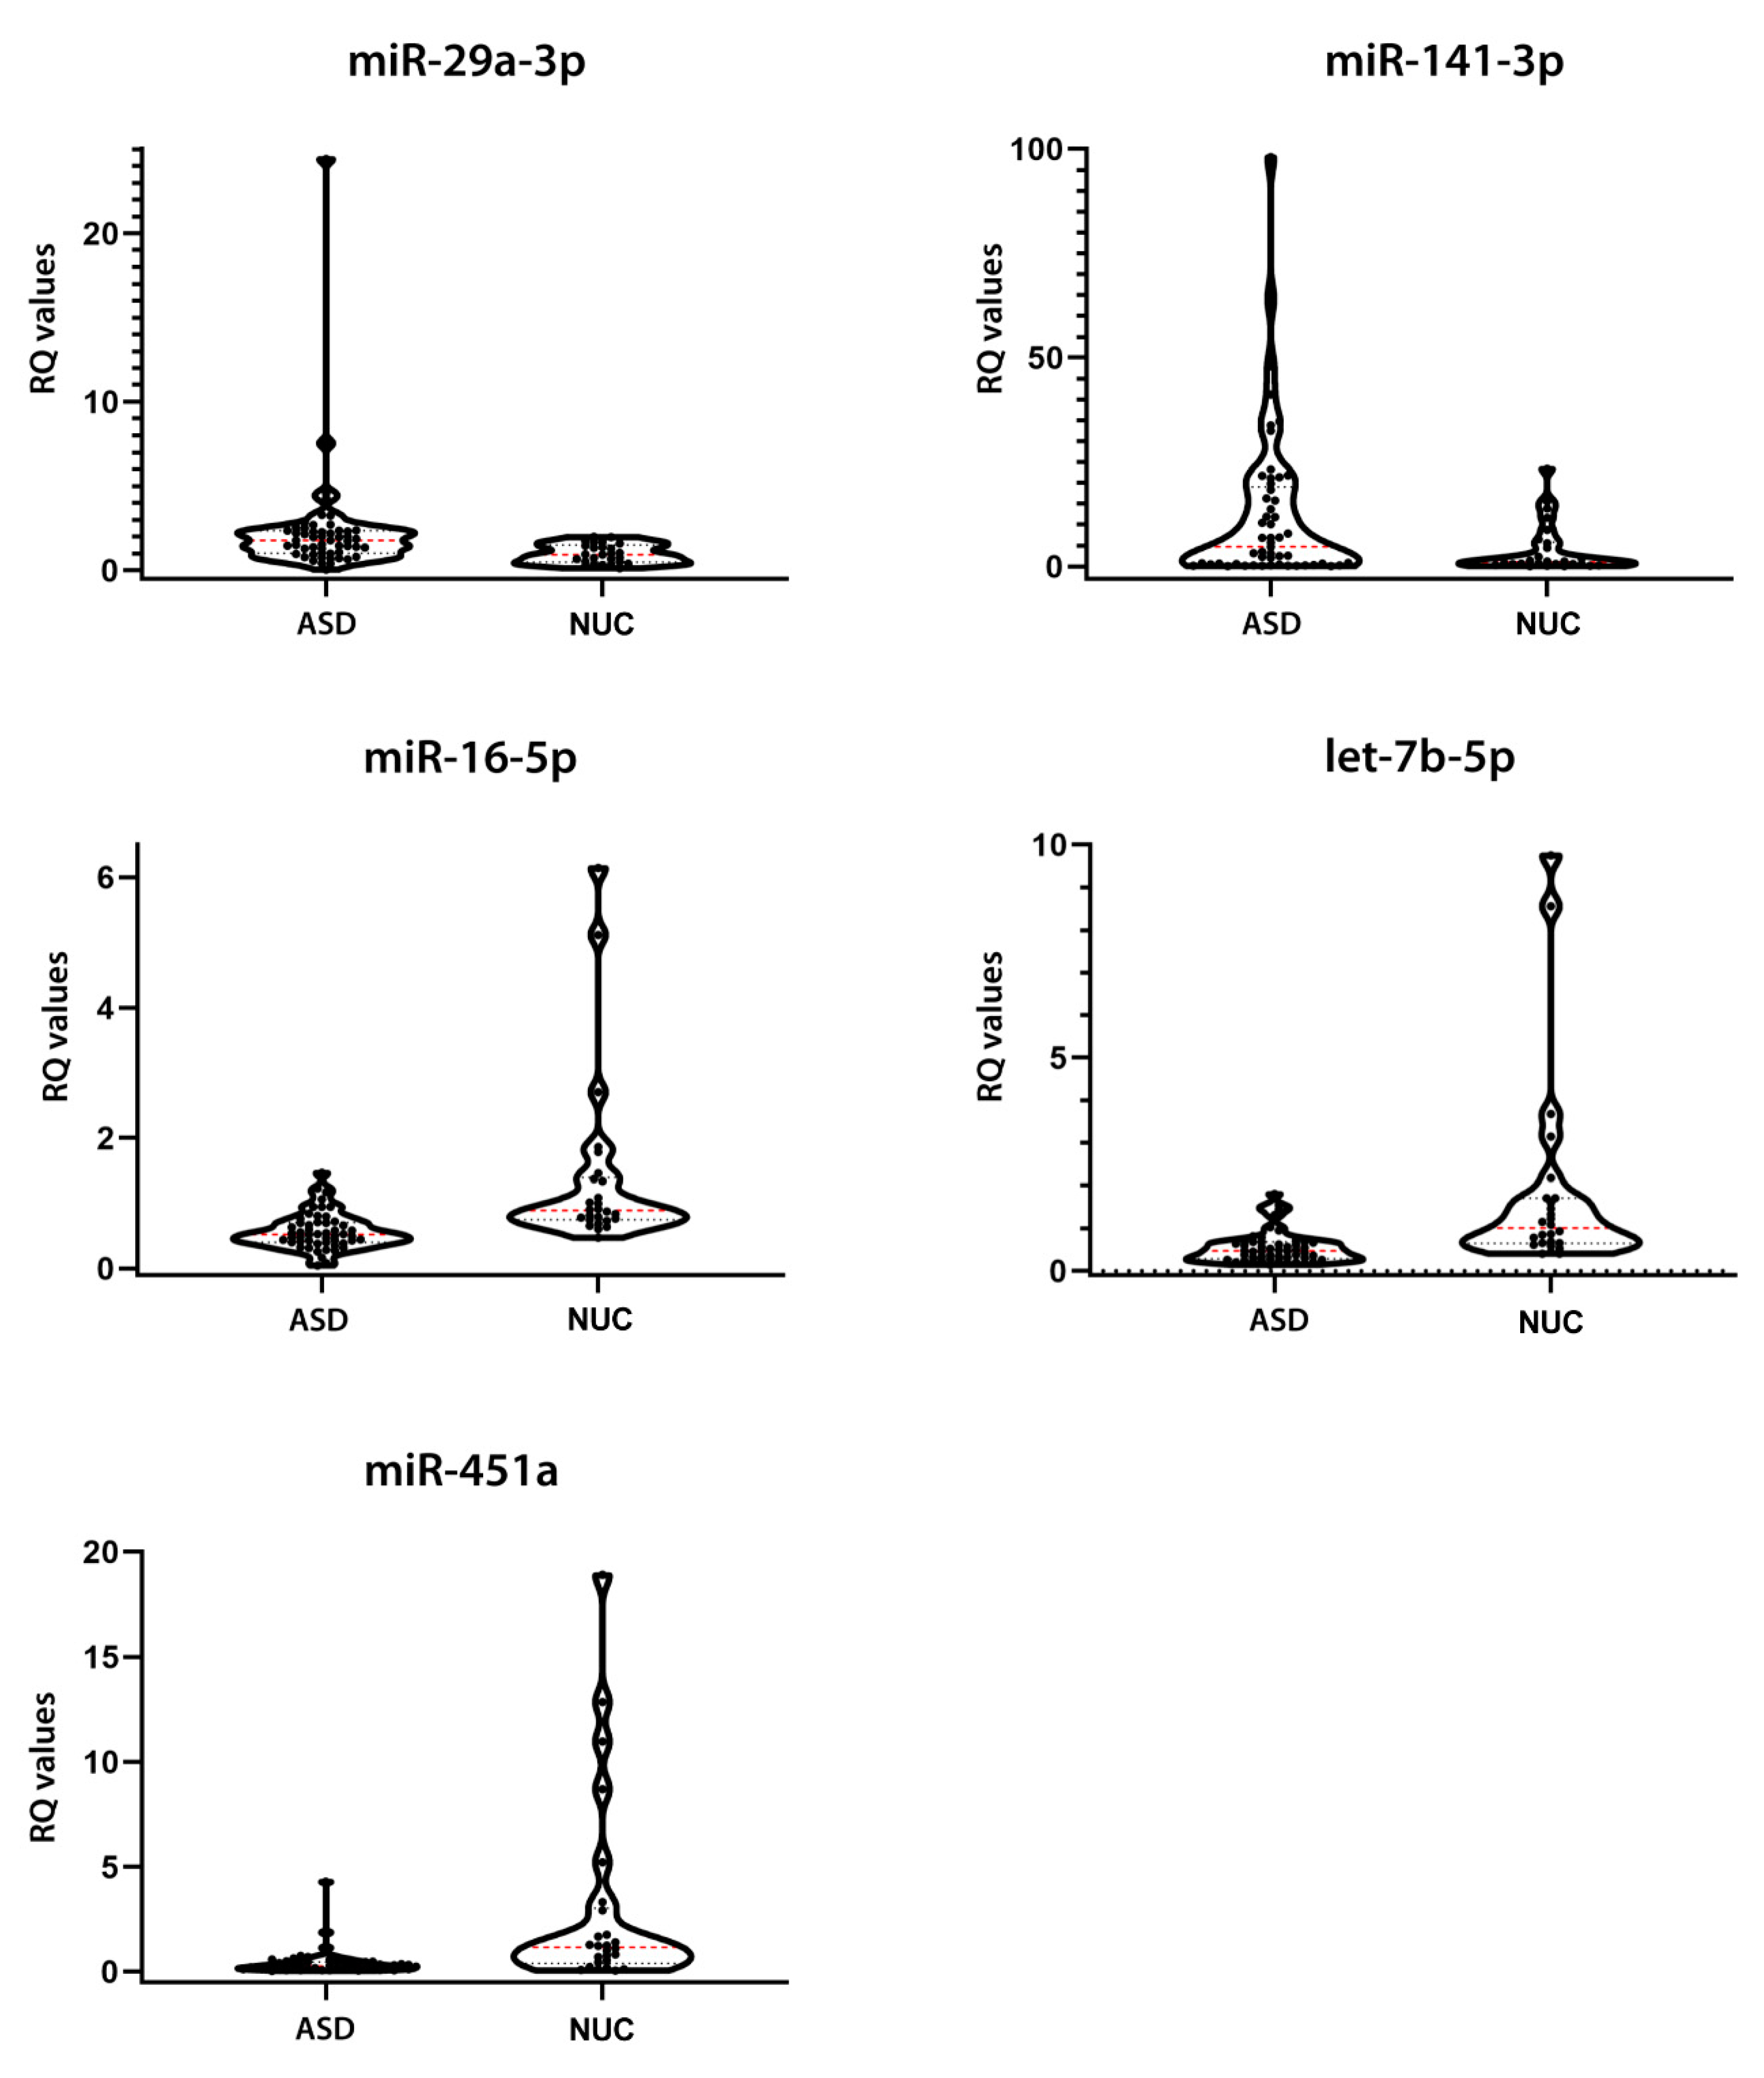
2.3. Salivary miRNA Expression Validation

To validate these findings, we tested the expression of the seven most dysregulated DE miRNAs (miR-16-5p, miR-29a-3p, miR-141-3p, miR-146a-5p, miR-200a-3p, miR-451a, and let-7b-5p) through single TaqMan assays in an independent cohort, composed of 53 ASD patients and 27 NUC subjects. Real Time-polymerase chain reactions (RT-PCR) results showed that five salivary miRNAs were altered in ASD patients compared to NUCs in a statistically significant manner. More specifically, miR-29a-3p (p = 0.0123, Cliff’s δ = 0.341) and miR-141-3p (p = 0.0431, Cliff’s δ = 0.277) were upregulated, while miR-16-5p (p = 0.0002, Cliff’s δ = −0.502), miR-451a (p = < 0.0001, Cliff’s δ = −0.520), and let-7b-5p (p = 0.0002, Cliff’s δ = −0.499) were downregulated in the validation group, confirming the results obtained by NanoString analysis. Although the expression of miR-146a-5p and miR-200a-3p evaluated by RT-PCR had the same dysregulation trend observed by NanoString profiling, these alterations were not statistically significant. Table 2 and Figure 2 show the relative expressions of the five DE miRNAs.
Salivary miRNA expression validation in ASD and NUC groups. p-values were obtained from Mann–Whitney test. Expression FC (Fold Change) values are shown.
The expression values of ASD and NUC are quite heterogeneous, similar to the results of NanoString profiling. Notwithstanding this endogenous variability, their expression differences resulted statistically significant. Cliff’s delta effect size values ranged from −0.5206 to 0.3417, showing small and medium effect sizes according to Cliff’s statistic, likely due to the complex heterogeneity of autism and the limited sample size.

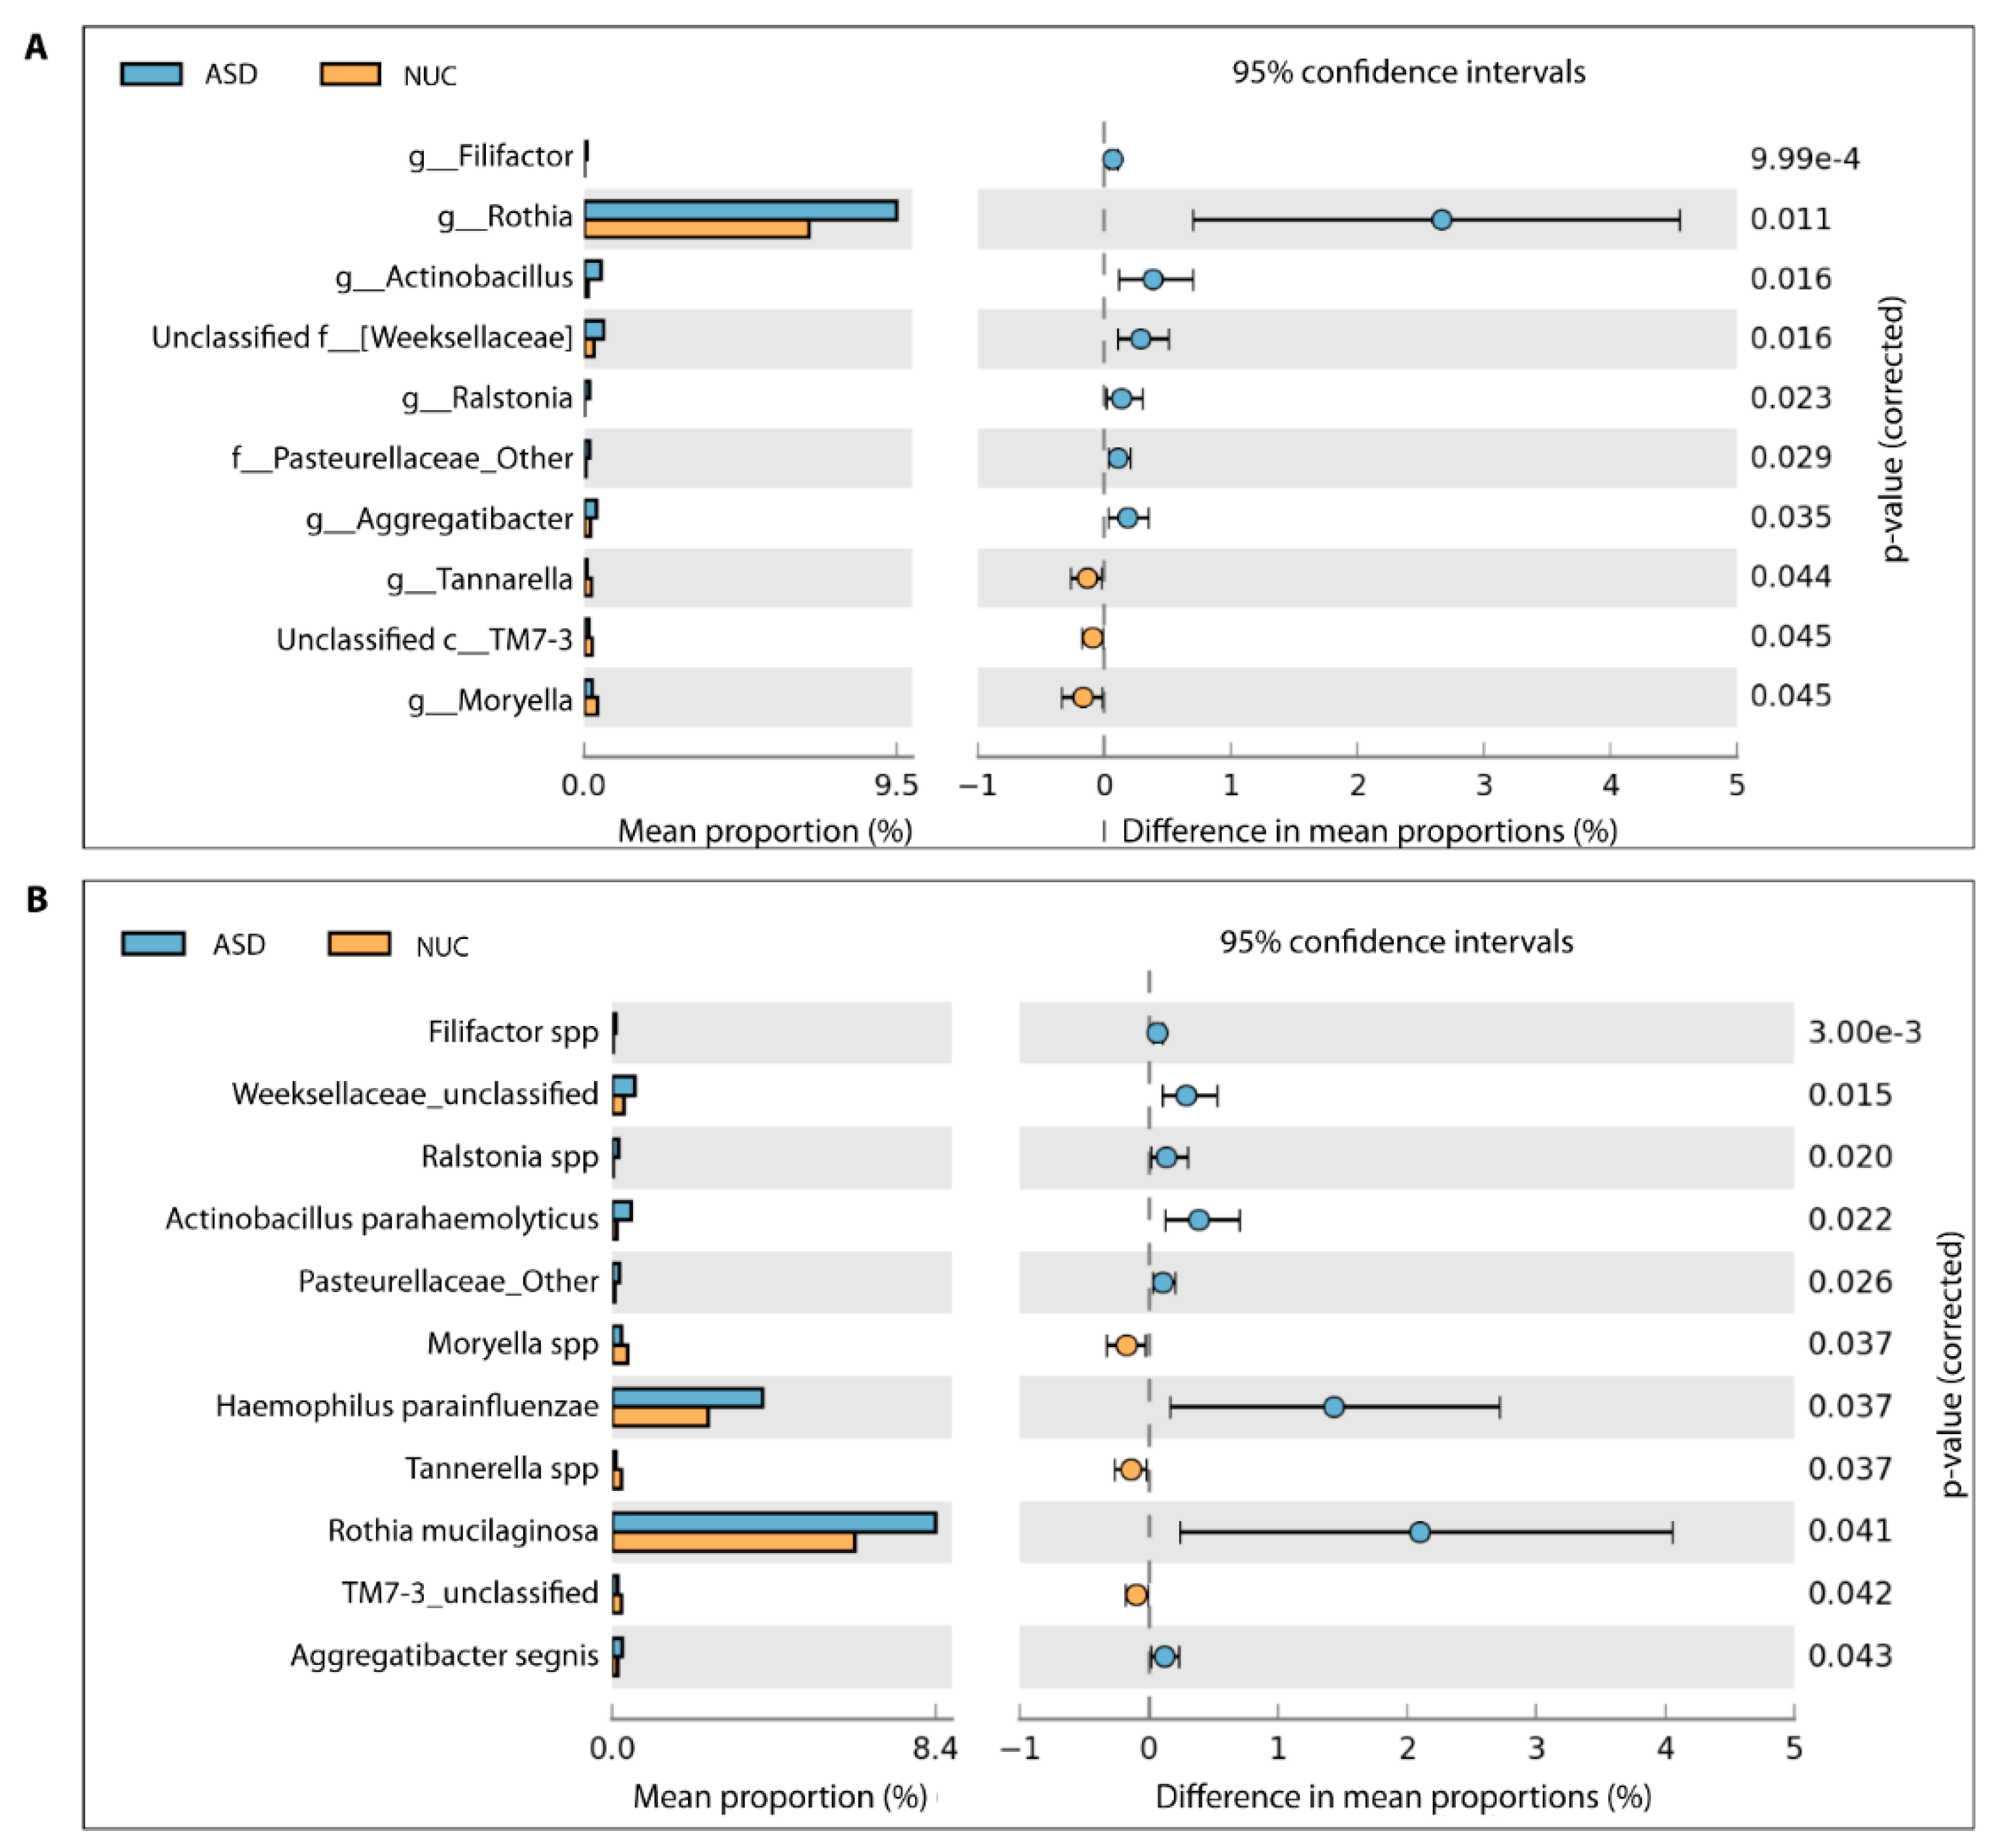
2.4. Microbial Structure of the Saliva Microbiome in Children with ASD and NUCs

To evaluate changes in the microbial composition of the salivary microbiome, a total of 53 ASD and 27 NUC samples were sequenced using the Illumina MiSeq platform.
A total of 10,919,413 valid reads with an average of 127,464 reads per sample were generated (74,469–1,641,234 range). All sequences were assigned to 341 Operational taxonomic Units (OTUs) with at least 97% similarity level showing 10 phyla, 65 genera, and 86 species. The alpha diversity, Chao1 index (richness), Shannon index (diversity), and Shannon Evenness E index (evenness) revealed no significant differences between ASD and NUC groups (p > 0.05) although the Chao1 index showed a slight decrease in the ASD group (Figure 3A). The overall dissimilarities of microbial community structure between the two groups were calculated by using the weighted UniFrac distance. The beta diversity shown by PCoA (principal coordinate analysis) plot on weighted (accounting for the abundance of OTUs) revealed no clustering differentiation of the bacterial communities in the two groups (Figure 3B). The composition of the salivary microbiome between ASD and NUC was explored in terms of the relative abundances at different taxonomic levels through White’s non-parametric t-test; p-value < 0.05 by STAMP software. Predominant phyla in ASD and NUC groups were Firmicutes (41.1% vs. 42.7%), Bacteroidetes (18.9% vs. 22.3%), Proteobacteria (16.9% vs. 10.8%), Actinobacteria (14.1% vs. 13.3%), and Fusobacteria (7.6% vs. 9.3%) constituting 98.6% of salivary microbes (see Supplementary Figure S1). Overall, Proteobacteria were more abundant in ASD patients compare to control participants and a slight increase was also observed in Actinobacteria, while the other phyla were more abundant in the NUC group.
A total of 65 genera were detected (see Supplementary Figure S2) and among these, 10 genera showed a statistically significant difference in relative abundance between ASD and NC children by applying the two-sided White’s non-parametric t-test (Figure 4A), and also confirmed by applying the Mann–Whitney–Kruskal–Wallis test and t-test/ANOVA ( Supplementary Table S1).
In particular, Rothia, Filifactor, Actinobacillus, Weeksellaceae, Ralstonia, Pasteurellaceae, and Aggregatibacter increased their abundance rates in ASD, while Tannerella, Moryella, and TM7-3 decreased (Figure 4A). At the species level, we found statistically significant differences for 11 taxa out of 86 species (Figure 4B and Supplementary Figure S3). More specifically, Filifactor (Cliff’s δ = 0.261), Weeksellaceae (Cliff’s δ = 0.096), Ralstonia (Cliff’s δ = 0.217), Actinobacillus parahaemolyticus (Cliff’s δ = 0.077), Pasteurellaceae (Cliff’s δ = 0.043), Haemophilus parainfluenzae (Cliff’s δ = 0.220), Rothia mucilaginosa (Cliff’s δ = 0.078), and Aggregatibacter segnis (Cliff’s δ = 0.032) were more abundant in saliva of the ASD group, in contrast to Moryella (Cliff’s δ = −0.400), Tannerella (Cliff’s δ = −0.412), and TM7-3 (Cliff’s δ = −0.455) (Figure 4B). Cliff’s delta effect size values ranged between −0.4556 and 0.2613 and, according to the Cliff’s statistic, could be considered small and mostly moderate.

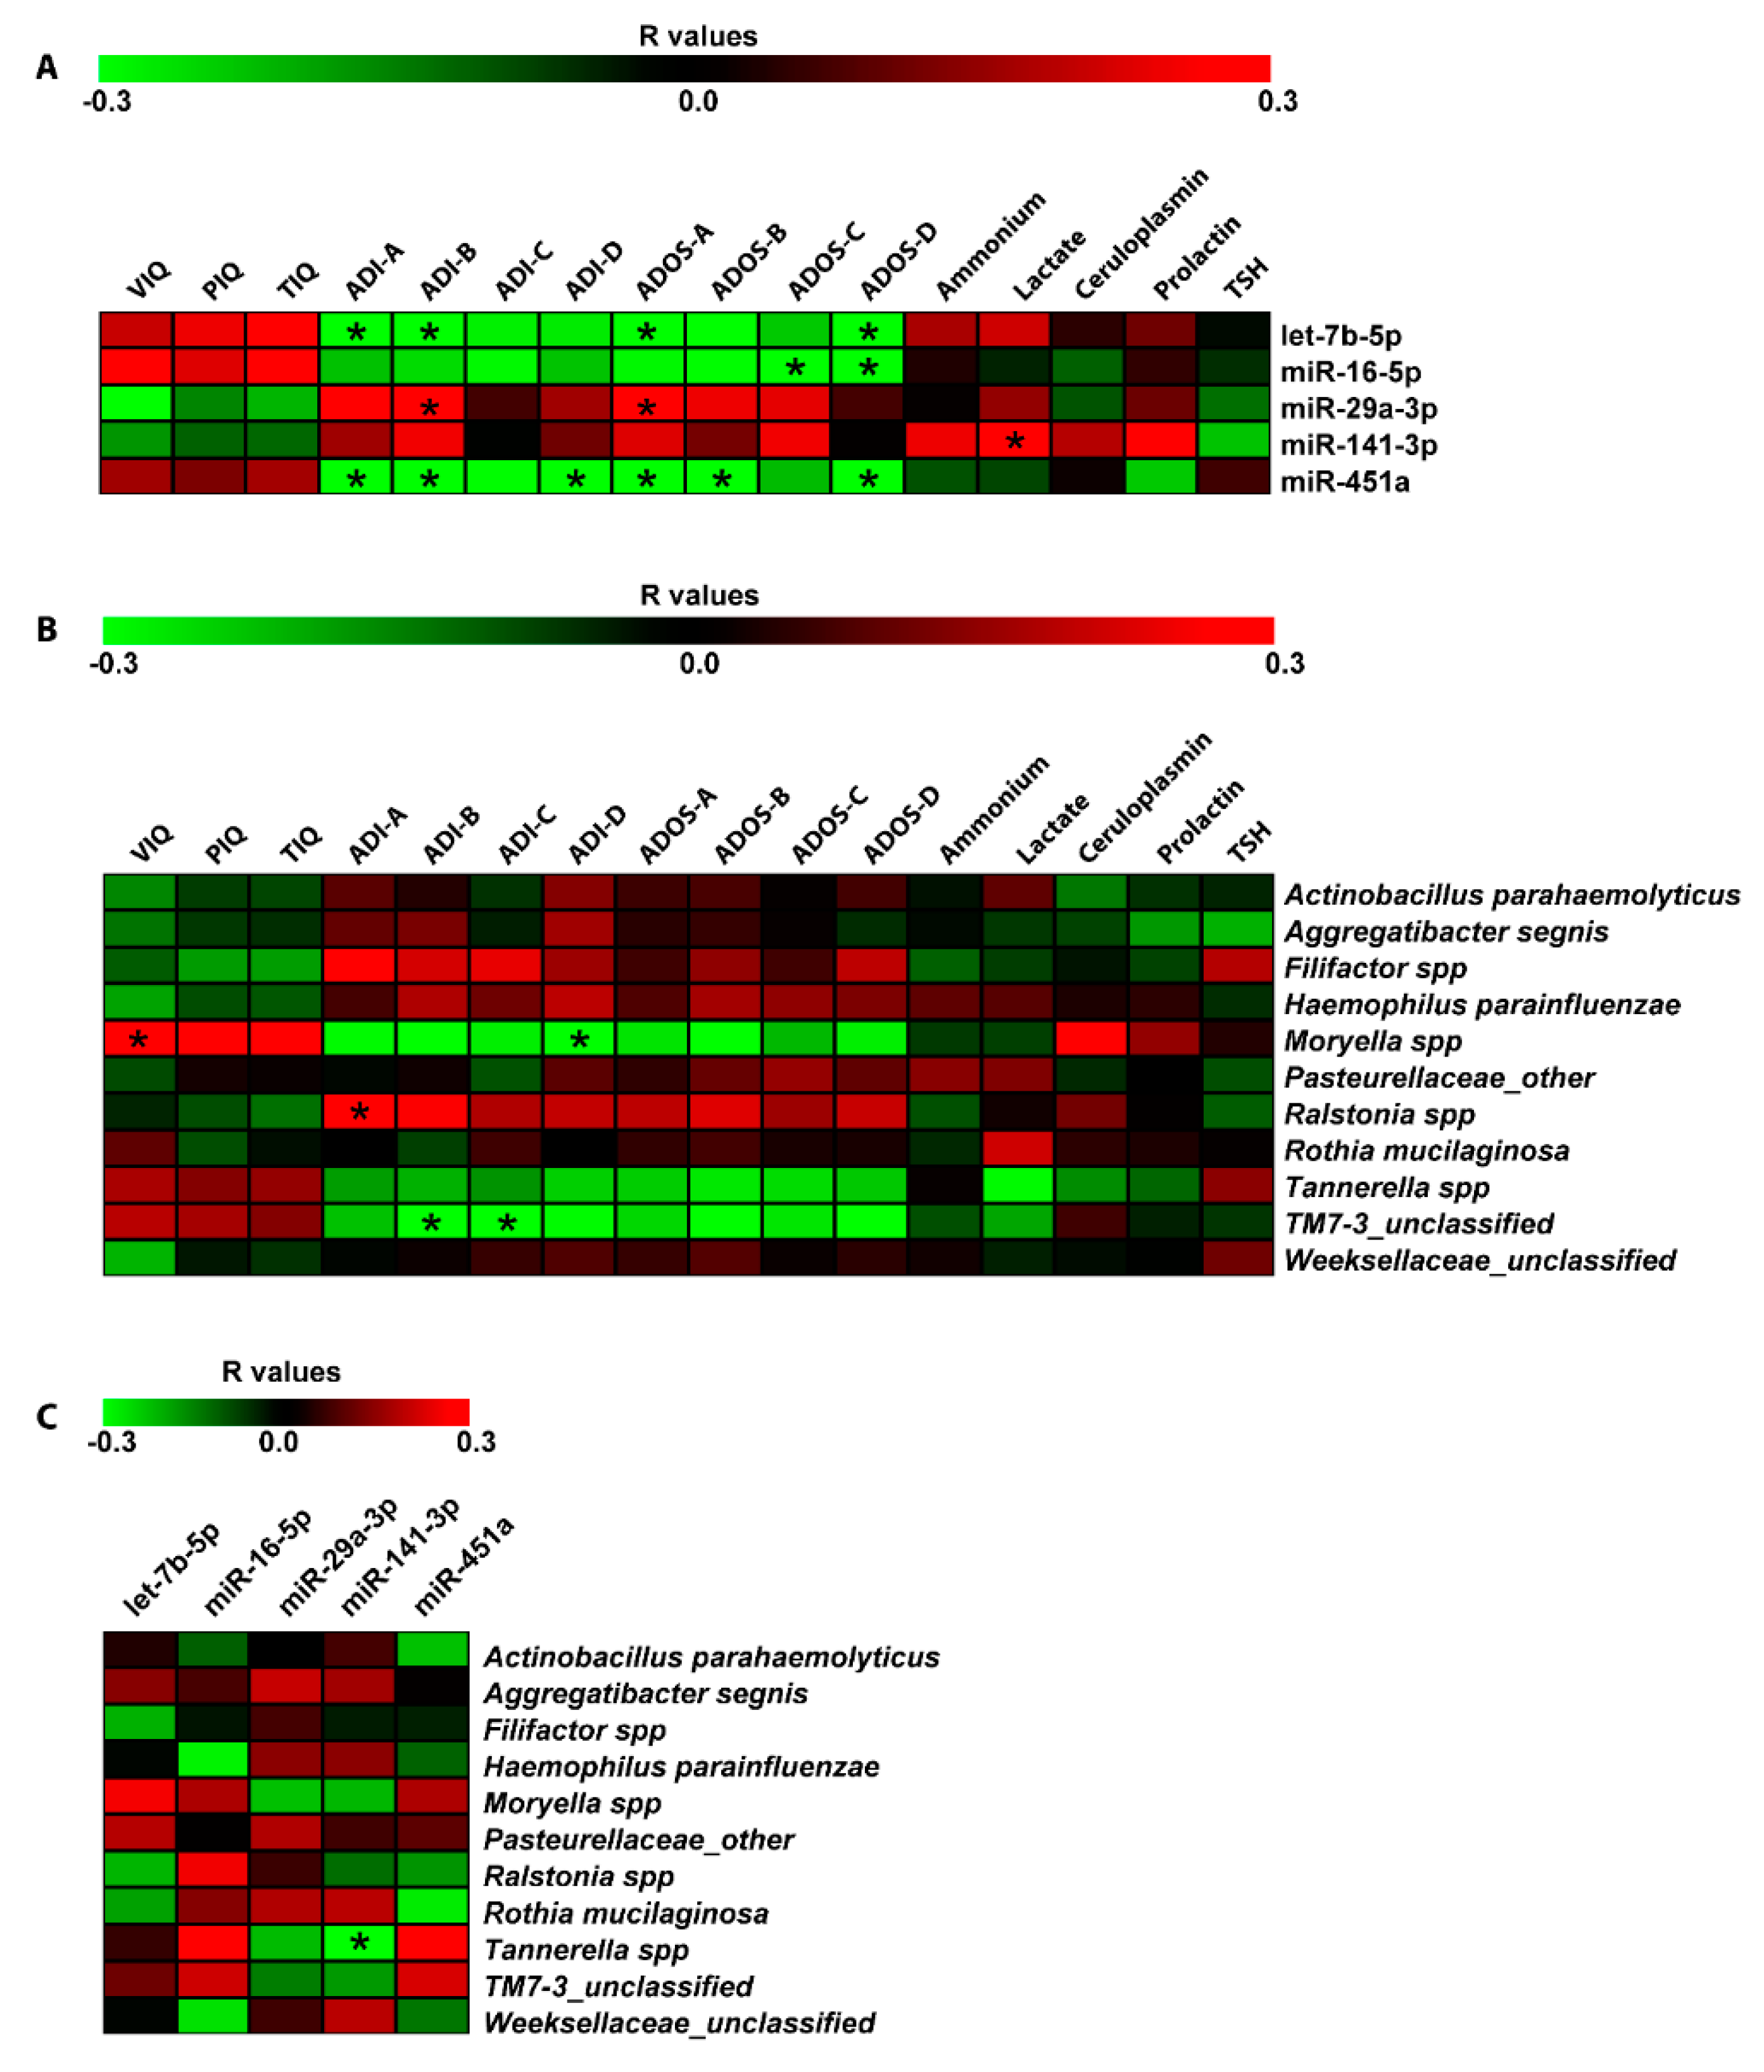
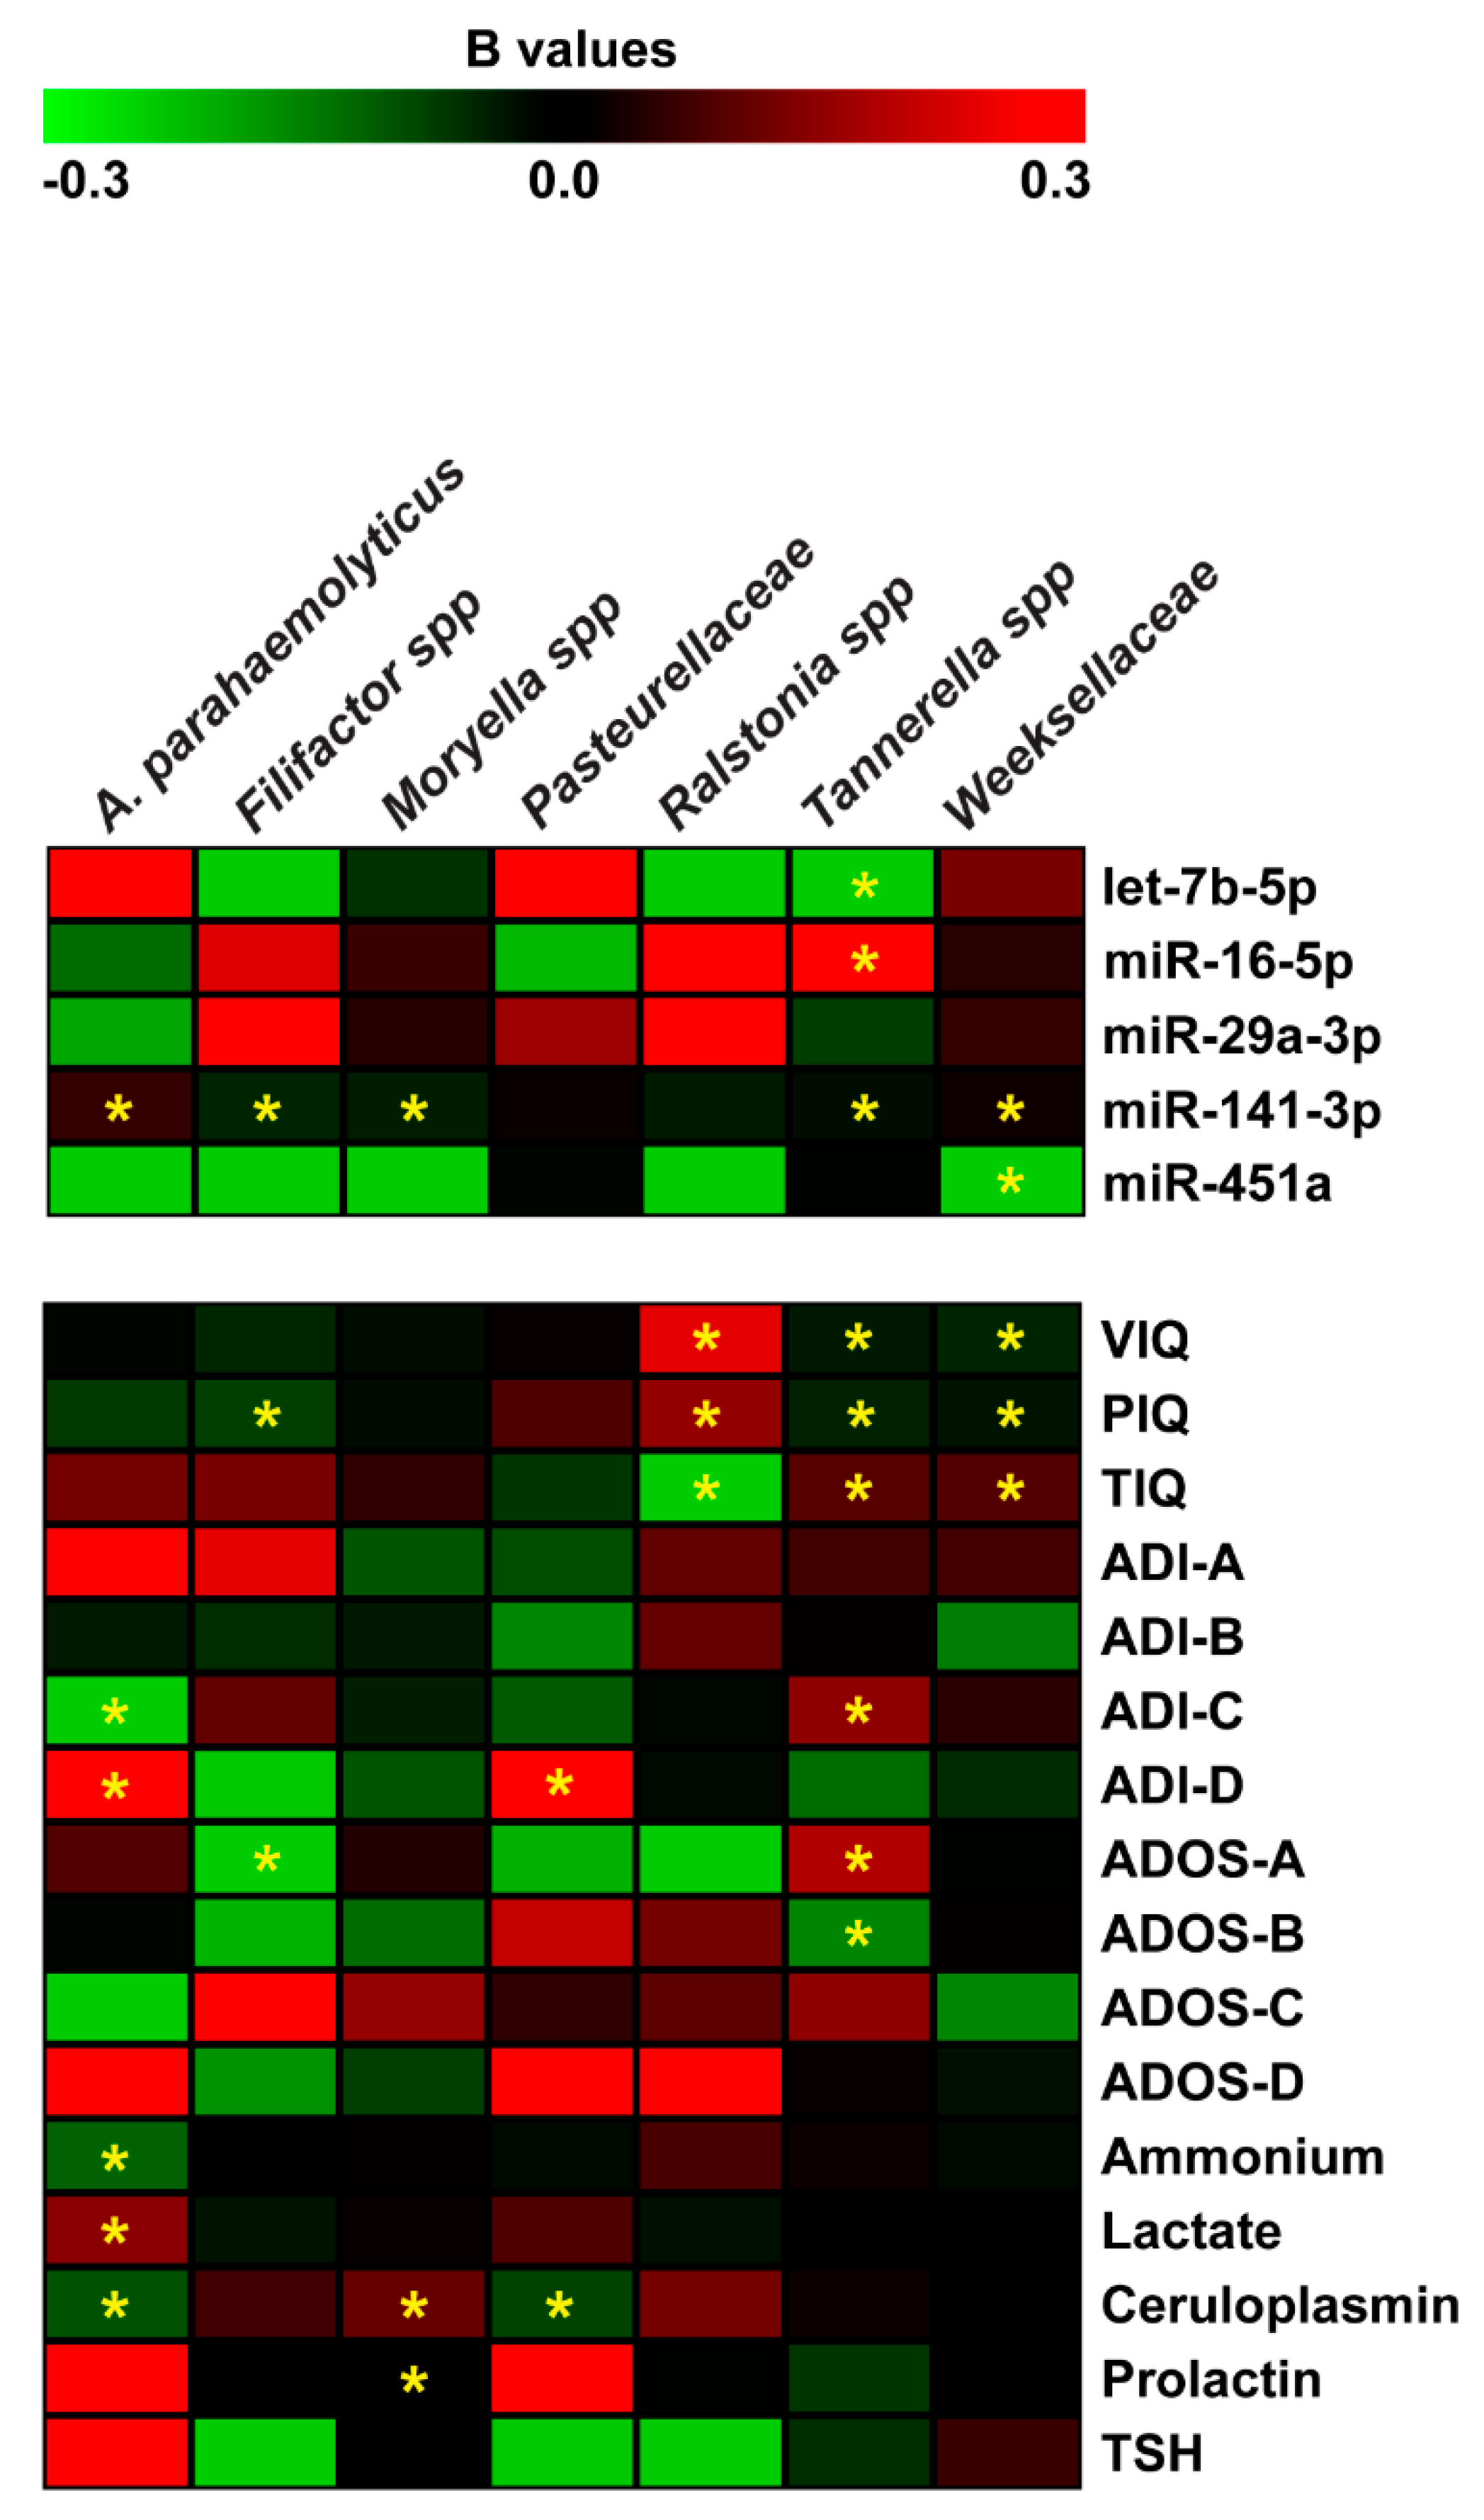
2.5. Correlation and Negative Binomial Regression Analyses Among Salivary miRNAs, Bacteria, and Neuropsychological/Hematological Parameters

Spearman correlation analyses were computed among DE miRNAs, bacteria differentiating ASD and NUCs and neuropsychological/hematological scores (Figure 5). This statistical analysis revealed a negative relationship between let-7b-5p, miR-451a, and ADI-A (Qualitative anomalies in social interaction) (r = −0.37; r = −0.38, respectively to let-7b-5p and miR-451a), ADI-B (Qualitative anomalies in communication) (r = −0.33, r = −0.36, respectively), Autism Diagnostic Observation Schedule (ADOS)-A (Communication) (r = −0.32, r = −0.39, respectively), ADOS-D (Repetitive and Restricted Behavior) (r = −0.38, r = −0.36, respectively). MiR-451a showed a negative correlation with ADI-D (Anomalies in neurodevelopment arising before 36 months old) and ADOS-B (Social Interaction) (r = −0.34, r = −0.40, respectively). MiR-16-5p was negatively related to ADOS-C (Imagination) (r = −0.37) and ADOS-D (r = −0.36); while a positive correlation was found between miR-29a-3p and ADI-B (r = 0.37) and ADOS-A (r = 0.33). Finally, miR-141-3p was the only miRNA to have a linear correlation with a metabolic parameter: positive association with lactate (r = 0.38) (Figure 5A).
The same correlation analysis was also performed on salivary bacteria. We found a positive correlation between Moryella and VIQ (r = 0.32), and a negative relationship between Moryella and ADI-D (r = −0.34). TM7-3 exhibited a negative relationship with ADI-B (r = −0.37) and ADI-C (r = −0.34); while, Ralstonia showed a positive correlation with ADI-A (r = 0.34) (Figure 5B). Moreover, computing the Spearman correlations between salivary DE miRNAs and bacteria, we detected a negative association between Tannerella and miR-141-3p (r = −0.30) (Figure 5C).
For microbiome data, we also applied the negative binomial regression. The Negative Binomial (NB) model was positively assessed for seven (Tannerella, Weeksellaceae, Moryella, Filifactor, Ralstonia, Pasteurellaceae, and Actinobacillus parahaemolyticus) of the eleven microbiome taxa and revealed many statistically significant regressions shown in Figure 6. For each of the predictor variable, Supplementary Table S2 reports a regression coefficient (B) with a p-value (p < 0.05) resulting from the Wald Chi-Square test. Effect size measures, reported as Standardized mean difference (SMD) values, showed small and moderate effects (see Supplementary Table S2). Negative binomial regression (NBR) results were partially confirmed applying the multiple and simple linear regression models. These additional analyses confirmed the regression between Total Intelligence Quotient (TIQ), ADOS-A, ADOS-B and Tannerella; miR-141-3p and Weeksellaceae; miR-141-3p, ceruloplasmin and Moryella; PIQ and Filifactor; miR-141-3p, ADI-C, ADI-D, ammonium and Actinobacillus parahaemolyticus (see Supplementary Table S3).

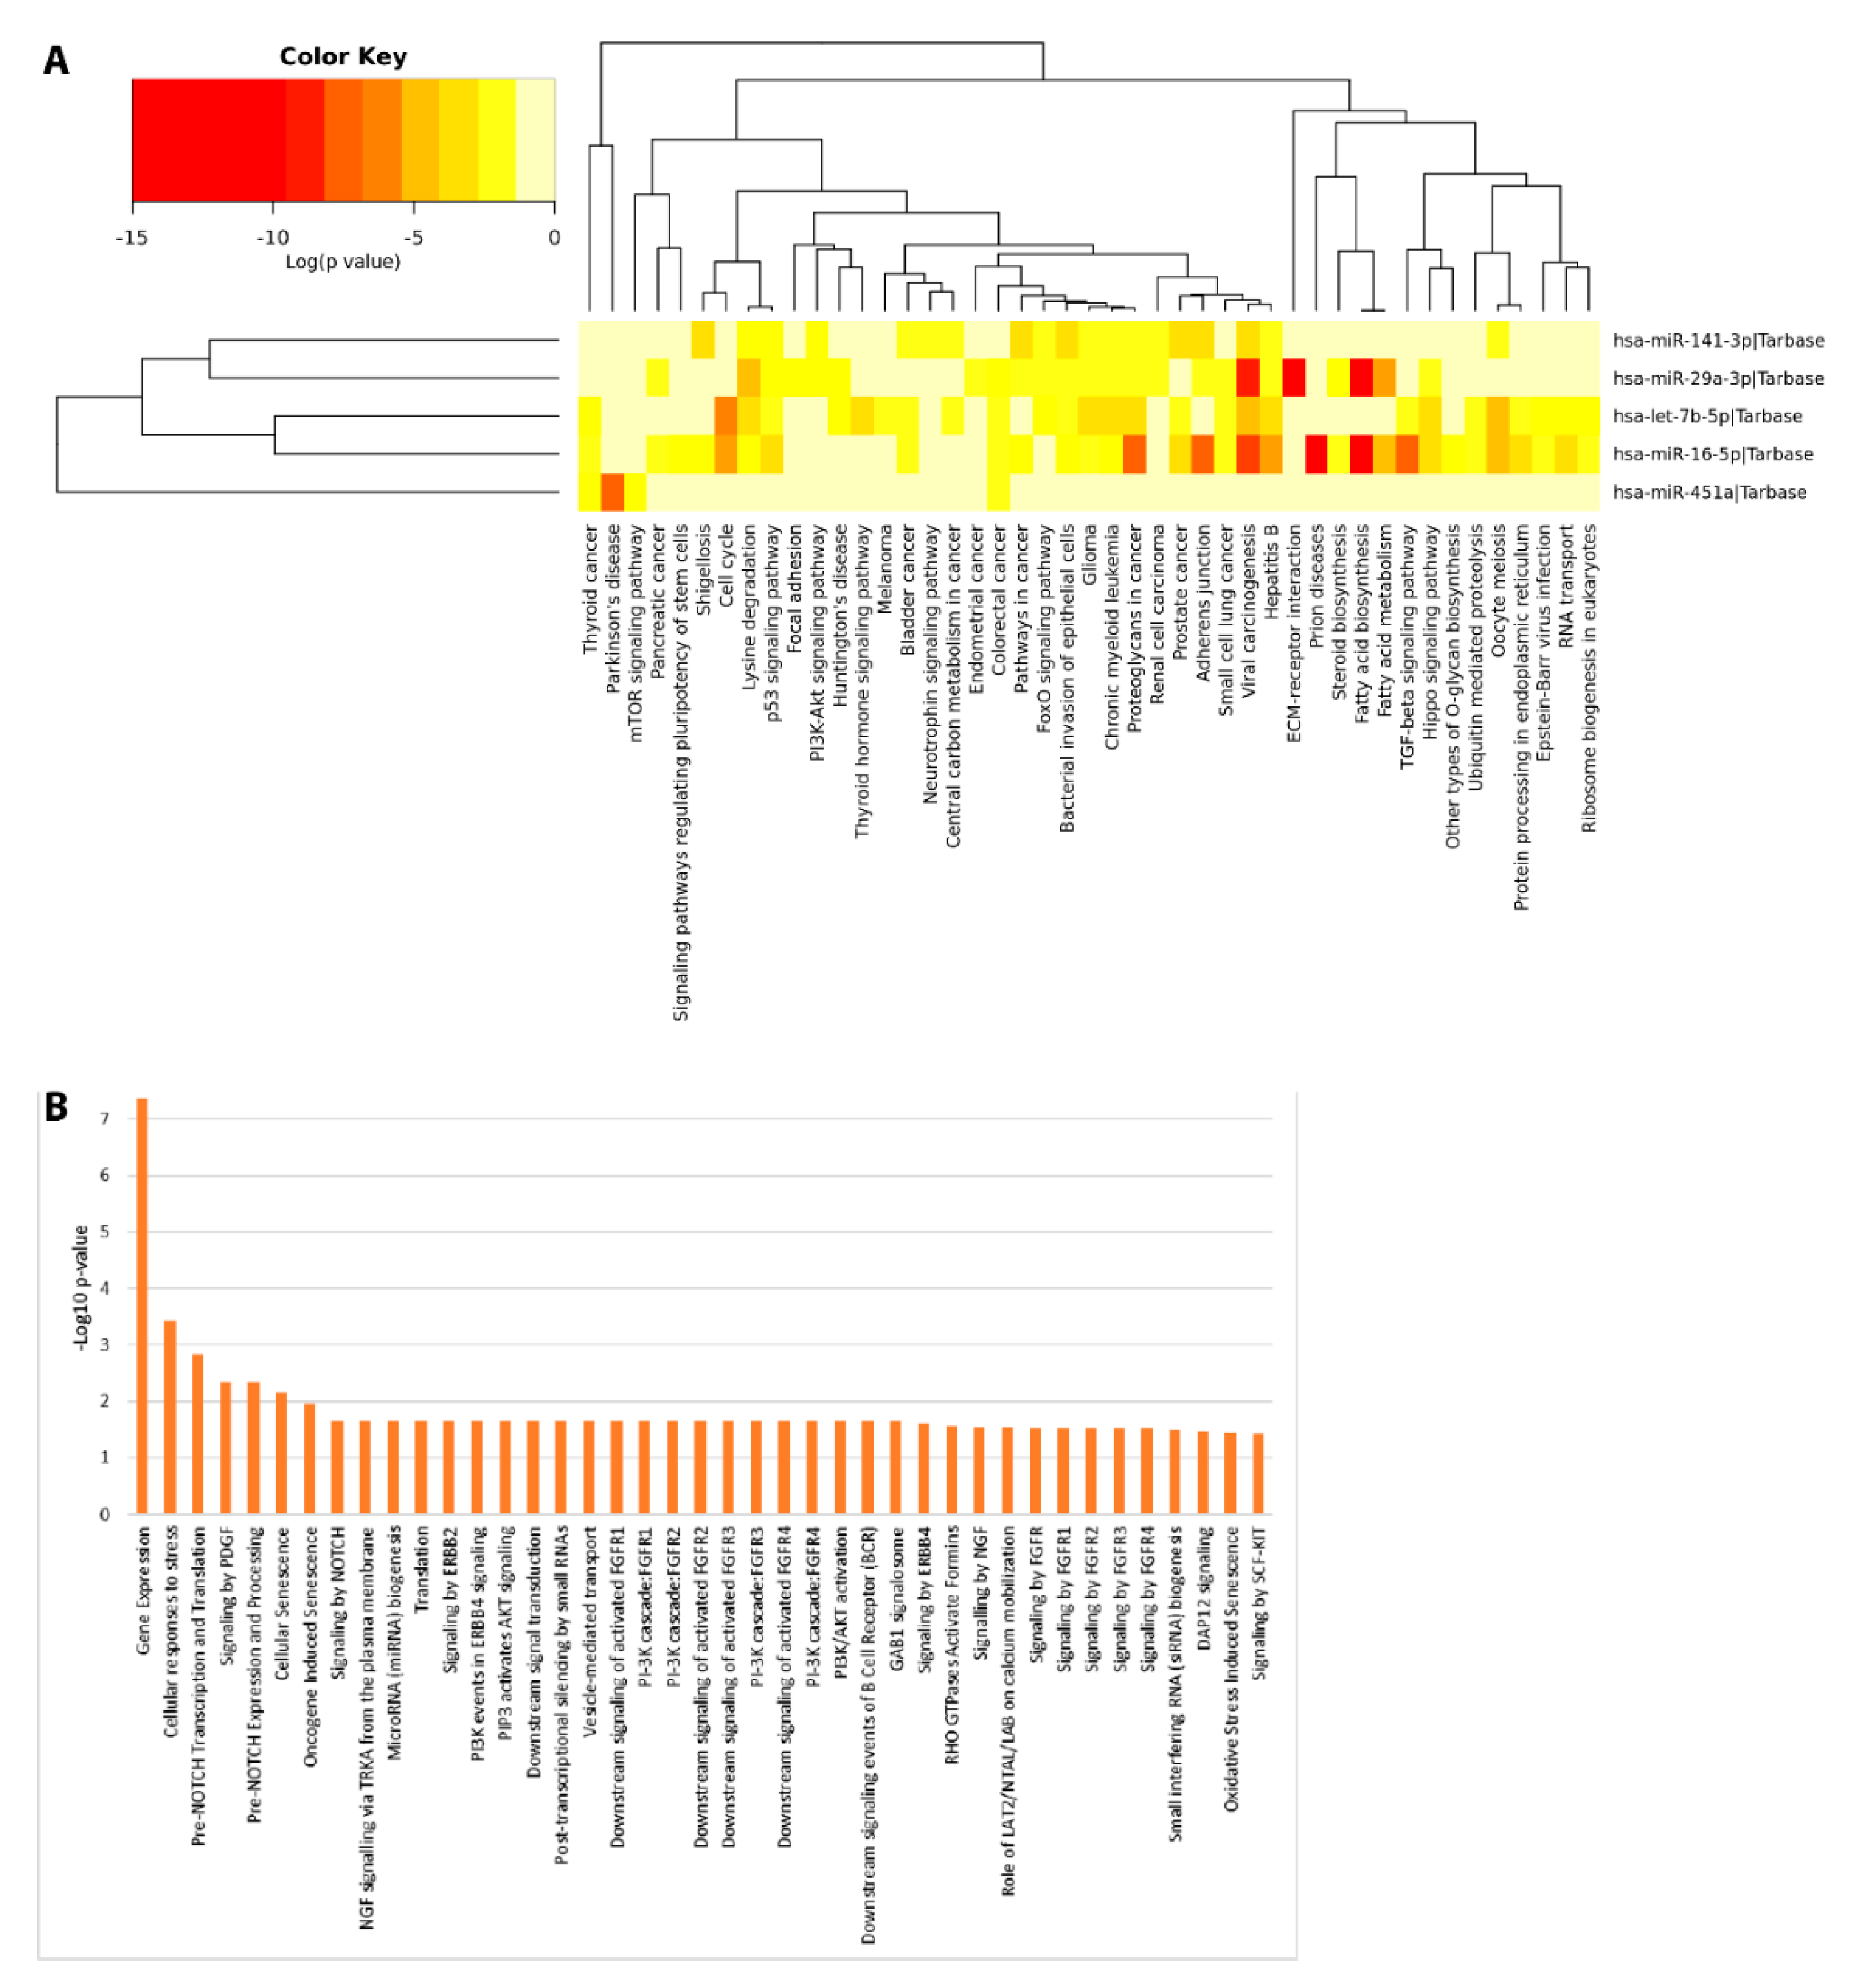
2.6. Functional Enrichment Analyses

Pathway enrichment analyses were computed to investigate the potential biological impact associated with the differential expression of the miRNAs reported in this study. We computationally identified a list of statistically over-represented gene ontologies and biological pathways (Figure 7) potentially related to ASD, as Pre-NOTCH transcription and Translation (False Discovery Rate (FDR) corrected p = 0.0015) and Pre-NOTCH Expression and Processing signaling pathway (FDR corrected p = 0.00471), signaling by NOTCH (FDR corrected p = 0.0221), signaling by NGF (FDR corrected p = 0.0291) through which cell fate decisions in neuronal development are regulated. Moreover, we found Parkinson’s disease related pathways (FDR corrected p = 0.0002), involved in synaptic and mitochondrial dysfunction and neuroinflammation; Hippo signaling pathway (FDR corrected p = 3.991× 10⁻⁶), FoxO (Forkhead box O) signaling pathway (FDR corrected p = 0.0001), PI3K-Akt signaling pathway (FDR corrected p = 0.0008), and mTOR signaling pathway (FDR corrected p = 0.02), involved in many biological events such as apoptosis, cellular stress and cell-cycle control. In addition, bacterial invasion of epithelial cell (FDR corrected p = 1.19 × 10⁻⁶) related pathways were also found. These data would represent an interesting link between the differential expression of miRNAs and the bacterial abundance alterations found in saliva.
These computational data would suggest a functional involvement of DE salivary miRNAs in molecular signaling pathways related to the development of cognitive functions, often reported to be dysfunctional in ASD. This observation is particularly intriguing because it hints at the possibility that some molecular alterations of ASD neuronal circuits could be mirrored in saliva by means of differential secretion of miRNAs.

3. Discussion

3.1. Circulating miRNAs and Microbiome Structure are Altered in Saliva of Pediatric ASD Patients

Recent studies have shown that perturbations in the normal structure of microbiome have a close relationship with human health and disease [19,31,32] and there is mounting evidence that alterations of the GI microbiome may influence neurological disorders and autistic behavior [48]. The shift of microbial communities in the oral cavity in these diseases is being increasingly studied to look at possible early diagnostic markers [25,35,36,39]. Several studies have revealed that miRNAs play very important roles in neural developmental processes [49,50,51,52,53], resulting in neuropsychiatric disorders [54,55] and neurodegenerative diseases [56,57], although their exact pathophysiologic role remains unclear [58]. In the present study, the salivary miRNA content and the oral microbiome were evaluated in a group of pediatric patients with ASD syndrome, compared with neurotypical subjects. MiRnome and microbiome dysregulation in saliva of ASD patients was previously reported by other groups, but there is only a partial concordance with the data presented here [47,59,60,61]. The salivary microbiome structure in human beings is strongly affected by the geographical, climatic and ethnic origin of samples [62,63,64]. This could be due to the different ratio of dietary protein/ carbohydrate intake that, in turn, modulates salivary pH [65]. This biochemical variability, such as the inconstancy of desquamated oral epithelial cells in saliva among people, would lead to a heterogeneous population of miRNAs in saliva among individuals [66].
In the present paper, a higher relative abundance of Proteobacteria and Actinobacteria phylotypes and a lower amount of Bacteroidetes, Firmicutes, and Fusobacteria were found in ASD patients. In addition, an increased abundance of Rothia mucilaginosa, Filifactor, Actinobacillus parahaemolyticus. parahaemolyticus, Weeksellaceae, Ralstonia, Pasteurellaceae, Agregatibacter segnis, and Haemophilus parainfluenzae, as well as a reduced amount of Tannerella, Moryella and TM7-3 were observed in the saliva of ASD patients. These observations could contribute to define the dysbiotic signatures of disease. In particular, a similar trend for Haemophilus and Rothia is supported by a previous observation [60].These taxa are often involved in several diseases, especially in immunocompromised hosts [67,68]. In the present study, many groups of microorganisms differentially abundant in ASD children were previously associated with CNS (Central Nervous System) disorders, such as Parkinson’s and Alzheimer’s Disease [69,70]. In some cases, these microorganisms are also relevant pathogens of periodontal diseases. It is noteworthy that Filifactor and Tannerella were previously reported as strong indicators of dysbiosis [71,72].
Previous papers reported that the five DE miRNAs we identified in ASD saliva were associated to neurological diseases, including ASD, in cellular and extra-cellular contexts. In Alzheimer’s patients, miR-29a was upregulated in cerebrospinal fluid (CSF) [73], whereas, miR-451a and miR-16-5p were downregulated in exosomes from CSF of young-onset (YOAD) subjects [74] and miR-141 decreased in the plasma fraction enriched in exosomes [75]. Moreover, the levels of miR-29a-3p were decreased in whole blood [76] and those of miR-141-3p in serum of Parkinson’s patients [77]. Levels of let-7b-5p were decreased in the saliva of children with mild traumatic brain injury [78]. Intriguingly, a downregulation of miR-451a and miR-16-5p was also identified in peripheral blood of ASD children [79]. Furthermore, miR-451a and miR-16-5p were upregulated and downregulated, respectively, in lymphoblastoid cell lines from autistic monozygotic twins [80]. Finally, miR-451 also showed an increased abundance in post-mortem ASD brain [81]. These findings would suggest a critical role for these miRNAs in the development of cognitive functions. Molecular pathways identified in our functional enrichment analysis would support the involvement of these miRNAs in ASD related mechanisms. Dysregulation of IGF-I/PI3K/AKT/mTOR signaling is associated with ASD pathogenesis by affecting the myelination, synaptic plasticity, mechanisms of social interactions, learning and immune functions [10,82,83]. The Hippo signaling pathway is related to neuropsychiatric disorders such as schizophrenia, bipolar disorder, obsessive-compulsive disorder and ASD, playing an important role in neural development and neuronal maintenance [84]. Finally, NOTCH, FoxO, and NGF pathways play multiple roles in neurodevelopment in the CNS regulating neurogenesis, synaptic plasticity, learning, memory, and behavior [85,86,87].

3.2. Potential Associations Among Cognitive Impairments, Salivary miRNA Expression and Microbiome Alteration in ASD Children

We found several linear associations between salivary miRNA expression and anomalies of social interaction and communication, expecially for let-7b, miR-451a, and miR-29a-3p (Figure 5A). Impairments in social-emotional reciprocity and relationships, verbal and nonverbal communicative behavior, cognitive skills, lead to increase the risk of social isolation and rejection of ASD children in daily social contexts. Some studies reported an association between social isolation and consequent psychological stress and miRNA dysregulation. For instance, miR-141-3p expression progressively increases in a time-dependent manner in mouse models of post-stroke social isolation [88], and members of the miR-29 family increased their expression during the healing process of oral palatal mucosal wounds [89]. Moreover, decreasing plasmatic let-7b-5p correlated strongly with cognitive impairment in the presence of severe alcohol use disorder [90] and it was also related to high stress conditions [91]. Levels of circulating miR-451a in the blood of depressed patients were found reduced and negatively associated with the Hamilton Depression Scale that is used to rate the severity of depression: a depression-like phenotype is often observed in autistic patients [92,93].
In blood of ASD patients elevated levels of lactate and its synthesizing enzyme, lactate dehydrogenase (LDH), reflect the mitochondrial energy metabolism dysfunctions [94]. Interestingly, miR-141-3p was found to induce mitochondrial dysfunctions in obese mice by inhibiting PTEN [95]. Moreover, circulating miR-141-3p positively correlated with LDH levels in rectal cancer [96], as well as, miR-141 positively regulated expression of LDH by inhibiting MAP4K4 in breast cancer [97]. These observations corroborate the positive correlation we found between miR-141 and lactate and suggest that it could represent a combined extracellular phenotype of ASD metabolic abnormalities.
Moryella showed a signature that negatively correlated with anomalies in neurodevelopment arising before the age of 36 months (ADI-D); the same genus was also linked to the Verbal Intelligence Quotient. Ralstonia positively correlated with a worst Qualitative anomaly in social interaction (ADI-A). Finally, the low abundance of phylotype TM7-3, often associated with human inflammatory mucosal diseases [98], negatively correlated with the increasing of both Qualitative anomalies in communication (ADI-B) and Repetitive and restricted behavior (ADI-C).
The negative binomial regression analysis revealed that the abundance of seven species was significantly related to cognitive impairments, especially for Tannerella [99] (Figure 6). In particular, VIQ, PIQ, and TIQ together with behavior (ADI-C), speech and communication anomalies (ADOS-A) were significant predictors of Tannerella abundance. In accordance with these results, it has been reported that periodontal disease is related to cognitive decline [100], disability, speech and communication impairment, low self-esteem and quality of life [101]. Interestingly, the regression analyses uncovered a significant relationship among all the Intelligence Quotients (i.e., VIQ, PIQ, and TIQ) and Weeksellaceae and Ralstonia abundances.
These results pave the way to suggestion that miRNA expression and microbiome structure alteration could be a consequence of ASD symptomatology.

3.3. Potential Crosstalk between miRNAs and the Microbiome in Saliva

It is known that microbiota can secrete bioactive compounds able to modify the host epigenome; as well as, miRNAs from the host could selectively regulate the functions of microbiota.
Linear correlation analysis between miRNA expression and microbiome data in saliva led to the identification of a negative relationship between miR-141-3p and Tannerella. This inverse correlation has already been reported. It has been demonstrated that miR-141-3p was underexpressed in the gingiva of patients affected by periodontal disease compared to healthy gingival tissue [102], while, Tannerella is one of the major Gram-negative periodontal pathogens and it is already identified as a marker of autism [60,99]. The negative binomial regression sheds a light to other considerations regarding the potential interaction between: (i) miRNAs and neuropsychological parameters (as predictors) and (ii) microbiome (as outcome variables) in terms of expected change in the outcome variable for a one-unit change in the predictor variable. For example, NB regression revealed new potential interactions between the miRNAs previously associated with cognitive impairments (based on linear correlation analyses) and specific bacteria: let-7b-5p and miR-16-5p with Tannerella; miR-451a and Weeksellaceae; miR-141-3p and Tannerella, Weeksellaceae, Moryella, Filifactor (Figure 6). MiR-141-3p is known to be expressed in intestinal epithelial cells and a potential biomarker for gut dysbiosis [103].
Although this issue is quite unexplored in the literature, recent reports demonstrated that fecal miRNAs could contribute to shaping the composition of the gut microbiome [104,105], suggesting a mechanism by which host cells can regulate the microbial community.
The significant relationships found in the regression analysis may suggest that the potential crosstalk between oral bacteria and salivary miRNAs could be based on a general response of host to dysbiosis involving several miRNA families, as well as bacterial phyla [106,107,108,109,110,111,112,113].
Taken together, all these findings suggest that in the saliva of autistic children quantitative differences in miRNA expression and bacteria abundance are present and potentially associated with anomalies in social interaction and communication.

4. Materials and Methods

4.1. Ethics Approval and Consent to Participate

All experiments were approved by the local Ethics Committee, Comitato Etico Catania 1, University of Catania (ID: 002430-36) prior to sample collection. Written, informed consent was obtained from all parents and each participant who were able gave their informed assent.
All experimental methods were in accordance with Helsinki Declaration.

4.2. Participant Selection

From a database of more than 2000 patients, 76 treatment-naïve patients affected by ASD were recruited and studied from January to October 2018 in the outpatient service of the Child and Adolescent Psychiatry Unit (Department of Clinical and Experimental Medicine, University Hospital of Catania).
The inclusion criteria were clinical diagnosis of ASD, according to the criteria of the Diagnostic and Statistical Manual of Mental Disorders, Fifth Edition (DSM-5, APA 2013), and the absence of other medical, neurological, genetic or metabolic condition such as epilepsy, cytogenetically visible chromosomal abnormalities, copy number variants (CNVs) or single-gene disorders. They were compared to 39 neurologically unaffected controls (NUC), without any history of ASD and who suffered from neither chronic neurological, metabolic or genetic diseases nor psychiatric disorders. All participants to the study were Caucasians from Sicily, randomly recruited from various socio-economic contexts.
The entire cohort was split into 2 sets of samples: (a) discovery set, composed by 23 ASD and 12 NUC; (b) validation set, made by 53 ASD and 27 NUC. The discovery set was used to perform expression profiling by NanoString technology, while the validation set was analyzed by real time PCR single assays and 16S rRNA microbiome screening.

4.3. Assessment

All participants were assessed by a child and adolescent neuropsychiatrist expert in ASD (RR) with the following instruments: WISC-III (Wechsler Intelligence Scale for Children, III edition) [114] or WPSSI (Wechsler Preschool and Primary Scale of Intelligence) [115] as an evaluation of both IQ (Intelligence Quotient) and cognitive functioning, ADOS (Autism Diagnostic Observation Schedule) and ADI-R (Autism Diagnostic Interview–Revised) to evaluate ASD symptoms.
Based on these scales and schedules, the assessment procedure was carefully conducted assigning specific scores which provided a measure of autism severity. Neuropsychological features of participants are summarized in Table 1.

4.4. Sample Collection

All participants were instructed to refrain from eating or drinking for at least 3 h prior to saliva collection. Saliva samples were collected in a good status of oral hygiene (i.e., brushing teeth once/twice daily), without any tooth decay. Saliva collection was always performed between 8:30 and 10:30 a.m. to avoid any potential microbiome and miRnome oscillation due to the circadian rhythms. From a minimum of 800 μL to a maximum of 4 mL of non-stimulated and naturally outflowed saliva was collected into 50 mL conical centrifuge tubes. Saliva samples were centrifuged at 10,000 rpm for 15 min at 4 °C to separate the pellet and supernatant for microbiological analysis and miRNA expression assays, respectively. The pellets were immediately processed, while supernatants were aliquoted into 2 mL RNase-free tubes and stored at −80 °C until analysis.
To test the hematological parameters of each study participant, all participants were instructed to refrain from eating or drinking for at least 3 h prior to blood collection, which was performed between 8:30 and 10:30 a.m. Peripheral blood samples were collected through a butterfly device into a 5 mL collection tube. Collection tubes were treated according to current and standard procedures for clinical samples.

4.5. RNA Extraction

Extraction of total RNA was carried out from 800 μL of saliva samples using Qiagen miRNeasy Mini Kit (Qiagen, GmbH, Hilden, Germany), according to Qiagen Supplementary Protocol for purification of RNA (including small RNAs) from serum or plasma [46,116]. RNA was eluted in 200 μL RNAse-free water and then precipitated by adding 20 μg glycogen, 0.1 volumes 3 M sodium acetate and 2.5 volumes ice-cold 100% ethanol. After incubation at −80 °C overnight, RNA was centrifuged and washed twice in ice-cold 75% ethanol and resuspended in 7 μL RNAse-free water. The yield and quality of the RNA samples were assessed by using NanoDrop Lite Spectrophotometer (Thermo Fisher Scientific, Wilmington, DE, USA).

4.6. MiRNA Profiling by NanoString Technology

To profile the expression of circulating miRNAs from saliva, the NanoString nCounter system assays were performed using the NanoString platform and the nCounter Human v3 miRNA Expression Assay Kits (NanoString Technologies, Seattle, WA, USA), according to the manufacturer’s instructions. MiRNA profiling was performed on 23 ASD patients and 12 NUCs, starting from 3 μL of isolated RNA (approximately 150 ng). Samples were processed using the automated nCounter Prep Station; following hybridization, they were purified and immobilized on a sample cartridge for quantification and data collection by using the nCounter Digital Analyzer. The nSolver 3.0 software was used for data analysis. The endogenous control was selected from the arrays in a similar way to the GMN (global median normalization) method [55,117]. By this approach, we identified miR-21-5p as the best endogenous control for our experimental model.

4.7. MiRNA Data Validation by Single TaqMan Assays

MiRNAs found differentially expressed by NanoString analysis were assessed in a larger independent cohort of 53 ASD patients and 27 NUCs. Validation analysis was performed on 20 ng of salivary RNA by using single TaqMan MicroRNA Assays (Applied Biosystems, Foster City, CA, USA) in a 7900HT Fast Real-Time PCR System (Applied Biosystems), according to the manufacturer’s instructions. Data analysis was computed on SDS v2.4 and RQ Manager 1.2.1 (Applied Biosystems). Expression fold change values are shown as geometric mean of relative quantification (RQ) values obtained by applying the 2−∆∆Ct method [118].

4.8. DNA Extraction, 16S rRNA Gene Library Preparation, and Sequencing

DNA from salivary samples was extracted with the PureLink Genomic DNA Kit (Thermo Fisher Scientific, Waltham, MA, USA) according to the manufacturer’s instructions. Extracted DNAs were checked for quality and quantity by NanoDrop2000 Spectrophotometer (Thermo Fisher Scientific, USA). A negative control only containing the buffer was included during each DNA extraction. All genomic DNA was frozen at −80 °C until sequencing. Extracted DNA (10 ng) was prepared for 16S amplicon sequencing by the MiSeq platform using the Illumina protocol (Part # 15044223, Rev. B) with modifications to ensure sufficient amplification of low amounts of DNA. The V3-V4 region of the 16S ribosomal RNA gene was amplified using the primers forward (5′-CCTACGGGNGGCWGCAG-3′) and reverse (5′-GACTACHVGGGTATCTAATCC-3′) [119]. All PCR products were purified by Agencourt AMPure XP magnetic beads (Beckman Coulter). The samples and mock community aliquots were then barcoded by Illumina’s dual indexing strategy (Nextera XT Index Kit v2, Sets A and B, Illumina) by using the default barcode layout from the Illumina Experiment Manager software v1.13.1, as described in the Illumina protocol. The quality of PCR products was assessed by Agilent 2100 Bioanalyzer (Agilent Technologies, Palo Alto, CA, USA). The amplicon libraries underwent further purification and quality checking, followed by dilution and equimolar pooling. Finally, 12 pM of the library mixtures, spiked with 20% PhiX control, was paired-end (2 × 300) sequenced using the MiSeq platform (Illumina, San Diego, CA, USA) at the Centro Servizi - B.R.I.T. (University of Catania).

4.9. Processing and Analyses of Sequencing Data

QIIME pipeline (Quantitative Insights into Microbial Ecology) v.1.9.1 was used to process the generated raw FASTQ files [120]. V3-V4 16S rRNA FASTQ were de-multiplexed using the barcodes. The paired-end sequences were assembled to form a single read using FLASH [121] and quality-filtered ≥80% bases in a read above Q30 (see Supplementary Table S4). Merged reads were length-filtered based on 445 bp (the expected length). The ends of retained (not-merged) forward reads were clipped to a total read length of 270 bp to remove low quality bases. The high-quality reads were clustered against a reference sequence collection with QIIME. To focus only on the prominent taxa, a filtering step of 0.01% at the Operational taxonomic Unit (OTU) level was performed by running a workflow on QIIME (filter_otus_from_otu_table.py). The taxonomy of each 16S rRNA gene sequence was collapsed to OTUs using the open reference-based OTU picking method against Greengenes database at 97% of sequence similarity [122]. Chimeras were identified and removed by Chimera Slayer and the UCHIME algorithm. Any reads that did not match the reference sequence collection were subsequently clustered de novo. To avoid sample size biases in downstream analyses, rarefaction curves were generated with QIIME (alpha_rarefaction.py workflow) and calculated by applying Explicet and a maximum depth of 74.469 sequences/sample [123]. The OTU tables were used for assessing α-diversity indices (Chao-1, Shannon and Shannon evenness) calculated from the taxonomic profiles and compared across the ASD and NUC groups by QIIME algorithms. Independent Student’s t-test and Mann–Whitney U test were used to evaluate α-diversity among the taxonomic profiles and compared across the ASD and NUC groups. β-diversity between ASD and NUC groups was analyzed by weighted and unweighted UniFrac distance matrices (beta_diversity.py workflow) and visualized through tridimensional PCoA plot by using EMPeror (http://boocore.github.io/emperor/). The differentially abundant OTUs across two sample categories were identified by QIIME scripts (differential_abundance.py). The core microbiome was determined by QIIME algorithms (compute_core_microbiome.py) and the diversity analysis was performed with the script core_diversity_analyses.py.
DNA sequences were deposited in the Sequence Read Archive under BioProjects PRJNA518756 and PRJNA518760.

4.10. Correlation and Negative Binomial Regression Analyses

To investigate whether a linear relationship exists between the differential expression of salivary miRNAs, microbiome taxa and the neuropsychological and hematological parameters for each selected participant, correlation analysis was performed. Additionally, we applied a Negative Binomial (NB) regression to explore the potential effects of the clinical parameters and the miRNA expression (potential predictors) on the relative microbial abundances (outcome variables). In particular, relationships were evaluated by using generalized linear models (GLM) assuming a negative binomial distribution and log link function, since our response variable is represented by over-dispersed count data that didn’t have an excessive number of zeros [124].

4.11. Computational Enrichment Analysis

To investigate the functional meaning and potential ASD association of the identified DE miRNAs, DIANA-mirPath v.3 web server [125] and miRNet tool [126] were used for pathway enrichment analysis from KEGG (Kyoto Encyclopedia of Genes and Genomes) and Reactome gene annotation databases.

4.12. Statistical Approach

For miRNA profiling analysis, SAM (Significance of Microarrays Analysis) statistical tests were computed by using MeV (Multi experiment viewer v4.8.1) statistical analysis software. We computed a two-class unpaired test, based on 100 permutations. Fold change (FC) values were obtained by calculating the ratio between the normalized count mean of each group. MeV was also used to generate a heat-map of identified DE-miRNAs.
Concerning microbiome analyses, OTU frequencies across sample groups were performed by the Kruskal–Wallis test. Statistical analysis of taxonomic profiles was performed using STAMP (Software Testing AMPlification) [127,128,129] by a two-sided White’s non-parametric t-test. Extended error bar plots were produced by STAMP (White’s non-parametric t-test and p-value < 0.05) showing the bacterial taxa with a significant difference (p-value < 0.05). Mann–Whitney–Kruskal–Wallis, t-test/ANOVA were used for confirmation (Supplementary Table S1).
The correction for multiple tests of high throughput analyses was performed by applying Benjamini–Hochberg FDR (False Discovery Rate).
The Mann–Whitney U test was applied to evaluate the differential expression of tested miRNAs between the two groups in the validation analysis (p-value < 0.05). Cliff’s delta statistic [130,131] was used to estimate the non-parametric effect sizes and were calculated by using the Cliff’s Delta Calculator by Macbeth et al. [132].
Correlation analyses were performed by applying Spearman test with two-sided p-values corrected for multiple comparisons by using the Bonferroni-Šídák approach. Statistical analyses were computed using GraphPad Prism version 7.00 for Windows (GraphPad Software, La Jolla, CA, USA). To determine the strength of associations between variables, the correlation coefficients themselves were interpreted as index of effect size [133].
Negative binomial, multiple and simple linear regression analyses (p < 0.05) were performed by IBM SPSS Statistics 25 software. The effect sizes were provided by RcountD (https://stefany.shinyapps.io/RcountD). For functional enrichment analysis, Fisher’s exact t-test (p < 0.05) was used.

Supplementary Materials

The following are available online at https://www.mdpi.com/1422-0067/21/17/6203/s1.

Author Contributions

M.P., M.R., S.S., and R.R. conceived project and planned the experiments. M.G., C.N.D., and R.B. carried out patients’ recruitment and R.R. performed clinical diagnosis. F.M., G.L., M.C., M.S., and G.M. performed the experiments. F.M., G.L., M.S., D.B. (Duilia Brex), C.B., A.S., D.B. (Davide Barbagallo), and L.T. performed the bioinformatics analysis and data statistics. M.R., F.M., M.S. wrote the manuscript. M.P., S.S., R.R., C.D.P., and S.O. revised the manuscript. All authors have read and agreed to the published version of the manuscript.

Funding

This research received no external funding.

Acknowledgments

This study was supported by 2016/2018 Department Research Plan of University of Catania (second line of intervention). We wish to thank the Scientific Bureau of the University of Catania for language support.

Conflicts of Interest

The authors declare no conflict of interest.

Abbreviations

ADI-RAutism Diagnostic Interview—Revised
ADOSAutism Diagnostic Observation Schedule
ASDAutistic Spectrum Disorder
CNSCentral Nervous System
CNVsCopy Number Variants
CSFcerebrospinal fluid
dfDegree of freedom
DEDifferentially expressed
DSM-5Diagnostic and Statistical Manual of Mental Disorders, 5th edition
FCFold Change
FDRFalse Discovery Rate
FoxOForkhead box O
GLMGeneralized linear model
GMNGlobal median normalization
IQIntelligence Quotient
KEGGKyoto Encyclopedia of Genes and Genomes
LRLikelihood ratio
LDHLactate dehydrogenase
MeVMulti experiment viewer
miRNAmicroRNA
MLRMultiple linear regression
NBNegative binomial
NBRNegative binomial regression
NUCNeurologically unaffected control
NSNon-significant
OTUOperational taxonomic Unit
pp-value
PCoAPrincipal coordinate analysis
PIQPerformance Intelligence Quotient
QIIMEQuantitative Insights Into Microbial Ecology
RQRelative quantification
rRNARibosomal RNA
RT-PCRReal Time-polymerase chain reactions
SAMSignificance of Microarrays Analysis
SLRSimple linear regression
SMD Standardized mean difference
TIQTotal Intelligence Quotient
TLR-7Tall-like Receptor 7
TSHThyroid-stimulating Hormone
VIQVerbal Intelligence Quotient
WISC-IIIWechsler Intelligence Scale for Children, III edition
WPSSIWechsler Preschool and Primary Scale of Intelligence
YOADYoung-Onset Alzheimer Disease.

References

  1. Fakhoury, M. Autistic spectrum disorders: A review of clinical features, theories and diagnosis. Int. J. Dev. Neurosci. 2015, 43, 70–77. [Google Scholar] [CrossRef]
  2. Abdolmaleky, H.M.; Zhou, J.R.; Thiagalingam, S. An update on the epigenetics of psychotic diseases and autism. Epigenomics 2015, 7, 427–449. [Google Scholar] [CrossRef] [PubMed]
  3. Nardone, S.; Elliott, E. The Interaction between the Immune System and Epigenetics in the Etiology of Autism Spectrum Disorders. Front. Neurosci. 2016, 10, 329. [Google Scholar] [CrossRef] [PubMed] [Green Version]
  4. Sun, W.; Poschmann, J.; Cruz-Herrera Del Rosario, R.; Parikshak, N.N.; Hajan, H.S.; Kumar, V.; Ramasamy, R.; Belgard, T.G.; Elanggovan, B.; Wong, C.C.Y.; et al. Histone Acetylome-wide Association Study of Autism Spectrum Disorder. Cell 2016, 167, 1385–1397. [Google Scholar] [CrossRef] [PubMed] [Green Version]
  5. Muhle, R.A.; Reed, H.E.; Stratigos, K.A.; Veenstra-VanderWeele, J. The Emerging Clinical Neuroscience of Autism Spectrum Disorder: A Review. JAMA Psychiatry 2018, 75, 514–523. [Google Scholar] [CrossRef] [PubMed]
  6. Vorstman, J.A.S.; Parr, J.R.; Moreno-De-Luca, D.; Anney, R.J.L.; Nurnberger, J.I., Jr.; Hallmayer, J.F. Autism genetics: Opportunities and challenges for clinical translation. Nat. Rev. Genet. 2017, 18, 362–376. [Google Scholar] [CrossRef]
  7. Miles, J.H. Autism spectrum disorders—A genetics review. Genet. Med. 2011, 13, 278–294. [Google Scholar] [CrossRef] [Green Version]
  8. Levitt, P.; Campbell, D.B. The genetic and neurobiologic compass points toward common signaling dysfunctions in autism spectrum disorders. J. Clin. Investig. 2009, 119, 747–754. [Google Scholar] [CrossRef]
  9. Voineagu, I.; Eapen, V. Converging Pathways in Autism Spectrum Disorders: Interplay between Synaptic Dysfunction and Immune Responses. Front. Hum. Neurosci. 2013, 7, 738. [Google Scholar] [CrossRef]
  10. Chen, J.; Alberts, I.; Li, X. Dysregulation of the IGF-I/PI3K/AKT/mTOR signaling pathway in autism spectrum disorders. Int. J. Dev. Neurosci. 2014, 35, 35–41. [Google Scholar] [CrossRef]
  11. Gokoolparsadh, A.; Sutton, G.J.; Charamko, A.; Green, N.F.; Pardy, C.J.; Voineagu, I. Searching for convergent pathways in autism spectrum disorders: Insights from human brain transcriptome studies. Cell. Mol. Life Sci. 2016, 73, 4517–4530. [Google Scholar] [CrossRef] [PubMed]
  12. Ansel, A.; Rosenzweig, J.P.; Zisman, P.D.; Melamed, M.; Gesundheit, B. Variation in Gene Expression in Autism Spectrum Disorders: An Extensive Review of Transcriptomic Studies. Front. Neurosci. 2016, 10, 601. [Google Scholar] [CrossRef] [PubMed] [Green Version]
  13. Adams, J.B.; Johansen, L.J.; Powell, L.D.; Quig, D.; Rubin, R.A. Gastrointestinal flora and gastrointestinal status in children with autism—Comparisons to typical children and correlation with autism severity. BMC Gastroenterol. 2011, 11, 22. [Google Scholar] [CrossRef] [PubMed] [Green Version]
  14. Williams, B.L.; Hornig, M.; Parekh, T.; Lipkin, W.I. Application of novel PCR-based methods for detection, quantitation, and phylogenetic characterization of Sutterella species in intestinal biopsy samples from children with autism and gastrointestinal disturbances. MBio 2012, 3, e00261-11. [Google Scholar] [CrossRef] [Green Version]
  15. Erny, D.; Hrabe de Angelis, A.L.; Jaitin, D.; Wieghofer, P.; Staszewski, O.; David, E.; Keren-Shaul, H.; Mahlakoiv, T.; Jakobshagen, K.; Buch, T.; et al. Host microbiota constantly control maturation and function of microglia in the CNS. Nat. Neurosci. 2015, 18, 965–977. [Google Scholar] [CrossRef]
  16. Desbonnet, L.; Clarke, G.; Shanahan, F.; Dinan, T.G.; Cryan, J.F. Microbiota is essential for social development in the mouse. Mol. Psychiatry 2014, 19, 146–148. [Google Scholar] [CrossRef]
  17. Arentsen, T.; Raith, H.; Qian, Y.; Forssberg, H.; Diaz Heijtz, R. Host microbiota modulates development of social preference in mice. Microb. Ecol. Health Dis. 2015, 26, 29719. [Google Scholar] [CrossRef]
  18. Crumeyrolle-Arias, M.; Jaglin, M.; Bruneau, A.; Vancassel, S.; Cardona, A.; Dauge, V.; Naudon, L.; Rabot, S. Absence of the gut microbiota enhances anxiety-like behavior and neuroendocrine response to acute stress in rats. Psychoneuroendocrinology 2014, 42, 207–217. [Google Scholar] [CrossRef]
  19. Li, Q.; Han, Y.; Dy, A.B.C.; Hagerman, R.J. The Gut Microbiota and Autism Spectrum Disorders. Front. Cell. Neurosci. 2017, 11, 120. [Google Scholar] [CrossRef]
  20. Linares, D.M.; Ross, P.; Stanton, C. Beneficial Microbes: The pharmacy in the gut. Bioengineered 2016, 7, 11–20. [Google Scholar] [CrossRef] [Green Version]
  21. Belkaid, Y.; Hand, T.W. Role of the microbiota in immunity and inflammation. Cell 2014, 157, 121–141. [Google Scholar] [CrossRef] [PubMed] [Green Version]
  22. Takahashi, K. Influence of bacteria on epigenetic gene control. Cell. Mol. Life Sci. 2014, 71, 1045–1054. [Google Scholar] [CrossRef] [PubMed]
  23. Van de Wiele, T.; Van Praet, J.T.; Marzorati, M.; Drennan, M.B.; Elewaut, D. How the microbiota shapes rheumatic diseases. Nat. Rev. Rheumatol. 2016, 12, 398–411. [Google Scholar] [CrossRef]
  24. Clarke, G.; O’Mahony, S.M.; Dinan, T.G.; Cryan, J.F. Priming for health: Gut microbiota acquired in early life regulates physiology, brain and behaviour. Acta Paediatr. 2014, 103, 812–819. [Google Scholar] [CrossRef] [PubMed]
  25. Vuong, H.E.; Hsiao, E.Y. Emerging Roles for the Gut Microbiome in Autism Spectrum Disorder. Biol. Psychiatry 2017, 81, 411–423. [Google Scholar] [CrossRef] [PubMed] [Green Version]
  26. Dewhirst, F.E.; Chen, T.; Izard, J.; Paster, B.J.; Tanner, A.C.; Yu, W.H.; Lakshmanan, A.; Wade, W.G. The human oral microbiome. J. Bacteriol. 2010, 192, 5002–5017. [Google Scholar] [CrossRef] [Green Version]
  27. Krishnan, K.; Chen, T.; Paster, B.J. A practical guide to the oral microbiome and its relation to health and disease. Oral Dis. 2017, 23, 276–286. [Google Scholar] [CrossRef] [Green Version]
  28. Fabian, T.K.; Fejerdy, P.; Csermely, P. Salivary Genomics, Transcriptomics and Proteomics: The Emerging Concept of the Oral Ecosystem and their Use in the Early Diagnosis of Cancer and other Diseases. Curr. Genom. 2008, 9, 11–21. [Google Scholar] [CrossRef]
  29. He, J.; Li, Y.; Cao, Y.; Xue, J.; Zhou, X. The oral microbiome diversity and its relation to human diseases. Folia Microbiol. 2015, 60, 69–80. [Google Scholar] [CrossRef]
  30. Qin, N.; Yang, F.; Li, A.; Prifti, E.; Chen, Y.; Shao, L.; Guo, J.; Le Chatelier, E.; Yao, J.; Wu, L.; et al. Alterations of the human gut microbiome in liver cirrhosis. Nature 2014, 513, 59–64. [Google Scholar] [CrossRef]
  31. Farrell, J.J.; Zhang, L.; Zhou, H.; Chia, D.; Elashoff, D.; Akin, D.; Paster, B.J.; Joshipura, K.; Wong, D.T. Variations of oral microbiota are associated with pancreatic diseases including pancreatic cancer. Gut 2012, 61, 582–588. [Google Scholar] [CrossRef] [PubMed]
  32. Zhang, X.; Zhang, D.; Jia, H.; Feng, Q.; Wang, D.; Liang, D.; Wu, X.; Li, J.; Tang, L.; Li, Y.; et al. The oral and gut microbiomes are perturbed in rheumatoid arthritis and partly normalized after treatment. Nat. Med. 2015, 21, 895–905. [Google Scholar] [CrossRef] [PubMed]
  33. Torres, P.J.; Fletcher, E.M.; Gibbons, S.M.; Bouvet, M.; Doran, K.S.; Kelley, S.T. Characterization of the salivary microbiome in patients with pancreatic cancer. PeerJ 2015, 3, e1373. [Google Scholar] [CrossRef] [PubMed]
  34. Ding, T.; Schloss, P.D. Dynamics and associations of microbial community types across the human body. Nature 2014, 509, 357–360. [Google Scholar] [CrossRef] [PubMed]
  35. Pereira, P.A.B.; Aho, V.T.E.; Paulin, L.; Pekkonen, E.; Auvinen, P.; Scheperjans, F. Oral and nasal microbiota in Parkinson’s disease. Parkinsonism Relat. Disord. 2017, 38, 61–67. [Google Scholar] [CrossRef] [Green Version]
  36. Shoemark, D.K.; Allen, S.J. The microbiome and disease: Reviewing the links between the oral microbiome, aging, and Alzheimer’s disease. J. Alzheimer’s Dis. 2015, 43, 725–738. [Google Scholar] [CrossRef] [Green Version]
  37. Singhrao, S.K.; Harding, A.; Simmons, T.; Robinson, S.; Kesavalu, L.; Crean, S. Oral inflammation, tooth loss, risk factors, and association with progression of Alzheimer’s disease. J. Alzheimer’s Dis. 2014, 42, 723–737. [Google Scholar] [CrossRef] [Green Version]
  38. Gonzalez, A.; Hyde, E.; Sangwan, N.; Gilbert, J.A.; Viirre, E.; Knight, R. Correction for Gonzalez et al., “Migraines Are Correlated with Higher Levels of Nitrate-, Nitrite-, and Nitric Oxide-Reducing Oral Microbes in the American Gut Project Cohort”. MSystems 2017, 2, e00023-17. [Google Scholar] [CrossRef] [Green Version]
  39. Farrokhi, V.; Nemati, R.; Nichols, F.C.; Yao, X.; Anstadt, E.; Fujiwara, M.; Grady, J.; Wakefield, D.; Castro, W.; Donaldson, J.; et al. Bacterial lipodipeptide, Lipid 654, is a microbiome-associated biomarker for multiple sclerosis. Clin. Transl. Immunol. 2013, 2, e8. [Google Scholar] [CrossRef]
  40. Lau, H.C.; Lee, I.K.; Ko, P.W.; Lee, H.W.; Huh, J.S.; Cho, W.J.; Lim, J.O. Non-invasive screening for Alzheimer’s disease by sensing salivary sugar using Drosophila cells expressing gustatory receptor (Gr5a) immobilized on an extended gate ion-sensitive field-effect transistor (EG-ISFET) biosensor. PLoS ONE 2015, 10, e0117810. [Google Scholar] [CrossRef] [Green Version]
  41. Cabras, T.; Sanna, M.; Manconi, B.; Fanni, D.; Demelia, L.; Sorbello, O.; Iavarone, F.; Castagnola, M.; Faa, G.; Messana, I. Proteomic investigation of whole saliva in Wilson’s disease. J. Proteom. 2015, 128, 154–163. [Google Scholar] [CrossRef] [PubMed]
  42. Vivacqua, G.; Latorre, A.; Suppa, A.; Nardi, M.; Pietracupa, S.; Mancinelli, R.; Fabbrini, G.; Colosimo, C.; Gaudio, E.; Berardelli, A. Abnormal Salivary Total and Oligomeric Alpha-Synuclein in Parkinson’s Disease. PLoS ONE 2016, 11, e0151156. [Google Scholar] [CrossRef] [PubMed] [Green Version]
  43. Devic, I.; Hwang, H.; Edgar, J.S.; Izutsu, K.; Presland, R.; Pan, C.; Goodlett, D.R.; Wang, Y.; Armaly, J.; Tumas, V.; et al. Salivary alpha-synuclein and DJ-1: Potential biomarkers for Parkinson’s disease. Brain 2011, 134, e178. [Google Scholar] [CrossRef] [PubMed] [Green Version]
  44. Corey-Bloom, J.; Haque, A.S.; Park, S.; Nathan, A.S.; Baker, R.W.; Thomas, E.A. Salivary levels of total huntingtin are elevated in Huntington’s disease patients. Sci. Rep. 2018, 8, 7371. [Google Scholar] [CrossRef]
  45. Bermejo-Pareja, F.; Antequera, D.; Vargas, T.; Molina, J.A.; Carro, E. Saliva levels of Abeta1-42 as potential biomarker of Alzheimer’s disease: A pilot study. BMC Neurol. 2010, 10, 108. [Google Scholar] [CrossRef] [Green Version]
  46. Di Pietro, V.; Porto, E.; Ragusa, M.; Barbagallo, C.; Davies, D.; Forcione, M.; Logan, A.; Di Pietro, C.; Purrello, M.; Grey, M.; et al. Salivary MicroRNAs: Diagnostic Markers of Mild Traumatic Brain Injury in Contact-Sport. Front. Mol. Neurosci. 2018, 11, 290. [Google Scholar] [CrossRef] [Green Version]
  47. Hicks, S.D.; Ignacio, C.; Gentile, K.; Middleton, F.A. Salivary miRNA profiles identify children with autism spectrum disorder, correlate with adaptive behavior, and implicate ASD candidate genes involved in neurodevelopment. BMC Pediatrics 2016, 16, 52. [Google Scholar] [CrossRef] [Green Version]
  48. Griffiths, J.A.; Mazmanian, S.K. Emerging evidence linking the gut microbiome to neurologic disorders. Genome Med. 2018, 10, 98. [Google Scholar] [CrossRef] [Green Version]
  49. Bian, S.; Sun, T. Functions of noncoding RNAs in neural development and neurological diseases. Mol. Neurobiol. 2011, 44, 359–373. [Google Scholar] [CrossRef] [Green Version]
  50. Rajman, M.; Schratt, G. MicroRNAs in neural development: From master regulators to fine-tuners. Development 2017, 144, 2310–2322. [Google Scholar] [CrossRef] [Green Version]
  51. Sun, E.; Shi, Y. MicroRNAs: Small molecules with big roles in neurodevelopment and diseases. Exp. Neurol. 2015, 268, 46–53. [Google Scholar] [CrossRef] [PubMed] [Green Version]
  52. Martino, S.; di Girolamo, I.; Orlacchio, A.; Datti, A.; Orlacchio, A. MicroRNA implications across neurodevelopment and neuropathology. J. Biomed. Biotechnol. 2009, 2009, 654346. [Google Scholar] [CrossRef] [PubMed] [Green Version]
  53. Xu, B.; Karayiorgou, M.; Gogos, J.A. MicroRNAs in psychiatric and neurodevelopmental disorders. Brain Res. 2010, 1338, 78–88. [Google Scholar] [CrossRef] [PubMed] [Green Version]
  54. Rizzo, R.; Ragusa, M.; Barbagallo, C.; Sammito, M.; Gulisano, M.; Cali, P.V.; Pappalardo, C.; Barchitta, M.; Granata, M.; Condorelli, A.G.; et al. Circulating miRNAs profiles in Tourette syndrome: Molecular data and clinical implications. Mol. Brain 2015, 8, 44. [Google Scholar] [CrossRef] [PubMed] [Green Version]
  55. Cirnigliaro, M.; Barbagallo, C.; Gulisano, M.; Domini, C.N.; Barone, R.; Barbagallo, D.; Ragusa, M.; Di Pietro, C.; Rizzo, R.; Purrello, M. Expression and Regulatory Network Analysis of miR-140-3p, a New Potential Serum Biomarker for Autism Spectrum Disorder. Front. Mol. Neurosci. 2017, 10, 250. [Google Scholar] [CrossRef] [Green Version]
  56. Rajgor, D. Macro roles for microRNAs in neurodegenerative diseases. Non-Coding RNA Res. 2018, 3, 154–159. [Google Scholar] [CrossRef] [PubMed]
  57. Sheinerman, K.S.; Toledo, J.B.; Tsivinsky, V.G.; Irwin, D.; Grossman, M.; Weintraub, D.; Hurtig, H.I.; Chen-Plotkin, A.; Wolk, D.A.; McCluskey, L.F.; et al. Circulating brain-enriched microRNAs as novel biomarkers for detection and differentiation of neurodegenerative diseases. Alzheimer’s Res. Ther. 2017, 9, 89. [Google Scholar] [CrossRef]
  58. Hicks, S.D.; Middleton, F.A. A Comparative Review of microRNA Expression Patterns in Autism Spectrum Disorder. Front. Psychiatry 2016, 7, 176. [Google Scholar] [CrossRef] [Green Version]
  59. Hicks, S.D.; Rajan, A.T.; Wagner, K.E.; Barns, S.; Carpenter, R.L.; Middleton, F.A. Validation of a Salivary RNA Test for Childhood Autism Spectrum Disorder. Front. Genet. 2018, 9, 534. [Google Scholar] [CrossRef] [Green Version]
  60. Qiao, Y.; Wu, M.; Feng, Y.; Zhou, Z.; Chen, L.; Chen, F. Alterations of oral microbiota distinguish children with autism spectrum disorders from healthy controls. Sci. Rep. 2018, 8, 1597. [Google Scholar] [CrossRef] [Green Version]
  61. Hicks, S.D.; Uhlig, R.; Afshari, P.; Williams, J.; Chroneos, M.; Tierney-Aves, C.; Wagner, K.; Middleton, F.A. Oral microbiome activity in children with autism spectrum disorder. Autism Res. 2018, 11, 1286–1299. [Google Scholar] [CrossRef] [PubMed]
  62. Li, J.; Quinque, D.; Horz, H.P.; Li, M.; Rzhetskaya, M.; Raff, J.A.; Hayes, M.G.; Stoneking, M. Comparative analysis of the human saliva microbiome from different climate zones: Alaska, Germany, and Africa. BMC Microbiol. 2014, 14, 316. [Google Scholar] [CrossRef] [PubMed] [Green Version]
  63. Sarkar, A.; Stoneking, M.; Nandineni, M.R. Unraveling the human salivary microbiome diversity in Indian populations. PLoS ONE 2017, 12, e0184515. [Google Scholar] [CrossRef] [Green Version]
  64. Shaw, L.; Ribeiro, A.L.R.; Levine, A.P.; Pontikos, N.; Balloux, F.; Segal, A.W.; Roberts, A.P.; Smith, A.M. The Human Salivary Microbiome Is Shaped by Shared Environment Rather than Genetics: Evidence from a Large Family of Closely Related Individuals. mBio 2017, 8, e01237-17. [Google Scholar] [CrossRef] [PubMed] [Green Version]
  65. Zaura, E.; Brandt, B.W.; Prodan, A.; Teixeira de Mattos, M.J.; Imangaliyev, S.; Kool, J.; Buijs, M.J.; Jagers, F.L.; Hennequin-Hoenderdos, N.L.; Slot, D.E.; et al. On the ecosystemic network of saliva in healthy young adults. ISME J. 2017, 11, 1218–1231. [Google Scholar] [CrossRef]
  66. Park, N.J.; Zhou, H.; Elashoff, D.; Henson, B.S.; Kastratovic, D.A.; Abemayor, E.; Wong, D.T. Salivary microRNA: Discovery, characterization, and clinical utility for oral cancer detection. Clin. Cancer Res. 2009, 15, 5473–5477. [Google Scholar] [CrossRef] [Green Version]
  67. Ramanan, P.; Barreto, J.N.; Osmon, D.R.; Tosh, P.K. Rothia bacteremia: A 10-year experience at Mayo Clinic, Rochester, Minnesota. J. Clin. Microbiol. 2014, 52, 3184–3189. [Google Scholar] [CrossRef] [Green Version]
  68. O’Neil, C.R.; Wilson, E.; Missaghi, B. Bone and Joint Infections due to Haemophilus parainfluenzae: Case Report and Review of the Literature. Can. J. Infect. Dis. Med. Microbiol. 2016, 2016, 4503025. [Google Scholar]
  69. Bell, J.S.; Spencer, J.I.; Yates, R.L.; Yee, S.A.; Jacobs, B.M.; DeLuca, G.C. Invited Review: From nose to gut—the role of the microbiome in neurological disease. Neuropathol. Appl. Neurobiol. 2019, 45, 195–215. [Google Scholar] [CrossRef] [Green Version]
  70. Harding, A.; Gonder, U.; Robinson, S.J.; Crean, S.; Singhrao, S.K. Exploring the Association between Alzheimer’s Disease, Oral Health, Microbial Endocrinology and Nutrition. Front. Aging Neurosci. 2017, 9, 398. [Google Scholar] [CrossRef]
  71. Marchesan, J.T.; Morelli, T.; Moss, K.; Barros, S.P.; Ward, M.; Jenkins, W.; Aspiras, M.B.; Offenbacher, S. Association of Synergistetes and Cyclodipeptides with Periodontitis. J. Dent. Res. 2015, 94, 1425–1431. [Google Scholar] [CrossRef] [PubMed]
  72. Meuric, V.; Le Gall-David, S.; Boyer, E.; Acuna-Amador, L.; Martin, B.; Fong, S.B.; Barloy-Hubler, F.; Bonnaure-Mallet, M. Signature of Microbial Dysbiosis in Periodontitis. Appl. Environ. Microbiol. 2017, 83, e00462-17. [Google Scholar] [CrossRef] [PubMed] [Green Version]
  73. Muller, M.; Jakel, L.; Bruinsma, I.B.; Claassen, J.A.; Kuiperij, H.B.; Verbeek, M.M. MicroRNA-29a Is a Candidate Biomarker for Alzheimer’s Disease in Cell-Free Cerebrospinal Fluid. Mol. Neurobiol. 2016, 53, 2894–2899. [Google Scholar] [CrossRef] [PubMed] [Green Version]
  74. McKeever, P.M.; Schneider, R.; Taghdiri, F.; Weichert, A.; Multani, N.; Brown, R.A.; Boxer, A.L.; Karydas, A.; Miller, B.; Robertson, J.; et al. MicroRNA Expression Levels Are Altered in the Cerebrospinal Fluid of Patients with Young-Onset Alzheimer’s Disease. Mol. Neurobiol. 2018, 55, 8826–8841. [Google Scholar] [CrossRef] [Green Version]
  75. Lugli, G.; Cohen, A.M.; Bennett, D.A.; Shah, R.C.; Fields, C.J.; Hernandez, A.G.; Smalheiser, N.R. Plasma Exosomal miRNAs in Persons with and without Alzheimer Disease: Altered Expression and Prospects for Biomarkers. PLoS ONE 2015, 10, e0139233. [Google Scholar] [CrossRef] [Green Version]
  76. Margis, R.; Margis, R.; Rieder, C.R. Identification of blood microRNAs associated to Parkinsonis disease. J. Biotechnol. 2011, 152, 96–101. [Google Scholar] [CrossRef] [Green Version]
  77. Dong, H.; Wang, C.; Lu, S.; Yu, C.; Huang, L.; Feng, W.; Xu, H.; Chen, X.; Zen, K.; Yan, Q.; et al. A panel of four decreased serum microRNAs as a novel biomarker for early Parkinson’s disease. Biomarkers 2016, 21, 129–137. [Google Scholar] [CrossRef]
  78. Johnson, J.J.; Loeffert, A.C.; Stokes, J.; Olympia, R.P.; Bramley, H.; Hicks, S.D. Association of Salivary MicroRNA Changes With Prolonged Concussion Symptoms. JAMA Pediatrics 2018, 172, 65–73. [Google Scholar] [CrossRef]
  79. Huang, F.; Long, Z.; Chen, Z.; Li, J.; Hu, Z.; Qiu, R.; Zhuang, W.; Tang, B.; Xia, K.; Jiang, H. Investigation of Gene Regulatory Networks Associated with Autism Spectrum Disorder Based on MiRNA Expression in China. PLoS ONE 2015, 10, e0129052. [Google Scholar] [CrossRef] [Green Version]
  80. Sarachana, T.; Zhou, R.; Chen, G.; Manji, H.K.; Hu, V.W. Investigation of post-transcriptional gene regulatory networks associated with autism spectrum disorders by microRNA expression profiling of lymphoblastoid cell lines. Genome Med. 2010, 2, 23. [Google Scholar] [CrossRef] [Green Version]
  81. Mor, M.; Nardone, S.; Sams, D.S.; Elliott, E. Hypomethylation of miR-142 promoter and upregulation of microRNAs that target the oxytocin receptor gene in the autism prefrontal cortex. Mol. Autism 2015, 6, 46. [Google Scholar] [CrossRef] [PubMed] [Green Version]
  82. Onore, C.; Yang, H.; Van de Water, J.; Ashwood, P. Dynamic Akt/mTOR Signaling in Children with Autism Spectrum Disorder. Front. Pediatrics 2017, 5, 43. [Google Scholar] [CrossRef] [PubMed] [Green Version]
  83. de la Torre-Ubieta, L.; Won, H.; Stein, J.L.; Geschwind, D.H. Advancing the understanding of autism disease mechanisms through genetics. Nat. Med. 2016, 22, 345–361. [Google Scholar] [CrossRef]
  84. O’Connell, K.S.; McGregor, N.W.; Lochner, C.; Emsley, R.; Warnich, L. The genetic architecture of schizophrenia, bipolar disorder, obsessive-compulsive disorder and autism spectrum disorder. Mol. Cell. Neurosci. 2018, 88, 300–307. [Google Scholar] [CrossRef] [PubMed]
  85. Lathia, J.D.; Mattson, M.P.; Cheng, A. Notch: From neural development to neurological disorders. J. Neurochem. 2008, 107, 1471–1481. [Google Scholar] [CrossRef] [Green Version]
  86. Hwang, I.; Oh, H.; Santo, E.; Kim, D.Y.; Chen, J.W.; Bronson, R.T.; Locasale, J.W.; Na, Y.; Lee, J.; Reed, S.; et al. FOXO protects against age-progressive axonal degeneration. Aging Cell 2018, 17, e12701. [Google Scholar] [CrossRef] [PubMed] [Green Version]
  87. Chao, M.V.; Rajagopal, R.; Lee, F.S. Neurotrophin signalling in health and disease. Clin. Sci. 2006, 110, 167–173. [Google Scholar] [CrossRef]
  88. Verma, R.; Ritzel, R.M.; Harris, N.M.; Lee, J.; Kim, T.; Pandi, G.; Vemuganti, R.; McCullough, L.D. Inhibition of miR-141-3p Ameliorates the Negative Effects of Poststroke Social Isolation in Aged Mice. Stroke 2018, 49, 1701–1707. [Google Scholar] [CrossRef]
  89. Yang, L.; Engeland, C.G.; Cheng, B. Social isolation impairs oral palatal wound healing in sprague-dawley rats: A role for miR-29 and miR-203 via VEGF suppression. PLoS ONE 2013, 8, e72359. [Google Scholar] [CrossRef] [Green Version]
  90. Wyczechowska, D.; Lin, H.Y.; LaPlante, A.; Jeansonne, D.; Lassak, A.; Parsons, C.H.; Molina, P.E.; Peruzzi, F. A miRNA Signature for Cognitive Deficits and Alcohol Use Disorder in Persons Living with HIV/AIDS. Front. Mol. Neurosci. 2017, 10, 385. [Google Scholar] [CrossRef] [Green Version]
  91. Gidron, Y.; De Zwaan, M.; Quint, K.; Ocker, M. Influence of stress and health-behaviour on miRNA expression. Mol. Med. Rep. 2010, 3, 455–457. [Google Scholar] [CrossRef] [PubMed] [Green Version]
  92. Kuang, W.H.; Dong, Z.Q.; Tian, L.T.; Li, J. MicroRNA-451a, microRNA-34a-5p, and microRNA-221-3p as predictors of response to antidepressant treatment. Braz. J. Med. Biol. Res. 2018, 51, e7212. [Google Scholar] [CrossRef] [Green Version]
  93. Cassidy, S.A.; Bradley, L.; Bowen, E.; Wigham, S.; Rodgers, J. Measurement properties of tools used to assess depression in adults with and without autism spectrum conditions: A systematic review. Autism Res. 2018, 11, 738–754. [Google Scholar] [CrossRef] [PubMed] [Green Version]
  94. Khemakhem, A.M.; Frye, R.E.; El-Ansary, A.; Al-Ayadhi, L.; Bacha, A.B. Novel biomarkers of metabolic dysfunction is autism spectrum disorder: Potential for biological diagnostic markers. Metab. Brain Dis. 2017, 32, 1983–1997. [Google Scholar] [CrossRef] [PubMed]
  95. Ji, J.; Qin, Y.; Ren, J.; Lu, C.; Wang, R.; Dai, X.; Zhou, R.; Huang, Z.; Xu, M.; Chen, M.; et al. Mitochondria-related miR-141-3p contributes to mitochondrial dysfunction in HFD-induced obesity by inhibiting PTEN. Sci. Rep. 2015, 5, 16262. [Google Scholar] [CrossRef]
  96. Meltzer, S.; Bjornetro, T.; Lyckander, L.G.; Flatmark, K.; Dueland, S.; Samiappan, R.; Johansen, C.; Kalanxhi, E.; Ree, A.H.; Redalen, K.R. Corrigendum to “Circulating Exosomal miR-141-3p and miR-375 in Metastatic Progression of Rectal Cancer” [Transl Oncol 12 (8) (2019) 1038-1044]. Transl. Oncol. 2020, 13, 122–124. [Google Scholar] [CrossRef] [PubMed]
  97. Zhang, Q.; Xin, H.; Fen, T. Function of microRNA141 in human breast cancer through cytotoxic CD4+ T cells regulated by MAP4K4 expression. Mol. Med. Rep. 2018, 17, 7893–7901. [Google Scholar]
  98. He, X.; McLean, J.S.; Edlund, A.; Yooseph, S.; Hall, A.P.; Liu, S.Y.; Dorrestein, P.C.; Esquenazi, E.; Hunter, R.C.; Cheng, G.; et al. Cultivation of a human-associated TM7 phylotype reveals a reduced genome and epibiotic parasitic lifestyle. Proc. Natl. Acad. Sci. USA 2015, 112, 244–249. [Google Scholar] [CrossRef] [Green Version]
  99. Shi, B.; Chang, M.; Martin, J.; Mitreva, M.; Lux, R.; Klokkevold, P.; Sodergren, E.; Weinstock, G.M.; Haake, S.K.; Li, H. Dynamic changes in the subgingival microbiome and their potential for diagnosis and prognosis of periodontitis. MBio 2015, 6, e01926-14. [Google Scholar] [CrossRef] [Green Version]
  100. Kamer, A.R.; Morse, D.E.; Holm-Pedersen, P.; Mortensen, E.L.; Avlund, K. Periodontal inflammation in relation to cognitive function in an older adult Danish population. J. Alzheimer’s Dis. 2012, 28, 613–624. [Google Scholar] [CrossRef]
  101. Bui, F.Q.; Almeida-da-Silva, C.L.C.; Huynh, B.; Trinh, A.; Liu, J.; Woodward, J.; Asadi, H.; Ojcius, D.M. Association between periodontal pathogens and systemic disease. Biomed. J. 2019, 42, 27–35. [Google Scholar] [CrossRef] [PubMed]
  102. Stoecklin-Wasmer, C.; Guarnieri, P.; Celenti, R.; Demmer, R.T.; Kebschull, M.; Papapanou, P.N. MicroRNAs and their target genes in gingival tissues. J. Dent. Res. 2012, 91, 934–940. [Google Scholar] [CrossRef] [PubMed] [Green Version]
  103. Moloney, G.M.; Viola, M.F.; Hoban, A.E.; Dinan, T.G.; Cryan, J.F. Faecal microRNAs: Indicators of imbalance at the host-microbe interface? Benef. Microbes 2018, 9, 175–183. [Google Scholar] [CrossRef] [PubMed]
  104. Yuan, C.; Burns, M.B.; Subramanian, S.; Blekhman, R. Interaction between Host MicroRNAs and the Gut Microbiota in Colorectal Cancer. MSystems 2018, 3, e00205-17. [Google Scholar] [CrossRef] [Green Version]
  105. Liu, S.; da Cunha, A.P.; Rezende, R.M.; Cialic, R.; Wei, Z.; Bry, L.; Comstock, L.E.; Gandhi, R.; Weiner, H.L. The Host Shapes the Gut Microbiota via Fecal MicroRNA. Cell Host Microbe 2016, 19, 32–43. [Google Scholar] [CrossRef] [PubMed] [Green Version]
  106. Schulte, L.N.; Eulalio, A.; Mollenkopf, H.J.; Reinhardt, R.; Vogel, J. Analysis of the host microRNA response to Salmonella uncovers the control of major cytokines by the let-7 family. EMBO J. 2011, 30, 1977–1989. [Google Scholar] [CrossRef] [Green Version]
  107. Hoeke, L.; Sharbati, J.; Pawar, K.; Keller, A.; Einspanier, R.; Sharbati, S. Intestinal Salmonella typhimurium infection leads to miR-29a induced caveolin 2 regulation. PLoS ONE 2013, 8, e67300. [Google Scholar] [CrossRef] [Green Version]
  108. Maudet, C.; Mano, M.; Sunkavalli, U.; Sharan, M.; Giacca, M.; Forstner, K.U.; Eulalio, A. Functional high-throughput screening identifies the miR-15 microRNA family as cellular restriction factors for Salmonella infection. Nat. Commun. 2014, 5, 4718. [Google Scholar] [CrossRef]
  109. Sharbati, J.; Lewin, A.; Kutz-Lohroff, B.; Kamal, E.; Einspanier, R.; Sharbati, S. Integrated microRNA-mRNA-analysis of human monocyte derived macrophages upon Mycobacterium avium subsp. hominissuis infection. PLoS ONE 2011, 6, e20258. [Google Scholar] [CrossRef]
  110. Fu, Y.; Yi, Z.; Wu, X.; Li, J.; Xu, F. Circulating microRNAs in patients with active pulmonary tuberculosis. J. Clin. Microbiol. 2011, 49, 4246–4251. [Google Scholar] [CrossRef] [Green Version]
  111. Yamada, M.; Gomez, J.C.; Chugh, P.E.; Lowell, C.A.; Dinauer, M.C.; Dittmer, D.P.; Doerschuk, C.M. Interferon-gamma production by neutrophils during bacterial pneumonia in mice. Am. J. Respir. Crit. Care Med. 2011, 183, 1391–1401. [Google Scholar] [CrossRef] [PubMed] [Green Version]
  112. Matsushima, K.; Isomoto, H.; Inoue, N.; Nakayama, T.; Hayashi, T.; Nakayama, M.; Nakao, K.; Hirayama, T.; Kohno, S. MicroRNA signatures in Helicobacter pylori-infected gastric mucosa. Int. J. Cancer 2011, 128, 361–370. [Google Scholar] [CrossRef]
  113. Ngounou Wetie, A.G.; Wormwood, K.L.; Russell, S.; Ryan, J.P.; Darie, C.C.; Woods, A.G. A Pilot Proteomic Analysis of Salivary Biomarkers in Autism Spectrum Disorder. Autism Res. 2015, 8, 338–350. [Google Scholar] [CrossRef] [PubMed]
  114. Koyama, T.; Inada, N.; Tsujii, H.; Kurita, H. Predicting children with pervasive developmental disorders using the Wechsler Intelligence Scale for Children-Third Edition. Psychiatry Clin. Neurosci. 2008, 62, 476–478. [Google Scholar] [CrossRef] [PubMed]
  115. Wechsler, D. WPPSI: Wechsler Preschool and Primary Scale of Intelligence; Psychological Corporation: New York, NY, USA, 1967. [Google Scholar]
  116. Ragusa, M.; Barbagallo, C.; Statello, L.; Caltabiano, R.; Russo, A.; Puzzo, L.; Avitabile, T.; Longo, A.; Toro, M.D.; Barbagallo, D.; et al. miRNA profiling in vitreous humor, vitreal exosomes and serum from uveal melanoma patients: Pathological and diagnostic implications. Cancer Biol. Ther. 2015, 16, 1387–1396. [Google Scholar] [CrossRef] [PubMed]
  117. Park, T.; Yi, S.G.; Kang, S.H.; Lee, S.; Lee, Y.S.; Simon, R. Evaluation of normalization methods for microarray data. BMC Bioinform. 2003, 4, 33. [Google Scholar] [CrossRef] [PubMed] [Green Version]
  118. Schmittgen, T.D.; Livak, K.J. Analyzing real-time PCR data by the comparative C (T) method. Nat. Protoc. 2008, 3, 1101–1108. [Google Scholar] [CrossRef]
  119. Klindworth, A.; Pruesse, E.; Schweer, T.; Peplies, J.; Quast, C.; Horn, M.; Glockner, F.O. Evaluation of general 16S ribosomal RNA gene PCR primers for classical and next-generation sequencing-based diversity studies. Nucleic Acids Res. 2013, 41, e1. [Google Scholar] [CrossRef]
  120. Caporaso, J.G.; Kuczynski, J.; Stombaugh, J.; Bittinger, K.; Bushman, F.D.; Costello, E.K.; Fierer, N.; Pena, A.G.; Goodrich, J.K.; Gordon, J.I.; et al. QIIME allows analysis of high-throughput community sequencing data. Nat. Methods 2010, 7, 335–336. [Google Scholar] [CrossRef] [Green Version]
  121. Magoc, T.; Salzberg, S.L. FLASH: Fast length adjustment of short reads to improve genome assemblies. Bioinformatics 2011, 27, 2957–2963. [Google Scholar] [CrossRef]
  122. DeSantis, T.Z.; Hugenholtz, P.; Larsen, N.; Rojas, M.; Brodie, E.L.; Keller, K.; Huber, T.; Dalevi, D.; Hu, P.; Andersen, G.L. Greengenes, a chimera-checked 16S rRNA gene database and workbench compatible with ARB. Appl. Environ. Microbiol. 2006, 72, 5069–5072. [Google Scholar] [CrossRef] [PubMed] [Green Version]
  123. Robertson, C.E.; Harris, J.K.; Wagner, B.D.; Granger, D.; Browne, K.; Tatem, B.; Feazel, L.M.; Park, K.; Pace, N.R.; Frank, D.N. Explicet: Graphical user interface software for metadata-driven management, analysis and visualization of microbiome data. Bioinformatics 2013, 29, 3100–3101. [Google Scholar] [CrossRef] [PubMed] [Green Version]
  124. Karazsia, B.T.; van Dulmen, M.H. Regression models for count data: Illustrations using longitudinal predictors of childhood injury. J. Pediatric Psychol 2008, 33, 1076–1084. [Google Scholar] [CrossRef] [PubMed] [Green Version]
  125. Vlachos, I.S.; Zagganas, K.; Paraskevopoulou, M.D.; Georgakilas, G.; Karagkouni, D.; Vergoulis, T.; Dalamagas, T.; Hatzigeorgiou, A.G. DIANA-miRPath v3.0: Deciphering microRNA function with experimental support. Nucleic Acids Res. 2015, 43, W460–W466. [Google Scholar] [CrossRef]
  126. Fan, Y.; Xia, J. miRNet-Functional Analysis and Visual Exploration of miRNA-Target Interactions in a Network Context. Methods Mol. Biol. 2018, 1819, 215–233. [Google Scholar] [PubMed]
  127. White, J.R.; Nagarajan, N.; Pop, M. Statistical methods for detecting differentially abundant features in clinical metagenomic samples. PLoS Comput. Biol. 2009, 5, e1000352. [Google Scholar] [CrossRef]
  128. Parks, D.H.; Tyson, G.W.; Hugenholtz, P.; Beiko, R.G. STAMP: Statistical analysis of taxonomic and functional profiles. Bioinformatics 2014, 30, 3123–3124. [Google Scholar] [CrossRef] [Green Version]
  129. Parks, D.H.; Beiko, R.G. Identifying biologically relevant differences between metagenomic communities. Bioinformatics 2010, 26, 715–721. [Google Scholar] [CrossRef] [Green Version]
  130. Cliff, N. Dominance statistics: Ordinal analyses to answer ordinal questions. Psychol. Bull. 1993, 114, 494–509. [Google Scholar] [CrossRef]
  131. Cliff, N. Answering Ordinal Questions with Ordinal Data Using Ordinal Statistics. Multivar. Behav. Res. 1996, 31, 331–350. [Google Scholar] [CrossRef]
  132. Macbeth, G.; Razumiejczyk, E.; Ledesma, R.D.U. Cliff’s Delta Calculator: A non-parametric effect size program for two groups of observations. Univ. Psychol. 2011, 10, 545–555. [Google Scholar] [CrossRef]
  133. Kotrlik, J.; Williams, H.; Jabor, K. Reporting and Interpreting Effect Size in Quantitative Agricultural Education Research. J. Agric. Educ. 2011, 52, 132–142. [Google Scholar] [CrossRef]
Figure 1. Heat-map of differentially expressed (DE)-miRNAs in saliva of Autistic Spectrum Disorder (ASD) and neurologically unaffected control (NUC) individuals. Heat-map of the miRNAs differentially expressed in saliva of ASD and NUC patients. The values of fold changes for each miRNA are color coded, as shown in the colored bar. The matrix was generated by plotting the fold changes calculated as the ratio between the normalized counts of each sample and the mean of normalized counts of all NUC samples. Sample clustering obtained through hierarchical clustering (Manhattan distance metric) approach is shown.
Ijms 21 06203 g001
Figure 2. Expression validation of the 5 candidate salivary miRNAs. Violin plots of relative expression of the 5 miRNAs showing a statistically significant dysregulation in the validation group, assessed by Single TaqMan Assays: miR-29a-3p, miR-141-3p, miR-16-5p, let-7b-5p, and miR-451a. The black dots represent the samples; the dashed red line represents the median value; the dashed black line represents the quartiles.
Ijms 21 06203 g002
Figure 3. Bacterial community structures of the salivary microbiome in children with ASD and NUC groups. (A) Structural comparison of α-diversity of the salivary microbiome. Sequences were randomly subsampled at the rarefaction point (74,469) from dataset. Chao-1 index (a, community richness), Shannon H index (b, diversity), Shannon E index (c, evenness) were calculated for saliva samples. The bars depict mean ± SD of relative abundance rates. NS, p > 0.05. ASD (salivary samples n = 53), NUC (salivary samples collected from healthy controls, n = 27). (B) β-diversity. PCoA plot generated using weighted UniFrac distances shows none differences between the two groups (ASD in red and NUC in blue).
Ijms 21 06203 g003
Figure 4. Different bacterial abundance in saliva of ASD and NUC groups. Statistical analysis of the bacterial abundance at genus (A) and species level (B) in ASD and NUC groups by applying a two-sided White’s non-parametric t-test.
Ijms 21 06203 g004
Figure 5. Correlation analysis of miRNA expression, microbiome Operational taxonomic Units (OTUs), neuropsychiatric/metabolic parameters in saliva. Correlation matrices built by calculating spearman correlation coefficients for (A) miRNA expression and neuropsychiatric/metabolic parameters; (B) microbiome OTUs and neuropsychiatric/metabolic parameters; and (C) microbiome OTUs and miRNA expression. The correlation coefficient is indicated by a color gradient from green (negative correlation) to red (positive correlation), as shown in the colored bar. Statistically significant p-values corrected for multiple comparisons by using Bonferroni–Šídák approach are indicated by asterisks. VIQ: Verbal Intelligence Quotient; PIQ: performance Intelligence Quotient, TIQ: Total Intelligence Quotient; ADOS-A: Communication; ADOS-B: Social Interaction; ADOS-C: Imagination; ADOS-D: Repetitive and Restricted Behavior; ADI-A: Qualitative anomalies in social interaction; ADI-B: Qualitative anomalies in communication; ADI-C: Repetitive and restricted behavior; ADI-D: Anomalies in neurodevelopment arisen before 36 months old.
Ijms 21 06203 g005
Figure 6. Negative binomial regression analysis between miRNA expression, neuropsychiatric/metabolic parameters and microbiome abundance. Coefficient regression matrix from negative binomial regression model predicting abundances of microbiome species. The regression coefficient is indicated by a color gradient from green (negative prediction) to red (positive prediction), as shown in the colored bar. Statistically significant p-values are indicated by asterisks.
Ijms 21 06203 g006
Figure 7. Functional Enrichment analysis of DE miRNAs. Functional enrichment analysis of miRNA targets within KEGG (Kyoto Encyclopedia of Genes and Genomes) pathways (A) and Reactome database (B) by DIANA-mirPath v.3 web server and miRNet tool, respectively.
Ijms 21 06203 g007
Table 1. Demographic, neuropsychological, and hematological characteristics of the clinical samples.
ASDNUC
Number of Participants7639
Sex (M:F)60:1628:11
Age (years)6.9 (±1.5)6.9 (±1.8)
Time of collection (h)09:58 (±00:28)10:03 (±00:30)
Time since last meal (h)2.99 (±0.12)2.98 (±0.13)
IQ
TIQ69.6 (±19.3)96.7 (±11.6)
VIQ67.8 (±19.7)96.2 (±13.3)
PIQ71 (±21.4)97.9 (±12.7)
ADOS
A4.6 (±1.9)0
B7.7 (±2.4)0
C2.1 (±1.2)0
D2.6 (±1.3)0
ADI-R
A10.9 (±3.7)0
B9.4 (±2.5)0
C5.9 (±2.8)0
D3.2 (±1.3)0
Prolactine229.8 (±89.5)/
Ceruloplasmin27.6 (±5.6)/
Lactate15.3 (±4.8)/
Ammonium24.7 (±9.3)/
TSH2.3 (±0.9)/
Data are shown as means and ± standard deviations between brackets. IQ: Intelligence Quotient; TIQ: Total Intelligence Quotient; VIQ: Verbal Intelligence Quotient; PIQ: Performance Intelligence Quotient; ADOS: Autism Diagnostic Observation Schedule; ADOS-A: Communication; ADOS-B: Social Interaction; ADOS-C: Imagination; ADOS-D: Repetitive and Restricted Behavior; ADI-R: Autism Diagnostic Interview-Revised; ADI-A: Qualitative anomalies in social interaction; ADI-B: Qualitative anomalies in communication; ADI-C: Repetitive and restricted behavior; ADI-D: Anomalies in neurodevelopment arisen before 36 months old; TSH: Thyroid stimulant hormone. According to two-tailed Mann–Whitney U test, there were no statistically significant differences between groups in sex (p = 0.3496), age (p = 0.6731), time of sample collection (p = 0.2008), and time since last meal (p = 0.4456).
Table 2. Validation analysis of miRNA expression in saliva.
DE miRNA ASD vs. NUCFCMann–Whitney Test p-Value
let-7b-5p−1.990.0002
miR-16-5p−1.680.0002
miR-29a-3p1.430.0123
miR-141-3p2.930.0431
miR-451a−3.58<0.0001

