Tumor Necrosis Factor α Influences Phenotypic Plasticity and Promotes Epigenetic Changes in Human Basal Forebrain Cholinergic Neuroblasts


 , ,
, , 
Abstract
1. Introduction
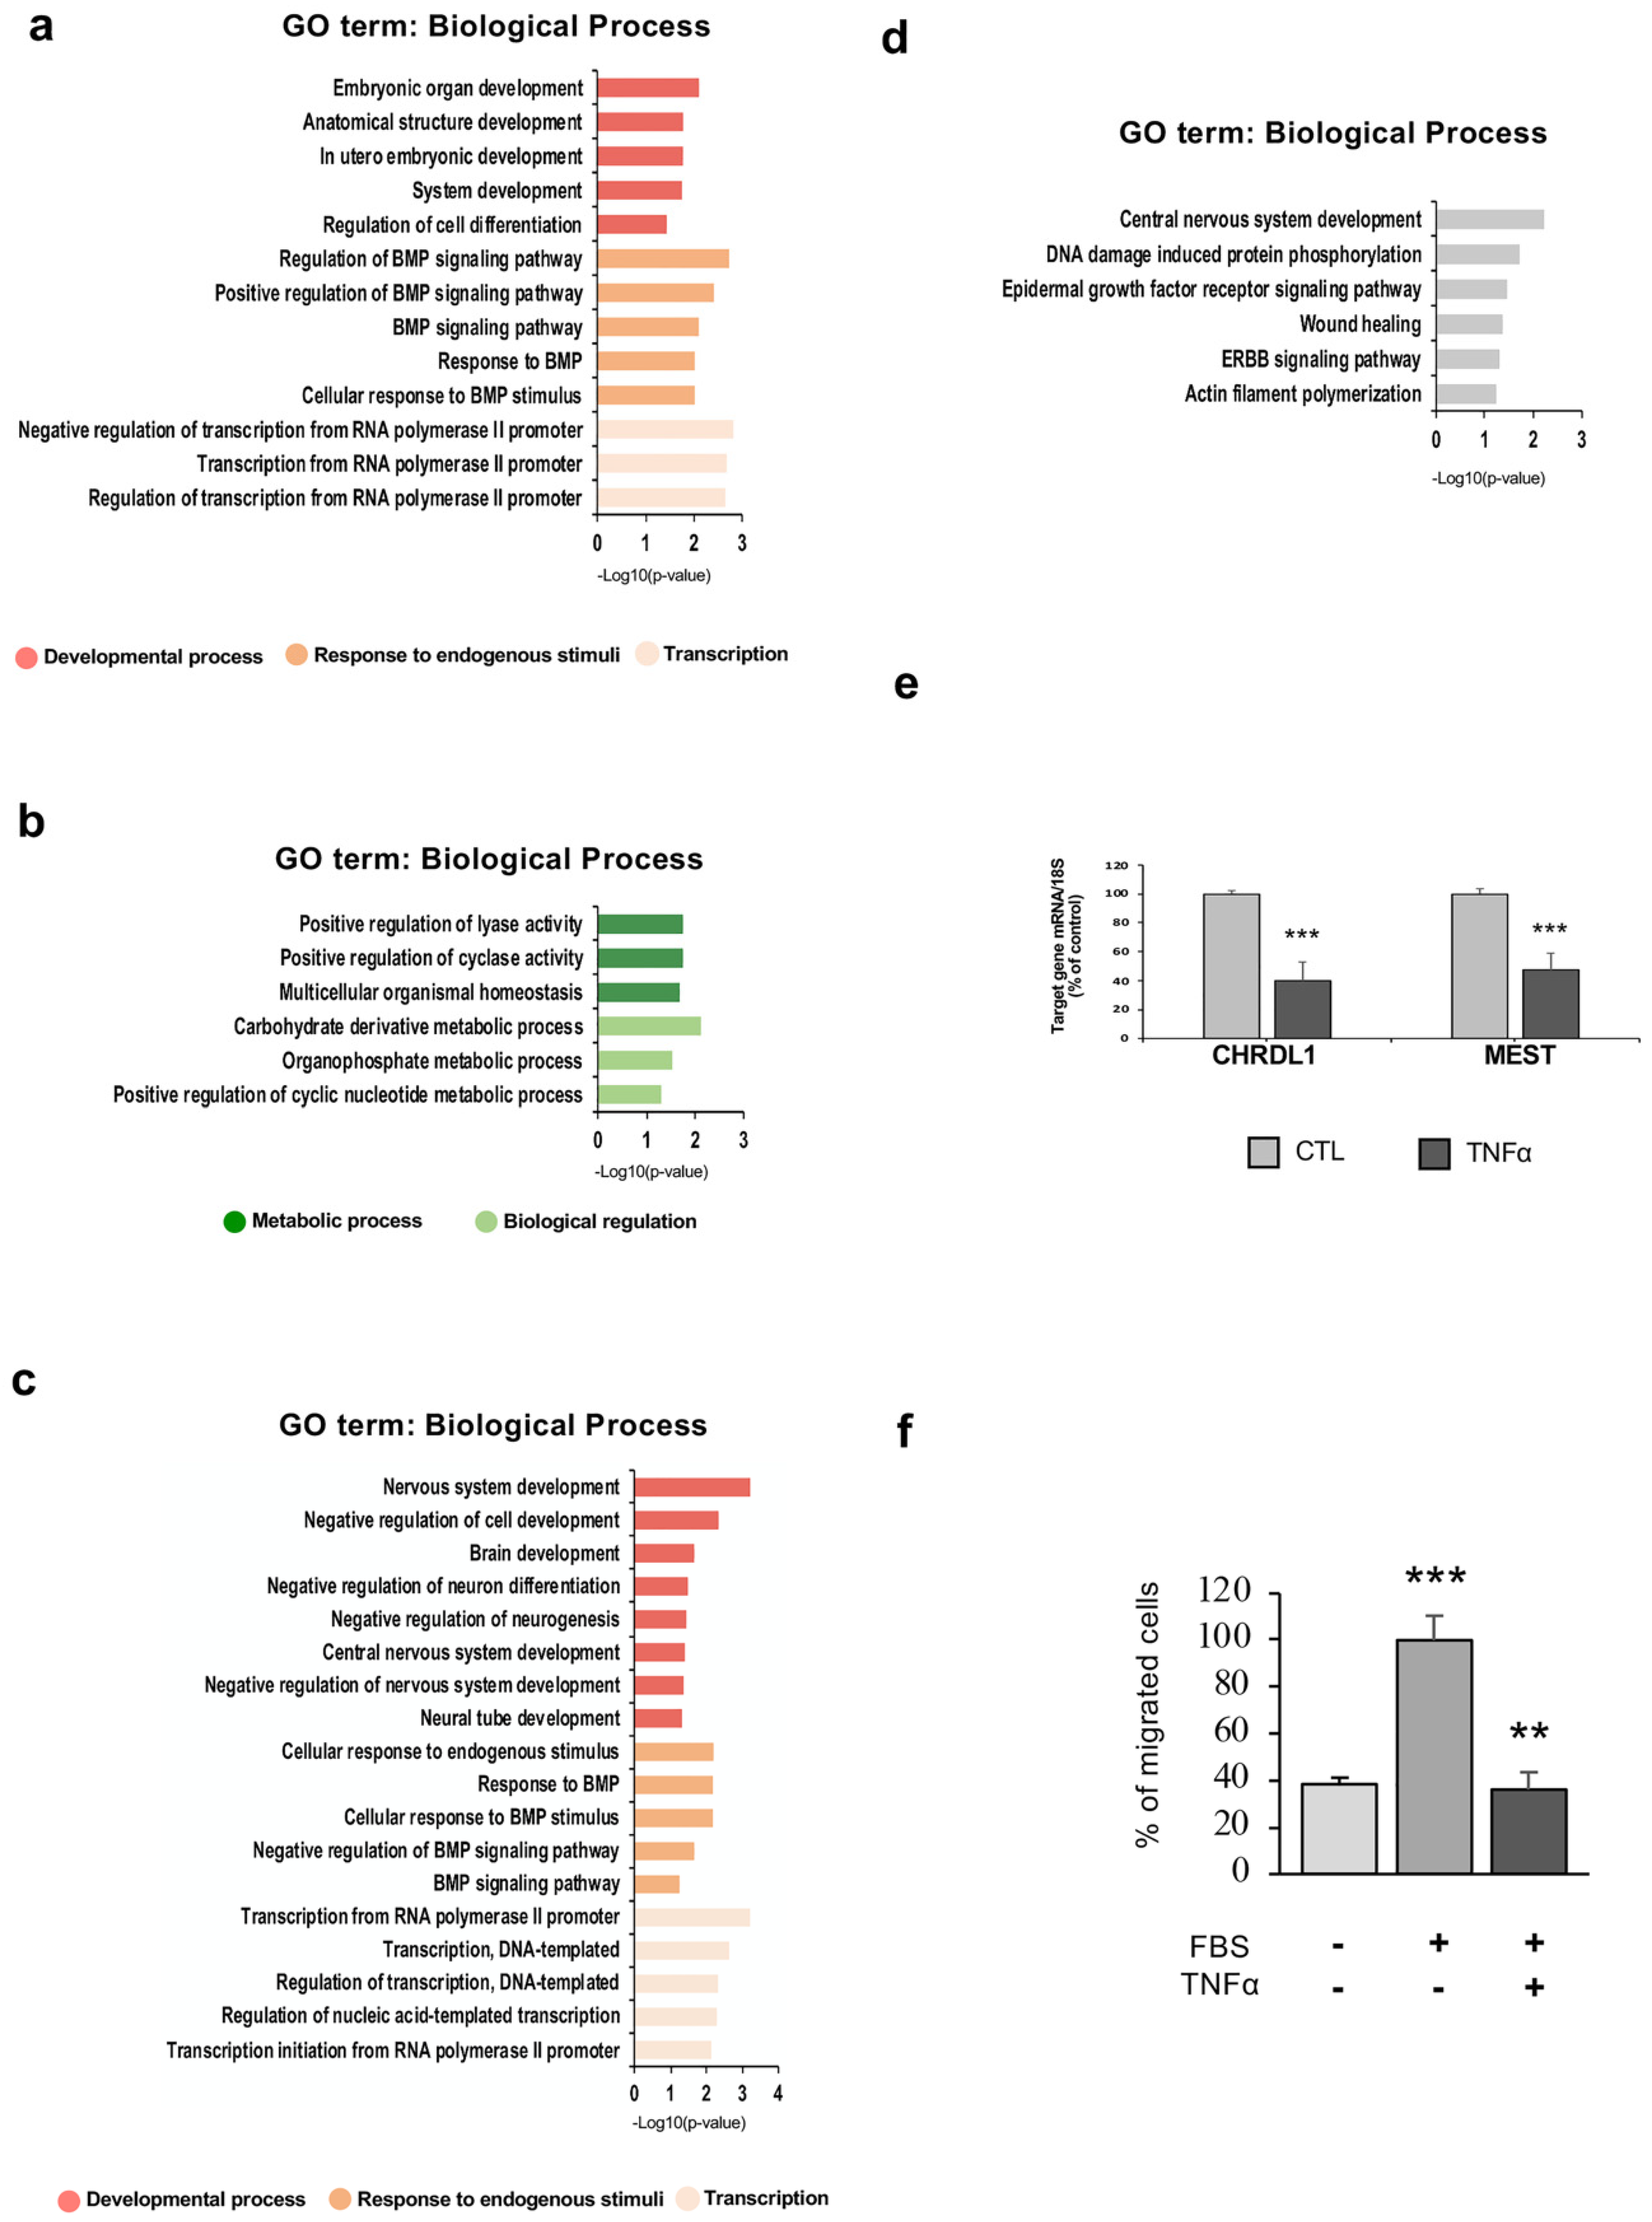
2. Results
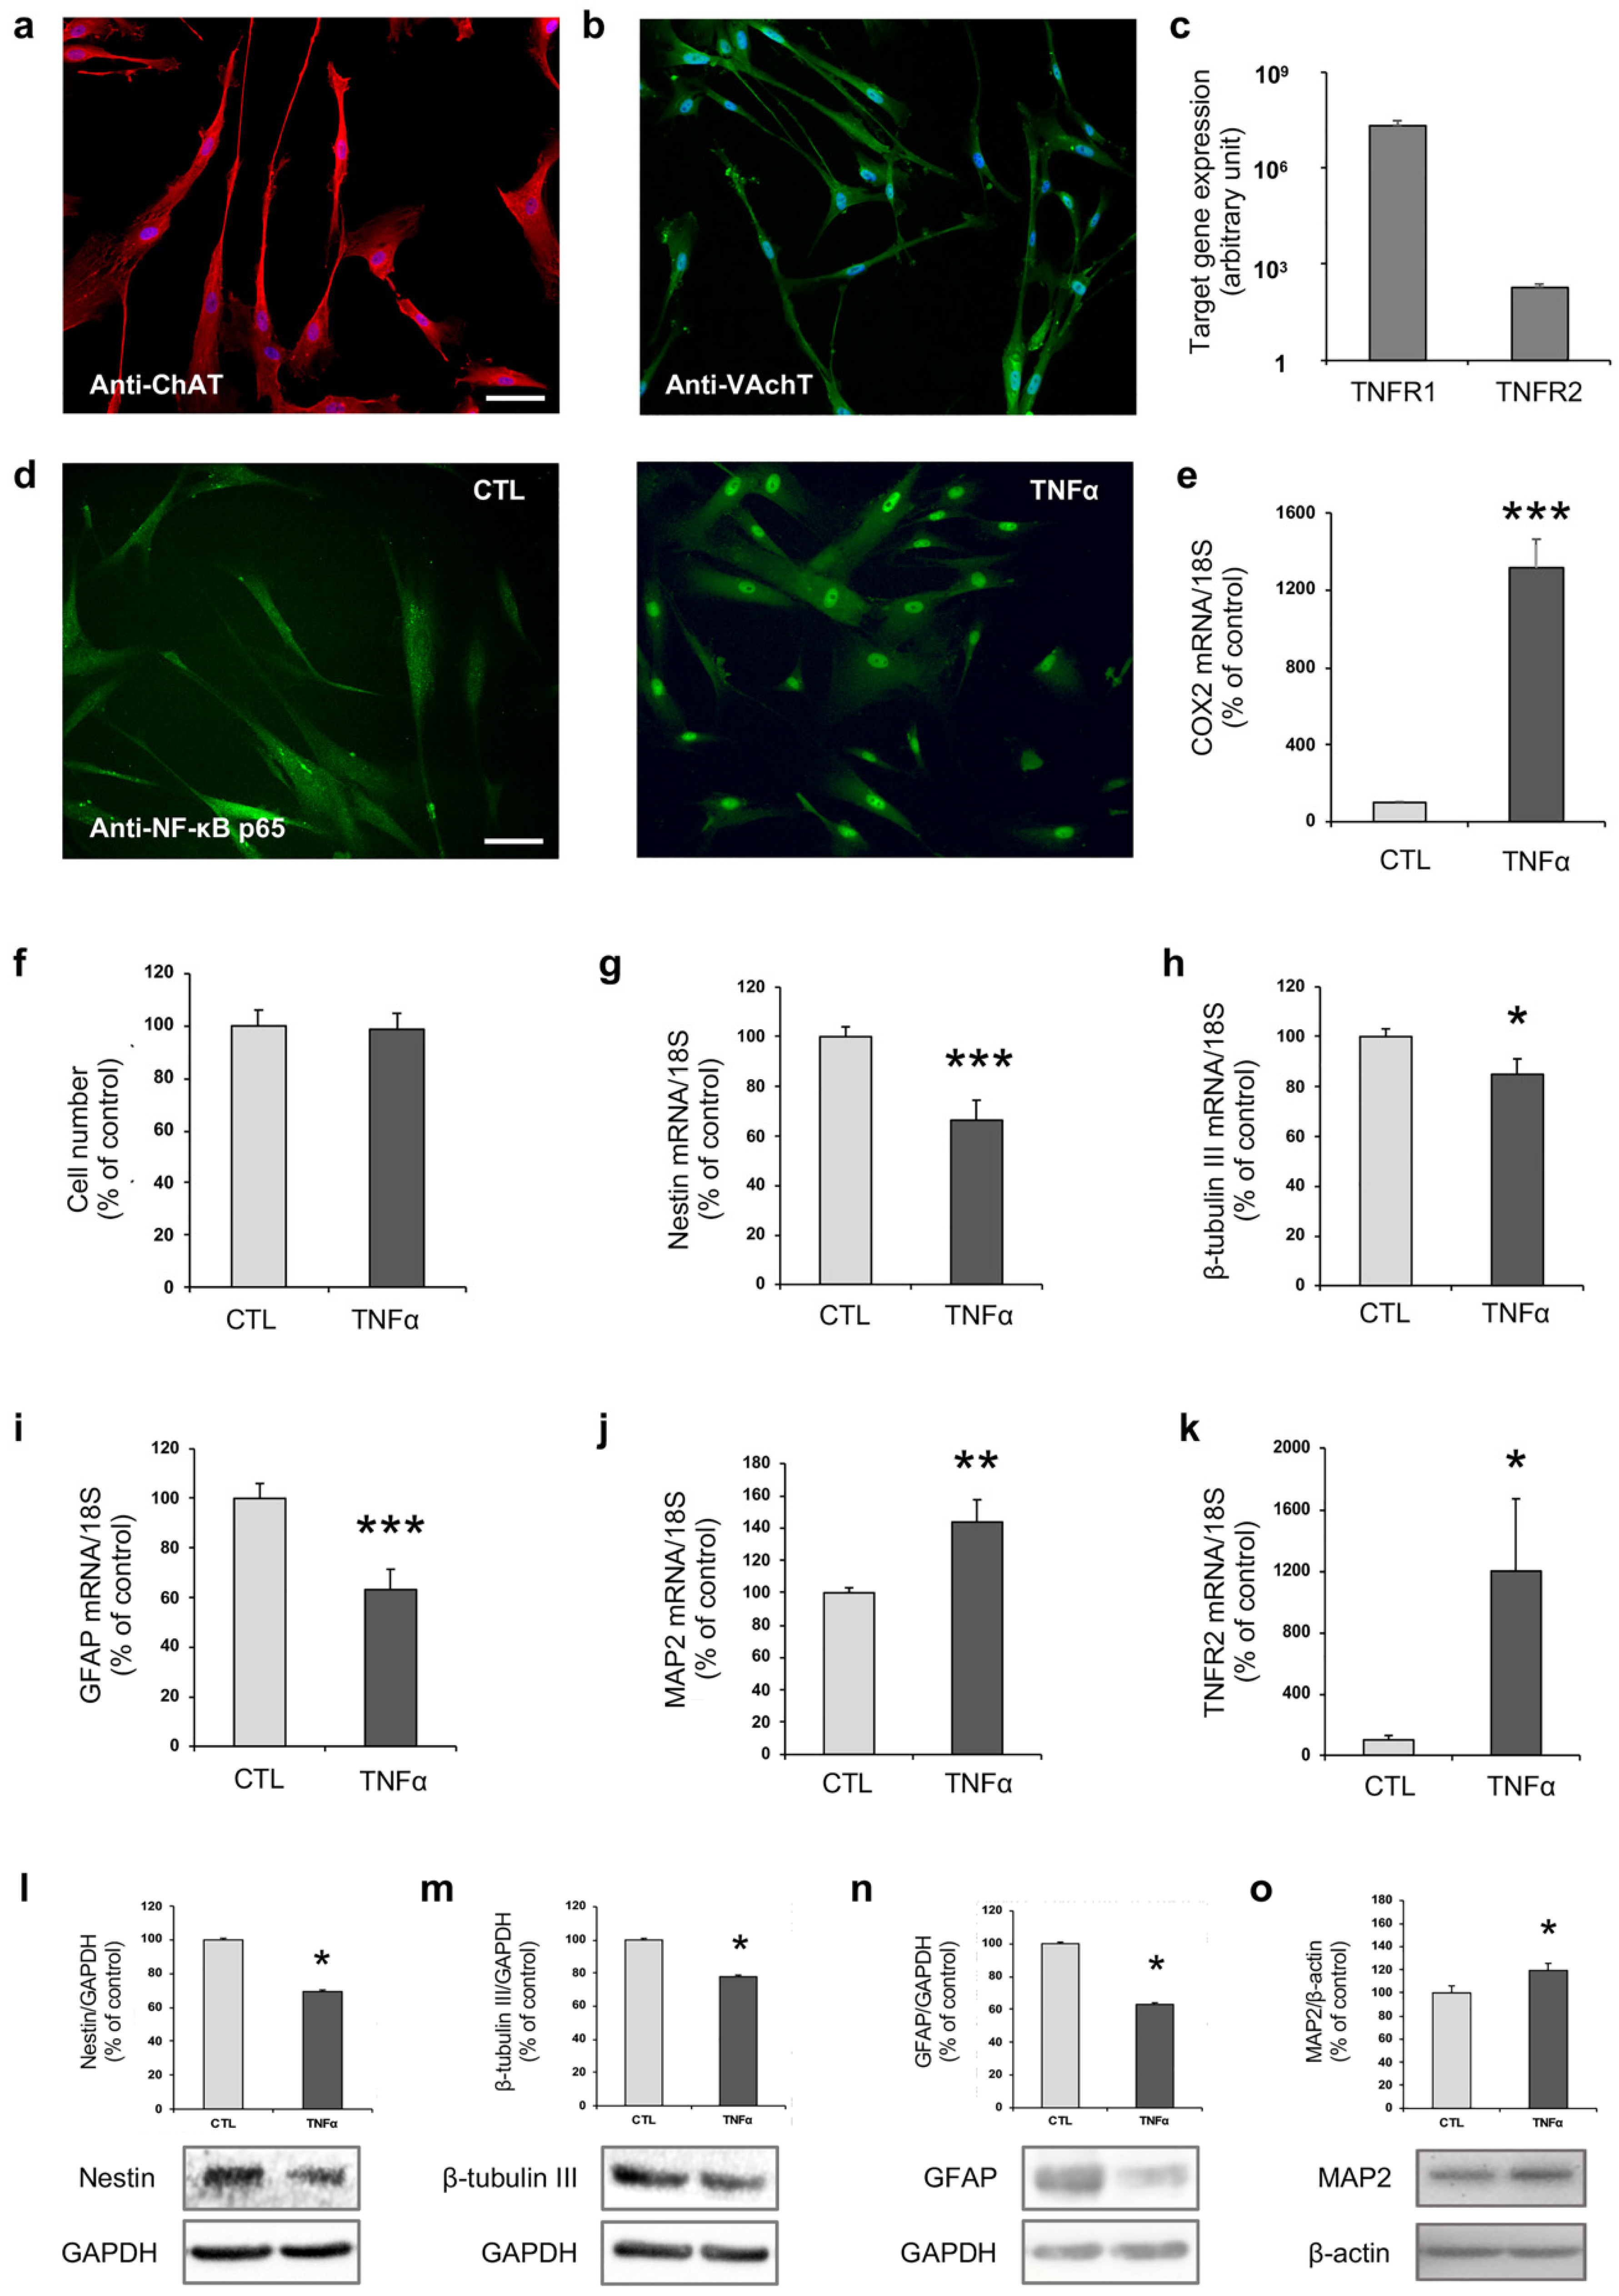
2.1. TNFα Affects hfNBM Cell Phenotype
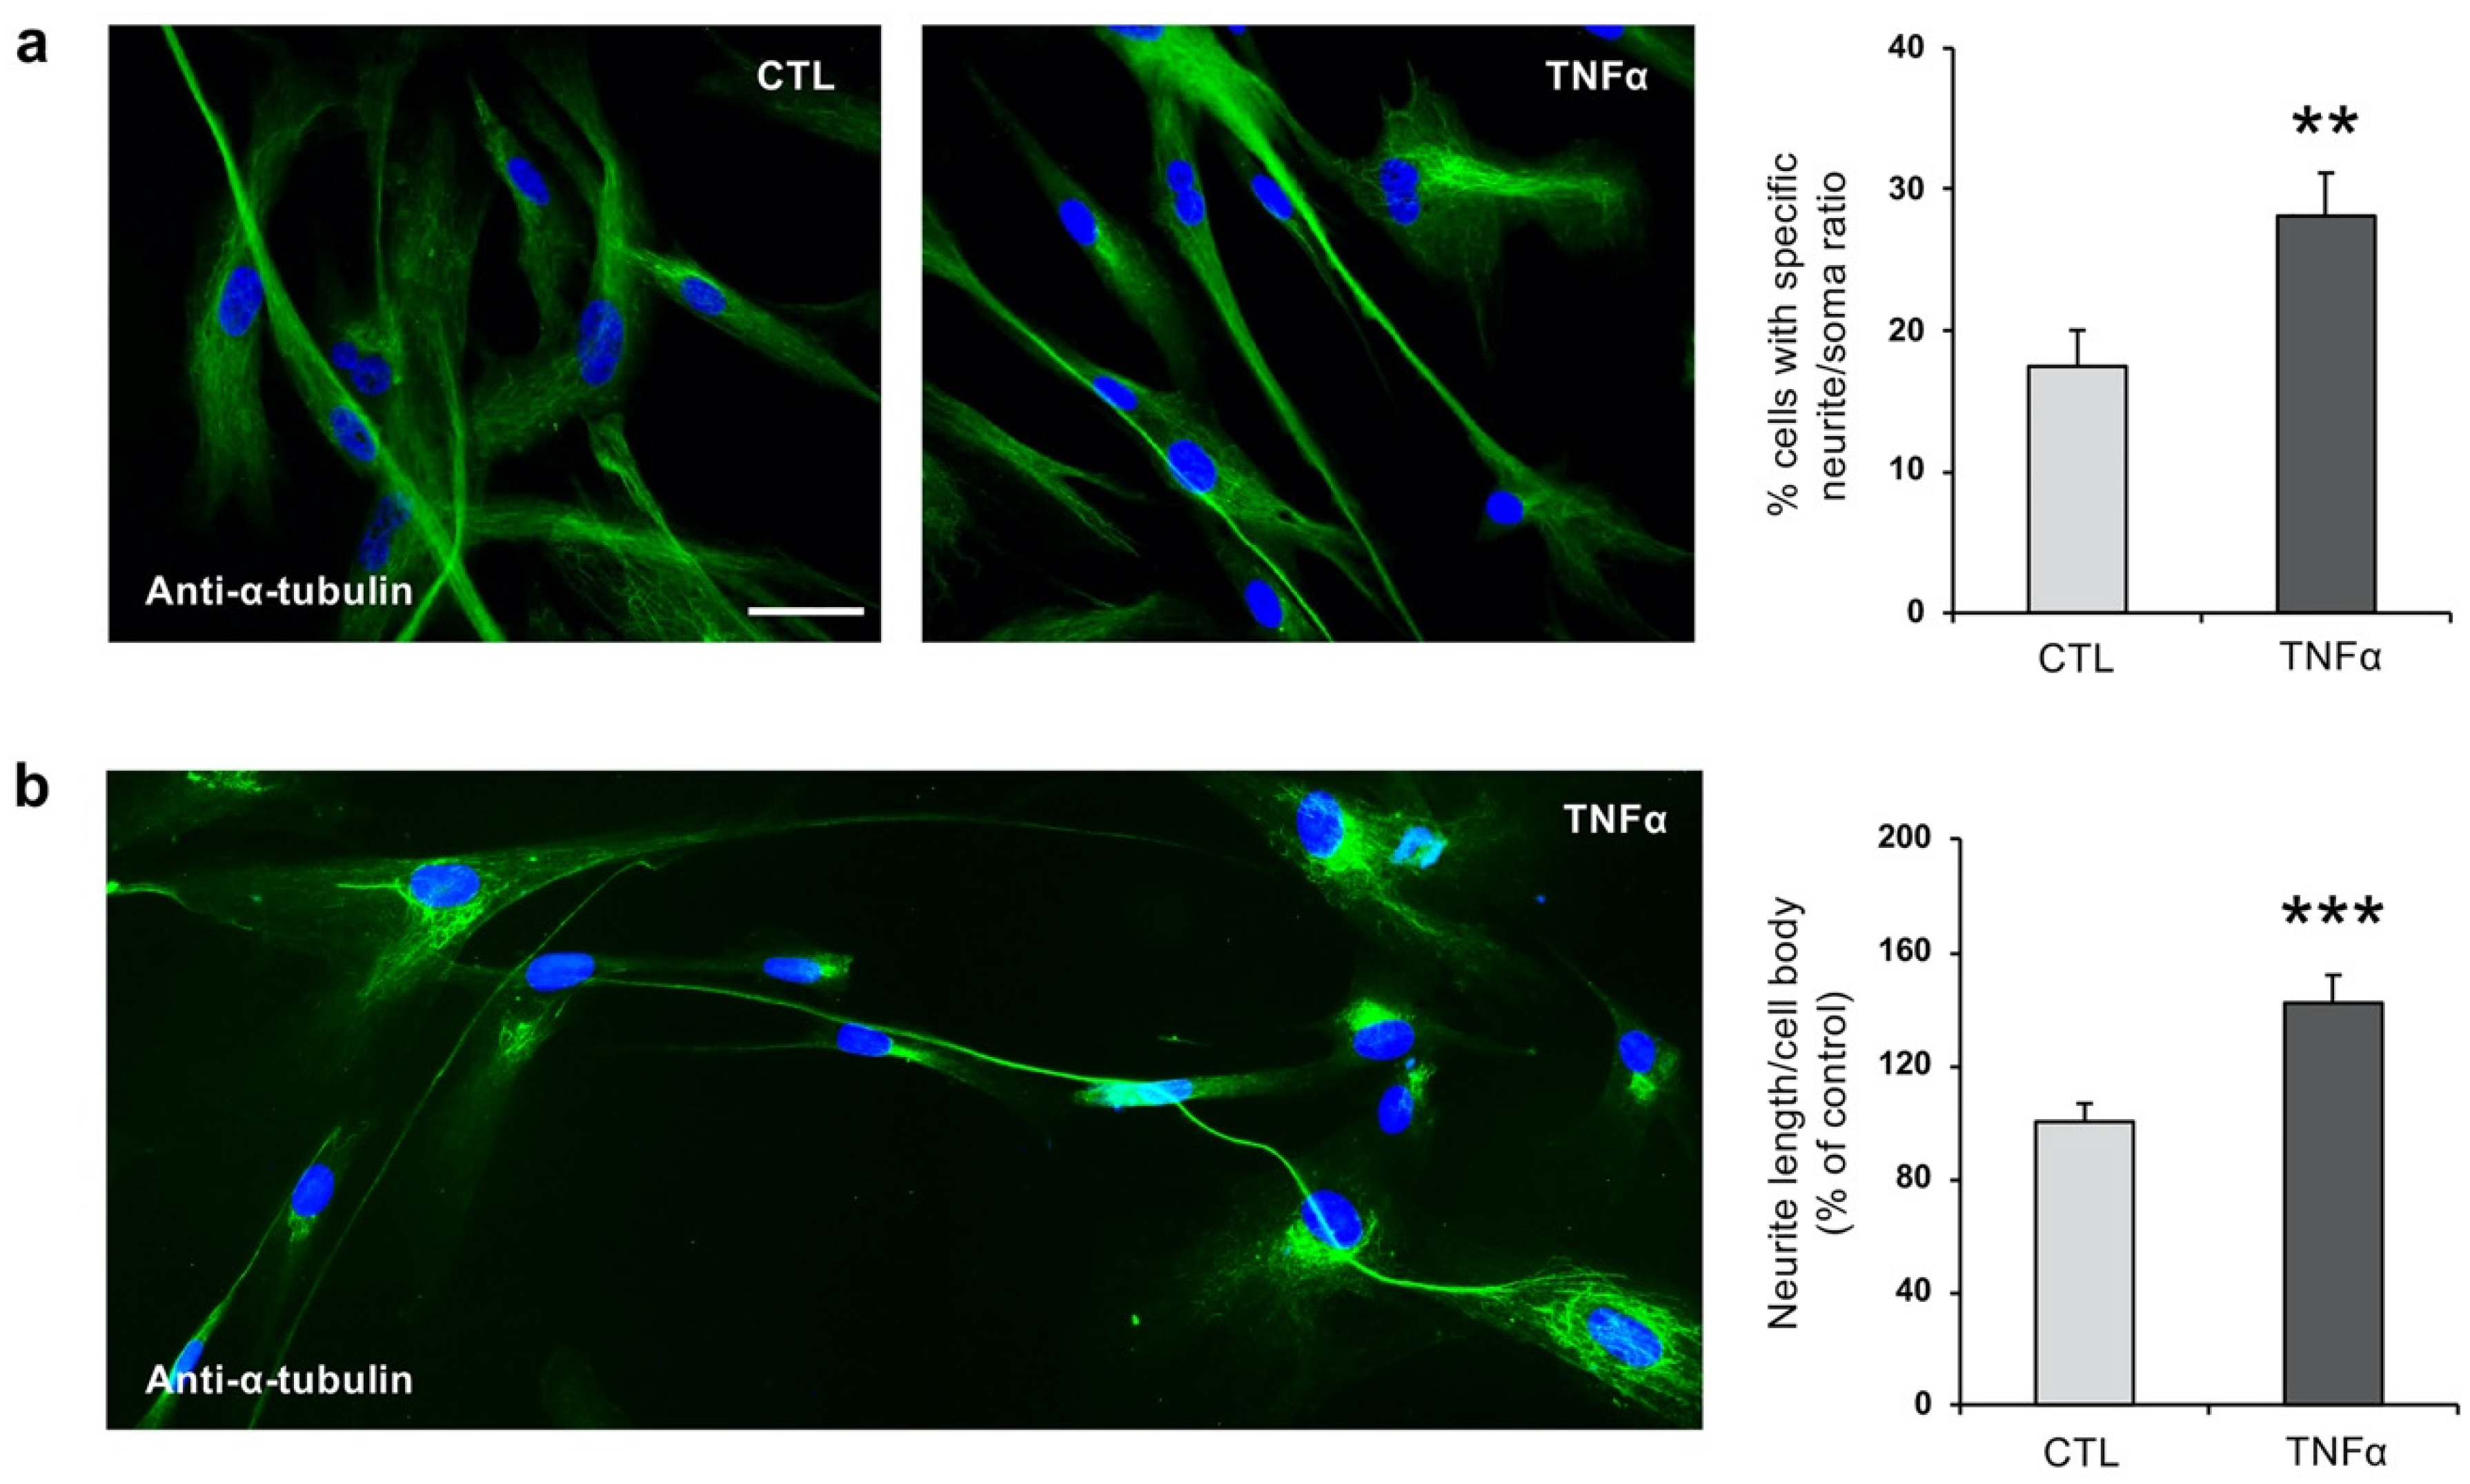
2.2. TNFα Impairs Ciliogenesis in hfNBMs
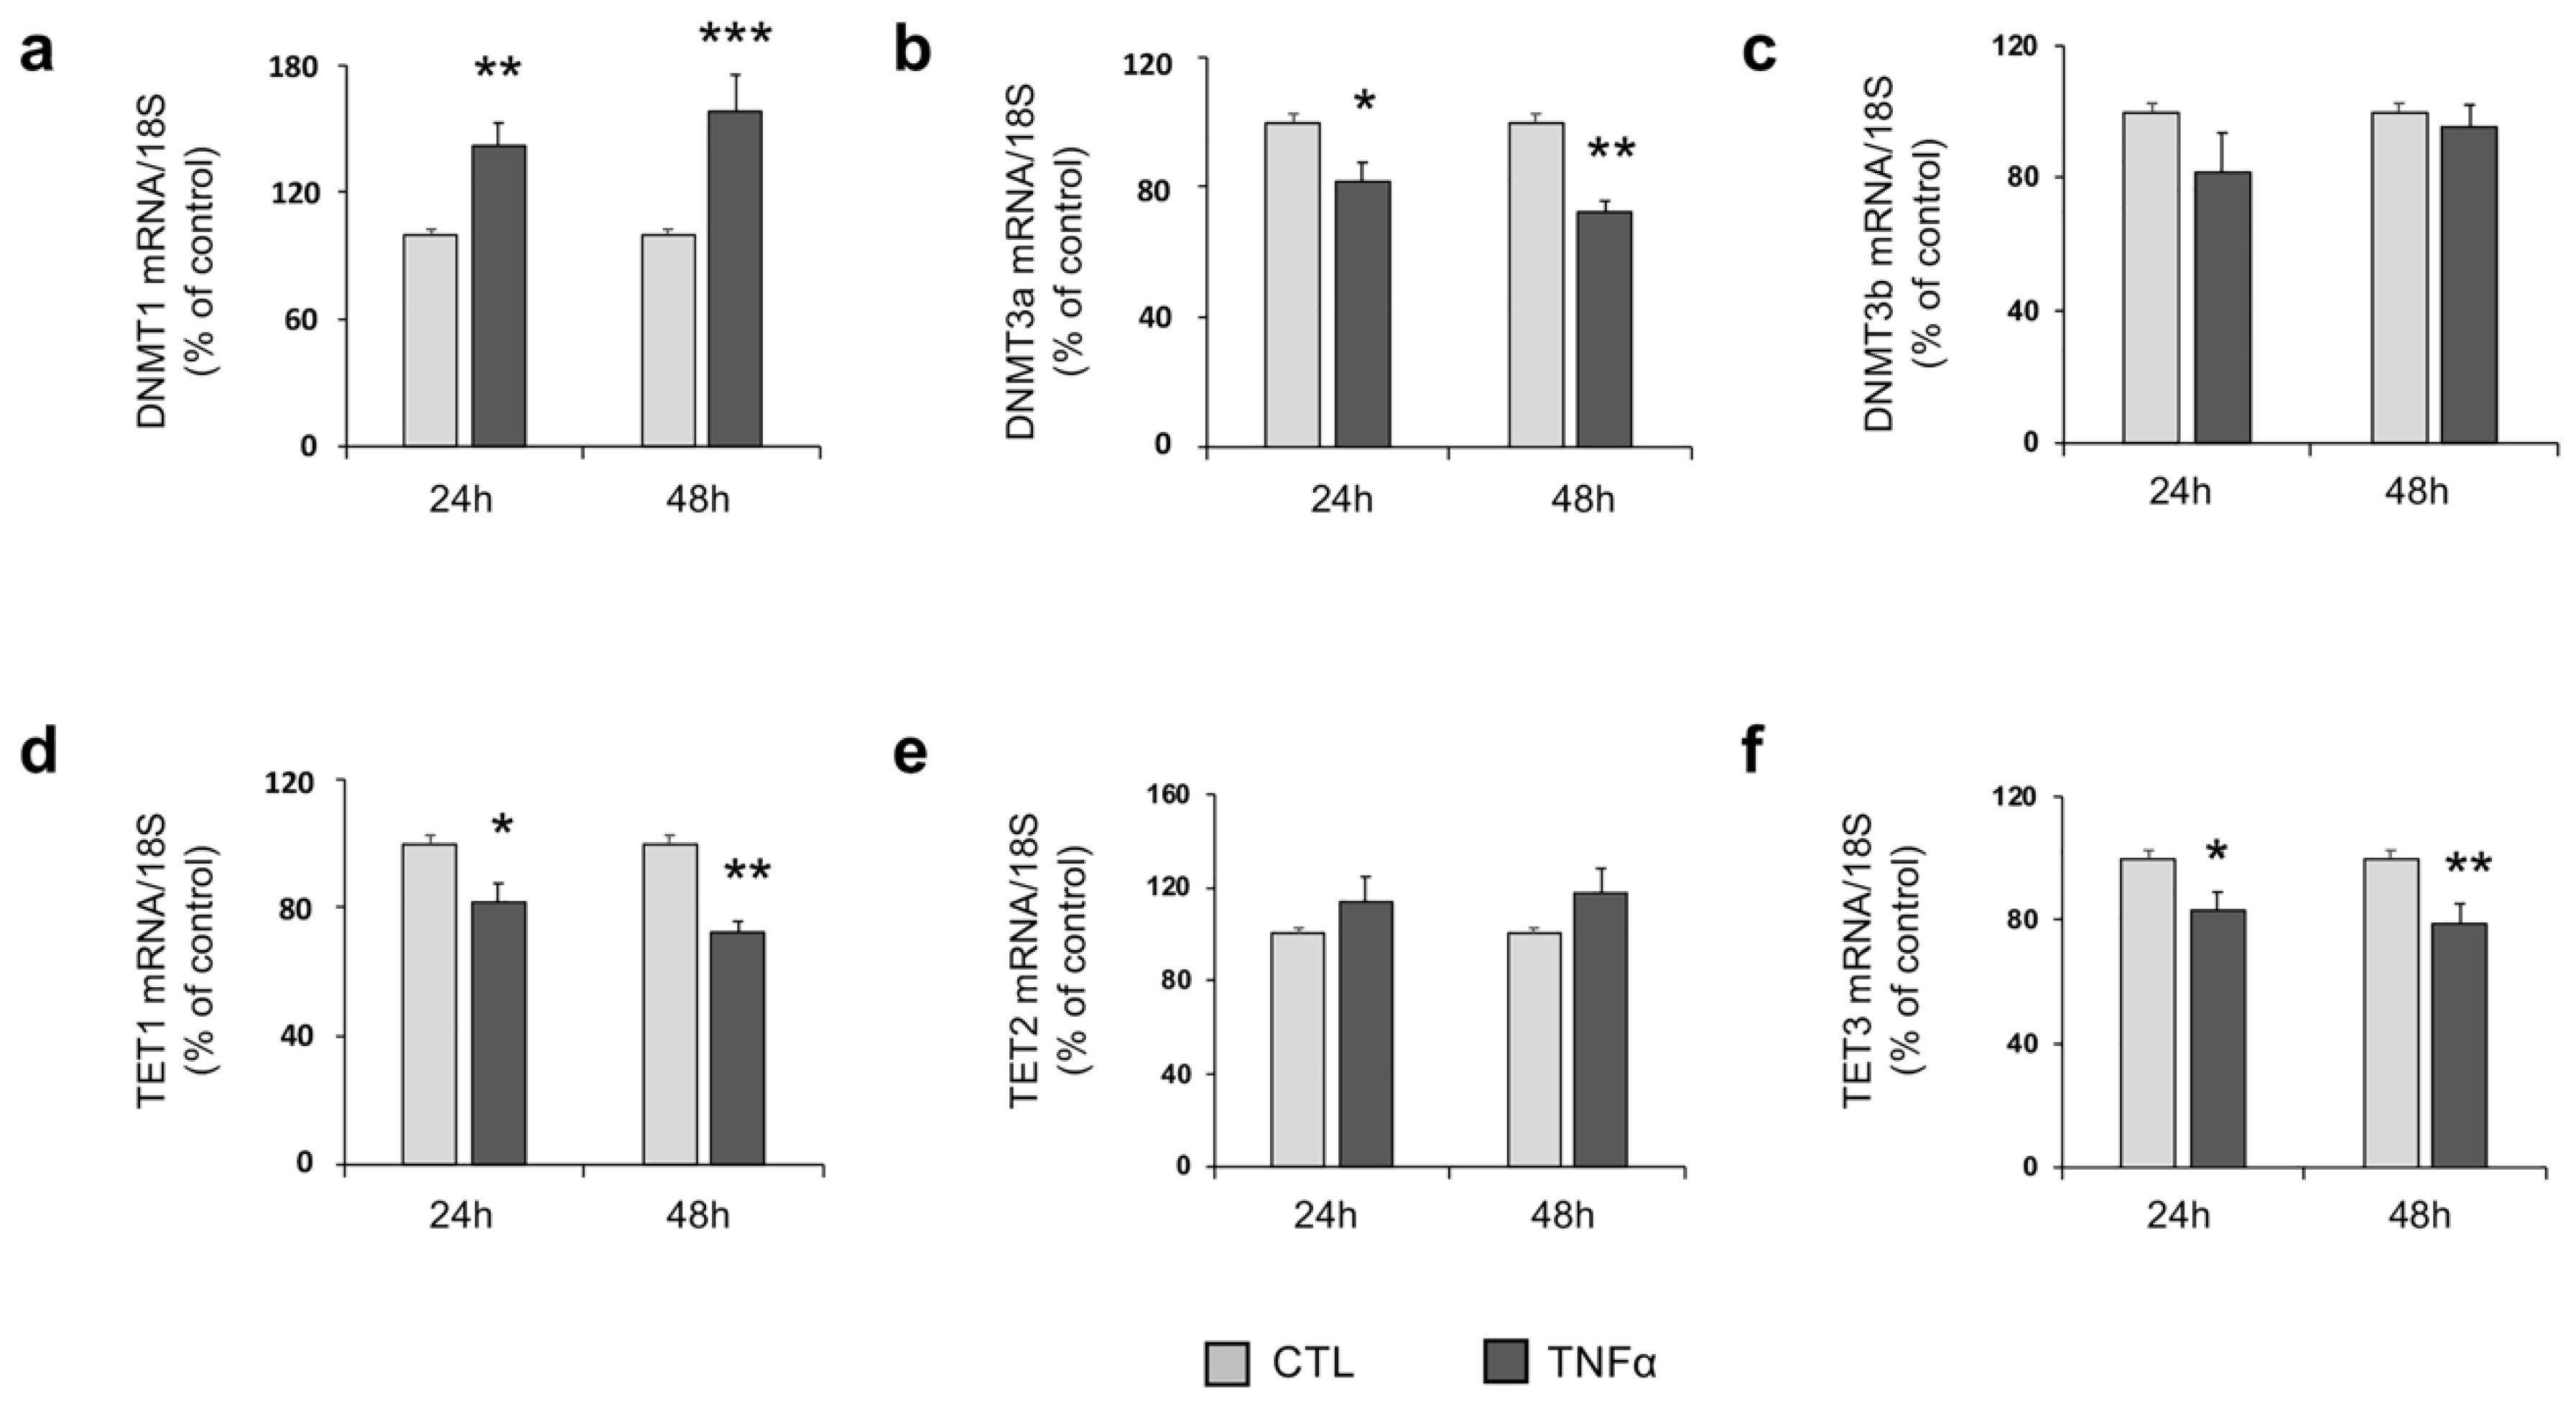
2.3. TNFα Modulates the Expression of Enzymes Involved in DNA Methylation
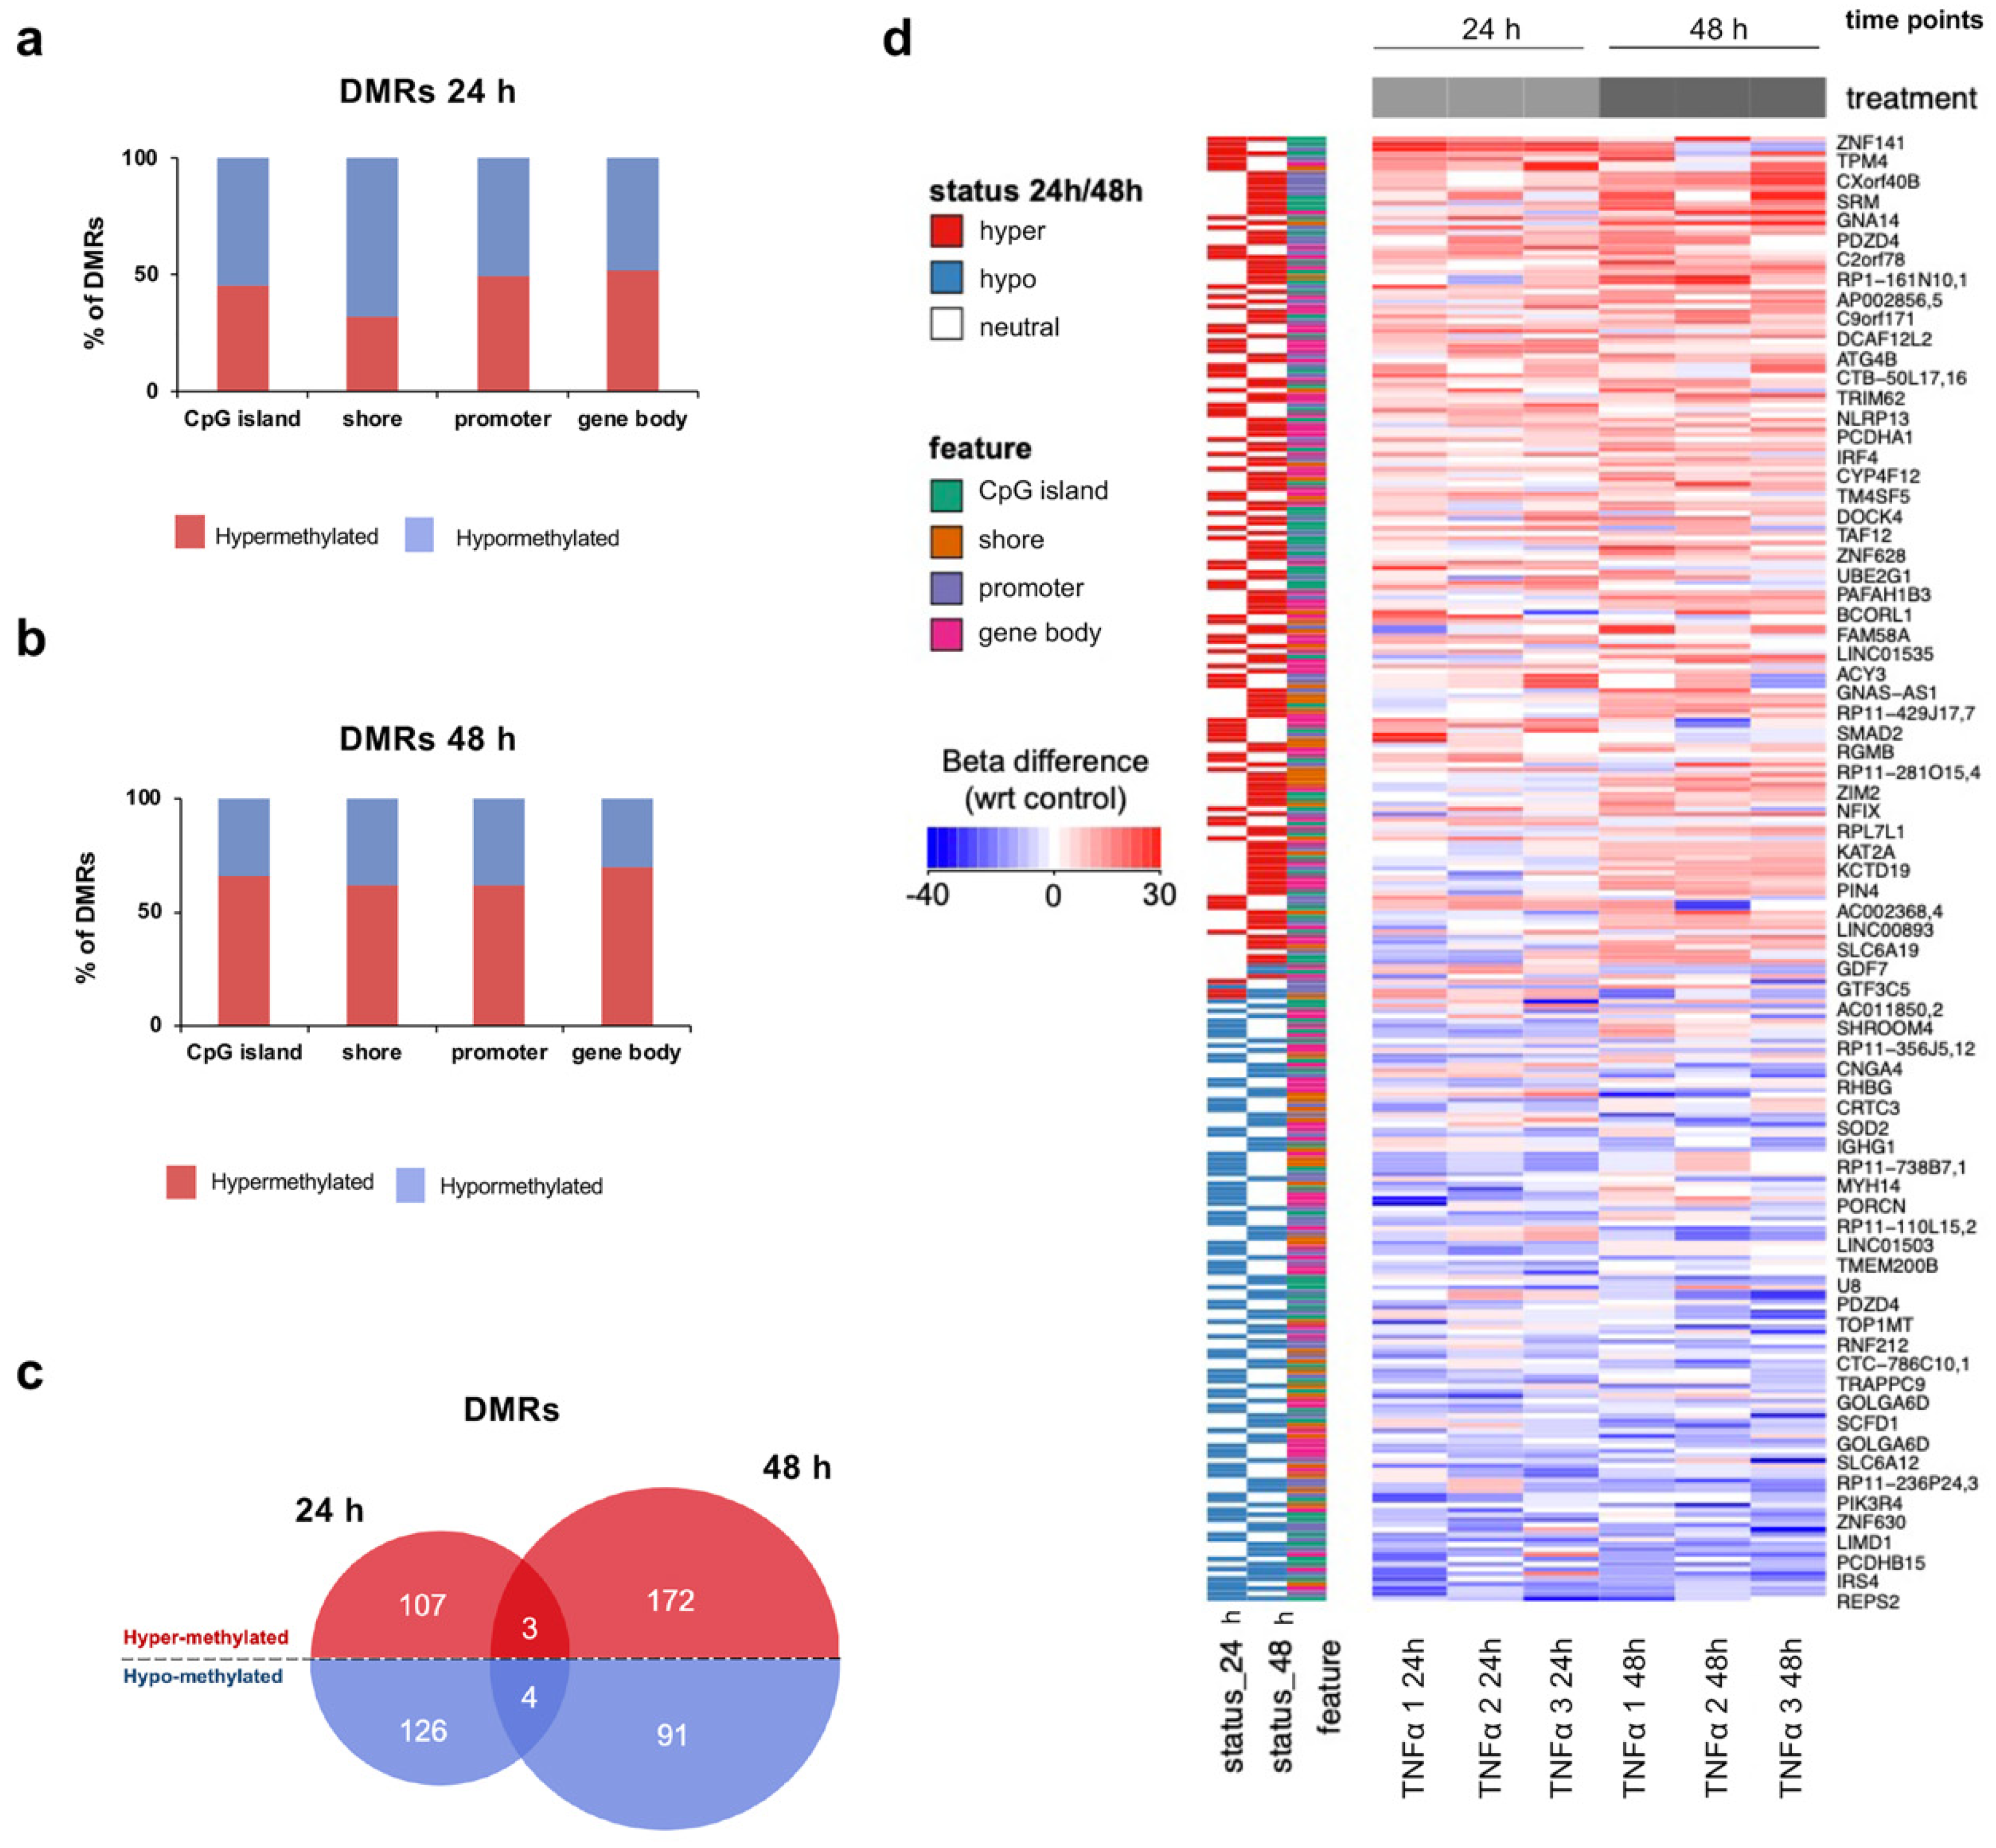
2.4. TNFα Changes DNA Methylation of Target Regulatory Elements in hfNBMs
2.5. TNFα Exposure Changes DNA Methylation of Nervous System Development-Related Genes
2.6. Hypermethylation of Genes Involved in Nervous System Development and Migration are Associated with a Reduced mRNA Expression After Inflammatory Exposure
2.7. hfNBM Cell Migration is Inhibited by TNFα Stimulation
3. Discussion
4. Conclusions
5. Materials and Methods
5.1. hfNBM Cell Culture
5.2. Drugs and Antibodies
5.3. Immunofluorescence
5.4. MTT Assay
5.5. RNA Extraction and Quantitative RT-PCR Analysis
5.6. Western Blot Analysis
5.7. Flow Cytometry
5.8. DNA Extraction and Reduced Representation Bisulfite Sequencing (RRBS) Library Preparation
5.9. DNA Methylation Data Processing
5.10. Methylation-Sensitive Restriction Analysis
5.11. Migration Assay
5.12. Statistical Analysis
Supplementary Materials
Author Contributions
Funding
Acknowledgments
Conflicts of Interest
Abbreviations
| hfNBMs | human fetal nucleus basalis of Meynert cells |
| TNFα | tumor necrosis factor α |
| CNS | central nervous system |
| ChAT | choline acetyltransferase |
| VAchT | vesicular acetylcholine transporter |
| COX2 | cyclooxygenase 2 |
| GFAP | glial fibrillary acidic protein |
| AD | Alzheimer’s disease |
| PD | Parkinson’s disease |
| BFCNs | basal forebrain cholinergic neurons |
| NBM | nucleus basalis of Meynert |
| NGF | nerve growth factor |
| IFT88 | intraflagellar Transport 88 |
| TrkA | tropomyosin receptor kinase A |
| p75 NTR | neurotrophin Receptor p75 |
| CALB1 | calbindin 1 |
| qRT-PCR | quantitative real time RT-PCR |
| PBS | phosphate buffered saline |
| FBS | fetal bovine serum |
| RRBS | reduced representation bisulfite sequencing |
| UMIs | unique molecular identifiers |
| DMRs | differentially methylated regions |
| GO | Gene Ontology |
References
- Fuster-Matanzo, A.; Llorens-Martín, M.; Hernández, F.; Avila, J. Role of neuroinflammation in adult neurogenesis and alzheimer disease: Therapeutic approaches. Mediat. Inflamm. 2013, 2013, 1–9. [Google Scholar] [CrossRef] [PubMed]
- Engelhart, M.J.; Geerlings, M.I.; Meijer, J.; Kiliaan, A.; Ruitenberg, A.; van Swieten, J.C.; Stijnen, T.; Hofman, A.; Witteman, J.C.M.; Breteler, M.M.B. Inflammatory proteins in plasma and the risk of dementia: The Rotterdam study. Arch. Neurol. 2004, 61, 668. [Google Scholar] [CrossRef] [PubMed]
- Trenova, A.; Slavov, G.; Miteva, L.; Manova, M.; Stanilova, S. Immunological aspects of cognitive functioning: Highlights on the role of the cytokines. Trakia J. Sci. 2016, 14, 391–397. [Google Scholar] [CrossRef]
- Zhao, J.; Bi, W.; Xiao, S.; Lan, X.; Cheng, X.; Zhang, J.; Lu, D.; Wei, W.; Wang, Y.; Li, H.; et al. Neuroinflammation induced by lipopolysaccharide causes cognitive impairment in mice. Sci. Rep. 2019, 9, 5790. [Google Scholar] [CrossRef]
- Chang, R.; Knox, J.; Chang, J.; Derbedrossian, A.; Vasilevko, V.; Cribbs, D.; Boado, R.J.; Pardridge, W.M.; Sumbria, R.K. Blood–brain barrier penetrating biologic TNF-α inhibitor for Alzheimer’s disease. Mol. Pharm. 2017, 14, 2340–2349. [Google Scholar] [CrossRef]
- Chang, R.; Yee, K.-L.; Sumbria, R.K. Tumor necrosis factor α inhibition for Alzheimer’s disease. J. Cent. Nerv. Syst. Dis. 2017, 9. [Google Scholar] [CrossRef]
- Côté, S.; Carmichael, P.-H.; Verreault, R.; Lindsay, J.; Lefebvre, J.; Laurin, D. Nonsteroidal anti-inflammatory drug use and the risk of cognitive impairment and Alzheimer’s disease. Alzheimer Dement. 2012, 8, 219–226. [Google Scholar] [CrossRef]
- Ghassabian, A.; Albert, P.S.; Hornig, M.; Yeung, E.; Cherkerzian, S.; Goldstein, R.B.; Buka, S.L.; Goldstein, J.M.; Gilman, S.E. Gestational cytokine concentrations and neurocognitive development at 7 years. Transl. Psychiatry 2018, 8, 64. [Google Scholar] [CrossRef]
- Dong, Y.; Dekens, D.W.; De Deyn, P.P.; Naudé, P.J.W.; Eisel, U.L.M. Targeting of tumor necrosis factor alpha receptors as a therapeutic strategy for neurodegenerative disorders. Antibodies 2015, 4, 369–408. [Google Scholar] [CrossRef]
- Bell, M.J.; Hallenbeck, J.M.; Gallo, V. Determining the fetal inflammatory response in an experimental model of intrauterine inflammation in rats. Pediatr. Res. 2004, 56, 541–546. [Google Scholar] [CrossRef]
- Ben-Hur, T.; Ben-Menachem, O.; Furer, V.; Einstein, O.; Mizrachi-Kol, R.; Grigoriadis, N. Effects of proinflammatory cytokines on the growth, fate, and motility of multipotential neural precursor cells. Mol. Cell. Neurosci. 2003, 24, 623–631. [Google Scholar] [CrossRef]
- Liu, Y.-P.; Lin, H.-I.; Tzeng, S.-F. Tumor necrosis factor-α and interleukin-18 modulate neuronal cell fate in embryonic neural progenitor culture. Brain Res. 2005, 1054, 152–158. [Google Scholar] [CrossRef]
- Keohane, A.; Ryan, S.; Maloney, E.; Sullivan, A.M.; Nolan, Y.M. Tumour necrosis factor-α impairs neuronal differentiation but not proliferation of hippocampal neural precursor cells: Role of Hes1. Mol. Cell. Neurosci. 2010, 43, 127–135. [Google Scholar] [CrossRef]
- Cacci, E.; Claasen, J.-H.; Kokaia, Z. Microglia-derived tumor necrosis factor-α exaggerates death of newborn hippocampal progenitor cells in vitro. J. Neurosci. Res. 2005, 80, 789–797. [Google Scholar] [CrossRef] [PubMed]
- Wong, G.; Goldshmit, Y.; Turnley, A.M. Interferon-γ but not TNFα promotes neuronal differentiation and neurite outgrowth of murine adult neural stem cells. Exp. Neurol. 2004, 187, 171–177. [Google Scholar] [CrossRef] [PubMed]
- Johansson, S.; Price, J.; Modo, M. Effect of inflammatory cytokines on major histocompatibility complex expression and differentiation of human neural stem/progenitor cells. Stem Cells 2008, 26, 2444–2454. [Google Scholar] [CrossRef]
- Ferreira-Vieira, T.H.; Guimaraes, I.M.; Silva, F.R.; Ribeiro, F.M. Alzheimer’s disease: Targeting the cholinergic system. Curr. Neuropharmacol. 2016, 14, 101–115. [Google Scholar] [CrossRef]
- Kilimann, I.; Grothe, M.; Heinsen, H.; Alho, E.J.L.; Grinberg, L.; Amaro, E., Jr.; dos Santos, G.A.B.; da Silva, R.E.; Mitchell, A.J.; Frisoni, G.B.; et al. Subregional basal forebrain atrophy in Alzheimer’s disease: A multicenter study. J. Alzheimer Dis. 2014, 40, 687–700. [Google Scholar] [CrossRef]
- Schulz, J.; Pagano, G.; Fernández Bonfante, J.A.; Wilson, H.; Politis, M. Nucleus basalis of Meynert degeneration precedes and predicts cognitive impairment in Parkinson’s disease. Brain 2018, 141, 1501–1516. [Google Scholar] [CrossRef]
- Zassler, B.; Weis, C.; Humpel, C. Tumor necrosis factor-a triggers cell death of sensitized potassium chloride-stimulated cholinergic neurons. Mol. Brain Res. 2003, 113, 78–85. [Google Scholar] [CrossRef]
- Donzis, E.J.; Tronson, N.C. Modulation of learning and memory by cytokines: Signaling mechanisms and long term consequences. Neurobiol. Learn. Mem. 2014, 115, 68–77. [Google Scholar] [CrossRef] [PubMed]
- Ensoli, F.; Fiorelli, V.; Muratori, D.S.; De Cristofaro, M.; Vincenzi, L.; Topino, S.; Novi, A.; Luzi, G.; Sirianni, M.C. Immune-derived cytokines in the nervous system: Epigenetic instructive signals or neuropathogenic mediators? Crit. Rev. Immunol. 1999, 19, 97–116. [Google Scholar] [CrossRef]
- Kohyama, J.; Kojima, T.; Takatsuka, E.; Yamashita, T.; Namiki, J.; Hsieh, J.; Gage, F.H.; Namihira, M.; Okano, H.; Sawamoto, K.; et al. Epigenetic regulation of neural cell differentiation plasticity in the adult mammalian brain. Proc. Natl. Acad. Sci. USA 2008, 105, 18012–18017. [Google Scholar] [CrossRef] [PubMed]
- Lister, R.; Mukamel, E.A.; Nery, J.R.; Urich, M.; Puddifoot, C.A.; Johnson, N.D.; Lucero, J.; Huang, Y.; Dwork, A.J.; Schultz, M.D.; et al. Global epigenomic reconfiguration during mammalian brain development. Science 2013, 341, 1237905. [Google Scholar] [CrossRef]
- Mehler, M. Epigenetic principles and mechanisms underlying nervous system functions in health and disease. Prog. Neurobiol. 2008, 86, 305–341. [Google Scholar] [CrossRef] [PubMed]
- Wen, K.; Miliç, J.; El-Khodor, B.; Dhana, K.; Nano, J.; Pulido, T.; Kraja, B.; Zaciragic, A.; Bramer, W.M.; Troup, J.; et al. The role of DNA methylation and histone modifications in neurodegenerative diseases: A systematic review. PLoS ONE 2016, 11, e0167201. [Google Scholar] [CrossRef] [PubMed]
- Acharyya, S.; Sharma, S.M.; Cheng, A.S.; Ladner, K.J.; He, W.; Kline, W.; Wang, H.; Ostrowski, M.C.; Huang, T.H.; Guttridge, D.C. TNF inhibits Notch-1 in skeletal muscle cells by Ezh2 and DNA methylation mediated repression: Implications in duchenne muscular dystrophy. PLoS ONE 2010, 5, e12479. [Google Scholar] [CrossRef] [PubMed]
- Ding, H.-H.; Zhang, S.-B.; Lv, Y.-Y.; Ma, C.; Liu, M.; Zhang, K.-B.; Ruan, X.-C.; Wei, J.-Y.; Xin, W.-J.; Wu, S.-L. TNF-α/STAT3 pathway epigenetically upregulates Nav1.6 expression in DRG and contributes to neuropathic pain induced by L5-VRT. J. Neuroinflamm. 2019, 16, 29. [Google Scholar] [CrossRef]
- Kawabata, T.; Nishida, K.; Takasugi, K.; Ogawa, H.; Sada, K.; Kadota, Y.; Inagaki, J.; Hirohata, S.; Ninomiya, Y.; Makino, H. Increased activity and expression of histone deacetylase 1 in relation to tumor necrosis factor-alpha in synovial tissue of rheumatoid arthritis. Arthritis Res. Ther. 2010, 12, R133. [Google Scholar] [CrossRef]
- Kim, A.Y.; Park, Y.J.; Pan, X.; Shin, K.C.; Kwak, S.-H.; Bassas, A.F.; Sallam, R.M.; Park, K.S.; Alfadda, A.A.; Xu, A.; et al. Obesity-induced DNA hypermethylation of the adiponectin gene mediates insulin resistance. Nat. Commun. 2015, 6, 7585. [Google Scholar] [CrossRef]
- Ling, L.; Ren, M.; Yang, C.; Lao, G.; Chen, L.; Luo, H.; Feng, Z.; Yan, L. Role of site-specific DNA demethylation in TNF -induced MMP9 expression in keratinocytes. J. Mol. Endocrinol. 2013, 50, 279–290. [Google Scholar] [CrossRef] [PubMed][Green Version]
- Rui, J.; Deng, S.; Lebastchi, J.; Clark, P.L.; Usmani-Brown, S.; Herold, K.C. Methylation of insulin DNA in response to proinflammatory cytokines during the progression of autoimmune diabetes in NOD mice. Diabetologia 2016, 59, 1021–1029. [Google Scholar] [CrossRef] [PubMed]
- Wu, Y.; Starzinski-Powitz, A.; Guo, S.-W. Prolonged stimulation with tumor necrosis factor-α induced partial methylation at PR-B promoter in immortalized epithelial-like endometriotic cells. Fertil. Steril. 2008, 90, 234–237. [Google Scholar] [CrossRef] [PubMed]
- Guarnieri, G.; Sarchielli, E.; Vannelli, G.; Morelli, A. Cell-based therapy in Alzheimer’s disease: Can human fetal cholinergic neurons “untangle the skein”? Neural Regen. Res. 2018, 13, 2105. [Google Scholar] [CrossRef] [PubMed]
- Morelli, A.; Sarchielli, E.; Guarnieri, G.; Coppi, E.; Pantano, D.; Comeglio, P.; Nardiello, P.; Pugliese, A.M.; Ballerini, L.; Matucci, R.; et al. Young human cholinergic neurons respond to physiological regulators and improve cognitive symptoms in an animal model of Alzheimer’s disease. Front. Cell. Neurosci. 2017, 11, 339. [Google Scholar] [CrossRef]
- Sarchielli, E.; Guarnieri, G.; Idrizaj, E.; Squecco, R.; Mello, T.; Comeglio, P.; Gallina, P.; Maggi, M.; Vannelli, G.B.; Morelli, A. The G protein-coupled oestrogen receptor, GPER1, mediates direct anti-inflammatory effects of oestrogens in human cholinergic neurones from the nucleus basalis of Meynert. J. Neuroendocrinol. 2020, 32, e12837. [Google Scholar] [CrossRef]
- Douglas-Escobar, M.; Rossignol, C.; Steindler, D.; Zheng, T.; Weiss, M.D. Neurotrophin-induced migration and neuronal differentiation of multipotent astrocytic stem cells in vitro. PLoS ONE 2012, 7, e51706. [Google Scholar] [CrossRef]
- Willaredt, M.A.; Tasouri, E.; Tucker, K.L. Primary cilia and forebrain development. Mech. Dev. 2013, 130, 373–380. [Google Scholar] [CrossRef]
- Widera, D.; Mikenberg, I.; Elvers, M.; Kaltschmidt, C.; Kaltschmidt, B. Tumor necrosis factor α triggers proliferation of adult neural stem cells via IKK/NF-κB signaling. BMC Neurosci. 2006, 7, 64. [Google Scholar] [CrossRef]
- Peng, H.; Whitney, N.; Wu, Y.; Tian, C.; Dou, H.; Zhou, Y.; Zheng, J. HIV-1-infected and/or immune-activated macrophage-secreted TNF-α affects human fetal cortical neural progenitor cell proliferation and differentiation. Glia 2008, 56, 903–916. [Google Scholar] [CrossRef]
- Sarchielli, E.; Comeglio, P.; Squecco, R.; Ballerini, L.; Mello, T.; Guarnieri, G.; Idrizaj, E.; Mazzanti, B.; Vignozzi, L.; Gallina, P.; et al. Tumor necrosis factor α impairs kisspeptin signaling in human gonadotropin-releasing hormone primary neurons. J. Clin. Endocrinol. Metab. 2017, 102, 46–56. [Google Scholar] [CrossRef] [PubMed]
- Vézina, A.; Vaillancourt-Jean, E.; Albarao, S.; Annabi, B. Mesenchymal stromal cell ciliogenesis is abrogated in response to tumor necrosis factor-α and requires NF-κB signaling. Cancer Lett. 2014, 345, 100–105. [Google Scholar] [CrossRef] [PubMed]
- Armato, U.; Chakravarthy, B.; Pacchiana, R.; Whitfield, J.F. Alzheimer’s disease: An update of the roles of receptors, astrocytes and primary cilia (Review). Int. J. Mol. Med. 2013, 31, 3–10. [Google Scholar] [CrossRef] [PubMed]
- Amador-Arjona, A.; Elliott, J.; Miller, A.; Ginbey, A.; Pazour, G.J.; Enikolopov, G.; Roberts, A.J.; Terskikh, A.V. Primary cilia regulate proliferation of amplifying progenitors in adult hippocampus: Implications for learning and memory. J. Neurosci. 2011, 31, 9933–9944. [Google Scholar] [CrossRef]
- Park, S.M.; Jang, H.J.; Lee, J.H. Roles of primary cilia in the developing brain. Front. Cell. Neurosci. 2019, 13, 218. [Google Scholar] [CrossRef]
- Guemez-Gamboa, A.; Coufal, N.G.; Gleeson, J.G. Primary cilia in the developing and mature brain. Neuron 2014, 82, 511–521. [Google Scholar] [CrossRef]
- Niewiadomska, G.; Mietelska-Porowska, A.; Mazurkiewicz, M. The cholinergic system, nerve growth factor and the cytoskeleton. Behav. Brain Res. 2011, 221, 515–526. [Google Scholar] [CrossRef]
- Salehi, A.; Delcroix, J.-D.; Swaab, D.F. Alzheimer’s disease and NGF signaling. J. Neural Transm. 2004, 111, 323–345. [Google Scholar] [CrossRef]
- Kumamoto, N.; Gu, Y.; Wang, J.; Janoschka, S.; Takemaru, K.-I.; Levine, J.; Ge, S. A role for primary cilia in glutamatergic synaptic integration of adult-born neurons. Nat. Neurosci. 2012, 15, 399–405. [Google Scholar] [CrossRef]
- Saleh, A.; Smith, D.R.; Balakrishnan, S.; Dunn, L.; Martens, C.; Tweed, C.W.; Fernyhough, P. Tumor necrosis factor-α elevates neurite outgrowth through an NF-κB-dependent pathway in cultured adult sensory neurons: Diminished expression in diabetes may contribute to sensory neuropathy. Brain Res. 2011, 1423, 87–95. [Google Scholar] [CrossRef]
- Schmitt, K.R.L.; Boato, F.; Diestel, A.; Hechler, D.; Kruglov, A.; Berger, F.; Hendrix, S. Hypothermia-induced neurite outgrowth is mediated by tumor necrosis factor-alpha: Hypothermia induces neurite outgrowth. Brain Pathol. 2009, 20, 771–779. [Google Scholar] [CrossRef] [PubMed]
- Zhang, J.; Jiao, J. Molecular biomarkers for embryonic and adult neural stem cell and neurogenesis. BioMed Res. Int. 2015, 2015, 1–14. [Google Scholar] [CrossRef] [PubMed]
- Edwards, M.M.; Robinson, S.R. TNF alpha affects the expression of GFAP and S100B: Implications for Alzheimer’s disease. J. Neural Transm. 2006, 113, 1709–1715. [Google Scholar] [CrossRef] [PubMed]
- Gomes, F.C.A.; Paulin, D.; Moura Neto, V. Glial fibrillary acidic protein (GFAP): Modulation by growth factors and its implication in astrocyte differentiation. Braz. J. Med. Biol. Res. 1999, 32, 619–631. [Google Scholar] [CrossRef]
- Selmaj, K.; Shafit-Zagardo, B.; Aquino, D.A.; Farooq, M.; Raine, C.S.; Norton, W.T.; Brosnan, C.F. Tumor necrosis factor-induced proliferation of astrocytes from mature brain is associated with down-regulation of glial fibrillary acidic protein mRNA. J. Neurochem. 1991, 57, 823–830. [Google Scholar] [CrossRef]
- Lefrançois, T.; Fages, C.; Peschanski, M.; Tardy, M. Neuritic outgrowth associated with astroglial phenotypic changes induced by antisense glial fibrillary acidic protein (GFAP) mRNA in injured neuron–astrocyte cocultures. J. Neurosci. 1997, 17, 4121–4128. [Google Scholar] [CrossRef]
- Chen, Z.; Palmer, T.D. Differential roles of TNFR1 and TNFR2 signaling in adult hippocampal neurogenesis. Brain Behav. Immun. 2013, 30, 45–53. [Google Scholar] [CrossRef]
- Dong, Y.; Fischer, R.; Naudé, P.J.W.; Maier, O.; Nyakas, C.; Duffey, M.; Van der Zee, E.A.; Dekens, D.; Douwenga, W.; Herrmann, A.; et al. Essential protective role of tumor necrosis factor receptor 2 in neurodegeneration. Proc. Natl. Acad. Sci. USA 2016, 113, 12304–12309. [Google Scholar] [CrossRef]
- Dhar, K.; Rakesh, K.; Pankajakshan, D.; Agrawal, D.K. SOCS3 promotor hypermethylation and STAT3-NF-κB interaction downregulate SOCS3 expression in human coronary artery smooth muscle cells. Am. J. Physiol. Heart Circ. Physiol. 2013, 304, H776–H785. [Google Scholar] [CrossRef]
- Morisawa, S.; Yasuda, H.; Kamiya, T.; Hara, H.; Adachi, T. Tumor necrosis factor-α decreases EC-SOD expression through DNA methylation. J. Clin. Biochem. Nutr. 2017, 60, 169–175. [Google Scholar] [CrossRef]
- Jeltsch, A.; Jurkowska, R.Z. New concepts in DNA methylation. Trends Biochem. Sci. 2014, 39, 310–318. [Google Scholar] [CrossRef] [PubMed]
- Yarychkivska, O. Biology of Maintenance and De Novo Methylation Mediated by DNA Methyltransferase-1. Ph.D. Thesis, Columbia University, New York, NY, USA, 2017. [Google Scholar]
- Price, A.J.; Collado-Torres, L.; Ivanov, N.A.; Xia, W.; Burke, E.E.; Shin, J.H.; Tao, R.; Ma, L.; Jia, Y.; Hyde, T.M.; et al. Divergent neuronal DNA methylation patterns across human cortical development reveal critical periods and a unique role of CpH methylation. Genome Biol. 2019, 20, 196. [Google Scholar] [CrossRef] [PubMed]
- Spiers, H.; Hannon, E.; Schalkwyk, L.C.; Bray, N.J.; Mill, J. 5-hydroxymethylcytosine is highly dynamic across human fetal brain development. BMC Genom. 2017, 18, 738. [Google Scholar] [CrossRef] [PubMed]
- Varley, K.E.; Gertz, J.; Bowling, K.M.; Parker, S.L.; Reddy, T.E.; Pauli-Behn, F.; Cross, M.K.; Williams, B.A.; Stamatoyannopoulos, J.A.; Crawford, G.E.; et al. Dynamic DNA methylation across diverse human cell lines and tissues. Genome Res. 2013, 23, 555–567. [Google Scholar] [CrossRef] [PubMed]
- Jang, H.S.; Shin, W.J.; Lee, J.E.; Do, J.T. CpG and Non-CpG methylation in epigenetic gene regulation and brain function. Genes 2017, 8, 148. [Google Scholar] [CrossRef] [PubMed]
- Bock, C.; Tomazou, E.M.; Brinkman, A.B.; Müller, F.; Simmer, F.; Gu, H.; Jäger, N.; Gnirke, A.; Stunnenberg, H.G.; Meissner, A. Quantitative comparison of genome-wide DNA methylation mapping technologies. Nat. Biotechnol. 2010, 28, 1106–1114. [Google Scholar] [CrossRef]
- Grayson, D.R.; Chen, Y.; Dong, E.; Kundakovic, M.; Guidotti, A. From trans-methylation to cytosine methylation: Evolution of the methylation hypothesis of schizophrenia. Epigenetics 2009, 4, 144–149. [Google Scholar] [CrossRef]
- Szyf, M. Therapeutic implications of DNA methylation. Future Oncol. 2005, 1, 125–135. [Google Scholar] [CrossRef]
- Kaneko-Ishino, T.; Kuroiwa, Y.; Miyoshi, N.; Kohda, T.; Suzuki, R.; Yokoyama, M.; Viville, S.; Barton, S.C.; Ishino, F.; Surami, M.A. Peg1/Mest imprinted gene on chromosome 6 identified by cDNA subtraction hybridization. Nat. Genet. 1995, 11, 52–59. [Google Scholar] [CrossRef]
- Sado, T.; Nakajima’, N.; Tada, M.; Takagi, N. A novel mesoderm-specific cDNA isolated from a mouse embryonal carcinoma cell line. Dev. Growth Differ. 1993, 35, 551–560. [Google Scholar] [CrossRef]
- Li, W.; Zhu, C.; Li, Y.; Wu, Q.; Gao, R. Mest attenuates CCl4-induced liver fibrosis in rats by inhibiting the Wnt/β-catenin signaling pathway. Gut Liver 2014, 8, 282–291. [Google Scholar] [CrossRef]
- Boitard, M.; Bocchi, R.; Egervari, K.; Petrenko, V.; Viale, B.; Gremaud, S.; Zgraggen, E.; Salmon, P.; Kiss, J.Z. Wnt signaling regulates multipolar-to-bipolar transition of migrating neurons in the cerebral cortex. Cell Rep. 2015, 10, 1349–1361. [Google Scholar] [CrossRef] [PubMed]
- Ji, L.; Bishayee, K.; Sadra, A.; Choi, S.; Choi, W.; Moon, S.; Jho, E.; Huh, S. Defective neuronal migration and inhibition of bipolar to multipolar transition of migrating neural cells by Mesoderm-Specific Transcript, Mest, in the developing mouse neocortex. Neuroscience 2017, 355, 126–140. [Google Scholar] [CrossRef] [PubMed]
- Mesman, S.; van Hooft, J.A.; Smidt, M.P. Mest/Peg1 is essential for the development and maintenance of a SNc neuronal subset. Front. Mol. Neurosci. 2017, 9, 166. [Google Scholar] [CrossRef] [PubMed]
- Capitano, F.; Camon, J.; Licursi, V.; Ferretti, V.; Maggi, L.; Scianni, M.; Del Vecchio, G.; Rinaldi, A.; Mannironi, C.; Limatola, C.; et al. MicroRNA-335-5p modulates spatial memory and hippocampal synaptic plasticity. Neurobiol. Learn. Mem. 2017, 139, 63–68. [Google Scholar] [CrossRef]
- Miranda, R.C. MicroRNAs and fetal brain development: Implications for ethanol teratology during the second trimester period of neurogenesis. Front. Genet. 2012, 3, 77. [Google Scholar] [CrossRef]
- Ueki, T.; Tanaka, M.; Yamashita, K.; Mikawa, S.; Qiu, Z.; Maragakis, N.J.; Hevner, R.F.; Miura, N.; Sugimura, H.; Sato, K. A novel secretory factor, neurogenesin-1, provides neurogenic environmental cues for neural stem cells in the adult hippocampus. J. Neurosci. 2003, 23, 11732–11740. [Google Scholar] [CrossRef]
- Gaughwin, P.; Ciesla, M.; Yang, H.; Lim, B.; Brundin, P. Stage-specific modulation of cortical neuronal development by Mmu-miR-134. Cereb. Cortex 2011, 21, 1857–1869. [Google Scholar] [CrossRef]
- Gallina, P.; Paganini, M.; Lombardini, L.; Saccardi, R.; Marini, M.; De Cristofaro, M.T.; Pinzani, P.; Salvianti, F.; Crescioli, C.; Di Rita, A.; et al. Development of human striatal anlagen after transplantation in a patient with Huntington’s disease. Exp. Neurol. 2008, 213, 241–244. [Google Scholar] [CrossRef]
- Mesulam, M.M. Cholinergic circuitry of the human nucleus basalis and its fate in Alzheimer’s disease. J. Comp. Neurol. 2013, 521, 4124–4144. [Google Scholar] [CrossRef]
- Sarchielli, E.; Marini, M.; Ambrosini, S.; Peri, A.; Mazzanti, B.; Pinzani, P.; Barletta, E.; Ballerini, L.; Paternostro, F.; Paganini, M.; et al. Multifaceted roles of BDNF and FGF2 in human striatal primordium development. An in vitro study. Exp. Neurol. 2014, 257, 130–147. [Google Scholar] [CrossRef] [PubMed]
- Morelli, A.; Marini, M.; Mancina, R.; Luconi, M.; Vignozzi, L.; Fibbi, B.; Filippi, S.; Pezzatini, A.; Forti, G.; Vannelli, G.B.; et al. Sex steroids and leptin regulate the “First Kiss” (KiSS 1/G-protein-coupled receptor 54 system) in human gonadotropin-releasing-hormone-secreting neuroblasts. J. Sex. Med. 2008, 5, 1097–1113. [Google Scholar] [CrossRef] [PubMed]
- Livak, K.J.; Schmittgen, T.D. Analysis of relative gene expression data using real-time quantitative PCR and the 2−ΔΔCT method. Methods 2001, 25, 402–408. [Google Scholar] [CrossRef] [PubMed]
- Gu, H.; Smith, Z.D.; Bock, C.; Boyle, P.; Gnirke, A.; Meissner, A. Preparation of reduced representation bisulfite sequencing libraries for genome-scale DNA methylation profiling. Nat. Protoc. 2011, 6, 468–481. [Google Scholar] [CrossRef] [PubMed]
- Smallwood, S.A.; Kelsey, G. Genome-wide analysis of DNA methylation in low cell numbers by reduced representation bisulfite sequencing. In Genomic Imprinting; Engel, N., Ed.; Humana Press: Totowa, NJ, USA, 2012; Volume 925, pp. 187–197. ISBN 978-1-62703-010-6. [Google Scholar]
- Krueger, F.; Andrews, S.R. Bismark: A flexible aligner and methylation caller for Bisulfite-Seq applications. Bioinformatics 2011, 27, 1571–1572. [Google Scholar] [CrossRef]
- Ziller, M.J.; Hansen, K.D.; Meissner, A.; Aryee, M.J. Coverage recommendations for methylation analysis by whole-genome bisulfite sequencing. Nat. Methods 2015, 12, 230–232. [Google Scholar] [CrossRef]
- Akalin, A.; Kormaksson, M.; Li, S.; Garrett-Bakelman, F.E.; Figueroa, M.E.; Melnick, A.; Mason, C.E. methylKit: A comprehensive R package for the analysis of genome-wide DNA methylation profiles. Genome Biol. 2012, 13, R87. [Google Scholar] [CrossRef]


| % of Methylation | ||||||||
|---|---|---|---|---|---|---|---|---|
| Chr | Associated Gene | ID | Genomic Element | FDR | CTL | TNFα | TNFα Methylation Level vs CTL | |
| 24-hour time point | 6 | PLAGL1 | ENSG00000118495 | CpG island | 5.41 × 10−41 | 60.49 | 91.14 | hypermethylated |
| Promoter | 2.06 × 10⁻¹⁵ | 60.74 | 91.11 | hypermethylated | ||||
| 20 | HSPA12B | ENSG00000132622 | CpG island | 2.57 × 10⁻¹⁹ | 11.11 | 31.43 | hypermethylated | |
| 17 | KSR1 | ENSG00000141068 | Promoter | 5.15 × 10⁻⁴ | 25 | 53.89 | hypermethylated | |
| X | LAMP2 | ENSG00000005893 | CpG island | 1.95 × 10⁻⁶ | 48.74 | 69.95 | hypermethylated | |
| Gene body | 1.98 × 10⁻⁶ | 48.74 | 69.95 | hypermethylated | ||||
| X | NR0B1 | ENSG00000169297 | CpG island | 4.13 × 10⁻¹⁷ | 81.35 | 57.14 | hypomethylated | |
| Promoter | 5.56 × 10⁻¹⁷ | 81.35 | 57.14 | hypomethylated | ||||
| Gene body | 2.00 × 10⁻¹⁹ | 81.35 | 57.14 | hypomethylated | ||||
| 1 | MEGF6 | ENSG00000162591 | Shore | 1.10 × 10⁻⁵ | 86.67 | 63.33 | hypomethylated | |
| 4 | SOWAHB | ENSG00000186212 | Shore | 0.00123 | 65.7 | 43.33 | hypomethylated | |
| Gene body | 1.98 × 10⁻⁶ | 65.7 | 43.33 | hypomethylated | ||||
| 16 | MSLN | ENSG00000102854 | Shore | 1.58 × 10⁻⁷ | 77.55 | 55.61 | hypomethylated | |
| 8 | PVT1 | ENSG00000249859 | Promoter | 5.15 × 10⁻⁴ | 50 | 26 | hypomethylated | |
| 48-hour time point | 7 | MEST | ENSG00000106484 | CpG island | 8.53 × 10⁻¹⁸ | 62.42 | 82.53 | hypermethylated |
| Promoter | 7.28 × 10⁻⁷ | 62.42 | 82.53 | hypermethylated | ||||
| 14 | GSC | ENSG00000133937 | CpG island | 5.35 × 10⁻⁹ | 7.78 | 32.59 | hypermethylated | |
| Shore | 1.96 × 10⁻⁹ | 7.78 | 32.59 | hypermethylated | ||||
| Promoter | 2.16 × 10⁻⁸ | 7.78 | 32.59 | hypermethylated | ||||
| X | CHRDL1 | ENSG00000101938 | CpG island | 8.00 × 10⁻⁵ | 35 | 60.42 | hypermethylated | |
| Promoter | 5.11 × 10⁻⁵ | 35 | 60.42 | hypermethylated | ||||
| X | DOCK11 | ENSG00000147251 | CpG island | 1.25 × 10⁻¹¹ | 48.61 | 80.95 | hypermethylated | |
| X | ARMCX2 | ENSG00000184867 | Promoter | 7.46 × 10⁻⁵ | 31.27 | 52.26 | hypermethylated | |
| 22 | RPL3 | ENSG00000100316 | Promoter | 0.00384 | 46.67 | 67.78 | hypermethylated | |
| 1 | TRIM62 | ENSG00000116525 | Gene body | 3.85 × 10⁻⁸ | 39.17 | 63.89 | hypermethylated | |
| 8 | XKR6 | ENSG00000171044 | Gene body | 0.00243 | 40.71 | 65.56 | hypermethylated | |
| X | ARMCX2 | ENSG00000184867 | Promoter | 5.11 × 10⁻⁵ | 31.27 | 52.26 | hypermethylated | |
| X | DCAF12L2 | ENSG00000198354 | Promoter | 1.18 × 10⁻³⁵ | 47.37 | 87.68 | hypermethylated | |
| 20 | MYBL2 | ENSG00000101057 | Shore | 5.09 × 10⁻⁴ | 71.43 | 46.22 | hypomethylated | |
| Promoter | 5.09 × 10⁻⁴ | 71.43 | 46.22 | hypomethylated | ||||
| 16 | PRDM7 | ENSG00000126856 | Promoter | 7.98 × 10⁻⁶ | 65.07 | 43.6 | hypomethylated | |
| 21 | TFF2 | ENSG00000160181 | Promoter | 2.06 × 10⁻⁴ | 71.78 | 50.21 | hypomethylated | |
| 22 | HDAC10 | ENSG00000100429 | Promoter | 1.24 × 10⁻⁴ | 65.33 | 44.76 | hypomethylated | |
| X | WAS | ENSG00000015285 | Promoter | 1.85 × 10⁻⁶ | 63.22 | 41.92 | hypomethylated | |
| 14 | TMEM179 | ENSG00000258986 | Gene body | 2.08 × 10⁻⁵ | 70.64 | 49.31 | hypomethylated | |
© 2020 by the authors. Licensee MDPI, Basel, Switzerland. This article is an open access article distributed under the terms and conditions of the Creative Commons Attribution (CC BY) license (http://creativecommons.org/licenses/by/4.0/).
Share and Cite
Guarnieri, G.; Sarchielli, E.; Comeglio, P.; Herrera-Puerta, E.; Piaceri, I.; Nacmias, B.; Benelli, M.; Kelsey, G.; Maggi, M.; Gallina, P.; et al. Tumor Necrosis Factor α Influences Phenotypic Plasticity and Promotes Epigenetic Changes in Human Basal Forebrain Cholinergic Neuroblasts. Int. J. Mol. Sci. 2020, 21, 6128. https://doi.org/10.3390/ijms21176128
Guarnieri G, Sarchielli E, Comeglio P, Herrera-Puerta E, Piaceri I, Nacmias B, Benelli M, Kelsey G, Maggi M, Gallina P, et al. Tumor Necrosis Factor α Influences Phenotypic Plasticity and Promotes Epigenetic Changes in Human Basal Forebrain Cholinergic Neuroblasts. International Journal of Molecular Sciences. 2020; 21(17):6128. https://doi.org/10.3390/ijms21176128
Chicago/Turabian StyleGuarnieri, Giulia, Erica Sarchielli, Paolo Comeglio, Erika Herrera-Puerta, Irene Piaceri, Benedetta Nacmias, Matteo Benelli, Gavin Kelsey, Mario Maggi, Pasquale Gallina, and et al. 2020. "Tumor Necrosis Factor α Influences Phenotypic Plasticity and Promotes Epigenetic Changes in Human Basal Forebrain Cholinergic Neuroblasts" International Journal of Molecular Sciences 21, no. 17: 6128. https://doi.org/10.3390/ijms21176128
APA StyleGuarnieri, G., Sarchielli, E., Comeglio, P., Herrera-Puerta, E., Piaceri, I., Nacmias, B., Benelli, M., Kelsey, G., Maggi, M., Gallina, P., Vannelli, G. B., & Morelli, A. (2020). Tumor Necrosis Factor α Influences Phenotypic Plasticity and Promotes Epigenetic Changes in Human Basal Forebrain Cholinergic Neuroblasts. International Journal of Molecular Sciences, 21(17), 6128. https://doi.org/10.3390/ijms21176128