Lipidomic Biomarkers in Polycystic Ovary Syndrome and Endometrial Cancer

 ,
,
Abstract
1. Introduction
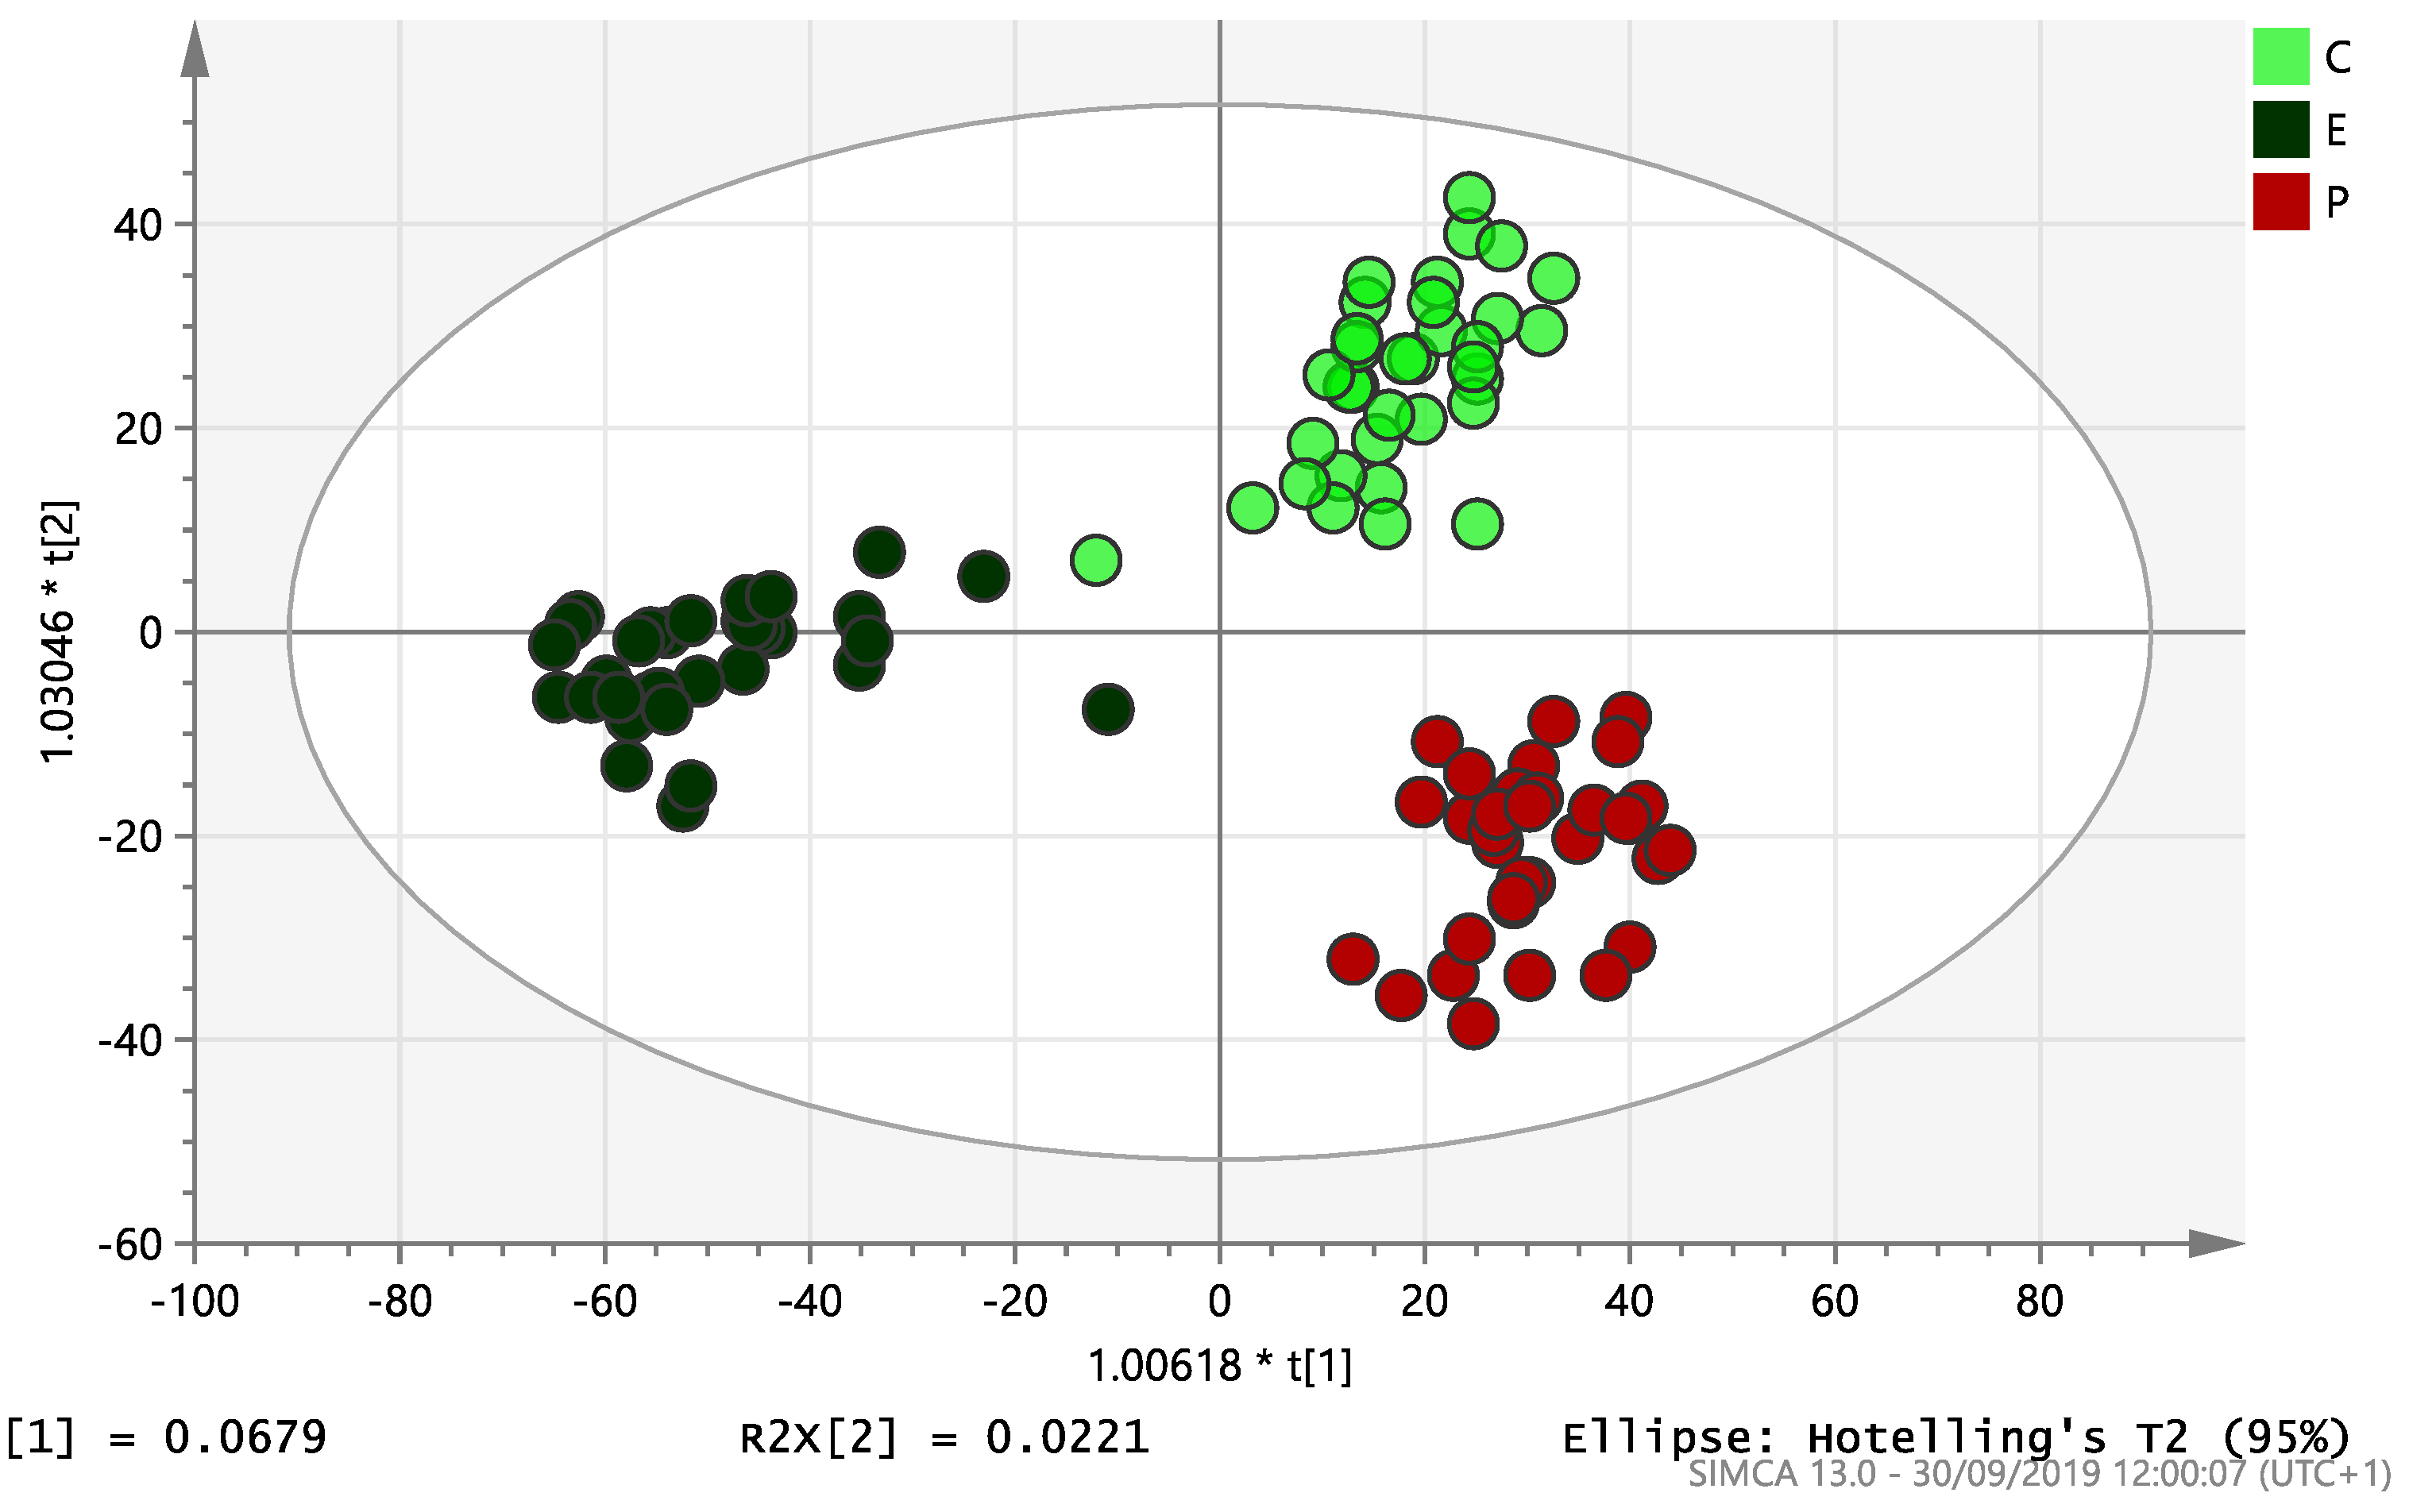
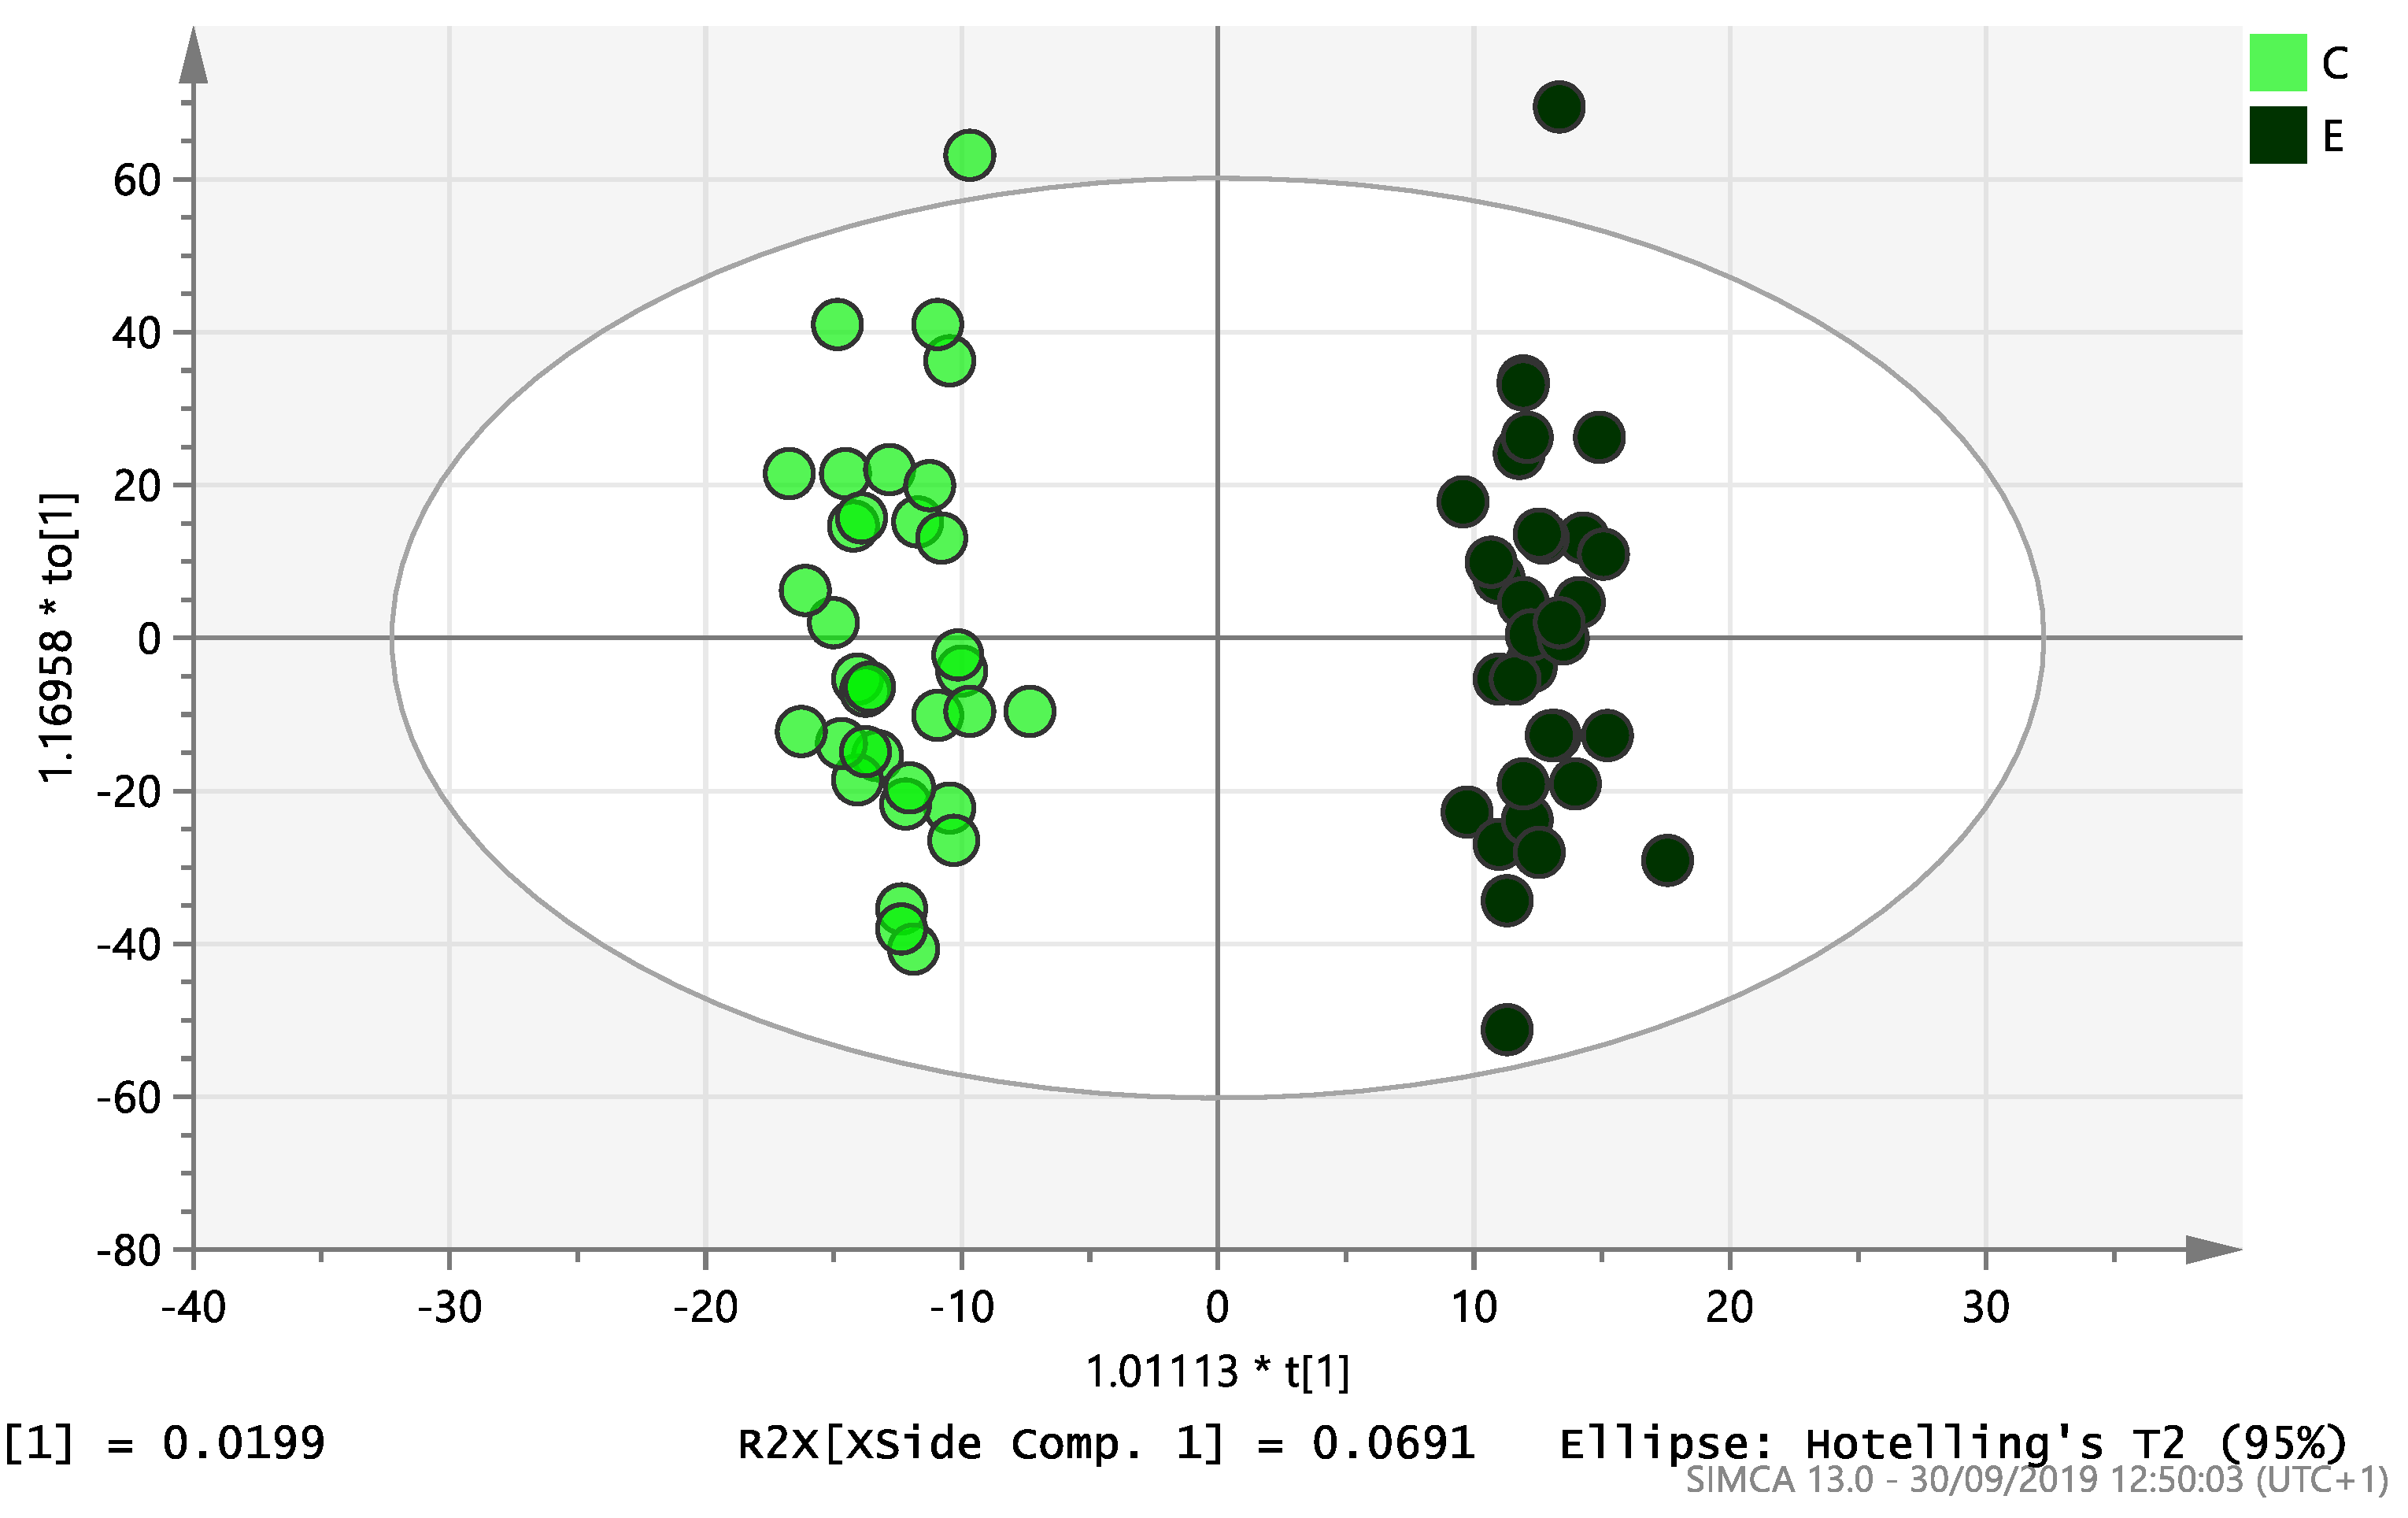
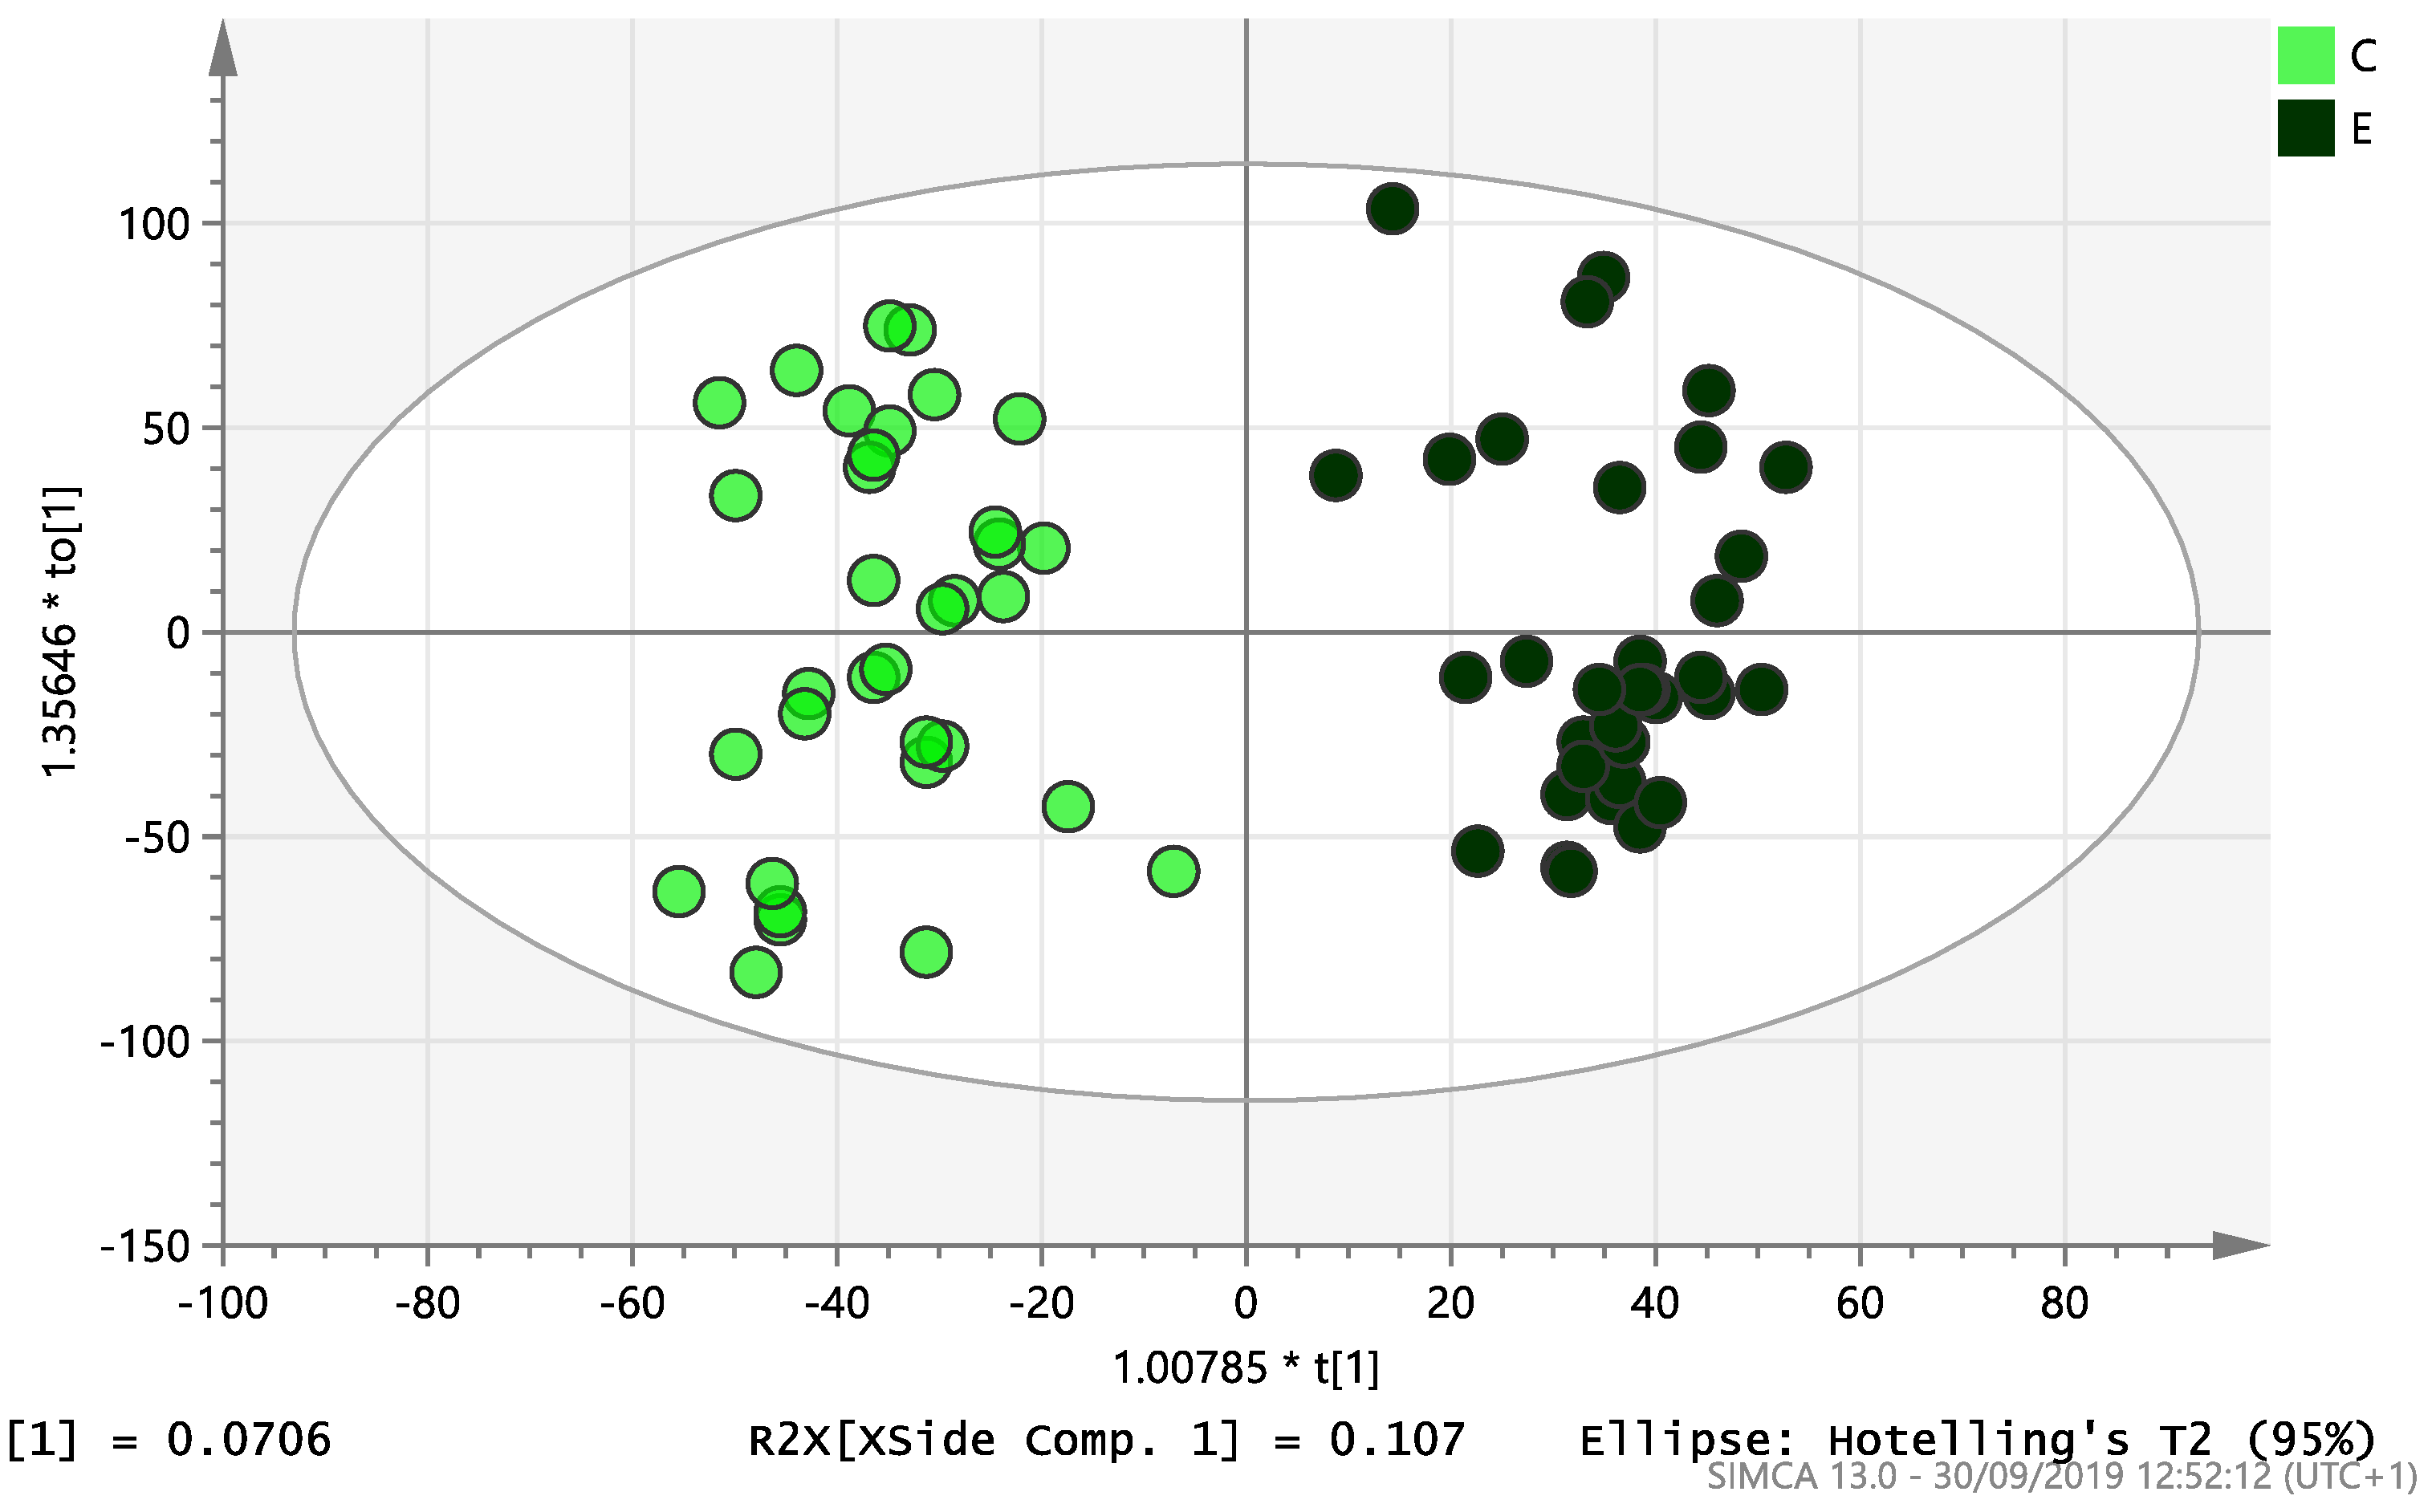
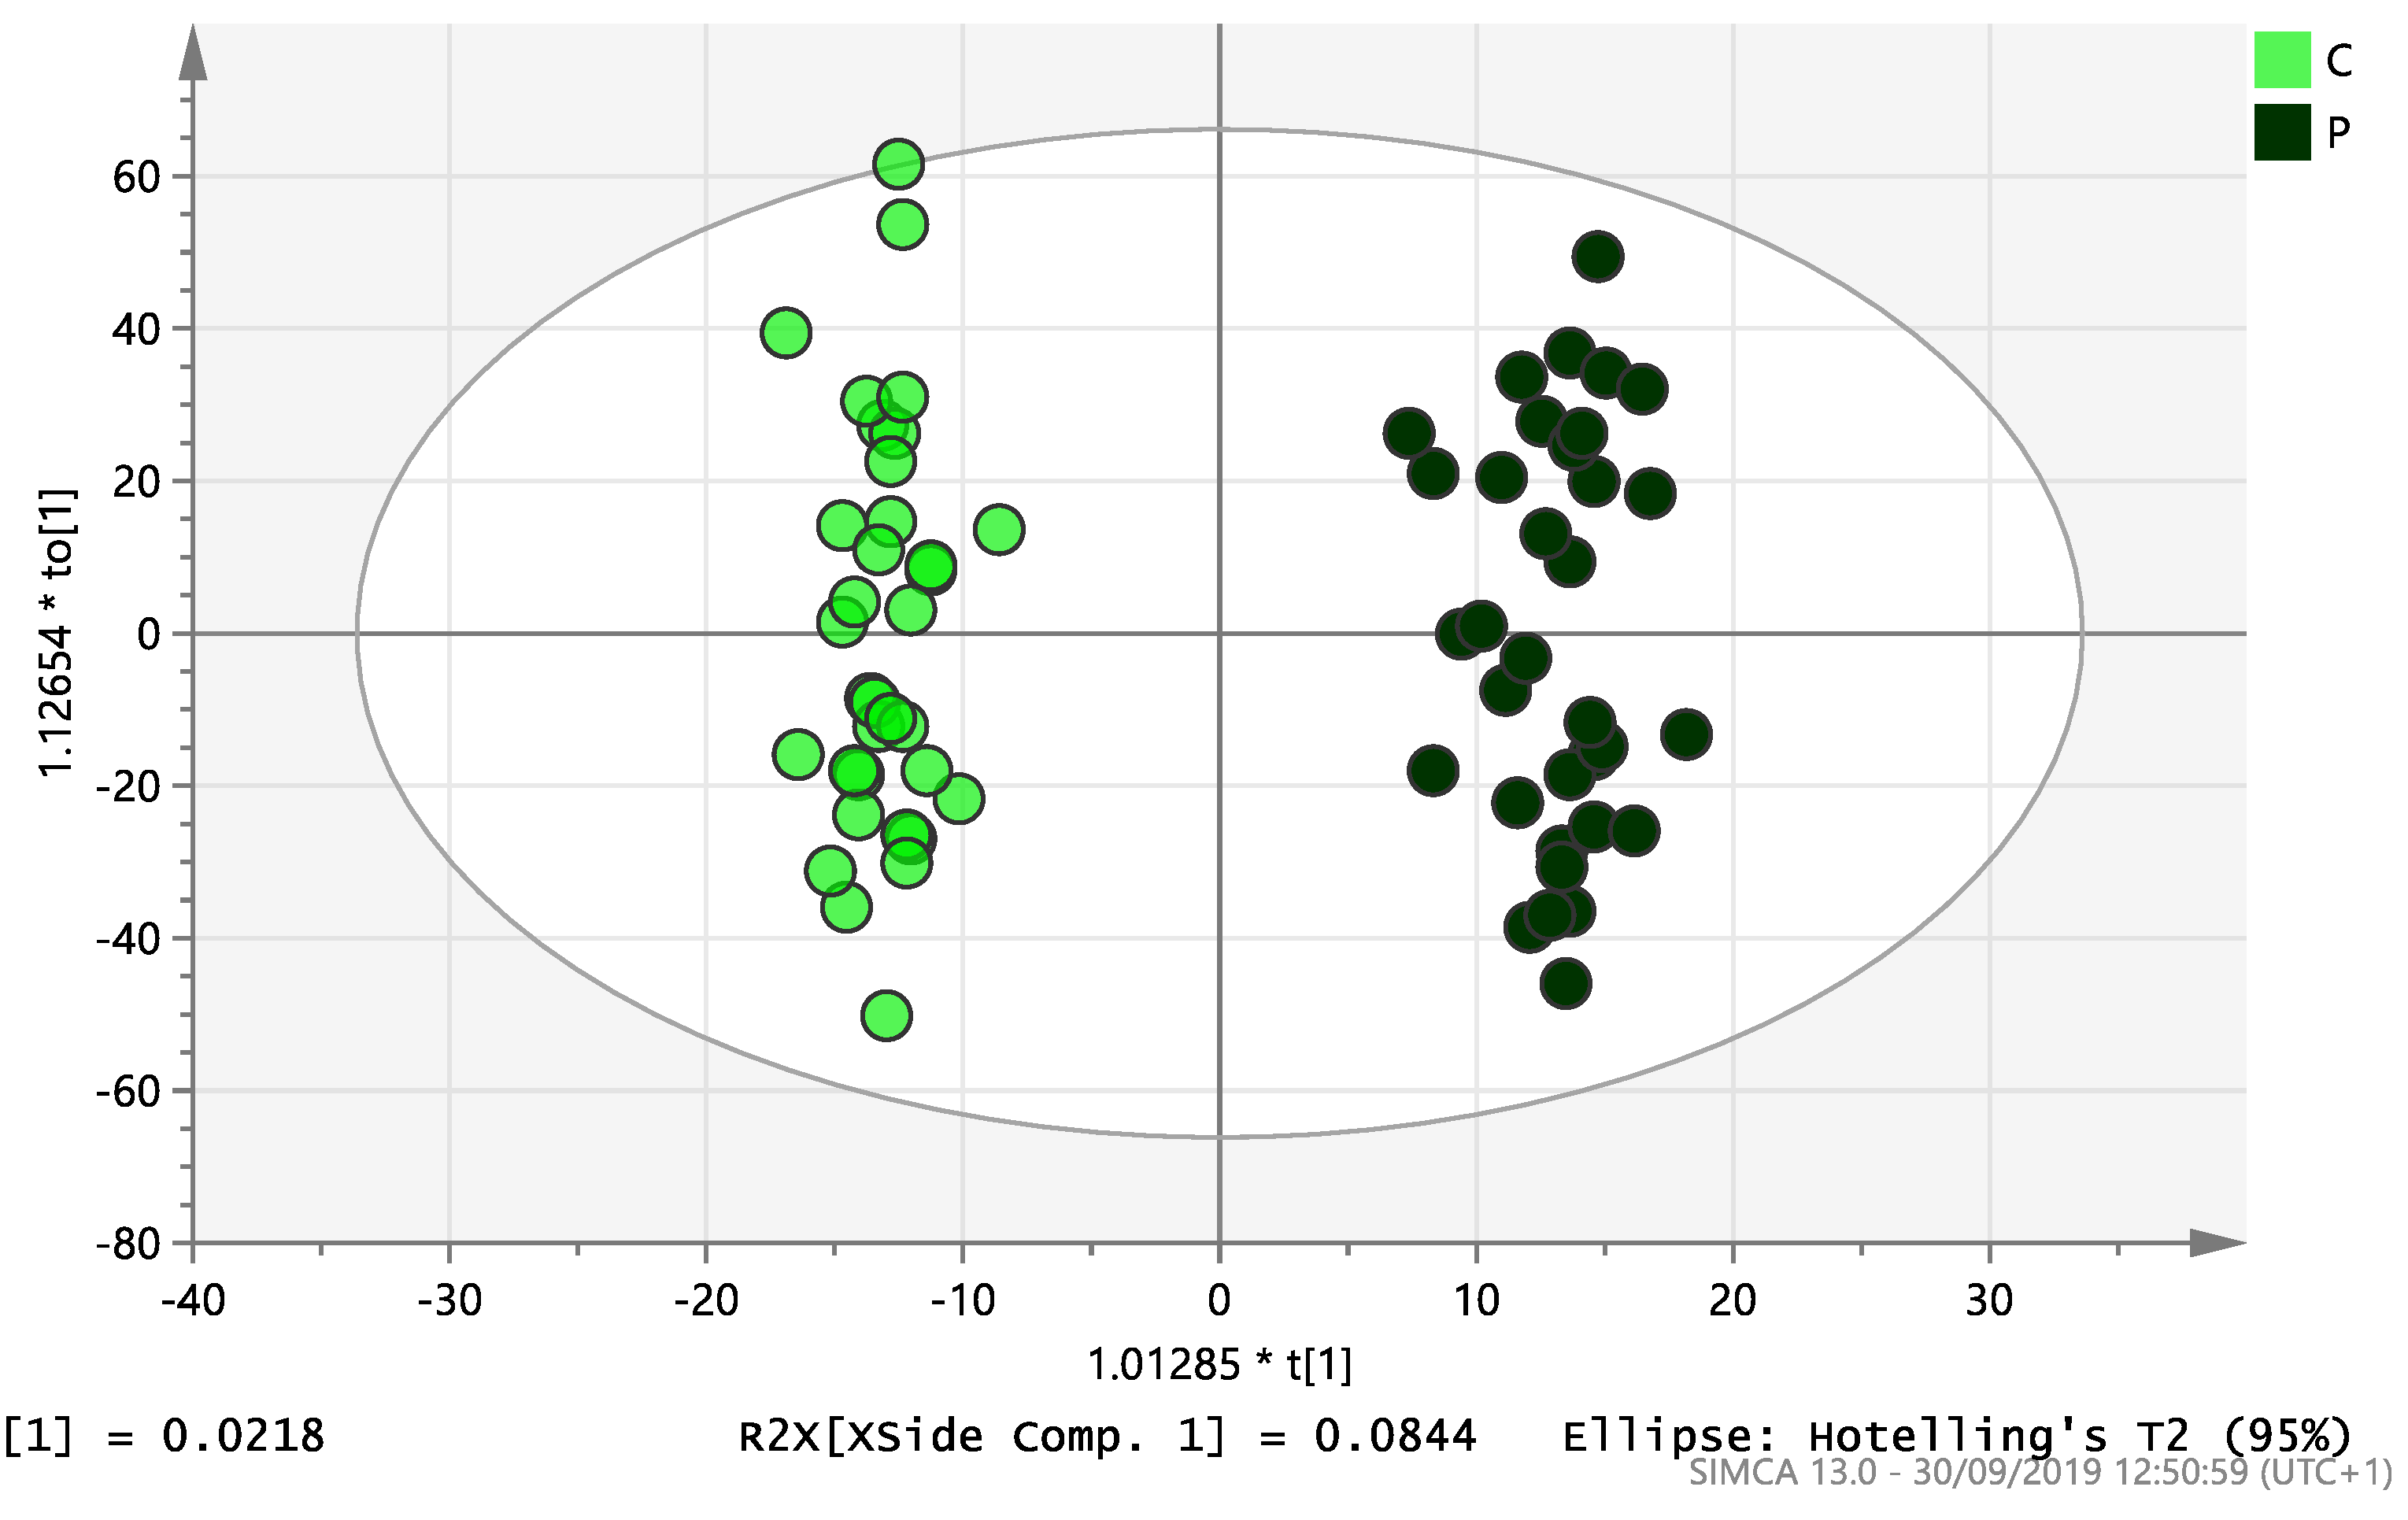
2. Results
2.1. Demography
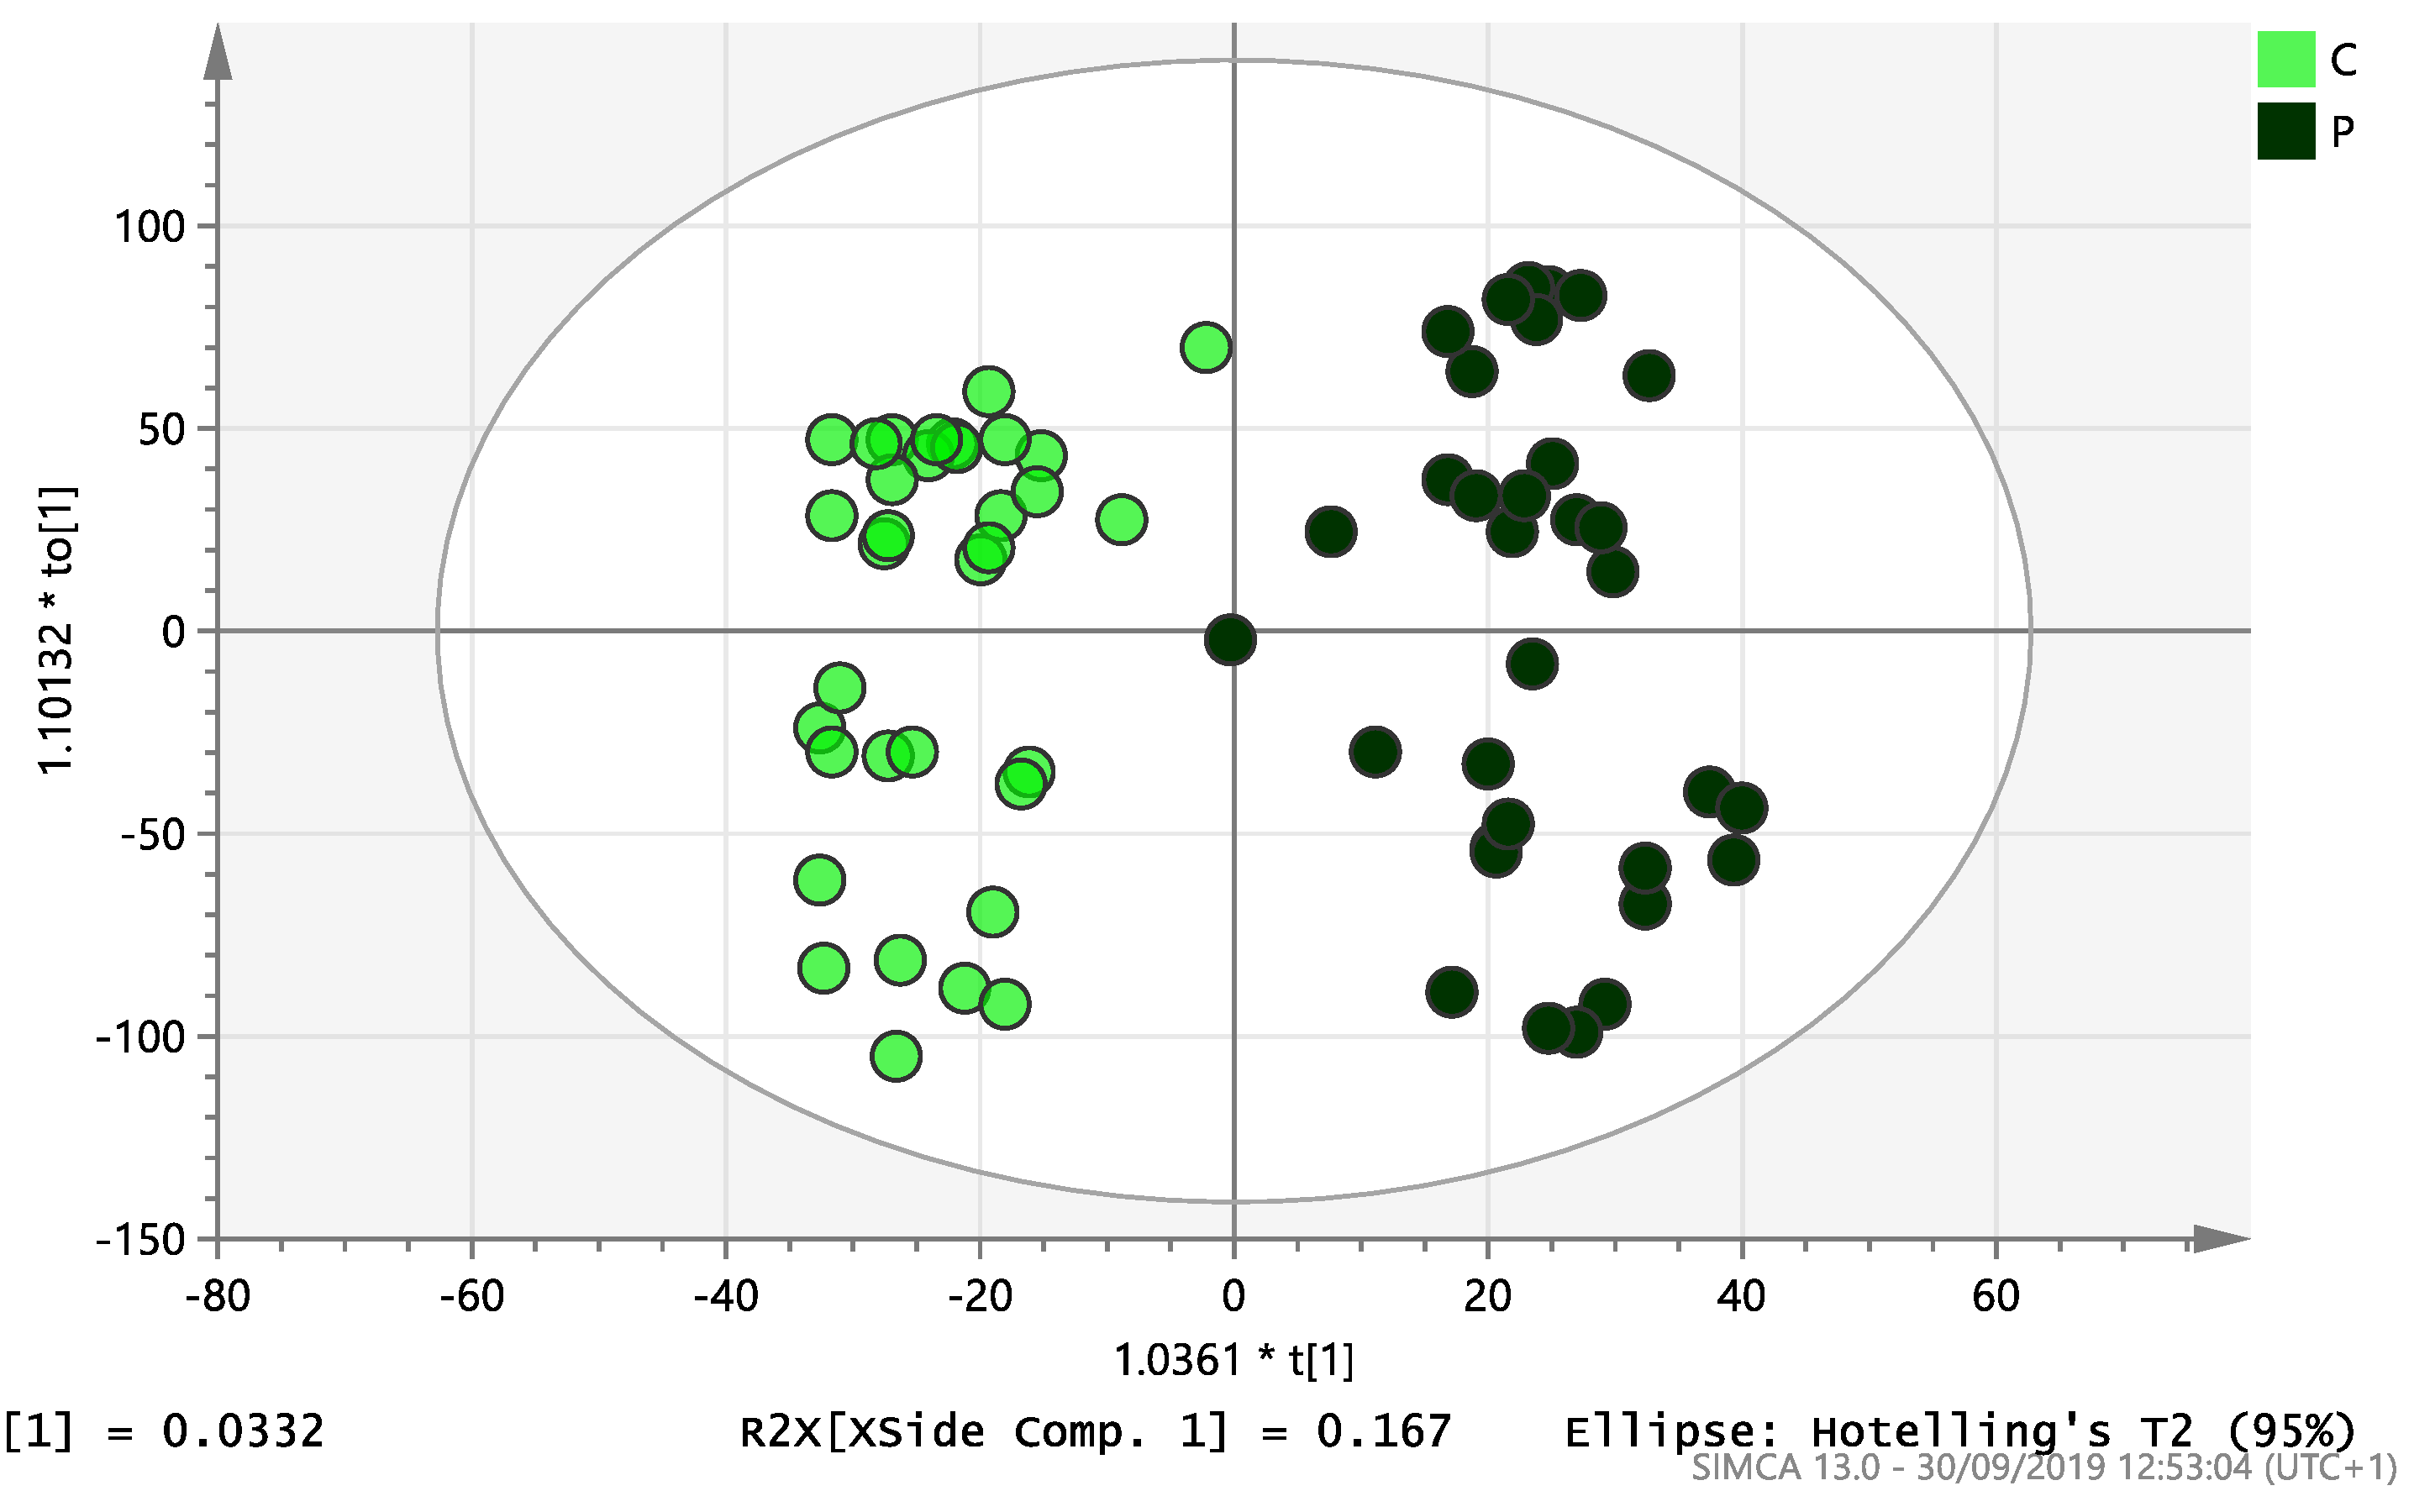
2.2. Lipidomic Profiling
3. Discussion
4. Materials and Methods
4.1. Study Design
4.2. Recruitment
4.3. Endocrine and Metabolic Assays
5. Conclusions
Supplementary Materials
Author Contributions
Funding
Acknowledgments
Conflicts of Interest
Abbreviations
| PCOS | Polycystic Ovary Syndrome |
| EC | Endometrial Cancer |
| MVA | Multivariate Analysis |
| UVA | Univariate Analysis |
| PCA | Principal component analysis |
| OPLS-DA | Orthogonal projections to latent structures discriminant analysis |
| LC | Liquid chromatography |
| LC-MS | Liquid Chromatography-Mass Spectrometry |
| HRMS | High resolution mass spectrometry |
References
- Office for National Statistics. Cancer Statistics Registrations: Registrations of Cancer Diagnosed in 2008, England; National Statistics: London, UK, 2010.
- Shafiee, M.N.; Khan, G.; Ariffin, R.; Abu, J.; Chapman, C.; Deen, S.; Nunns, D.; Barrett, D.A.; Seedhouse, C.; Atiomo, W. Preventing endometrial cancer risk in polycystic ovarian syndrome (PCOS) women: Could metformin help? Gynecol. Oncol. 2014, 132, 248–253. [Google Scholar] [CrossRef] [PubMed]
- Shafiee, M.N.; Chapman, C.; Barrett, D.; Abu, J.; Atiomo, W. Reviewing the molecular mechanisms which increase endometrial cancer (EC) risk in women with polycystic ovarian syndrome (PCOS): Time for paradigm shift? Gynecol. Oncol. 2013, 131, 489–492. [Google Scholar] [CrossRef] [PubMed]
- Haoula, Z.; Salman, M.; Atiomo, W. Evaluating the association between endometrial cancer and polycystic ovary syndrome. Hum. Reprod. 2012, 27, 1327–1331. [Google Scholar] [CrossRef]
- Barry, J.A.; Azizia, M.M.; Hardiman, P.J. Risk of endometrial, ovarian and breast cancer in women with polycystic ovary syndrome: A systematic review and meta-analysis. Hum. Reprod. Update 2014, 20, 748–758. [Google Scholar] [CrossRef]
- Shafiee, M.N.; Seedhouse, C.; Mongan, N.; Chapman, C.; Deen, S.; Abu, J.; Atiomo, W. Up-regulation of genes involved in the insulin signalling pathway (IGF1, PTEN and IGFBP1) in the endometrium may link polycystic ovarian syndrome and endometrial cancer. Mol Cell Endocrinol. 2016, 424, 94–101. [Google Scholar] [CrossRef] [PubMed]
- Nair, S.; Nguyen, H.; Salama, S.; Al-Hendy, A. Obesity and the Endometrium: Adipocyte-Secreted Proinflammatory TNF α Cytokine Enhances the Proliferation of Human Endometrial Glandular Cells. Obstet. Gynecol. Int. 2013. [Google Scholar] [CrossRef] [PubMed]
- Jennifer, L.S.; Natalie, J.S.; Gail, E.S. Clinical applications of metabolomics in oncology: A review. Clin. Cancer Res. 2009, 15, 123–127. [Google Scholar]
- Bathen, T.F.; Krane, J.; Engan, T.; Bjerve, K.S.; Axelson, D. Quantification of plasma lipids and apolipoproteins by use of proton NMR spectroscopy, multivariate and neural network analysis. NMR Biomed. 2000, 13, 271–288. [Google Scholar] [CrossRef]
- Griffin, J.L.; Shockcor, J.P. Metabolic profiles of cancer cells. Nat. Rev. Cancer 2004, 4, 551–561. [Google Scholar] [CrossRef]
- Gaudet, M.M.; Falk, R.T.; Stevens, R.D.; Gunter, M.J.; Bain, J.R.; Pfeiffer, R.M. Analysis of serum metabolic profiles in women with endometrial cancer and controls in a population-based case-control study. J. Clin. Endocrinol. Metab. 2012, 97, 3216–3223. [Google Scholar] [CrossRef]
- Sumner, L.W.; Amberg, A.; Barrett, D.; Beale, M.H.; Beger, R.; Daykin, C.A.; Fan, T.W.M.; Fiehn, O.; Goodacre, R.; Griffin, J.L.; et al. Proposed minimum reporting standards for chemical analysis Chemical Analysis Working Group (CAWG) Metabolomics Standards Initiative (MSI). Metabolomics 2007, 3, 211–221. [Google Scholar] [CrossRef]
- National Center for Biotechnology Information. Hexanoic Acid, CID=8892. Available online: https://pubchem.ncbi.nlm.nih.gov/compound/Hexanoic-acid (accessed on 7 May 2020).
- White, R.P.; Ricca, G.F.; el-Bauomy, A.M.; Robertson, J.T. Identification of capric acid as a potent vasorelaxant of human basilar arteries. Stroke 1991, 22, 469–476. [Google Scholar] [CrossRef] [PubMed][Green Version]
- Huang, W.C.; Tsai, T.H.; Chuang, L.T.; Li, Y.Y.; Zouboulis, C.C.; Tsai, P.J. Anti-bacterial and anti-inflammatory properties of capric acid against Propionibacterium acnes: A comparative study with lauric acid. J. Dermatol. Sci. 2014, 73, 232–240. [Google Scholar] [CrossRef] [PubMed]
- Narayanan, A.; Baskaran, S.A.; Amalaradjou, M.A.R.; Venkitanarayanan, K. Anticarcinogenic properties of medium chain fatty acids on human colorectal, skin and breast cancer cells in vitro. Int. J. Mol. Sci. 2015, 16, 5014–5027. [Google Scholar] [CrossRef] [PubMed]
- Aranega-Bou, P.; de la OLeyva Maria Finiti, I.; García-Agustín, P.; González-Bosch, C. Priming of plant resistance by natural compounds. Hexanoic acid as a model. Front. Plant Sci. 2014, 5, 488. [Google Scholar] [CrossRef] [PubMed]
- Atiomo, W.; Shafiee, M.N.; Chapman, C.; Metzler, V.M.; Abouzeid, J.; Latif, A.; Chadwick, A.; Kitson, S.; Sivalingam, V.N.; Stratford, I.J.; et al. Expression of NAD(P)H quinone dehydrogenase 1 (NQO1) is increased in the endometrium of women with endometrial cancer and women with polycystic ovary syndrome. Clin. Endocrinol. 2017, 87, 557–565. [Google Scholar] [CrossRef]
- Ross, D.; Siegel, D. Functions of NQO1 in Cellular Protection and CoQ10 Metabolism and its Potential Role as a Redox Sensitive Molecular Switch. Front. Physiol. 2017, 8, 595. [Google Scholar] [CrossRef]
- Gaikwad, A.; Long, D.J.; Stringer, J.L.; Jaiswal, A.K. In vivo role of NAD(P)H:quinone oxidoreductase 1 (NQO1) in the regulation of intracellular redox state and accumulation of abdominal adipose tissue. J. Biol. Chem. 2001, 276, 22559–22564. [Google Scholar] [CrossRef]
- Palming, J.; Sjöholm, K.; Jernås, M.; Lystig, T.C.; Gummesson, A.; Romeo, S.; Lönn, L.; Lönn, M.; Carlsson, B.; Carlsson, L.M.S. The Expression of NAD(P)H:Quinone Oxidoreductase 1 Is High in Human Adipose Tissue, Reduced by Weight Loss, and Correlates with Adiposity, Insulin Sensitivity, and Markers of Liver Dysfunction. J. Clin. Endocrinol. Metab. 2007, 92, 2346–2352. [Google Scholar] [CrossRef]
- Li, X.; Gao, S.; Li, W.; Liu, Z.; Shi, Z.; Qiu, C.; Jiang, J. Effect of monoacylglycerol lipase on the tumor growth in endometrial cancer. J. Obstet. Gynaecol. Res. 2019, 45. [Google Scholar] [CrossRef]
- Audet-Delage, Y.; Villeneuve, L.; Grégoire, J.; Plante, M.; Guillemette, C. Identification of Metabolomic Biomarkers for Endometrial Cancer and Its Recurrence after Surgery in Postmenopausal Women. Front. Endocrinol. 2018, 9, 87. [Google Scholar] [CrossRef] [PubMed]
- Georgescu, C.E.; Vonica, C.; Ilie, I.R.; Moraru, C.; Dana Pop, D.; Hazi, G.; Pinzariu, O.; Socaciu, C. Untargeted lipidomics profiling by high-performance liquid chromatography/time-of-flight mass spectrometry in polycystic ovary syndrome: Candidate biomarkers and association to disease traits. In Proceedings of the 21st European Congress of Endocrinology, Lyon, France, 18–21 May 2019. [Google Scholar]
- Che, X.; Jian, F.; Chen, C.; Liu, C.; Liu, G.; Feng, W. PCOS serum-derived exosomal miR-27a-5p stimulates endometrial cancer cells migration and invasion. J. Mol. Endocrinol. 2020, 64, 1–12. [Google Scholar] [CrossRef] [PubMed]
- Tian, W.; Zhang, H.; Zhang, Y.; Wang, Y.; Zhang, Y.; Xue, F.; Song, X.; Zhang, H. High level of visfatin and the activation of Akt and ERK1/2 signaling pathways are associated with endometrium malignant transformation in polycystic ovary syndrome. Gynecol. Endocrinol. 2020, 36, 156–161. [Google Scholar] [CrossRef] [PubMed]
- Shafiee, M.N.; Mongan, N.; Seedhouse, C.; Chapman, C.; Deen, S.; Abu, J.; Atiomo, W. Sterol regulatory element binding protein-1 (SREBP1) gene expression is similarly increased in polycystic ovary syndrome and endometrial cancer. Acta Obstet. Gynecol. Scand. 2017, 96, 556–562. [Google Scholar] [CrossRef] [PubMed]
- Rotterdam ESHRE/ASRM-Sponsored PCOS Consensus Workshop Group. Revised 2003 consensus on diagnostic criteria and long-term health risks related to polycystic ovary syndrome (PCOS). Hum. Reprod. 2004, 19, 41–47. [Google Scholar] [CrossRef] [PubMed]
- Haoula, Z.; Ravipati, S.; Stekel, D.J.; Ortori, C.A.; Hodgman, C.; Daykin, C.; Raine-Fenning, N.; Barrett, D.A.; Atiomo, W. Lipidomic analysis of plasma samples from women with polycystic ovary syndrome. Metabolomics 2015, 11, 657–666. [Google Scholar] [CrossRef]
- Benjamini, Y.; Krieger, A.M.; Yekutieli, D. Adaptive linear step-up procedures that control the false discovery rate. Biometrika 2006, 93, 491–507. [Google Scholar] [CrossRef]


| Variable (Mean ± SD) | Polycystic Ovary Syndrome (N = 34) | Endometrial Cancer (N = 34) | Control (N = 34) |
|---|---|---|---|
| Age (Years) | 31.8 ± 5.97 | 63.44 ± 10.07 * | 43.68 ± 13.12 |
| Menstrual phase | Proliferative = 34 | Premenopause = 4 Perimenopause = 13 Postmenopause = 17 | Premenopause = 20 Perimenopause = 14 |
| BMI (kg/m2) | 29.28 ± 2.91 | 32.22± 5.70 * | 28.58 ± 2.62 |
| WHR | 0.88 ± 0.03 | 0.91 ± 0.04 * | 0.85 ± 0.02 |
| Systolic BP | 133.4 ± 7.09 | 146.7 ± 10.7 * | 134.5 ± 8.4 |
| Diastolic BP | 82.2 ± 7.95 | 87.5 ± 6.9 | 80.56 ± 7.0 |
| Fasting Glucose (mmol/L) | 5.16 ± 0.78 | 6.3 ± 1.5 * | 4.9 ± 0.5 |
| HOMA-IR | 0.25 ± 0.39 | 0.28 ± 0.33 | 0.17 ± 0.10 |
| LDL (mmol/L) | 2.74 ± 0.77 | 2.57 ± 1.07 | 2.75 ± 0.80 |
| HDL (mmol/L) | 1.44 ± 0.33 | 1.63 ± 0.34 | 1.47 ± 0.33 |
| TG (mmol/L) | 1.43 ± 0.51 | 1.51 ± 0.54 | 1.38 ± 0.60 |
| Total Cholesterol | 4.73 ± 0.91 | 4.59 ± 1.39 | 4.94 ± 0.98 |
| Name | Identity Confidence Score * | m/z | Retention Time (min) | Increase (↑) or Decrease (↓) | Fold Change | t-Test (p) | Q-Value |
|---|---|---|---|---|---|---|---|
| Heptadecanoic acid (17:1) | 2 | 267.232 | 1.70 | ↓ | 0.59 | 5.27 × 10⁻⁶ | 7.84 × 10⁻³ |
| Palmitoleic acid (16:1) | 2 | 253.217 | 1.52 | ↓ | 0.57 | 5.60 × 10⁻⁶ | 7.84 × 10⁻³ |
| Pentadecenoic acid (15:1) | 2 | 239.201 | 1.35 | ↓ | 0.65 | 4.76 × 10⁻⁵ | 2.16 × 10⁻² |
| Palmitic acid (16:0) | 2 | 255.233 | 1.81 | ↓ | 0.74 | 6.30 × 10⁻⁵ | 7.84 × 10⁻³ |
| Heptadecanoic acid (17:0) | 2 | 269.248 | 2.03 | ↓ | 0.78 | 1.07 × 10⁻⁴ | 3.21 × 10⁻² |
| Myristic acid (14:0) | 2 | 227.201 | 1.40 | ↓ | 0.65 | 1.41 × 10⁻⁴ | 3.95 × 10⁻² |
| Docosatrienoic acid (22:3) | 2 | 333.279 | 2.11 | ↓ | 0.64 | 1.71 × 10⁻⁴ | 4.45 × 10⁻² |
| Eicosadienoic acid (20:2) | 2 | 307.264 | 1.99 | ↓ | 0.70 | 3.79 × 10⁻³ | 2.16 × 10⁻² |
| Steroid (dihydrotestosterone or isomer) sulphate | 4 | 369.172 | 0.45 | ↑ | 2.79 | 1.00 ×10⁻⁵ | 9.64 × 10⁻³ |
| Hexacosahexaenoic acid (26:6) | 2 | 383.297 | 2.05 | ↑ | 1.23 | 5.13 × 10⁻⁵ | 2.23 × 10⁻² |
| Steroid (testosterone or isomer) sulphate | 4 | 367.158 | 0.43 | ↑ | 2.23 | 5.20 × 10⁻⁵ | 2.23 × 10⁻² |
| Name | Identity Confidence Score * | m/z | Retention Time (min) | Increase (↑) or Decrease (↓) | Fold Change | t-Test (p) | Q-Value |
|---|---|---|---|---|---|---|---|
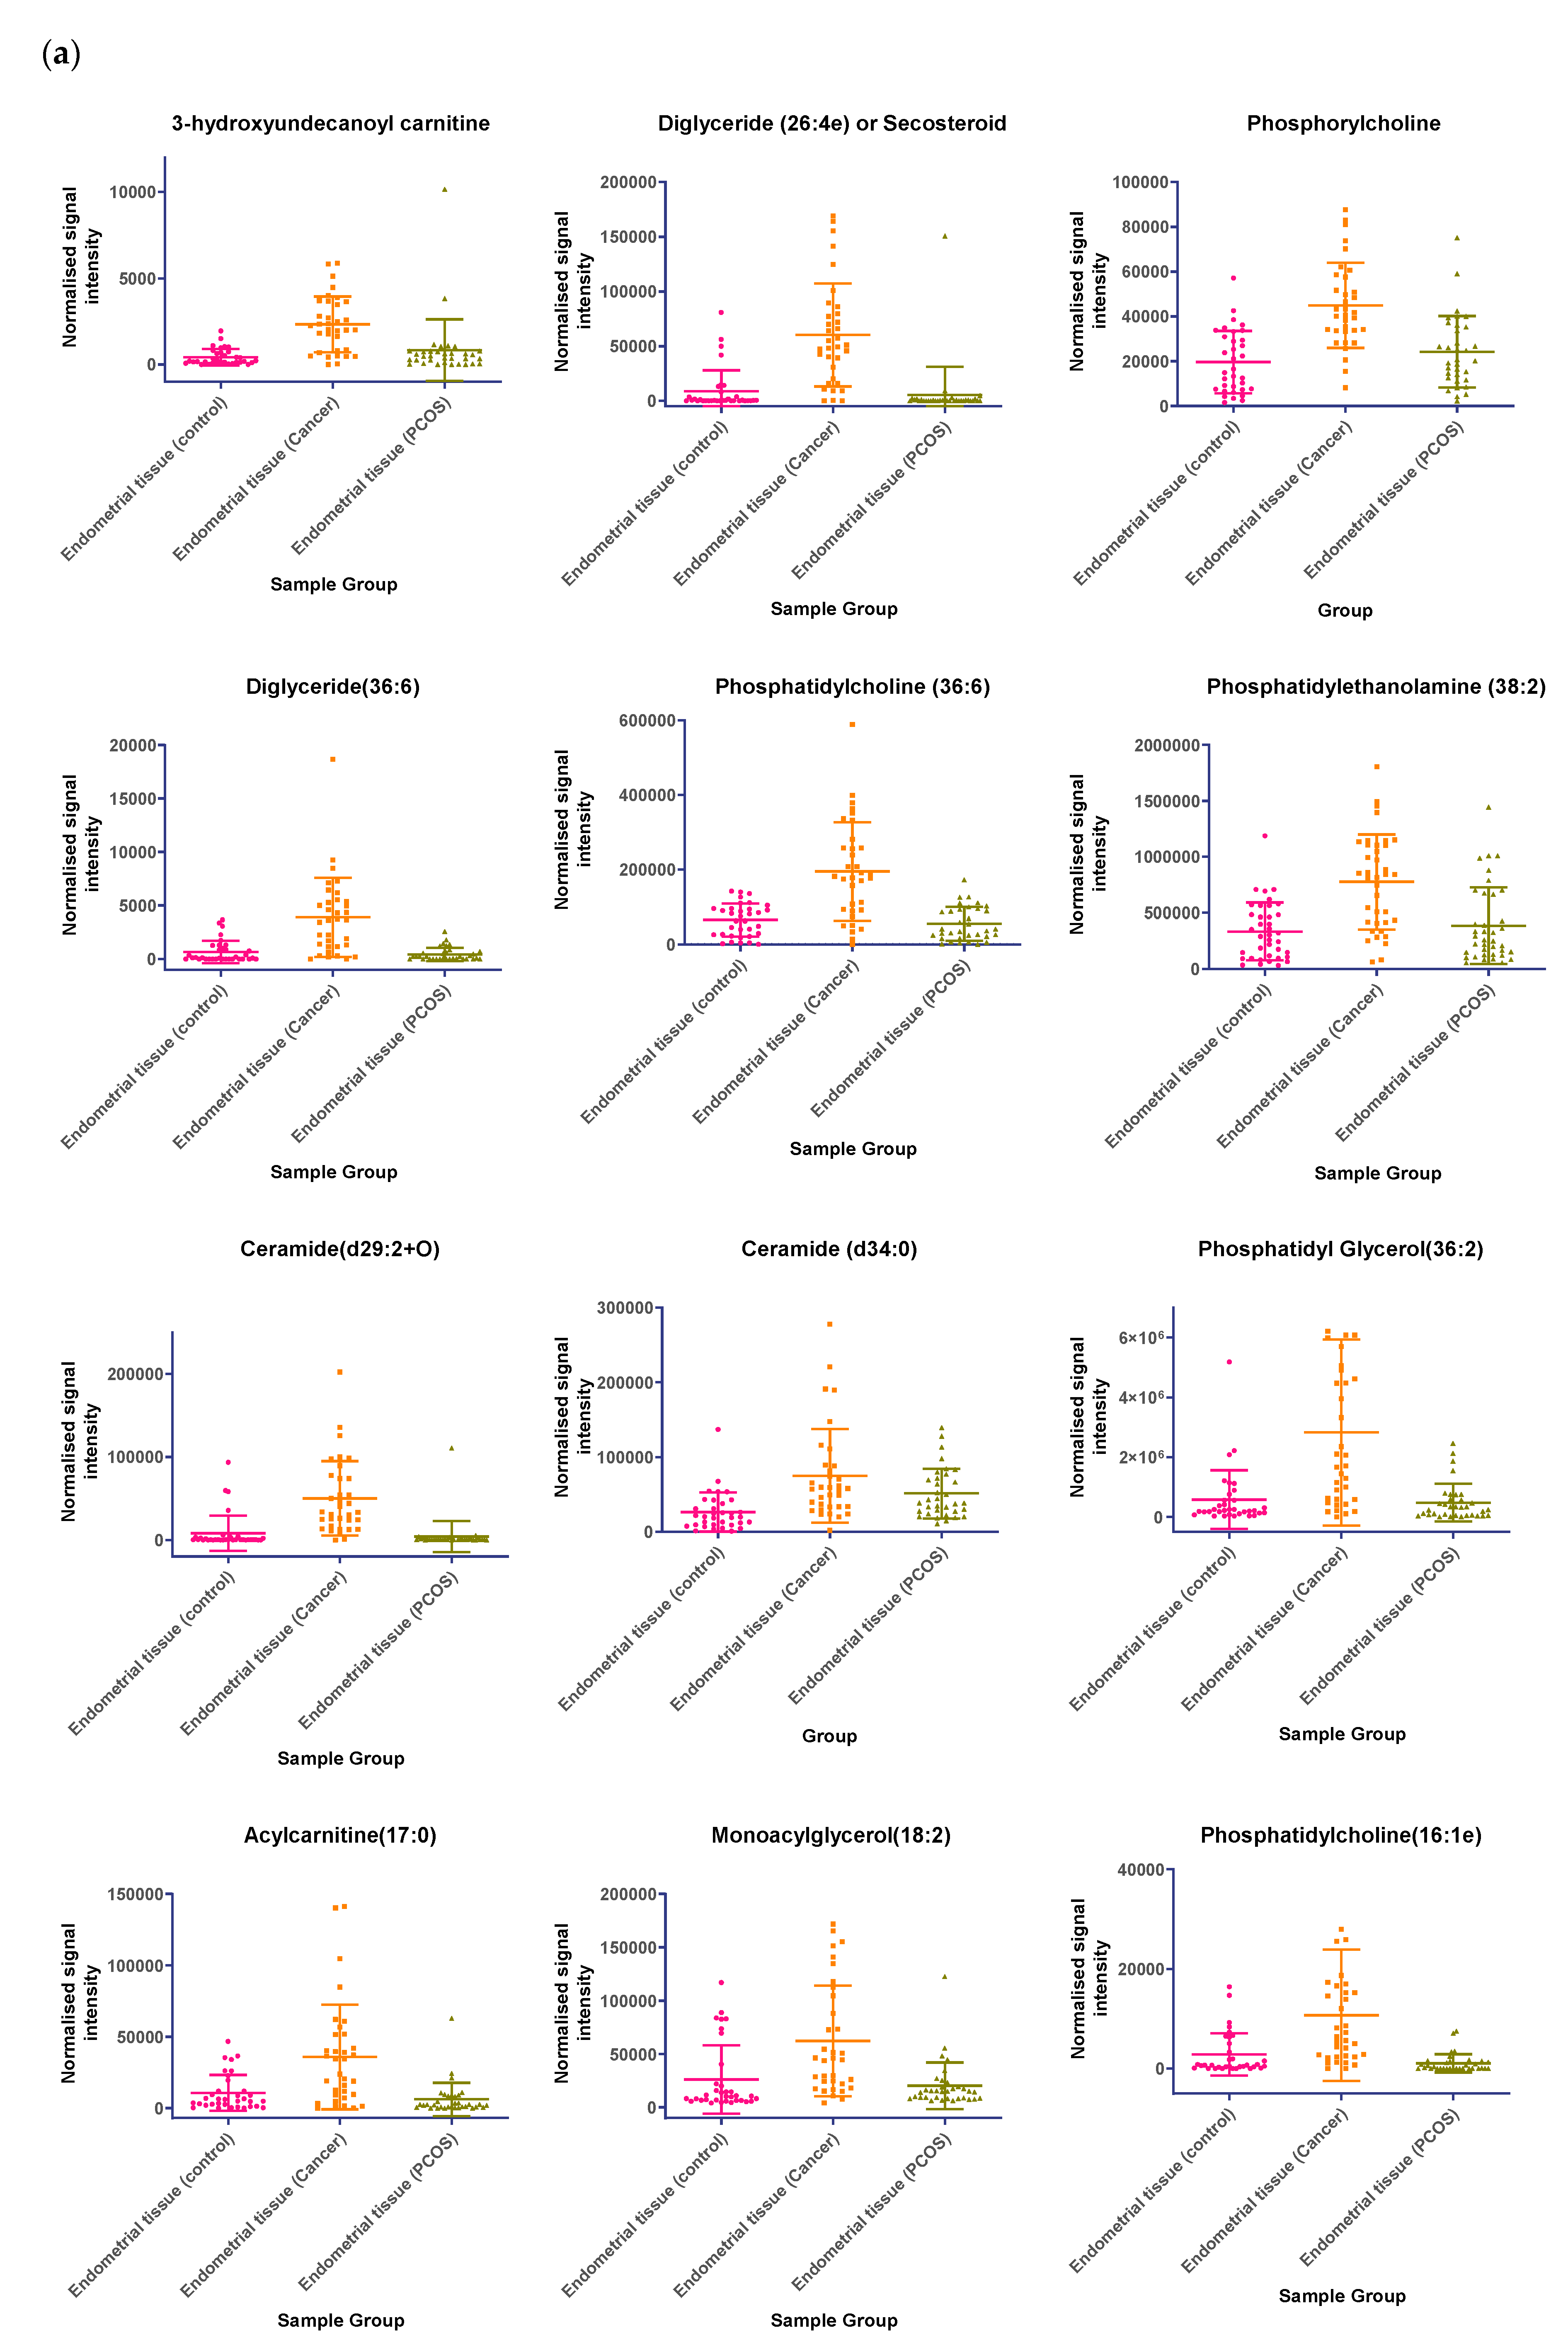
| Hydroxyundecanoyl carnitine | 4 | 363.290 | 0.64 | ↑ | 3.48 | 8.68 × 10⁻⁹ | 1.39 × 10⁻⁴ |
| Phosphorylcholine | 3 | 184.074 | 0.66 | ↑ | 2.29 | 3.38 × 10⁻⁸ | 1.71 × 10⁻⁴ |
| Diglyceride (26:4e) or Secosteroid | 4 | 480.405 | 3.56 | ↑ | 6.94 | 1.30 × 10⁻⁷ | 3.76 × 10⁻⁴ |
| Phosphatidylcholine (36:6) | 3 | 778.539 | 4.82 | ↑ | 2.99 | 7.26 × 10⁻⁷ | 6.26 × 10⁻⁴ |
| Phosphatidylethanolamine (38:2) | 3 | 772.586 | 6.31 | ↑ | 2.45 | 2.00 × 10⁻⁶ | 9.66 × 10⁻⁴ |
| Ceramide (d29:2+O) | 3 | 482.421 | 4.47 | ↑ | 6.29 | 5.00 × 10⁻⁶ | 1.53 × 10⁻³ |
| Phosphatidylethanolamine (36:6e) | 3 | 722.511 | 4.43 | ↑ | 2.46 | 5.00 × 10⁻⁶ | 1.53 × 10⁻³ |
| Diglyceride (36:6) | 3 | 630.511 | 4.15 | ↑ | 5.71 | 7.00 × 10⁻⁶ | 1.68 × 10⁻³ |
| Ceramide (d34:0) | 3 | 540.534 | 4.59 | ↑ | 2.82 | 9.60 × 10⁻⁵ | 7.39 × 10⁻³ |
| Phosphatidyl Glycerol (36:2) | 3 | 773.533 | 2.84 | ↑ | 4.84 | 1.57 × 10⁻⁴ | 1.01 × 10⁻² |
| Acylcarnitine (17:0) | 3 | 414.358 | 2.72 | ↑ | 3.39 | 3.21 × 10⁻⁴ | 1.45 × 10⁻² |
| Monoacylglycerol (18:2) | 3 | 372.311 | 1.69 | ↑ | 2.38 | 9.79 × 10⁻⁴ | 2.69 × 10⁻² |
| Phosphatidylcholine (16:1e) | 3 | 538.352 | 1.99 | ↑ | 3.77 | 1.50 × 10⁻³ | 3.35 × 10⁻² |
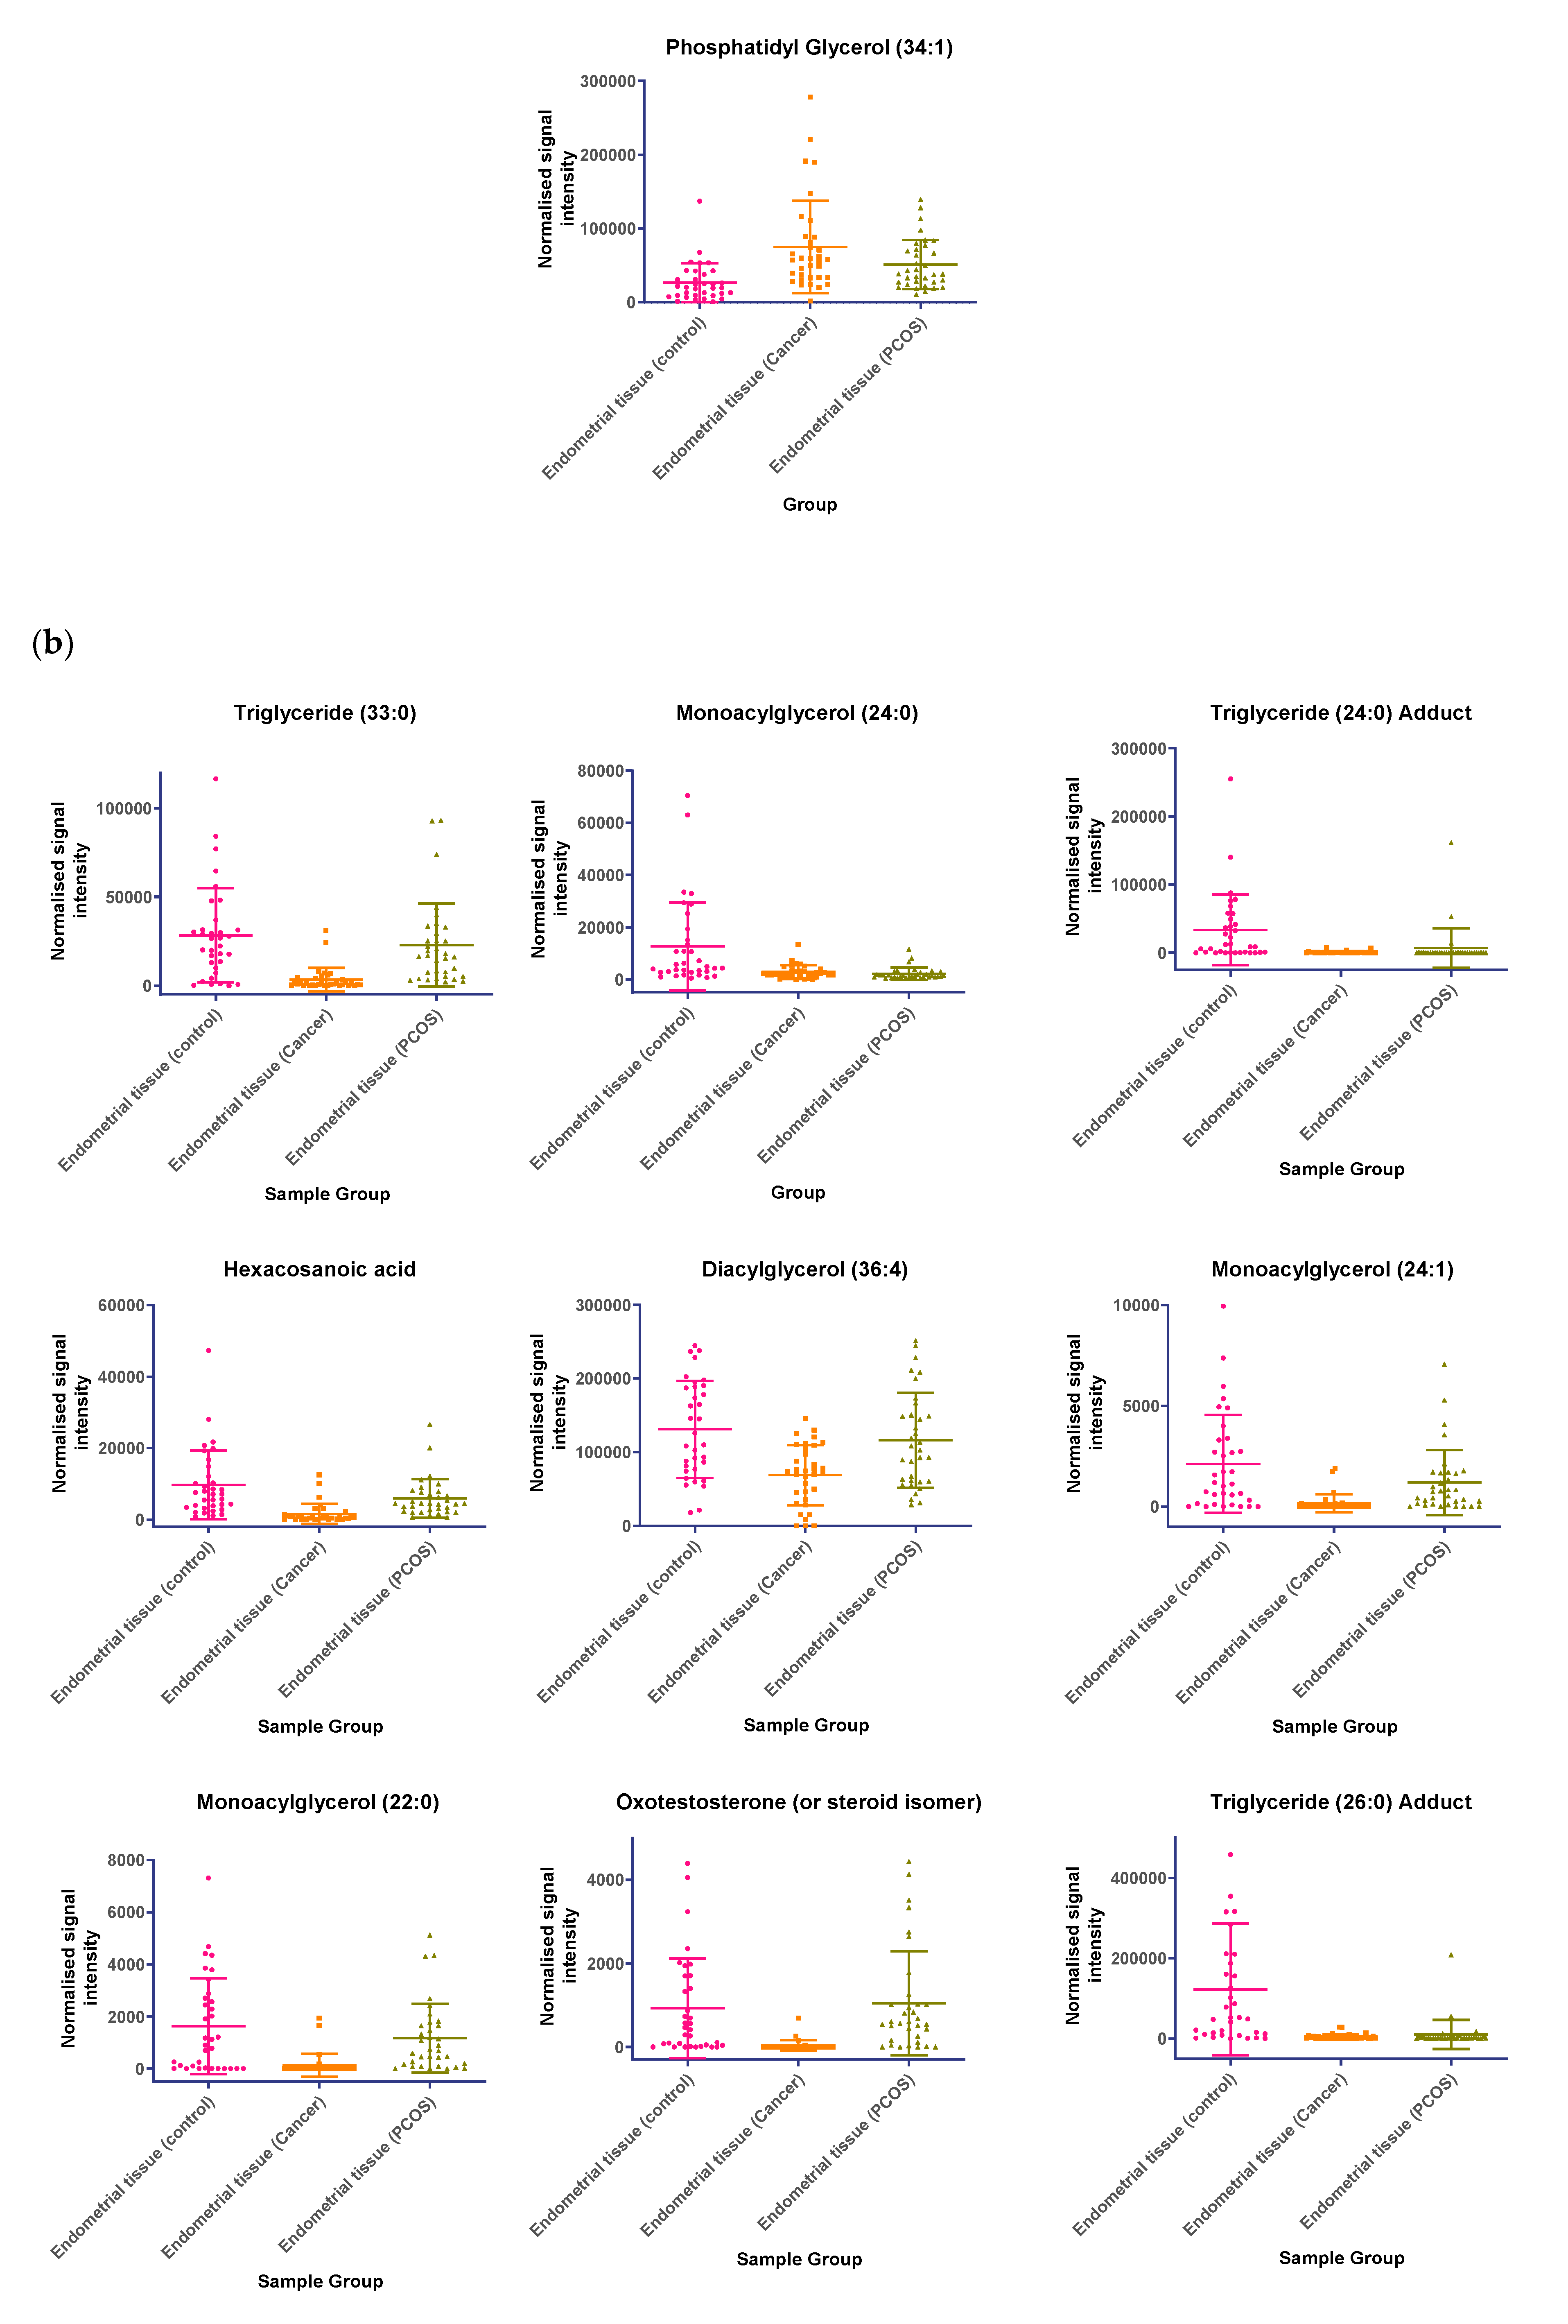
| Phosphatidyl Glycerol (34:1) | 3 | 747.522 | 3.17 | ↑ | 2.82 | 2.30 × 10⁻³ | 4.17 × 10⁻² |
| Triglyceride (33:0) | 3 | 614.535 | 2.14 | ↓ | 0.12 | 1.00 × 10⁻⁶ | 9.60 × 10⁻⁴ |
| Monoacylglycerol (24:0) | 2 | 437.363 | 2.11 | ↓ | 0.11 | 2.00 × 10⁻⁶ | 9.66 × 10⁻⁴ |
| Hexacosanoic acid | 2 | 395.389 | 4.52 | ↓ | 0.17 | 1.30 × 10⁻⁵ | 2.27 × 10⁻³ |
| Diacylglycerol (36:4) | 3 | 675.520 | 5.00 | ↓ | 0.52 | 1.40 × 10⁻⁵ | 2.45 × 10⁻³ |
| Monoacylglycerol (24:1) | 2 | 439.378 | 2.09 | ↓ | 0.07 | 1.70 × 10⁻⁵ | 2.56 × 10⁻³ |
| Monoacylglycerol (22:0) | 2 | 413.363 | 1.98 | ↓ | 0.08 | 1.90 × 10⁻⁵ | 2.77 × 10⁻³ |
| Sterol at C27H48O5 | 4 | 451.343 | 1.24 | ↓ | 0.09 | 4.00 × 10⁻⁵ | 4.22 × 10⁻³ |
| Monoacylglycerol (22:4) | 2 | 405.301 | 1.24 | ↓ | 0.06 | 4.90 × 10⁻⁵ | 4.93 × 10⁻³ |
| Oxotestosterone (or steroid isomer) | 3 | 320.218 | 0.79 | ↓ | 0.04 | 5.30 × 10⁻⁵ | 5.20 × 10⁻³ |
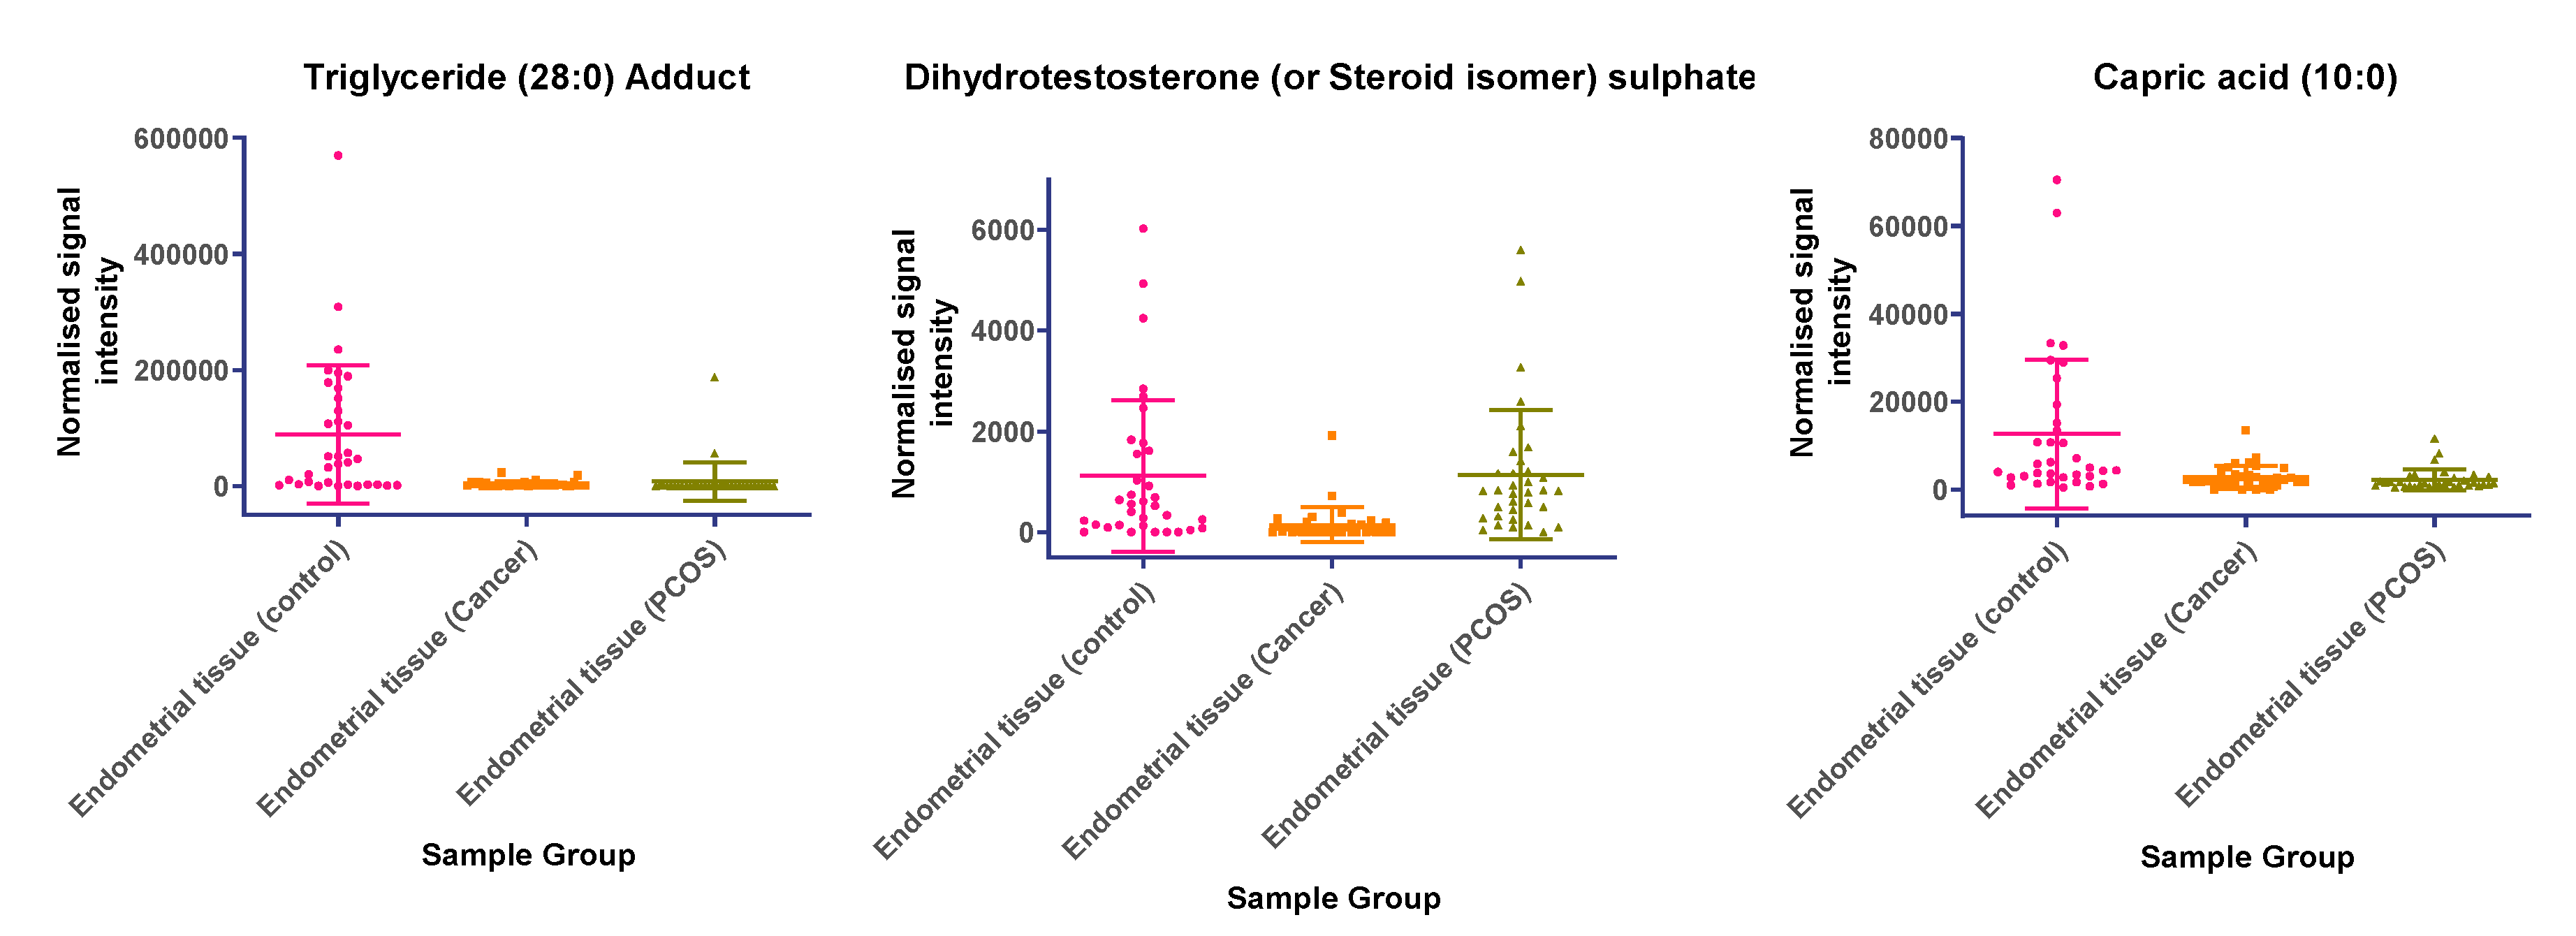
| Triglyceride (28:0) Adduct | 3 | 585.484 | 3.89 | ↓ | 0.04 | 8.90 × 10⁻⁵ | 7.13 × 10⁻³ |
| Monoacylglycerol (22:2) | 2 | 409.332 | 1.70 | ↓ | 0.11 | 1.59 × 10⁻⁴ | 1.01 × 10⁻² |
| Monoacylglycerol (24:4) | 3 | 433.332 | 1.56 | ↓ | 0.10 | 2.27 × 10⁻⁴ | 1.22 × 10⁻² |
| Dihydrotestosterone (or Steroid isomer) sulphate | 4 | 369.172 | 0.45 | ↓ | 0.13 | 4.85 × 10⁻⁴ | 1.80 × 10⁻² |
| Triglyceride (24:0) | 3 | 493.355 | 2.76 | ↓ | 0.10 | 1.11 × 10⁻³ | 2.86 × 10⁻² |
| Capric acid | 2 | 171.139 | 0.69 | ↓ | 0.22 | 1.32 × 10⁻³ | 3.13 × 10⁻² |
© 2020 by the authors. Licensee MDPI, Basel, Switzerland. This article is an open access article distributed under the terms and conditions of the Creative Commons Attribution (CC BY) license (http://creativecommons.org/licenses/by/4.0/).
Share and Cite
Shafiee, M.N.; Ortori, C.A.; Barrett, D.A.; Mongan, N.P.; Abu, J.; Atiomo, W. Lipidomic Biomarkers in Polycystic Ovary Syndrome and Endometrial Cancer. Int. J. Mol. Sci. 2020, 21, 4753. https://doi.org/10.3390/ijms21134753
Shafiee MN, Ortori CA, Barrett DA, Mongan NP, Abu J, Atiomo W. Lipidomic Biomarkers in Polycystic Ovary Syndrome and Endometrial Cancer. International Journal of Molecular Sciences. 2020; 21(13):4753. https://doi.org/10.3390/ijms21134753
Chicago/Turabian StyleShafiee, Mohamad Nasir, Catharine A. Ortori, David A. Barrett, Nigel P. Mongan, Jafaru Abu, and William Atiomo. 2020. "Lipidomic Biomarkers in Polycystic Ovary Syndrome and Endometrial Cancer" International Journal of Molecular Sciences 21, no. 13: 4753. https://doi.org/10.3390/ijms21134753
APA StyleShafiee, M. N., Ortori, C. A., Barrett, D. A., Mongan, N. P., Abu, J., & Atiomo, W. (2020). Lipidomic Biomarkers in Polycystic Ovary Syndrome and Endometrial Cancer. International Journal of Molecular Sciences, 21(13), 4753. https://doi.org/10.3390/ijms21134753