Article

Quantitative Trait Locus Mapping of Clubroot Resistance and Plasmodiophora brassicae Pathotype Banglim-Specific Marker Development in Brassica rapa

1
Molecular Genetics and Genomics Laboratory, Department of Horticulture, College of Agriculture and Life Science, Chungnam National University, Daejeon 34134, Korea
2
School of Biosciences, University of Birmingham, Birmingham B15 2TT, UK
3
Center for Eco-friendly New Materials, Korea Research Institute of Chemical Technology, Daejeon 34114, Korea
4
Bio-Breeding Institute, 153-60 Sinryeong-ro, Anseong 17544, Korea
*
Author to whom correspondence should be addressed.
These authors contributed equally to this work.
Int. J. Mol. Sci. 2020, 21(11), 4157; https://doi.org/10.3390/ijms21114157
Submission received: 20 April 2020 / Revised: 28 May 2020 / Accepted: 6 June 2020 / Published: 10 June 2020
(This article belongs to the Collection Genetics and Molecular Breeding in Plants)

Abstract

:
Clubroot resistance is an economically important trait in Brassicaceae crops. Although many quantitative trait loci (QTLs) for clubroot resistance have been identified in Brassica, disease-related damage continues to occur owing to differences in host variety and constant pathogen variation. Here, we investigated the inheritance of clubroot resistance in a double haploid population developed by crossing clubroot resistant and susceptible lines “09CR500” and “09CR501”, respectively. The resistance of “09CR500” to Plasmodiophora brassicae pathotype “Banglim” was controlled as a single dominant gene, with the segregation of resistance and susceptibility being nearly 1:1. PbBrA08Banglim was identified as having a logarithm of odds value of 7.9–74.8, and a phenotypic variance of 26.0–97.1% with flanking marker “09CR.11390652” in A08. After aligning QTL regions to the B. rapa reference genome, 11 genes were selected as candidates. PbBrA08Banglim was located near Crr1, CRs, and Rcr9 loci, but differences were validated by marker analysis, gene structural variations, and gene expression levels, as well as phenotypic responses to the pathotype. Genotyping using the “09CR.11390652” marker accurately distinguished the Banglim-resistance phenotypes in the double haploid population. Thus, the developed marker will be useful in Brassica breeding programs, marker-assisted selection, and gene pyramiding to identify and develop resistant cultivars.

1. Introduction

The Cruciferae family includes various crops that provide sources of daily vegetables and oils for humans and forage crops for animals worldwide. Clubroot, caused by Plasmodiophora brassicae, is a soil-borne contagious disease that leads to decreases in crop productivity, including that of Chinese cabbage and other relatives in Cruciferae.
This biotrophic pathogen infects plants through the hairy roots. Consequently, it is difficult to detect because it occurs underground. In the early stages of infection, the plant’s nutrients are taken away from regulating host cell proliferation, as well as vasculature and phloem differentiation, resulting in delayed growth and withering symptoms [1,2]. However, in the later stages of infection, growth halts after the roots are transformed into thick galls (anatomical changes). These modified roots cannot properly transfer moisture and nutrients, which are inherent to the roots. To overcome P. brassicae infections, various crop cultivation methods have been introduced, such as management of soil pH and soil humidity; treatments with trace elements such as a calcium, antagonists, and fungicides; and crop rotations with nonhost crops [3,4,5]. However, it is difficult to carry out the crop cultivation control method every year. Additionally, once fields are infected, they are constantly at risk owing to the longevity of the resting spores [6]. Therefore, the development of resistant cultivars is an appropriate countermeasure to maintain sustainable agriculture and productivity [7,8].
Resistance traits have been introgressed successfully through interspecific hybridization with plants having resistance through conventional breeding processes [9,10,11,12,13,14,15]. At present, many studies have reported various genetic factors associated with resistance in diverse crops species (Brassica rapa, Brassica oleracea, Brassica juncea, Brassica napus, Brassica carinata, and Raphanus satives). In B. rapa (A genome), 17 quantitative trait loci (QTLs), including two candidate genes, were reported over the last two decades, and these are located in six chromosomes (A01, A02, A03, A05, A06, and A08) in the B. rapa genome: CRa [16], CRb [13,17], CRaki [18], CRc, CRk [19], CRd [20], Crr1a, Crr1b, Crr2, Crr4 [21,22,23], Crr3 [24], PbBa3.1, PbBa3.3 [13], CrrA05 [25], Rcr1 [26], Rcr9 [27], and CRs [28]. In B. oleracea (C genome), nine QTLs were detected in four chromosomes (C2, C3, C5, and C9): Pb-Bo (Anju)14 [29], CRQTL-YC, CRQTL-GN_1, CRQTL-GN_2 [30], Rcr7 [31], QTL-LG9 [32], and 23 QTLs [33]. In Brassica nigra (B genome), Rcr6 was recently identified in B3 chromosome as a single dominant [34].
For the amphidiploids, B. napus (AC), several results were reported [35,36,37,38]. Additionally, QTLs have been reported in R. sativus [39,40]. This information has been useful for the development of markers for marker-assisted selection [41]. Nevertheless, owing to the rapid adaptation (variation) of pathogens to available cultivars, the continuous breeding of new resistant cultivars is required.
Next-generation sequencing technologies have been applied to crop genetics and breeding programs as powerful tools that accelerate the pace of marker development and the mapping of associated traits by providing massive quantities of sequence variation data (markers) within a short time [42,43,44,45]. Genomic information enables the identification of sequence variations, which facilitates the development of large numbers of markers. Here, we performed genome sequencing of the resistant inbred B. rapa line “09CR500” to develop phenotype-associated markers.
The objectives of this study were i) the identification of genomic regions harboring P. brassicae resistance in the inbred line “09CR500”; and ii) the development of the markers tightly associated with qPbBrA08Banglim for further use in breeding programs to increase clubroot resistance and for marker-assisted selection.

2. Results

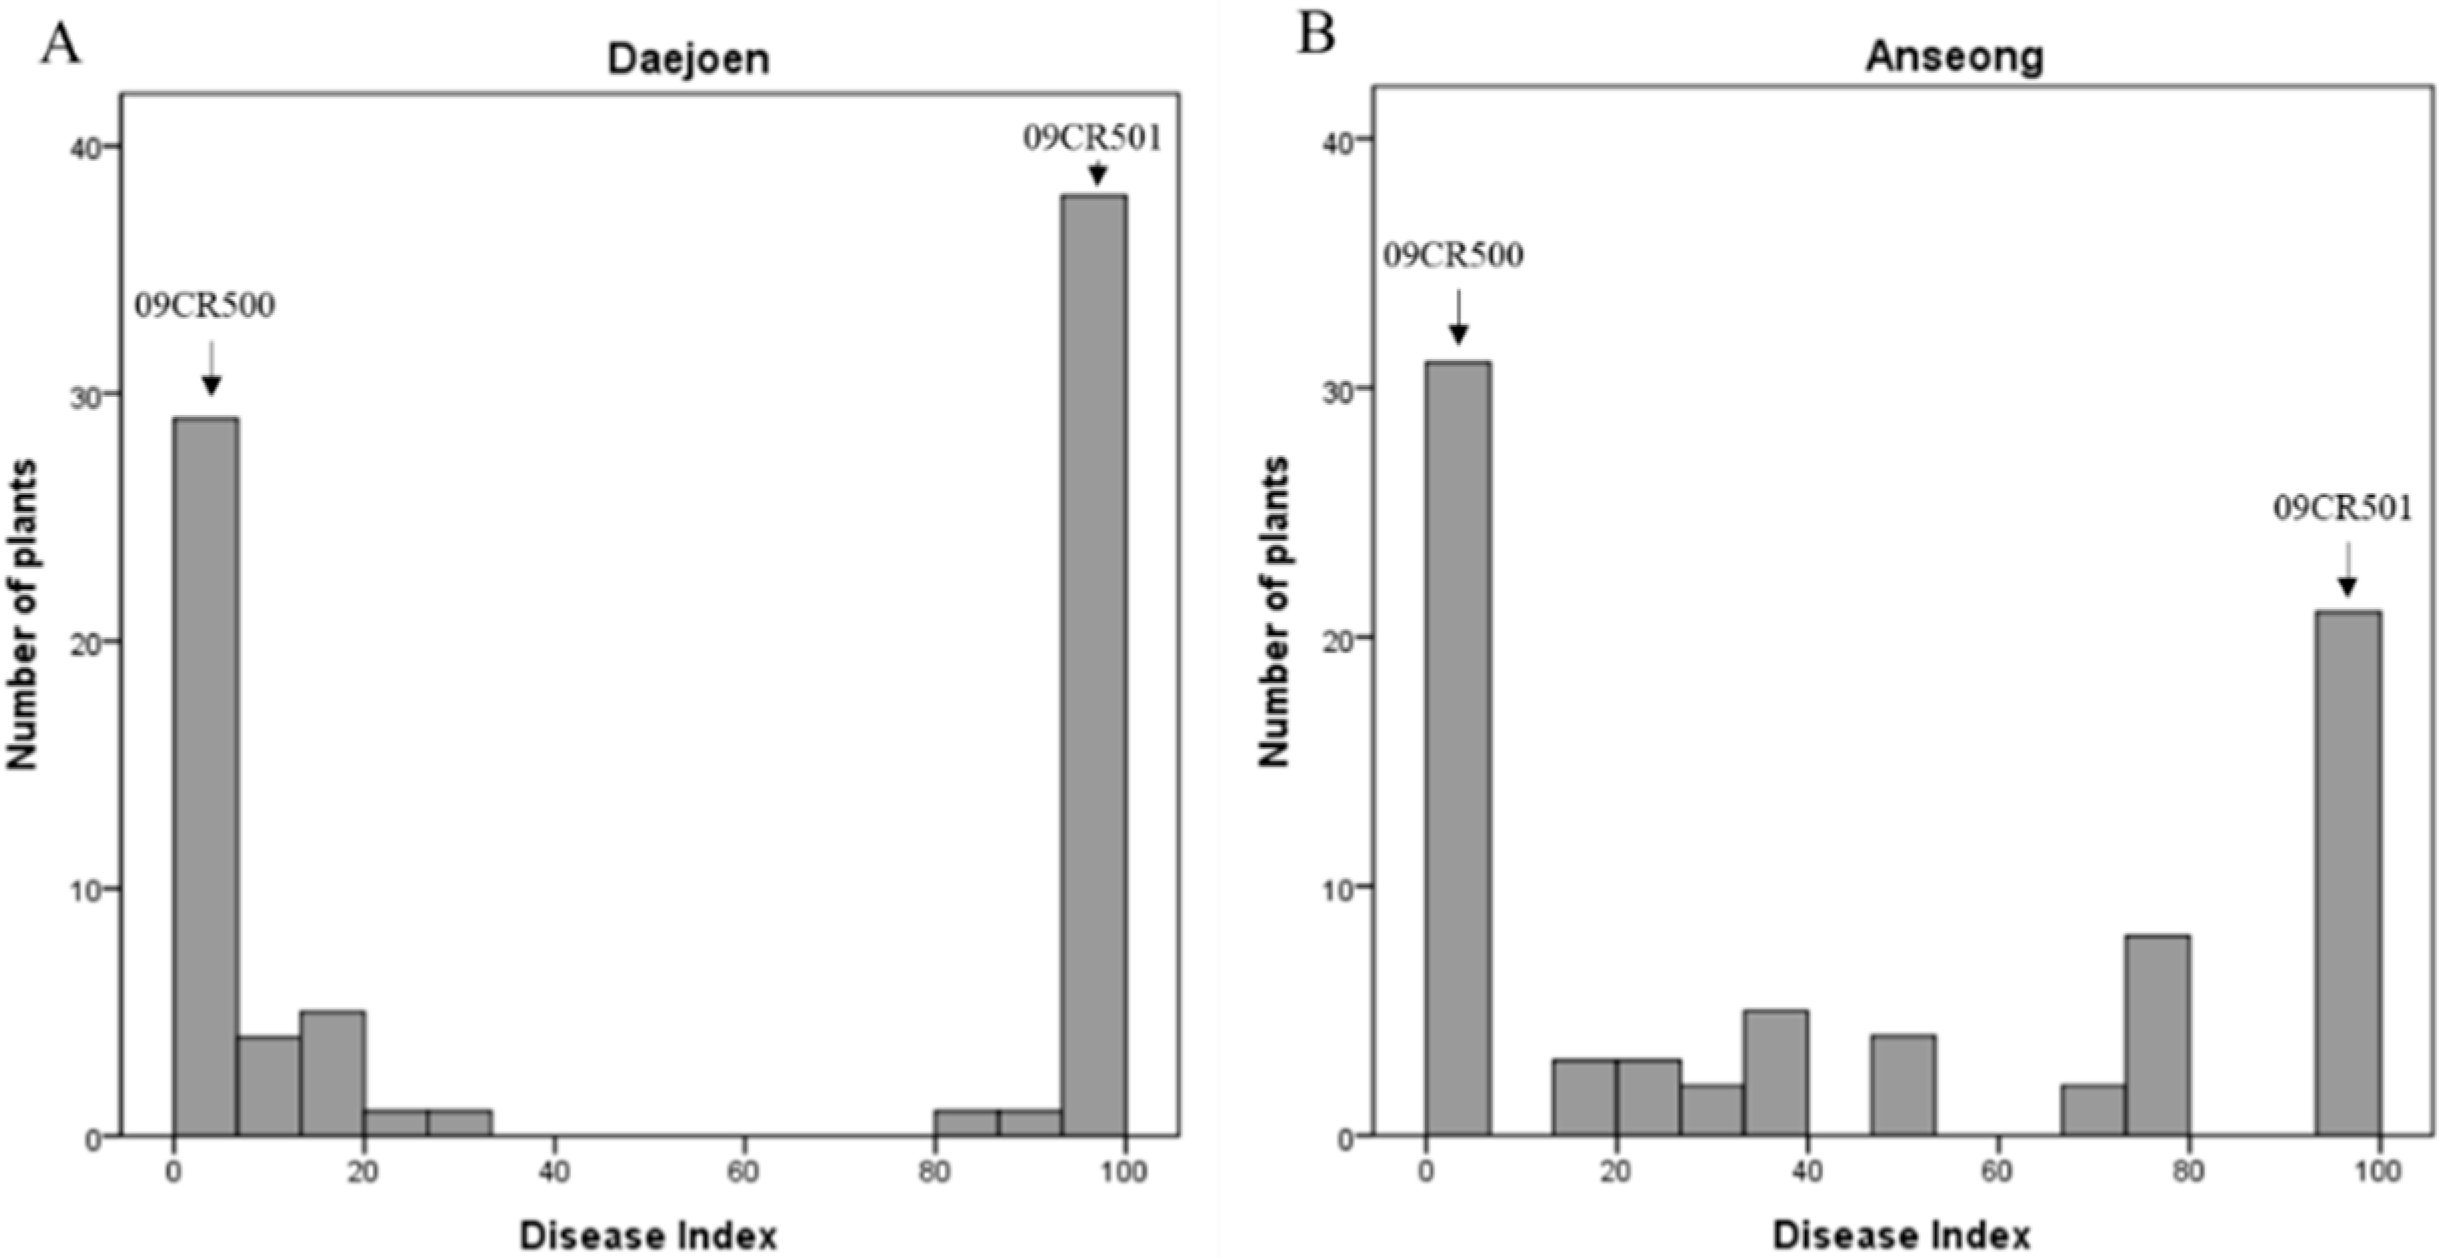
2.1. Inheritance of Clubroot Resistance in Line 09CR500

Clubroot resistance was evaluated in a doubled haploid (DH) population—including parental lines—over two years. The resistant line “09CR500” represents strong resistance, producing no symptoms in response to the Banglim pathotype, while “09CR501” shows severe symptoms, such as a high level of gall formation (Figure 1, Table S1). The F1 also presented the resistant phenotype. In the DH population, phenotypes ranged from “no symptoms” to “severe clubbing over all roots”. The overall phenotypic variation in the DH population exhibited a graph somewhat biased to the both ends (Figure 2). The segregation of resistance to susceptibility was close to a 1:1 ratio. This suggested that the resistance of ‘09CR500” was controlled by a single dominant gene (Table 1).

2.2. Whole-Genome Sequencing Analysis and Genetic Map Construction

We used previously reported markers in the construction of a genetic map with the ‘09CR.DH’ population (Table S2). To saturate the map, the resistant “09CR500” line’s genome was sequenced using Illumina HiSeq2500 (BGI Co. Ltd., China) with paired-ends and having an average insert size of ~500 bp. A total of 25.32 Gb of sequence (202.58 M reads) data was produced. After removing adapter reads and low-quality reads (unknown bases, N>5%), 23.18 Gb (202.11 M reads) remained, of which 92.19% were qualified as clean reads on the basis of Q30 (Table S3). The genome coverage was 43.81-fold, and ~94.10% of sequences were mapped (aligned) to the reference genome (v1.2), with an average depth of 87.06×. We predicted sequence variants in two genomes. Among the 2,401,195 single nucleotide polymorphisms (SNPs), only 77.8% was homozygous, even though ‘09CR500” is a DH line in which, theoretically, all the SNPs should be homozygous. There were 28,200 nonsynonymous SNPs in the coding region. In total, 595,678 insertions and deletions (InDel) were identified, with 44,291 being located in the coding region (Table S4).
A total of 808 primers were synthesized and used in screening for polymorphisms between parental lines, and 33.8% of the markers represented polymorphisms. Among diverse marker types, the primers designed with InDel variations as targets identified 68.75% of the polymorphisms (Table S2). All the primer and plant resource information is available in Table S2. Linkage map construction was performed using JoinMap v.4.1. Finally, 222 markers were assigned to 10 linkage groups (LGs), designated as A01–10. The total length of the genetic map was 731.7 cM, with an average distance of 4.4 cM between adjacent markers. The lengths of the LGs ranged from 29.3 for A01 to 131.2 cM for A09. The variation in the number of markers per chromosome ranged from 6 (A01) to 84 (A08) (Table S5). In the genetic map, most of the LGs had marker orders that were collinear to the physical map, with the exceptions of A07, A08, and A10.

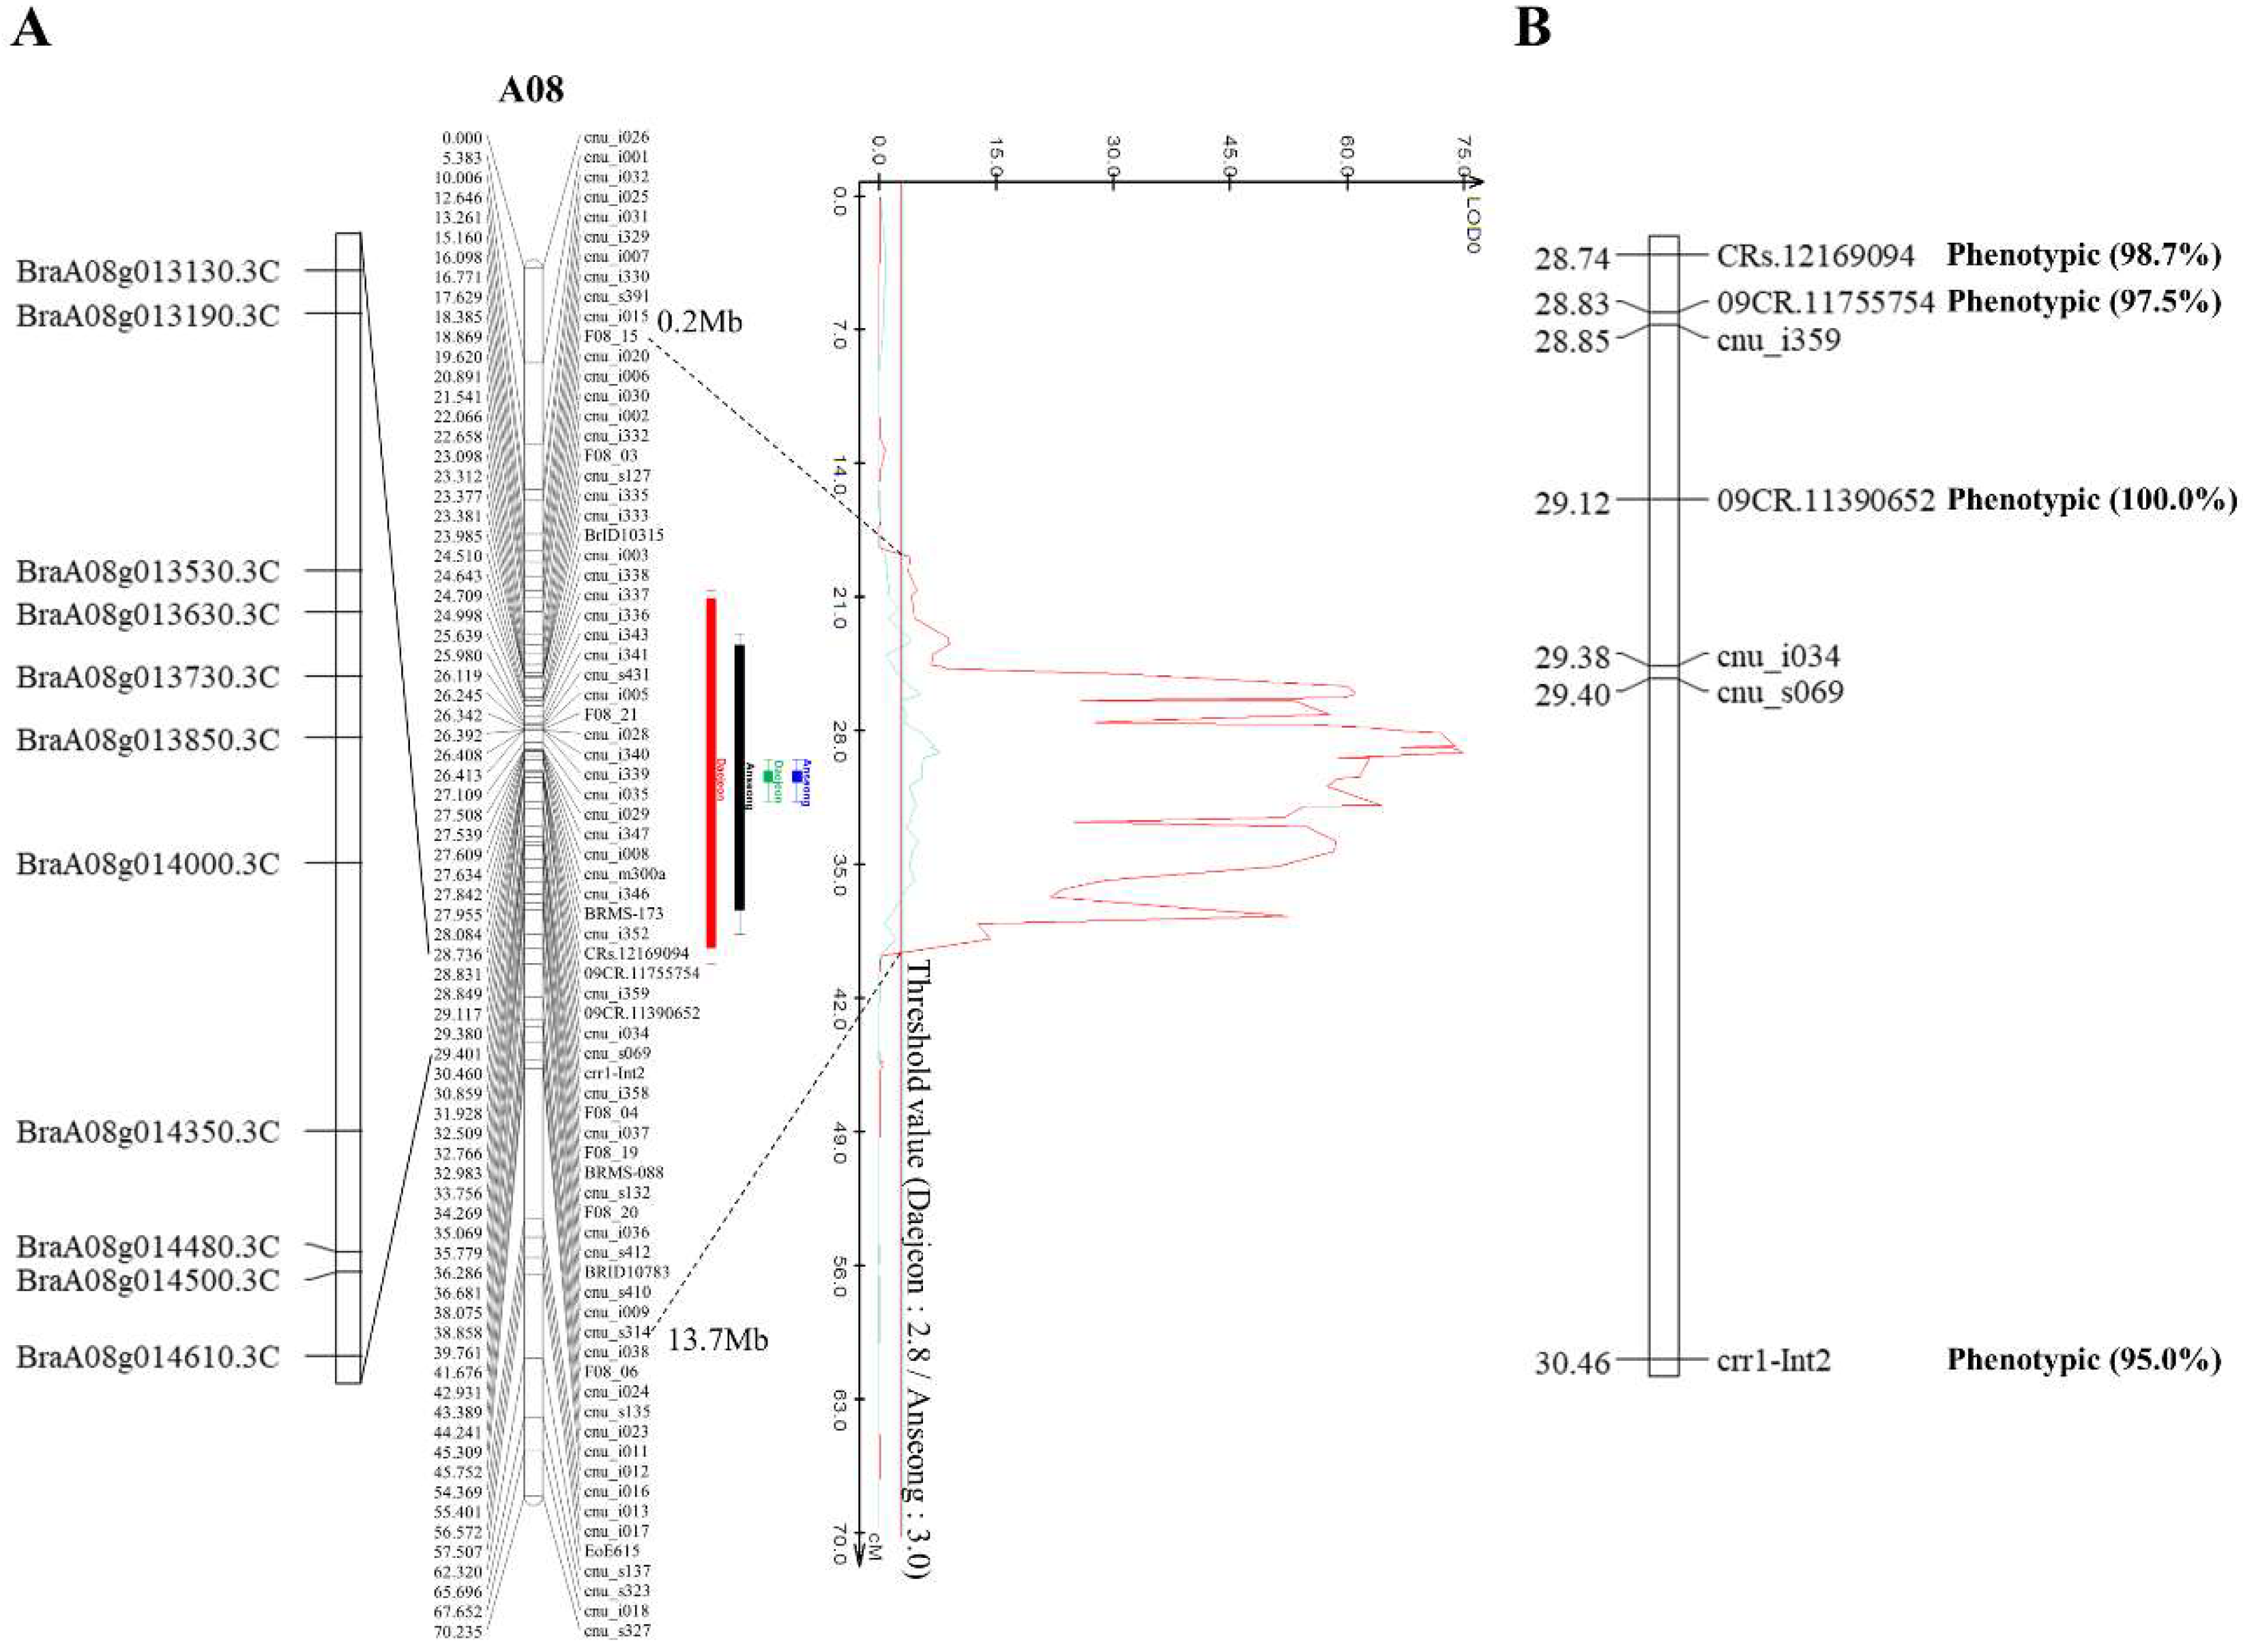
2.3. QTL Identification and Marker Development

To identify the genomic regions involved in the clubroot resistant phenotype, we analyzed the QTLs using WinQTL cartographer 2.5 and IciMapping 4.1 software. The WinQTL cartographer indicated two significant QTLs, named “PbBrA08Banglim-1” and “PbBrA08Banglim-2”, on the A08 chromosome in annual replications. PbBrA08Banglim-1” was detected in the region of 18.86 to 38.86 cM with a peak position at 29.12 cM in the flanking marker “09CR.11390652”. The logarithm of odds (LOD) value was 74.8, and the phenotypic variance was 97.1%. PbBrA08Banglim-2” was located in the internal region of PbBrA08Banglim-1. The phenotypic variation was 26.0%, and the LOD value was 7.9 (Figure 3A, Table 2). The other analyses identified by inclusive composite interval mapping (ICIM) confirmed that these loci were significantly involved in the resistant phenotype, as indicated by high peaks in a similar position in which the commonly overlapped QTL region spanned ~1 Mb, corresponding to the physical distance, and encompassed 153 genes as determined using the reference genome. On the basis of a functional annotation, 11 genes (7 TIR-NBS-LRR class and 4 F-box) were considered as potential genes responsible for resistance in this genomic region (Table 3).

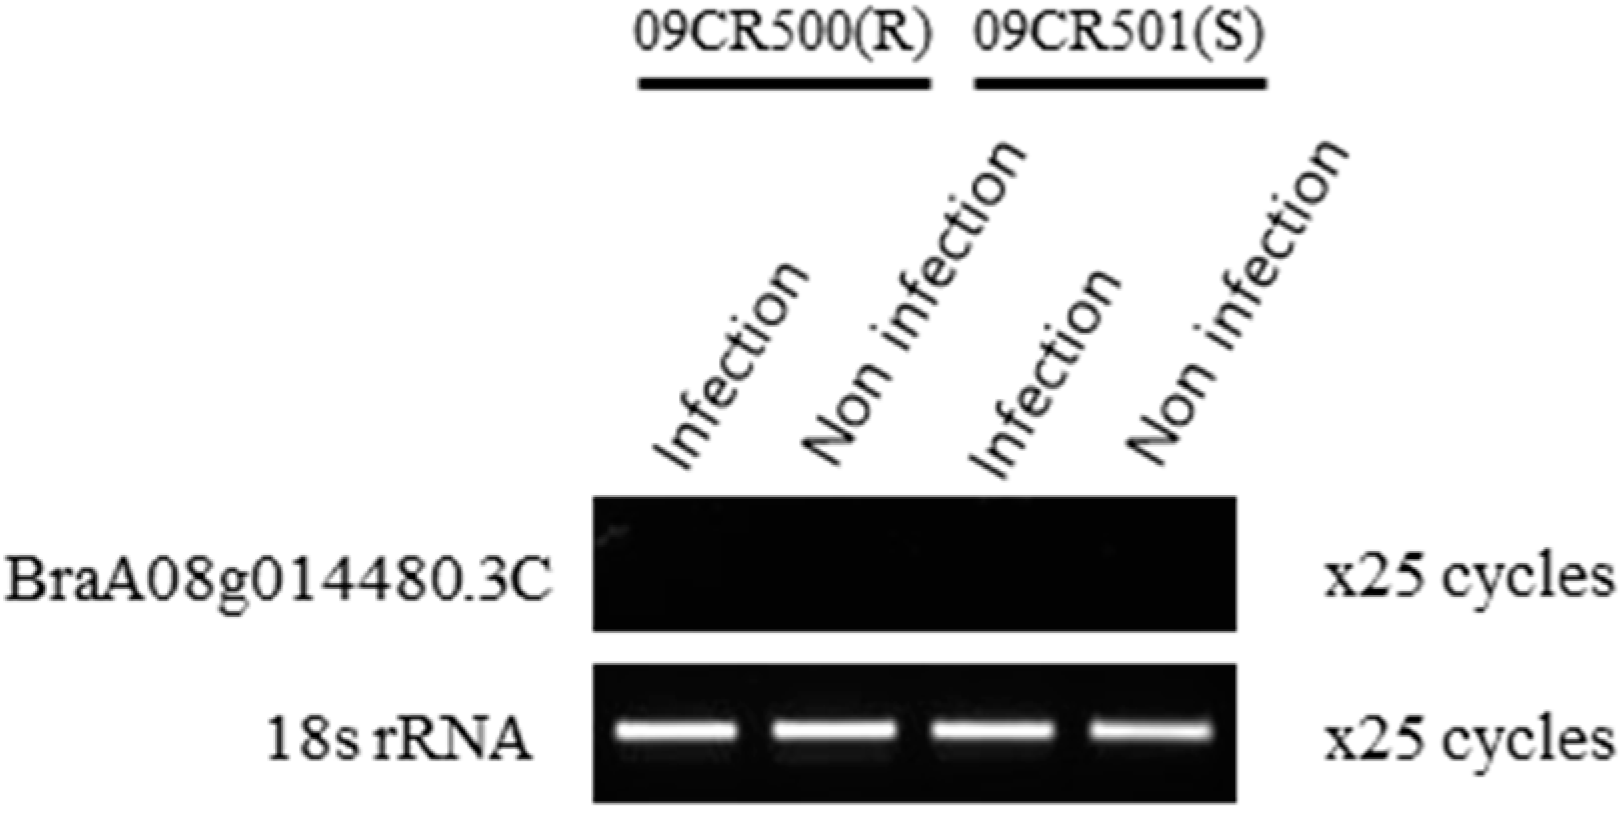
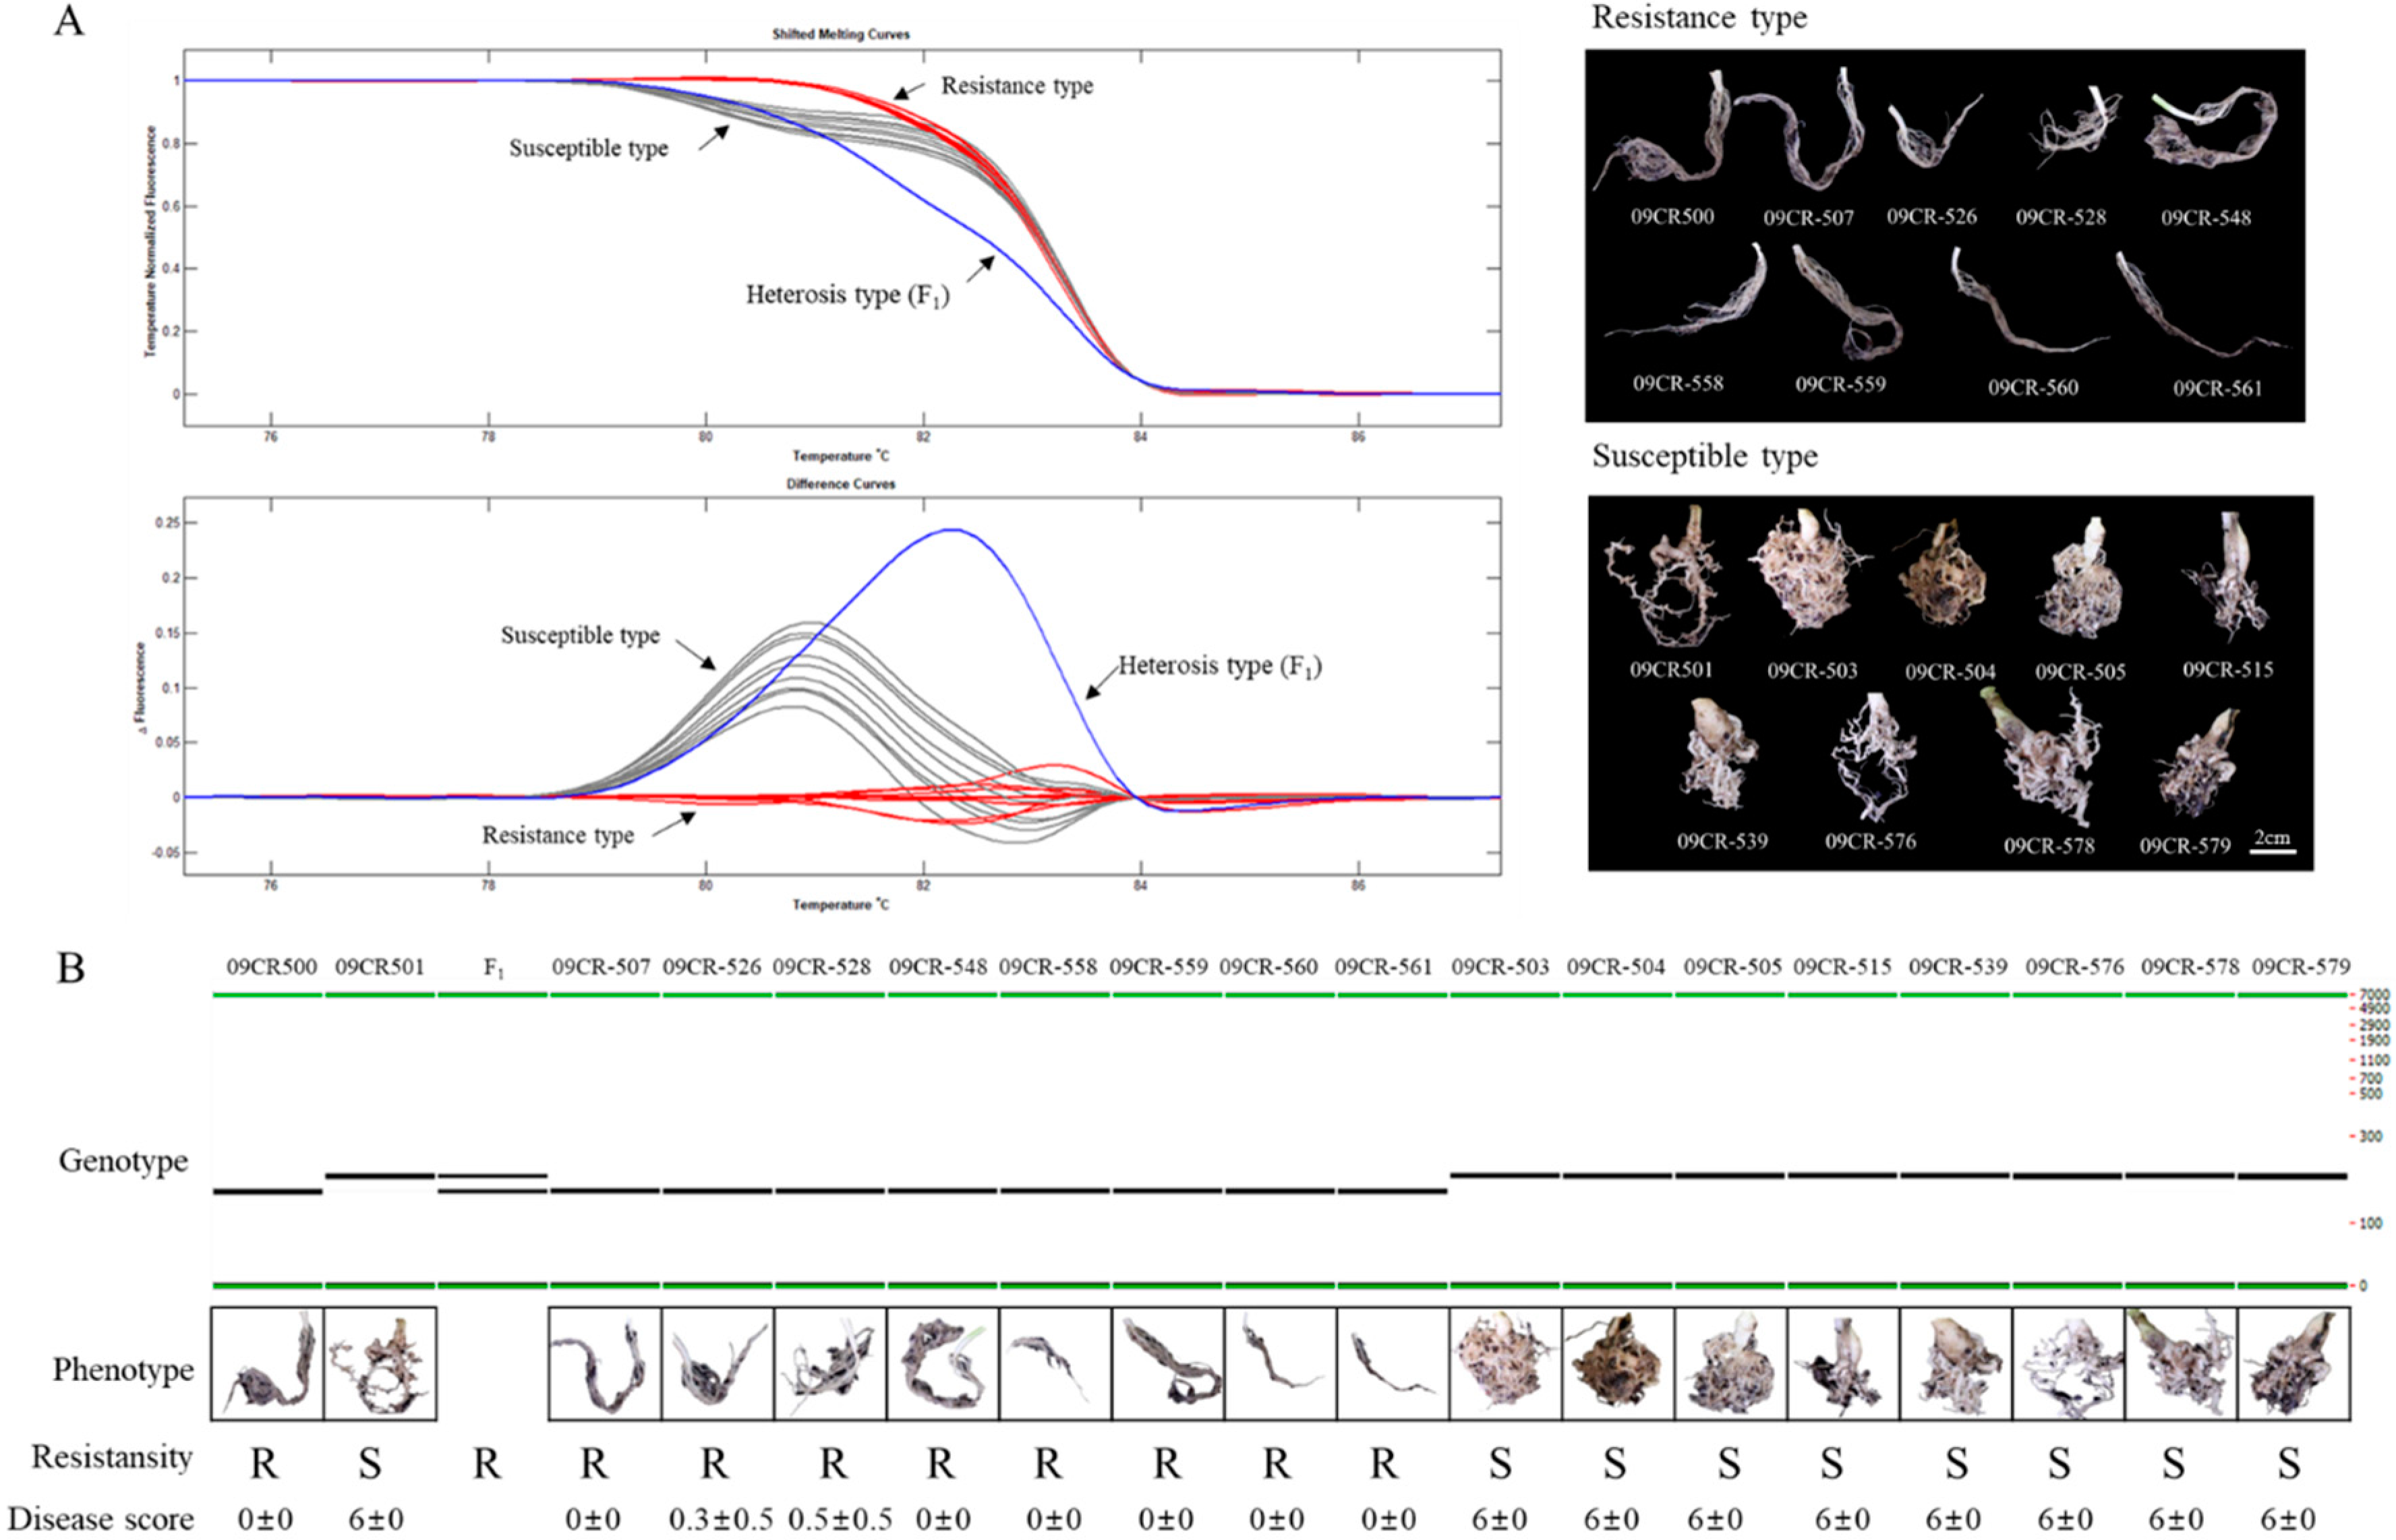
2.4. Validation of QTL Based on the Expression, High-Resolution Melting (HRM), and InDel Marker Analysis

To verify that PbBrA08Banglim is a novel locus, we compared the candidate gene sequence and expression levels with the previously reported three loci (Crr1a, Rcr9, CRs).
PbBrA08Banglim was detected on a region of A08 and encompasses several candidate genes considered to be potentially associated to the phenotype. Among these, BraA08g014480.3C (Bra020861 in v1.5) was the candidate gene for Crr1a loci. The expression analysis by semi-RT-PCR showed that BraA08g014480.3C gene was not expressed in “09CR500” and “09CR501” genotypes both before and after infection, suggesting this gene did not have a role in resistance phenomena. Semi-RT-PCR of the Crr1a candidate gene confirms that it does not explain the resistance effect of PbBrA08Banglim in “09CR500” against the Banglim pathotype.
We mentioned earlier in Section 2.3 that the PbBrA08Banglim locus contains the commonly overlapped QTL region (analyzed by WinQTL cartographer 2.5 and IciMapping 4.1), which spans ~1 Mb region. The investigation of sequence variation between the resistant inbred line “09CR-500” and susceptible reference genome “Chiifu” revealed that sequence variation occurred in 19,125 positions of which single nucleotide variation (SNV) = 15,739; deletion = 1,347; insertion = 1,873; replacement = 166. This region contains 11 candidate genes, of which two genes “BraA08g013190.3C” and ”BraA08g013630.3C” (Table 3) did not show any sequence variations between resistant and susceptible genotypes. Remaining 9 candidate genes showed 715 sequence variation sites. The primers for HRM analysis were designed to validate SNP variation in the PbBrA08Banglim locus, and genotyped with LightScanner System. For the InDel variation, the PCR amplicon was analyzed with LabChip® GX Touch™. We designed a total of 34 primers spanning sequence variations from 9 genes. After genotyping among these, two markers—one SNP (“09CR.11390652”) and another InDel and (“09CR.11755754”) markers—were found to be closely linked to the PbBrA08Banglim locus (Figure 3). Further, genotyping with these two markers successfully distinguished resistant or susceptible phenotypes of DH population (Figure 5). These results suggested the potential use of these markers in marker-assisted selection program in Brassica crops for clubroot resistance.

3. Discussion

3.1. PbBrA08Banglim Is a Stable Large-Effect QTL

In this study, we confirmed that the resistance of “09CR500” was controlled genetically by a single dominant gene based on the assessment of genetic inheritance in the DH population (Table 1). To dissect the clubroot resistance phenotype of “09CR500”, a genetic map was constructed. The total map length was 731.7 cM, containing 222 markers. Even though the number of markers was limited in the genetic map, it represented high genome coverage on the basis of genetic loci to physical positions, covering ~81.9% of the B. rapa reference genome. In particular, chromosome A08 had 95.2% coverage. Two robust QTLs, “PbBrA08Banglim-1” and “PbBrA08Banglim-2”, were detected on the A08 chromosome by two different methods (WinQTL cartographer 2.5 and IciMapping 4.1), which suggested that PbBrA08Banglim is a robust large-effect QTL involved in resistance (Table 2).
As a combination of resistant genome sequencing, we got the useful resources to develop markers, and the annotation information of genes in the QTL regions might be useful to interpret the resistant phenotype. Further, this data can be used as a resource to detect the resistance phenotypic plants.

3.2. RT-PCR and HRM Analysis Established the Novelty of the PbBrA08Banglim Locus

PbBrA08Banglim locus was mapped on a region of A08; adjacent to this particular region, multiple loci have been reported. Initially, Hatakayema et al. characterized Crr1a loci from A08 chromosome, encoding the TIR-NB-LRR gene for clubroot resistance [23]. Subsequently, another QTL “Rcr9” was detected on A08 using genotyping by sequencing approach [27] and a new clubroot resistant locus CRs was recently identified and mapped on A08 chromosome by ddRAD-seq method [28]. These reports indicate that this region is likely a disease resistance cluster. Interestingly, although our PbBrA08Banglim locus mapped to A08 chromosome, it differs from already reported loci from the same chromosome which was confirmed by RT-PCR, HRM, and detailed comparative gene analysis.
Crr1a was first reported in A08, which indicated that Bra020861 was a disease resistance gene by map-based cloning and characterized by transformation into Arabidopsis [23]. Therefore, to determine whether PbBrA08Banglim and Crr1a are similar or different, we performed a comparison of the “09CR500” genome sequence with G004 (Crr1a). A structural analysis demonstrated that “09CR500” encodes an NBS-LRR protein without the TIR domain, whereas Crr1a encodes TIR-NB-LRR protein [23]. Additionally, RT-PCR confirmed that the Crr1a candidate gene was not expressed in “09CR500” and “09CR501” before or after infection under the same conditions as the previous report [23] (Figure 4). A physical location comparison to the reference genome (V3.0) showed that marker “09CR11390652”, corresponding to PbBrA08Banglim, was located at 11.39 Mb, while a Crr1a-specific marker was located at 12.27 Mb (Table S6). These results confirmed that PbBrA08Banglim and Crr1a are not allelic.
Rcr9 was identified in “T19” using the genotyping-by-sequencing (GBS) method, and Bra020936 was designated as a candidate gene by sequence variations between resistant and susceptible plants to the pathotype 5X [27]. Interestingly, Bra020936 sequences (structure) in the resistant inbred “09CR500” genome were exactly the same as those in the reference genome Chiifu, which is susceptible to pathotype Banglim. This indicates that the Bra020936 gene is not responsible for providing resistance in “09CR500” genotype. In addition, a separate experiment was performed in which an Rcr9 locus-specific marker was used to assess “09CR500” and “09CR501”—a resistant and a susceptible type pool of DH population—and found that all of the samples were monomorphic and could not differentiate between resistant and susceptible phenotypes [28]. Overall, these observations indicated that Rcr9 was not able to explain the resistance effect of PbBrA08Banglim in “09CR500” to the pathotype Banglim and confirms that PbBrA08Banglim is entirely different from Rcr9 loci.
CRs, recently identified using ddRAD-seq, demonstrated that Bra020876 and Bra020918 were candidate genes for resistance to the pathotype Seosan and their encoded proteins were functionally annotated as LRRs. Four HRM markers were developed and were able to distinguish resistant and susceptible genotypes among the population [28]. To confirm that PbBrA08Banglim loci is contrasting with CRs locus, we firstly used these four available markers. Among these markers, two SNPs were polymorphic in “09CR500” and “09CR501”, and further genotyping of the DH population revealed that CRs markers are located adjacent to the “09CR.11390652” marker (Figure 3). Secondly, the genotyping analysis using “09CR.11390652” markers was able to precisely distinguish all of the phenotypes of the DH population in response to infection with the Banglim pathotype, but the population could not be distinguished using CRs markers (Figure 3 and Figure 5); this indicates that PbBrA08Banglim is different from CRs loci along with confirmed utilization of “09CR.11390652” in marker-assisted selection in breeding program. The HRM-based evaluation effectively grouped resistant genotypes together and also distinguished susceptible and resistant genotypes. Our HRM genotyping data is consistent with phenotypic data, which supports the idea that resistance of “09CR500” was controlled by a single dominant PbBrA08Banglim loci (Figure 5, Table 1). Thirdly, to verify whether PbBrA08Banglim loci of “09CR500” genotypes behave the same or different to the Seosan pathotype (responsible for CRs loci) [28], a pathogenicity response of “09CR500” against two pathotypes Seosan and Banglim were evaluated and found to be contrasting in nature. The “09CR500” showed resistance to Banglim pathotype but was susceptible to Seosan [28]. Thus, the resistance of PbBrA08Banglim from “09CR500” was not allelic to CRs.
Overall, these results suggest that PbBrA08Banglim is a novel locus and “09CR.11390652” will be accurately used to distinguish resistant and susceptible cultivars of Brassica in plant breeding program. The development of resistant cultivars is one of the efficient ways to control clubroot disease, maintain sustainable agriculture, and to increase productivity of Brassica crops.

4. Materials and Methods

4.1. Plant Materials

In this study, we used a double haploid (DH) mapping population (N = 81), named as “09CR-DH”, produced by microspore culturing and derived from a cross between “09CR500” and “09CR501”. Parent “09CR500” is a DH line derived from a progeny of a cross with ECD4 having a resistant phenotype to the local pathogen “Banglim”, which was classified as race 2 using Williams’ differential methods [46]. Line “09CR501” is susceptible to the pathotype “Banglim”, but it has the CRb loci, indicating a resistant phenotype to race 4 pathotypes as assessed by Williams’ differential methods [46].

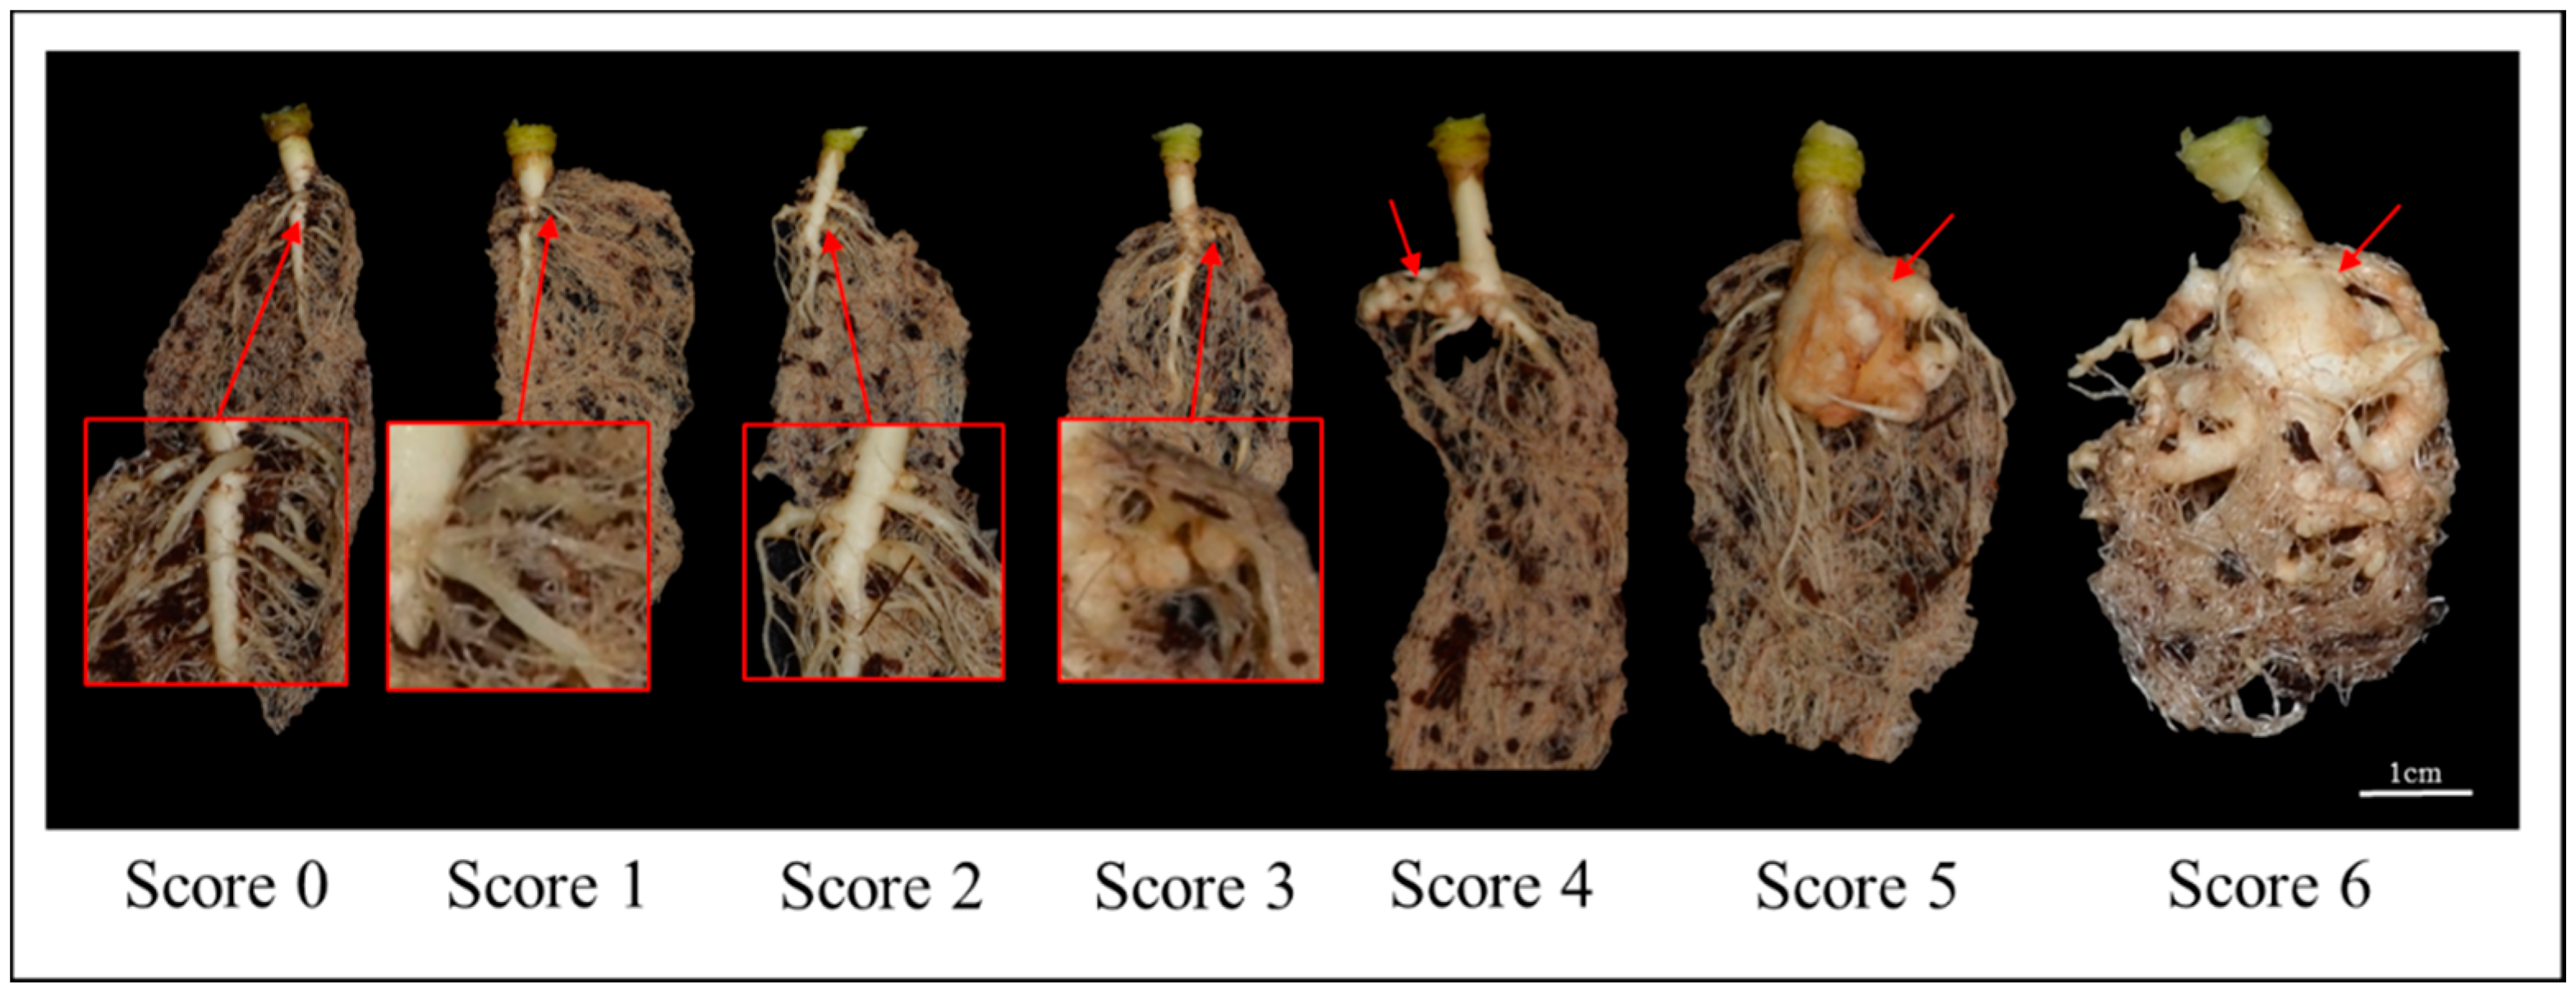
4.2. Pathogen Inoculation and Evaluation of Disease Symptoms

The P. brassicae pathotype “Banglim” is a local pathotype that was collected by a seed company (BioBreeding Co., Anseong, Korea) from an area in Korea (local name, Banglim) having a high incidence of severe Clubroot disease. To retain the unique pathogenicity of the “Banglim” pathotype, it was propagated by continuously infecting common Chinese cabbage. The classification of this pathotype was presented as race 2, as assessed by Williams’ differential hosts sets [46].
Phenotypic evaluations were performed in greenhouses at Anseong and Deajeon in two years—2009 and 2012—using 81 DH lines, including the 2 parental lines. To investigate clubroot symptoms in plants, an inoculum was prepared as a spore suspension of 2 × 10⁶ spores/mL, as determined by counting with a hemocytometer. Then, 5-mL spore suspension was used to inoculate 2-week-old seedlings using the irrigation method (injection into the soil). The symptoms of individuals were assessed in roots at 6 weeks post inoculation. A new evaluation standard, dependent on the severity of gall (club) formation, was used. It consisted of seven scales from 0 to 6 as follows: 0 = no symptoms; 1 = very slight swelling, usually confined to lateral roots; 2 = a few tiny, separate globular nodules on the lateral roots; 3 = several small-sized nodules on lateral roots; 4 = large clubs on lateral roots joining together to form a lump, and slight swelling of main roots; 5 = larger clubs on main roots; 6 = severe clubs (lumps) formation all over roots, and complete change of root morphology (Figure 1). Host responses were assessed as “resistance” phenotype if the average scale value of the plant line was equal to or less than 2.
To analyze QTLs, the scale values were converted to a disease index. It was calculated according to the following formula: disease index = [(n1 + 2n2 + … + 6n6)/NT × 6] ×100, where n2 through n6 represent the numbers of plants with symptoms and NT represents the total number of plants tested [9,47]. Additional phenotypic assays of the parental plants against pathotype “Seosan” were carried out at the Korean Research Institute of Chemical Technology following the protocols of Kim et al. [48] and Laila et al. [28]

4.3. Marker Development and Genotyping

We used previously reported single nucleotide polymorphic (SNP) markers that were used in map construction between “Chiifu” and “Kenshin” [49,50], and 106 newly developed primers targeting insertion and deletion (InDel) variations to construct a genetic map using the 09CR-DH population (Table S7). Additionally, some simple sequence repeat (SSRs) markers reported in Kim et al. [51] were used in this study to construct the genetic map frame. These marker sets were used as anchor markers to compare previous and current maps (Tables S7 and S2). To saturate the map, we performed “09CR500” genome sequencing with 30-fold Illumina sequence coverage using an Illumina Genome Analyzer-IIx system and paired-ends. To control sequence quality, low-quality reads were removed using fastqc. To ensure quality, the raw data were modified using the following steps: first, the adapter sequences in reads were deleted; second, reads that contained more than 50% low-quality bases (quality value ≤ 5) were removed. The clean reads were aligned to the reference genome using Bowtie2 [52], and then the BAM file was used to call SNPs and short InDel variations between the resequenced 09CR-500 and reference genomes using SAMtools and BCFtools [53,54]. The methods and parameters for identifying variations, such as SNPs and InDels, and designing the primers were previously reported by Pang et al. [49].
The nomenclature for the new markers followed the Bakus–Naur form described in Marcotty and Ledgard [55]: <3-letter institute code>_<single letter marker assay type designator>< MARKER ASSAY NAME>. The institute code “cnu” represents Chungnam National University, and the single letter marker assay type designators are those published by De Vicente et al. [56]. Those used here are “m” representing SSR, “s” representing SNP, and “i” representing InDel.
The genotyping of SNPs was performed using two methods: the LightScanner System (Idaho Technologies, Salt Lake City, UT, USA), based on a high-resolution melting (HRM) analysis, performed in accordance with Pang et al. [49] and Li et al. [57]; and the Fluidigm® EP1™ system using 96.96 Dynamic Array™ IFC (Fluidigm, South San Francisco, CA, USA), performed in accordance with Choi et al. [50], in which markers were named as <F-two digit code representing chromosome number>_<two digit code representing order of markers beginning to end on chromosome>. The PCR amplification was followed as an initial denaturation of 94 °C for 4 min, 35 cycles of 94 °C for 30 s, 55 °C for 30 s, and 72 °C for 30~60 s, followed by a final extension of 72 °C for 5 min. To perform comparisons with the previous loci, analyses of markers linked to previously identified Clubroot disease loci/genes (Crr1a, Crr2, Crr4, CRc, CRk, CRs, CRa, Crr3, PbBa3.1, PbBa3.3, and CRb) [13,22,23,28,58,59,60,61,62], which had already been mapped to the B. rapa A-genome chromosomes, were used to screen for polymorphisms in the parental lines (Table S8). The PCR amplification was followed as an initial denaturation of 94 °C for 4 min, 35 cycles of 94 °C for 30 s, the appropriate annealing temperatures for each primer pair for 30 s, 72 °C for 30~60 s, followed by a final extension of 72 °C for 5 min. PCR products were resolved by capillary electrophoresis using LabChip® GX Touch™ (PerkinElmer, Waltham, MA, USA) and an HT DNA 1K LabChip® kit (PerkinElmer, Waltham, MA, USA), or analyzed on 6% polyacrylamide gel electrophoresis.

4.4. Genetic Map Construction and QTL Analysis

Linkage map construction was performed using JoinMap version 4.0 [63,64]. Linked loci were grouped using a logarithm of odds (LOD) grouping threshold, ranging from 2.0 to 3.0, and linkage groups (LGs) were assigned to 10 chromosomes. Locus order within the LOD groupings were generated for each LG using the following criteria: a recombination frequency smaller than 0.4 and an LOD larger than 1 for all marker pairs within each LG. Recombination frequencies were converted to centiMorgans (cM) using Kosambi’s method for map distance calculation [65], and the genetic map was drawn using MapChart [66].
For the QTL analysis, WinQTL cartographer 2.5 software using the composite interval mapping (CIM) was employed [67]. The walking speed for all QTLs was 1.0 cM, and the P-value inclusion threshold was 0.05. The threshold LOD scores were calculated using 1000 permutations [68,69]. To validate false-positive QTLs, we performed additional analysis with IciMapping 4.1 to detect putative QTLs [70].
To validate false-positive QTLs, we performed additional analysis with IciMapping 4.1 and confirmed that detection of QTLs is reproduced [66]. The missing phenotypic data were deleted using the “Deletion” command. For scanning of QTL, a step of 1 cM was used. The LOD threshold used to declare significant QTL was calculated using the 1000-permutation test with a type I error of 0.05 [68,69].

4.5. Annotation of Candidate Genes

To predict candidate genes in the QTL region, the putative functions of genes were obtained from the Brassica database (BRAD), which is based on genome version 3.0 [71]. The domains of candidate genes were annotated by performing a sequence analysis of the reference genome from the P-fam database using CLC genomic workbench 12.0.2 (CLC bio, Aarhus, Denmark) with a significance cutoff of 1.5.

4.6. Conversion of Physical Location to BRAD Version 3.0

The SNP data information generated using BRAD v1.2 were further converted to the advanced reference genome v3.0 [71] to compare positions and annotations. The data were annotated to the reference genome v3.0 using binding sites of primer sets with CLC genomic workbench 12.0.2 (CLC bio, Aarhus, Denmark).

4.7. Semiquantitative RT-PCR Analysis

To confirm that the newly identified locus was novel and different from the adjacent resistance loci Crr1, Rcr9, and CRs [23,27,28], semiquantitative RT-PCR was performed. For reverse transcription (RT)-PCR, total RNA was extracted from plants using an RNeasy Plant Mini Kit (Qiagen, Hilden, Germany). Specifically, 2-week-old plants were inoculated with the Banglim pathogen and after 2 weeks, the roots were sampled. RNA quality was measured on a NanoDrop 2000 (Thermo Scientific, Wilmington, DE, USA). Then, 1 μg of total RNA was reverse transcribed using TOPscript™ RT DryMIX (dT18 plus) (Enzynomics, Daejeon, Korea) in accordance with the manufacturer’s instructions. The gene-specific primers were selected following the method of Hatakeyama et al. [23], and we used 18s rRNA gene-specific primers as a control [72]. The synthesized cDNAs were used as templates for PCR amplification with AccuPower PCR PreMix (Bioneer, Deajeon, Korea) and the following conditions: 95 °C for 5 min; 25 cycles of 95 °C for 20 s, 55 °C for 30 s, and 72 °C for 1 min; followed by a final extension of 72 °C for 5 min. Amplified PCR products were electrophoresed on a 1.5% agarose gel.

5. Conclusions

The prime aim of this study was to identify Banglim pathogen-specific resistant loci in B. rapa. To achieve this goal, we compared the candidate genes sequences of newly identified QTL regions with those of a previous report using whole-genome sequencing of resistant line “09CR500”. The QTL analysis mapped a novel locus PbBrA08Banglim for Banglim pathotype resistance on chromosome A08. This locus exhibited structural differences and expression variations compared with earlier reported QTLs, and the plant’s responses to the pathotype were also found to be different, suggesting that PbBrA08Banglim is a novel resistance loci to Banglim. The results of this study add to the available genetic information that can be used to elucidate the genetic mechanism of clubroot resistance. The newly developed marker “09CR.11390652” for PbBrA08Banglim will be beneficial in Brassica breeding programs for Banglim pathotype-specific resistance and gene pyramiding by allowing accurate phenotype selection.

Supplementary Materials

The following are available online at https://www.mdpi.com/1422-0067/21/11/4157/s1, Table S1. Phenotypic trait values of parental lines and the DH population. Table S2. Marker information used to construct linkage map. Table S3. Summary of B. rapa genome sequencing data. Table S4. Distributions of total SNPs and InDels. Table S5. The B. rapa genetic map developed in the present study. Table S6. Clubroot linkage and marker information used on chromosome A08. Table S7. Primer information for this study. Table S8. Clubroot linkage and gene marker information used in the DH population.

Author Contributions

S.R.C. designed the experiment for this study. S.H.O. did the marker development and V.D. analyzed the sequence data to identify variation. S.H.O. and C.Y.L. did experiment such as marker genotyping and RT-PCR. S.H.O. and J.J.R. and Y.M. conducted the sampling and disease phenotypic investigation in population against pathotype Banglim. S.R.C., S.H.O. did data analysis and wrote the manuscript. S.R.C., S.S.C. discussed and interpreted the results and improvised the manuscript. G.J.C. helped phenotypic investigation of parental lines against Seo-san pathotype. S.-S.L. provided the plant materials and Banglim pathotype. Y.P.L. supervised the study. All authors have read and agreed to the published version of the manuscript.

Funding

This work was supported by research fund of Chungnam National University. This work was supported by Korea Institute of Planning and Evaluation for Technology in Food, Agriculture, and Forestry (IPET) through Golden Seed Project (213006-05-4-SB110), funded by Ministry of Agriculture, Food and Rural Affairs (MAFRA), Ministry of Oceans and Fisheries (MOF), Rural Development Administration (RDA) and Korea Forest Services (KFS).

Conflicts of Interest

The authors declare no conflict of interest.

Abbreviations

QTLQuantitative trait loci
DHDoubled haploid
LGLinkage group
SNPSingle nucleotide polymorphism
InDelInsertion and deletion
LODLogarithm of odds
CIMComposite interval mapping
ICIMInclusive composite interval mapping
TIRToll interleukin-1 receptor
NBSNucleotide binding site
LRRLeucine-rich repeat
RT-PCRReal-time polymerase chain reaction

References

  1. dos Santos Isaias, R.M.; de Oliveira, D.C.; da Silva Carneiro, R.G.; Kraus, J.E. Developmental anatomy of galls in the Neotropics: Arthropods stimuli versus host plant constraints. In Neotropical Insect Galls; Springer: Berlin, Germany, 2014; pp. 15–34. [Google Scholar]
  2. Walerowski, P.; Gündel, A.; Yahaya, N.; Truman, W.; Sobczak, M.; Olszak, M.; Rolfe, S.; Borisjuk, L.; Malinowski, R. Clubroot disease stimulates early steps of phloem differentiation and recruits SWEET sucrose transporters within developing galls. The Plant Cell 2018, 30, 3058–3073. [Google Scholar]
  3. Donald, C.; Porter, I. Integrated control of clubroot. J. Plant Growth Regul. 2009, 28, 289. [Google Scholar]
  4. Zhang, X.-Z.; Lee, S.-U.; Kim, J.-S.; Yoon, Y.-S.; Choi, G.-S.; Kim, H.-K.; Kim, B.-S. Control Efficacy of Flusulfamide GR on Chinese Cabbage Clubroot Caused by Plasmodiophora brassicae. Res. Plant Dis. 2005, 11, 43–47. [Google Scholar]
  5. Peng, G.; Lahlali, R.; Hwang, S.-F.; Pageau, D.; Hynes, R.K.; McDonald, M.R.; Gossen, B.D.; Strelkov, S.E. Crop rotation, cultivar resistance, and fungicides/biofungicides for managing clubroot (Plasmodiophora brassicae) on canola. Can. J. Plant Pathol. 2014, 36, 99–112. [Google Scholar]
  6. Wallenhammar, A.C. Prevalence of Plasmodiophora brassicae in a spring oilseed rape growing area in central Sweden and factors influencing soil infestation levels. Plant Pathol. 1996, 45, 710–719. [Google Scholar]
  7. Diederichsen, E.; Frauen, M.; Linders, E.G.; Hatakeyama, K.; Hirai, M. Status and perspectives of clubroot resistance breeding in crucifer crops. J. Plant Growth Regul. 2009, 28, 265–281. [Google Scholar]
  8. Kulwal, P.; Thudi, M.; Varshney, R. Crop breeding for sustainable agriculture, genomics interventions in. In Sustainable Food Production; Springer: New York, NY, USA, 2013. [Google Scholar]
  9. Diederichsen, E.; Sacristan, M. Disease response of resynthesized Brassica napus L. lines carrying different combinations of resistance to Plasmodiophora brassicae Wor. Plant Breed. 1996, 115, 5–10. [Google Scholar]
  10. Neik, T.X.; Barbetti, M.J.; Batley, J. Current status and challenges in identifying disease resistance genes in Brassica napus. Front. Plant Sci. 2017, 8, 1788. [Google Scholar]
  11. Diederichsen, E.; Beckmann, J.; Schondelmeier, J.; Dreyer, F. Genetics of clubroot resistance in Brassica napus ’Mendel’. Acta Hortic. 2006, 307–311. [Google Scholar]
  12. Zhang, H.; Feng, J.; Hwang, S.F.; Strelkov, S.; Falak, I.; Huang, X.; Sun, R. Mapping of clubroot (Plasmodiophora brassicae) resistance in canola (Brassica napus). Plant Pathol. 2016, 65, 435–440. [Google Scholar]
  13. Chen, J.; Jing, J.; Zhan, Z.; Zhang, T.; Zhang, C.; Piao, Z. Identification of novel QTLs for isolate-specific partial resistance to Plasmodiophora brassicae in Brassica rapa. PLoS ONE 2013, 8, e85307. [Google Scholar]
  14. Crute, I.; Phelps, K.; Barnes, A.; Buczacki, S.; Crisp, P. The relationship between genotypes of three Brassica species and collections of Plasmodiophora brassicae. Plant Pathol. 1983, 32, 405–420. [Google Scholar]
  15. Crisp, P.; Crute, I.; Sutherland, R.; Angell, S.; Bloor, K.; Burgess, H.; Gordon, P. The exploitation of genetic resources of Brassica oleracea in breeding for resistance to clubroot (Plasmodiophora brassicae). Euphytica 1989, 42, 215–226. [Google Scholar]
  16. Matsumoto, E.; Yasui, C.; Ohi, M.; Tsukada, M. Linkage analysis of RFLP markers for clubroot resistance and pigmentation in Chinese cabbage (Brassica rapa ssp. pekinensis). Euphytica 1998, 104, 79. [Google Scholar]
  17. Piao, Z.; Deng, Y.; Choi, S.; Park, Y.; Lim, Y. SCAR and CAPS mapping of CRb, a gene conferring resistance to Plasmodiophora brassicae in Chinese cabbage (Brassica rapa ssp. pekinensis). Theor. Appl. Genet. 2004, 108, 1458–1465. [Google Scholar]
  18. Kato, T.; Hatakeyama, K.; Fukino, N.; Matsumoto, S. Fine mapping of the clubroot resistance gene CRb and development of a useful selectable marker in Brassica rapa. Breed. Sci. 2013, 63, 116–124. [Google Scholar]
  19. Sakamoto, K.; Saito, A.; Hayashida, N.; Taguchi, G.; Matsumoto, E. Mapping of isolate-specific QTLs for clubroot resistance in Chinese cabbage (Brassica rapa L. ssp. pekinensis). Theor. Appl. Genet. 2008, 117, 759–767. [Google Scholar]
  20. Pang, W.; Fu, P.; Li, X.; Zhan, Z.; Yu, S.; Piao, Z. Identification and mapping of the Clubroot resistance gene CRd in Chinese cabbage (Brassica rapa L. ssp. pekinensis). Front. Plant Sci. 2018, 9, 653. [Google Scholar]
  21. Suwabe, K.; Tsukazaki, H.; Iketani, H.; Hatakeyama, K.; Fujimura, M.; Nunome, T.; Fukuoka, H.; Matsumoto, S.; Hirai, M. Identification of two loci for resistance to clubroot (Plasmodiophora brassicae Woronin) in Brassica rapa L. Theor. Appl. Genet. 2003, 107, 997–1002. [Google Scholar]
  22. Suwabe, K.; Tsukazaki, H.; Iketani, H.; Hatakeyama, K.; Kondo, M.; Fujimura, M.; Nunome, T.; Fukuoka, H.; Hirai, M.; Matsumoto, S. Simple sequence repeat-based comparative genomics between Brassica rapa and Arabidopsis thaliana: The genetic origin of clubroot resistance. Genetics 2006, 173, 309–319. [Google Scholar]
  23. Hatakeyama, K.; Suwabe, K.; Tomita, R.N.; Kato, T.; Nunome, T.; Fukuoka, H.; Matsumoto, S. Identification and characterization of Crr1a, a gene for resistance to clubroot disease (Plasmodiophora brassicae Woronin) in Brassica rapa L. PLoS ONE 2013, 8, e54745. [Google Scholar]
  24. Hirai, M.; Harada, T.; Kubo, N.; Tsukada, M.; Suwabe, K.; Matsumoto, S. A novel locus for clubroot resistance in Brassica rapa and its linkage markers. Theor. Appl. Genet. 2004, 108, 639–643. [Google Scholar]
  25. Nguyen, M.; Monakhos, G.; Komakhin, R.; Monakhos, S. The new Clubroot resistance locus is located on chromosome A05 in Chinese cabbage (Brassica rapa L.). Russ. J. Genet. 2018, 54, 296–304. [Google Scholar]
  26. Chu, M.; Song, T.; Falk, K.C.; Zhang, X.; Liu, X.; Chang, A.; Lahlali, R.; McGregor, L.; Gossen, B.D.; Yu, F. Fine mapping of Rcr1 and analyses of its effect on transcriptome patterns during infection by Plasmodiophora brassicae. BMC Genom. 2014, 15, 1166. [Google Scholar]
  27. Yu, F.; Zhang, X.; Peng, G.; Falk, K.C.; Strelkov, S.E.; Gossen, B.D. Genotyping-by-sequencing reveals three QTL for clubroot resistance to six pathotypes of Plasmodiophora brassicae in Brassica rapa. Sci. Rep. 2017, 7, 4516. [Google Scholar]
  28. Laila, R.; Park, J.I.; Robin, A.H.K.; Natarajan, S.; Vijayakumar, H.; Shirasawa, K.; Isobe, S.; Kim, H.T.; Nou, I.S. Mapping of a novel clubroot resistance QTL using ddRAD-seq in Chinese cabbage (Brassica rapa L.). BMC Plant Biol. 2019, 19, 13. [Google Scholar]
  29. Nagaoka, T.; Doullah, M.; Matsumoto, S.; Kawasaki, S.; Ishikawa, T.; Hori, H.; Okazaki, K. Identification of QTLs that control clubroot resistance in Brassica oleracea and comparative analysis of clubroot resistance genes between B. rapa and B. oleracea. Theor. Appl. Genet. 2010, 120, 1335–1346. [Google Scholar]
  30. Lee, J.; Izzah, N.K.; Choi, B.-S.; Joh, H.J.; Lee, S.-C.; Perumal, S.; Seo, J.; Ahn, K.; Jo, E.J.; Choi, G.J. Genotyping-by-sequencing map permits identification of clubroot resistance QTLs and revision of the reference genome assembly in cabbage (Brassica oleracea L.). DNA Res. 2016, 23, 29–41. [Google Scholar]
  31. Dakouri, A.; Zhang, X.; Peng, G.; Falk, K.C.; Gossen, B.D.; Strelkov, S.E.; Yu, F. Analysis of genome-wide variants through bulked segregant RNA sequencing reveals a major gene for resistance to Plasmodiophora brassicae in Brassica oleracea. Sci. Rep. 2018, 8, 1–10. [Google Scholar]
  32. Nomura, K.; Minegishi, Y.; Kimizuka-Takagi, C.; Fujioka, T.; Moriguchi, K.; Shishido, R.; Ikehashi, H. Evaluation of F2 and F3 plants introgressed with QTLs for clubroot resistance in cabbage developed by using SCAR markers. Plant Breed. 2005, 124, 371–375. [Google Scholar]
  33. Peng, L.; Zhou, L.; Li, Q.; Wei, D.; Ren, X.; Song, H.; Mei, J.; Si, J.; Qian, W. Identification of quantitative trait loci for clubroot resistance in Brassica oleracea with the use of Brassica SNP microarray. Front. Plant Sci. 2018, 9, 822. [Google Scholar]
  34. Chang, A.; Lamara, M.; Wei, Y.; Hu, H.; Parkin, I.A.; Gossen, B.D.; Peng, G.; Yu, F. Clubroot resistance gene Rcr6 in Brassica nigra resides in a genomic region homologous to chromosome A08 in B. rapa. BMC Plant Biol. 2019, 19, 224. [Google Scholar]
  35. Manzanares-Dauleux, M.; Delourme, R.; Baron, F.; Thomas, G. Mapping of one major gene and of QTLs involved in resistance to clubroot in Brassica napus. Theor. Appl. Genet. 2000, 101, 885–891. [Google Scholar]
  36. Hejna, O.; Havlickova, L.; He, Z.; Bancroft, I.; Curn, V. Analysing the genetic architecture of clubroot resistance variation in Brassica napus by associative transcriptomics. Mol. Breed. 2019, 39, 112. [Google Scholar]
  37. Werner, S.; Diederichsen, E.; Frauen, M.; Schondelmaier, J.; Jung, C. Genetic mapping of clubroot resistance genes in oilseed rape. Theor. Appl. Genet. 2008, 116, 363–372. [Google Scholar]
  38. Li, L.; Luo, Y.; Chen, B.; Xu, K.; Zhang, F.; Li, H.; Huang, Q.; Xiao, X.; Zhang, T.; Hu, J. A genome-wide association study reveals new loci for resistance to clubroot disease in Brassica napus. Front. Plant Sci. 2016, 7, 1483. [Google Scholar]
  39. Kamei, A.; Tsuro, M.; Kubo, N.; Hayashi, T.; Wang, N.; Fujimura, T.; Hirai, M. QTL mapping of clubroot resistance in radish (Raphanus sativus L.). Theor. Appl. Genet. 2010, 120, 1021–1027. [Google Scholar]
  40. Gan, C.; Deng, X.; Cui, L.; Yu, X.; Yuan, W.; Dai, Z.; Yao, M.; Pang, W.; Ma, Y.; Yu, X. Construction of a high-density genetic linkage map and identification of quantitative trait loci associated with clubroot resistance in radish (Raphanus sativus L.). Mol. Breed. 2019, 39, 116. [Google Scholar]
  41. Varshney, R.K. Exciting journey of 10 years from genomes to fields and markets: Some success stories of genomics-assisted breeding in chickpea, pigeonpea and groundnut. Plant Sci. 2016, 242, 98–107. [Google Scholar]
  42. Varshney, R.K.; Nayak, S.N.; May, G.D.; Jackson, S.A. Next-generation sequencing technologies and their implications for crop genetics and breeding. Trends Biotechnol. 2009, 27, 522–530. [Google Scholar]
  43. Bolger, M.E.; Weisshaar, B.; Scholz, U.; Stein, N.; Usadel, B.; Mayer, K.F. Plant genome sequencing—applications for crop improvement. Curr. Opin. Biotech. 2014, 26, 31–37. [Google Scholar]
  44. Yang, Z.; Huang, D.; Tang, W.; Zheng, Y.; Liang, K.; Cutler, A.J.; Wu, W. Mapping of quantitative trait loci underlying cold tolerance in rice seedlings via high-throughput sequencing of pooled extremes. PLoS ONE 2013, 8, e68433. [Google Scholar]
  45. Zhu, J.; Chen, J.; Gao, F.; Xu, C.; Wu, H.; Chen, K.; Si, Z.; Yan, H.; Zhang, T. Rapid mapping and cloning of the virescent-1 gene in cotton by bulked segregant analysis–next generation sequencing and virus-induced gene silencing strategies. J. Exp. Bot. 2017, 68, 4125–4135. [Google Scholar]
  46. Williams, P.H. A system for the determination of races of Plasmodiophora brassicae that infect cabbage and rutabaga. Phytopathology 1966, 56, 624–626. [Google Scholar]
  47. Dobson, R. Pathotypes of Plasmodiophora brassicae in Washington, Oregon, and California. Plant Dis. 1983, 67, 269. [Google Scholar] [CrossRef]
  48. Kim, H.; Jo, E.J.; Choi, Y.H.; Jang, K.S.; Choi, G.J. Pathotype classification of Plasmodiophora brassicae isolates using Clubroot-resistant cultivars of Chinese cabbage. Plant Pathol. J. 2016, 32, 423–430. [Google Scholar]
  49. Pang, W.; Li, X.; Choi, S.R.; Dhandapani, V.; Im, S.; Park, M.Y.; Jang, C.S.; Yang, M.S.; Ham, I.K.; Lee, E.M.; et al. Development of a leafy Brassica rapa fixed line collection for genetic diversity and population structure analysis. Mol. Breed. 2015, 35, 54. [Google Scholar]
  50. Choi, S.R.; Oh, S.H.; Dhandapani, V.; Jang, C.S.; Ahn, C.-H.; Rameneni, J.J.; Kim, H.; Jeon, I.; Lim, Y.P. Development of SNP markers for marker-assisted breeding in Chinese cabbage using Fluidigm genotyping assays. Hortic. Environ. Biote. 2020, 61, 327–338. [Google Scholar] [CrossRef]
  51. Kim, H.; Choi, S.R.; Bae, J.; Hong, C.P.; Lee, S.Y.; Hossain, M.J.; Van Nguyen, D.; Jin, M.; Park, B.-S.; Bang, J.-W. Sequenced BAC anchored reference genetic map that reconciles the ten individual chromosomes of Brassica rapa. BMC genomics 2009, 10, 432. [Google Scholar]
  52. Langmead, B.; Salzberg, S.L. Fast gapped-read alignment with Bowtie 2. Nat. Methods. 2012, 9, 357. [Google Scholar]
  53. Li, H.; Handsaker, B.; Wysoker, A.; Fennell, T.; Ruan, J.; Homer, N.; Marth, G.; Abecasis, G.; Durbin, R. The sequence alignment/map format and SAMtools. Bioinformatics 2009, 25, 2078–2079. [Google Scholar] [CrossRef] [PubMed] [Green Version]
  54. Li, H. A statistical framework for SNP calling, mutation discovery, association mapping and population genetical parameter estimation from sequencing data. Bioinformatics 2011, 27, 2987–2993. [Google Scholar] [CrossRef] [PubMed] [Green Version]
  55. Marcotty, M.; Ledgard, H.F. The World of Programming Languages; Springer: Berlin, German, 1986; p. 41. [Google Scholar]
  56. De Vicente, M.; Metz, T.; Alercia, A. Descriptors for Genetic Markers Technologies-Version 1.0, February 2004; Bioversity International: Rome, Italy, 2004. [Google Scholar]
  57. Li, X.; Ramchiary, N.; Dhandapani, V.; Choi, S.R.; Hur, Y.; Nou, I.S.; Yoon, M.K.; Lim, Y.P. Quantitative trait loci mapping in Brassica rapa revealed the structural and functional conservation of genetic loci governing morphological and yield component traits in the A, B, and C subgenomes of Brassica species. DNA Res. 2013, 20, 1–16. [Google Scholar] [CrossRef] [Green Version]
  58. Matsumoto, E.; Ueno, H.; Aruga, D.; Sakamoto, K.; Hayashida, N. Accumulation of three Clubroot resistance genes through marker-assisted selection in Chinese cabbage (Brassica rapa ssp. pekinensis). J. Jpn. Soc. Hortic. Sci. 2012, 81, 184–190. [Google Scholar] [CrossRef] [Green Version]
  59. Suwabe, K.; Suzuki, G.; Nunome, T.; Hatakeyama, K.; Mukai, Y.; Fukuoka, H.; Matsumoto, S. Microstructure of a Brassica rapa genome segment homoeologous to the resistance gene cluster on Arabidopsis chromosome 4. Breed. Sci. 2012, 62, 170–177. [Google Scholar] [CrossRef] [Green Version]
  60. Ueno, H.; Matsumoto, E.; Aruga, D.; Kitagawa, S.; Matsumura, H.; Hayashida, N. Molecular characterization of the CRa gene conferring clubroot resistance in Brassica rapa. Plant Mol. Biol. 2012, 80, 621–629. [Google Scholar] [CrossRef] [Green Version]
  61. Zhang, T.; Zhao, Z.; Zhang, C.; Pang, W.; Choi, S.R.; Lim, Y.P.; Piao, Z. Fine genetic and physical mapping of the CRb gene conferring resistance to clubroot disease in Brassica rapa. Mol. Breed. 2014, 34, 1173–1183. [Google Scholar] [CrossRef]
  62. Saito, M.; Kubo, N.; Matsumoto, S.; Suwabe, K.; Tsukada, M.; Hirai, M. Fine mapping of the clubroot resistance gene, Crr3, in Brassica rapa. Theor. Appl. Genet. 2006, 114, 81. [Google Scholar] [CrossRef]
  63. Stam, P. Construction of integrated genetic linkage maps by means of a new computer package: Join Map. Plant J. 1993, 3, 739–744. [Google Scholar] [CrossRef]
  64. Van Ooijen, J.W. Joinmap® 4.1 Software for the Calculation of Genetic Linkage Maps in Experimental Populations of Diploid Species; Kyazma B.V.: Wageningen, The Netherlands, 2006. [Google Scholar]
  65. Kosambi, D.D. The estimation of map distances from recombination values. Ann Eugen 1943, 12, 172–175. [Google Scholar] [CrossRef]
  66. Voorrips, R. MapChart: Software for the graphical presentation of linkage maps and QTLs. J. Hered. 2002, 93, 77–78. [Google Scholar] [CrossRef] [Green Version]
  67. Wang, S.; Basten, C.J.; Zeng, Z.B. Windows QTL Cartographer 2.5; Department of Statistics, North Carolina State University: Raleigh, NC, USA, 2012. Available online: http://statgen.ncsu.edu/qtlcart/WQTLCart.htm (accessed on 10 April 2020).
  68. Doerge, R.W.; Churchill, G.A. Permutation tests for multiple loci affecting a quantitative character. Genetics 1996, 142, 285–294. [Google Scholar]
  69. Li, H.; Ye, G.; Wang, J. A modified algorithm for the improvement of composite interval mapping. Genetics 2007, 175, 361–374. [Google Scholar] [CrossRef] [Green Version]
  70. Meng, L.; Li, H.; Zhang, L.; Wang, J. QTL IciMapping: Integrated software for genetic linkage map construction and quantitative trait locus mapping in biparental populations. Crop J. 2015, 3, 269–283. [Google Scholar] [CrossRef] [Green Version]
  71. Zhang, L.; Cai, X.; Wu, J.; Liu, M.; Grob, S.; Cheng, F.; Liang, J.; Cai, C.; Liu, Z.; Liu, B.; et al. Improved Brassica rapa reference genome by single-molecule sequencing and chromosome conformation capture technologies. Hortic. Res. 2018, 5, 50. [Google Scholar] [CrossRef] [Green Version]
  72. Qi, J.N.; Yu, S.C.; Zhang, F.L.; Shen, X.Q.; Zhao, X.Y.; Yu, Y.J.; Zhang, D.S. Reference gene selection for real-time quantitative polymerase chain reaction of mRNA transcript levels in Chinese cabbage (Brassica rapa L. ssp. pekinensis). Plant Mol. Biol. Rep. 2010, 28, 597–604. [Google Scholar] [CrossRef]
Figure 1. The clubroot disease symptom of roots infected by Plasmodiophora brassicae, and the standard of evaluation depending on the severity of root morphology modification. The disease symptom of roots infected and standard of evaluation depending on the severity having lump formation named as club. Symptom was classified on 7 scales from 0 to 6, where 0 = no symptoms; 1 = very slight swelling, usually confined to lateral root; 2 = a few tiny globular nodules on the lateral roots; 3 = several small-sized nodules on lateral roots; 4 = large clubs on lateral roots joining together to form a lump and slight swelling of main roots; 5 = large clubs on main roots; 6 = severe clubs (lumps) formation all over roots and complete change of root morphology.
Ijms 21 04157 g001
Figure 2. Distribution of mean disease index (DI) investigated over 2 years for clubroot disease in ‘09CR-DH’ population in (A) Daejeon and (B) Anseong.
Ijms 21 04157 g002
Figure 3. The linkage map of chromosome A08 and QTL, PbBrA08Banglim, for clubroot resistance traits to the Plasmodiophora brassicae Banglim pathotype in doubled haploid population of B. rapa. (A) The PbBrA08Banglim in the genetic map and candidate genes. In genetic map, genetic distances are shown on the left side of linkage group as centi-morgans (cM), and the markers are located on the right side of linkage group. On the right side of genetic map is QTL result. On the left side of map represented the candidate genes are represented, located in the overlapping detected QTL region analyzing WinQTL cartographer 2.5 and IciMapping 4.1. The rectangular bars of red and black color represented the QTL region, analyzed by WinQTL cartographer 2.5 and discovered in year replicates, respectively. The green and blue color bar show QTL detected by IciMapping 4.1. (B) shows closely linked markers to the resistance loci to Plasmodiophora brassicae Banglim pathotype. The value inside of parenthesis represented the identification ratio of phenotype by markers, respectively.
Ijms 21 04157 g003
Figure 4. Expression analysis of the Crr1a candidate gene to validate that PbBrA08Banglim of resistant line “09CR500” is not same allele. Semiquantitative RT-PCR was done in resistant line “09CR500” and susceptible line “09CR501”. “Infection” refers to the treatment of pathotype “Banglim” to plants, and “Non infection“ indicates that no treatment has been performed. The B. rapa 18s rRNA was used as a control. PCR cycles are indicated on the right side. The candidate gene of Crr1a was not expressed in “09CR500” and “09CR501” in both conditions such as before and after infection.
Ijms 21 04157 g004
Figure 5. Single nucleotide polymorphisms (SNPs) and insertion and deletion (InDel) markers of the PbBrA08Banglim locus linked to clubroot resistance. (A) High-resolution melting (HRM) analysis of SNP marker “09CR.11390652” using the LightScanner System and phenotype. (B) Gel electrophoresis analysis of InDel marker “09CR.11755754” using LabChip® GX Touch™ and phenotype. The plant genotype responses against Banglim pathotype are represented by R (resistant) and S (susceptible). Disease score was recorded as an average value with standard deviation.
Ijms 21 04157 g005
Table 1. Genetic analysis of clubroot resistance associated with “09CR500” in the doubled haploid (DH) population against the P. brassicae pathotype Banglim.
LocationPlant MaterialsTotal No.Phenotype ofExpected Rtio
(R:S)
χ2
Resistance (R)Susceptible (S)Missing (-)
Daejoen09CR500101000--
09CR501100100--
DH population81404011:10.01
Anseong09CR500101000--
09CR501100100--
DH population81394021:10.06
Table 2. Summary of QTLs detected for clubroot resistance against the Banglim pathotype of P. brassicae using composite interval mapping (CIM). LOD—logarithm of odds.
Loci NameLocationChr No.Closest MarkerLODR2 (%)Additive
PbBrA08Banglim-1Daejeon809CR.1139065274.897.1−47.0
PbBrA08Banglim-2Anseong809CR.113906527.926.0−26.1
Table 3. Identification of related resistance genes within the PbBrA08Banglim region in B. rapa.
Gene IDGene Position (bp) a
v1.2v3.0StartEndProtein Description b
Bra020979BraA08g013130.3C11,388,57711,391,460Receptor-like protein/Leucine rich repeat
Bra020974BraA08g013190.3C11,427,76811,428,159LRR receptor-like serine/
threonine-protein kinase
Bra020945/
Bra020942
BraA08g013530.3C11,658,23311,659,423F-box/kelch-repeat protein
Bra020936BraA08g013630.3C11,696,21611,696,785TIR domain containing disease resistance protein
Bra020928BraA08g013730.3C11,752,98011,756,408Leucine-rich repeat receptor-like
serine/threonine-protein kinase
Bra020918BraA08g013850.3C11,809,25011,815,278LRR receptor-like serine/
threonine-protein kinase
Bra020901/
Bra020902
BraA08g014000.3C11,921,30111,924,248F-box protein
Bra020876BraA08g014350.3C12,162,11312,169,372LRR receptor-like serine/
threonine-protein kinase
Bra020861BraA08g014480.3C12,271,55312,276,276Disease resistance protein
Bra020860BraA08g014500.3C12,289,21712,290,401F-box protein
Bra020847BraA08g014610.3C12,365,09712,366,311F-box protein
a Physical location in B. rapa version 3.0. b Gene functions were assigned according to the best match of the alignments against Swiss-port databases (https://www.uniprot.org/) using BLASTP v2.9.0+ and Pfam database version 32.0 (https://pfam.xfam.org/).

