The Role of P2X7 Purinergic Receptors in the Renal Inflammation Associated with Angiotensin II-Induced Hypertension

 , ,
, ,  and
and 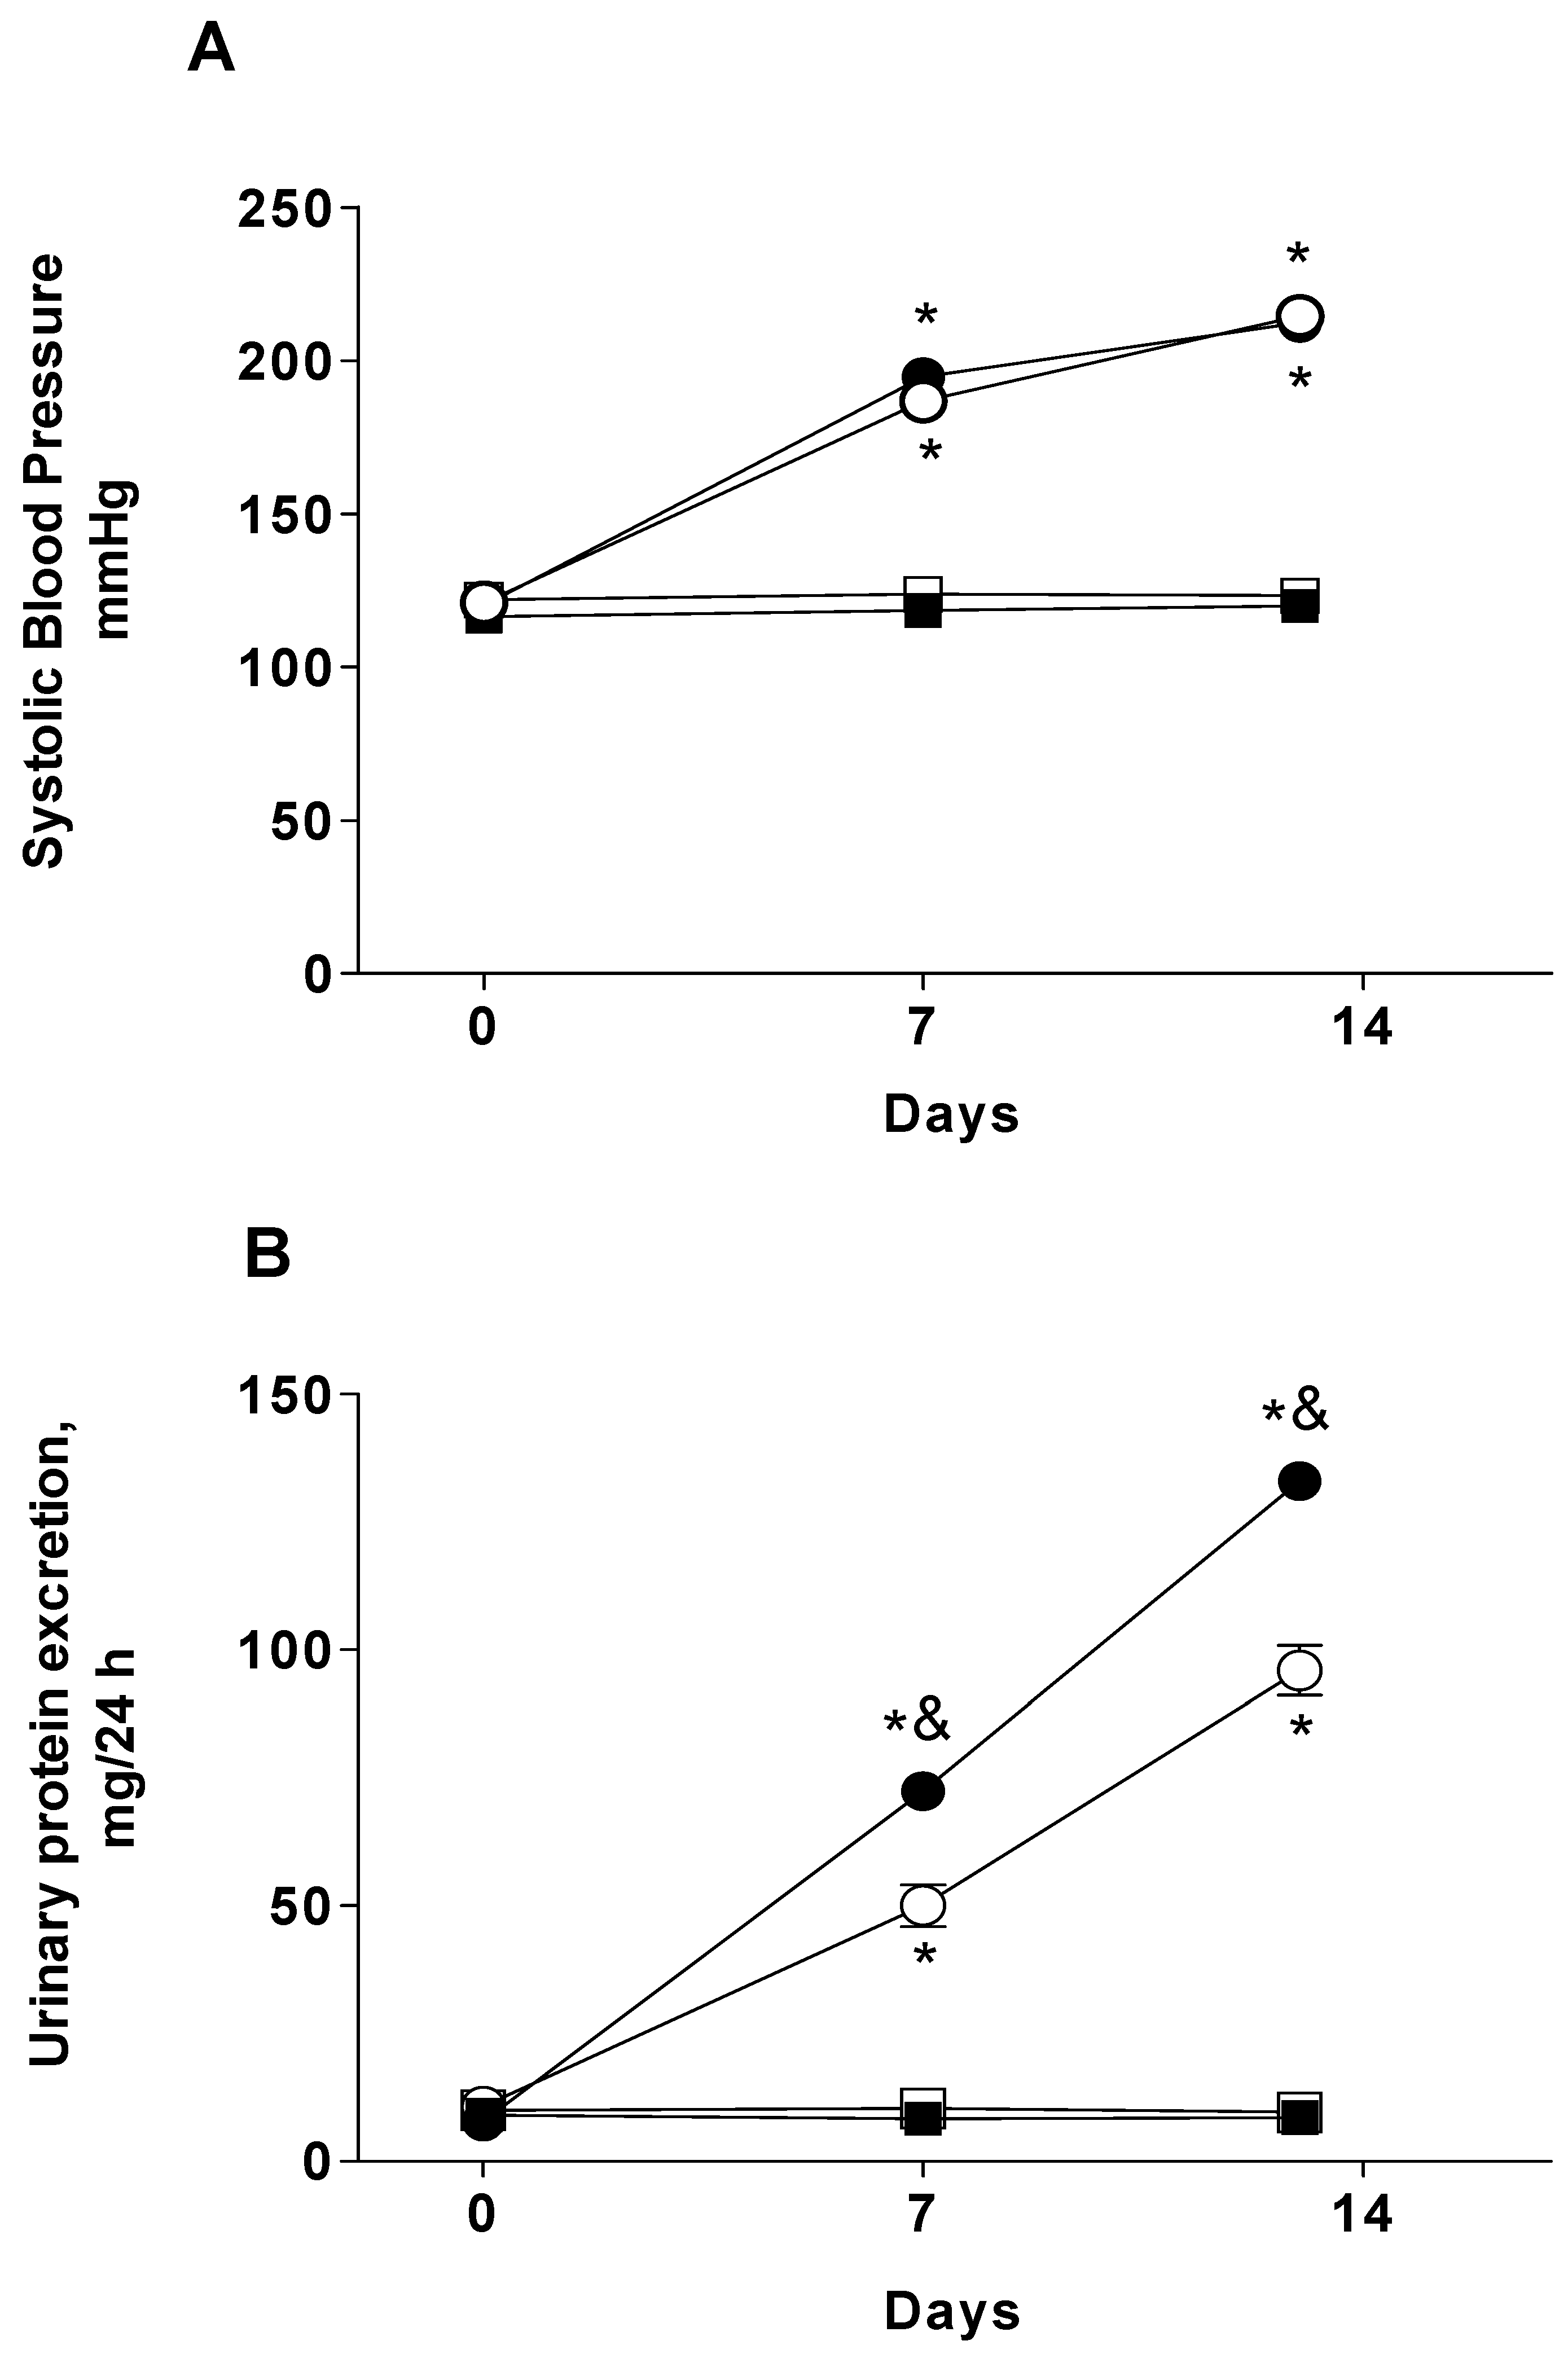
Abstract
1. Introduction
2. Results
2.1. Systolic Blood Pressure and Proteinuria
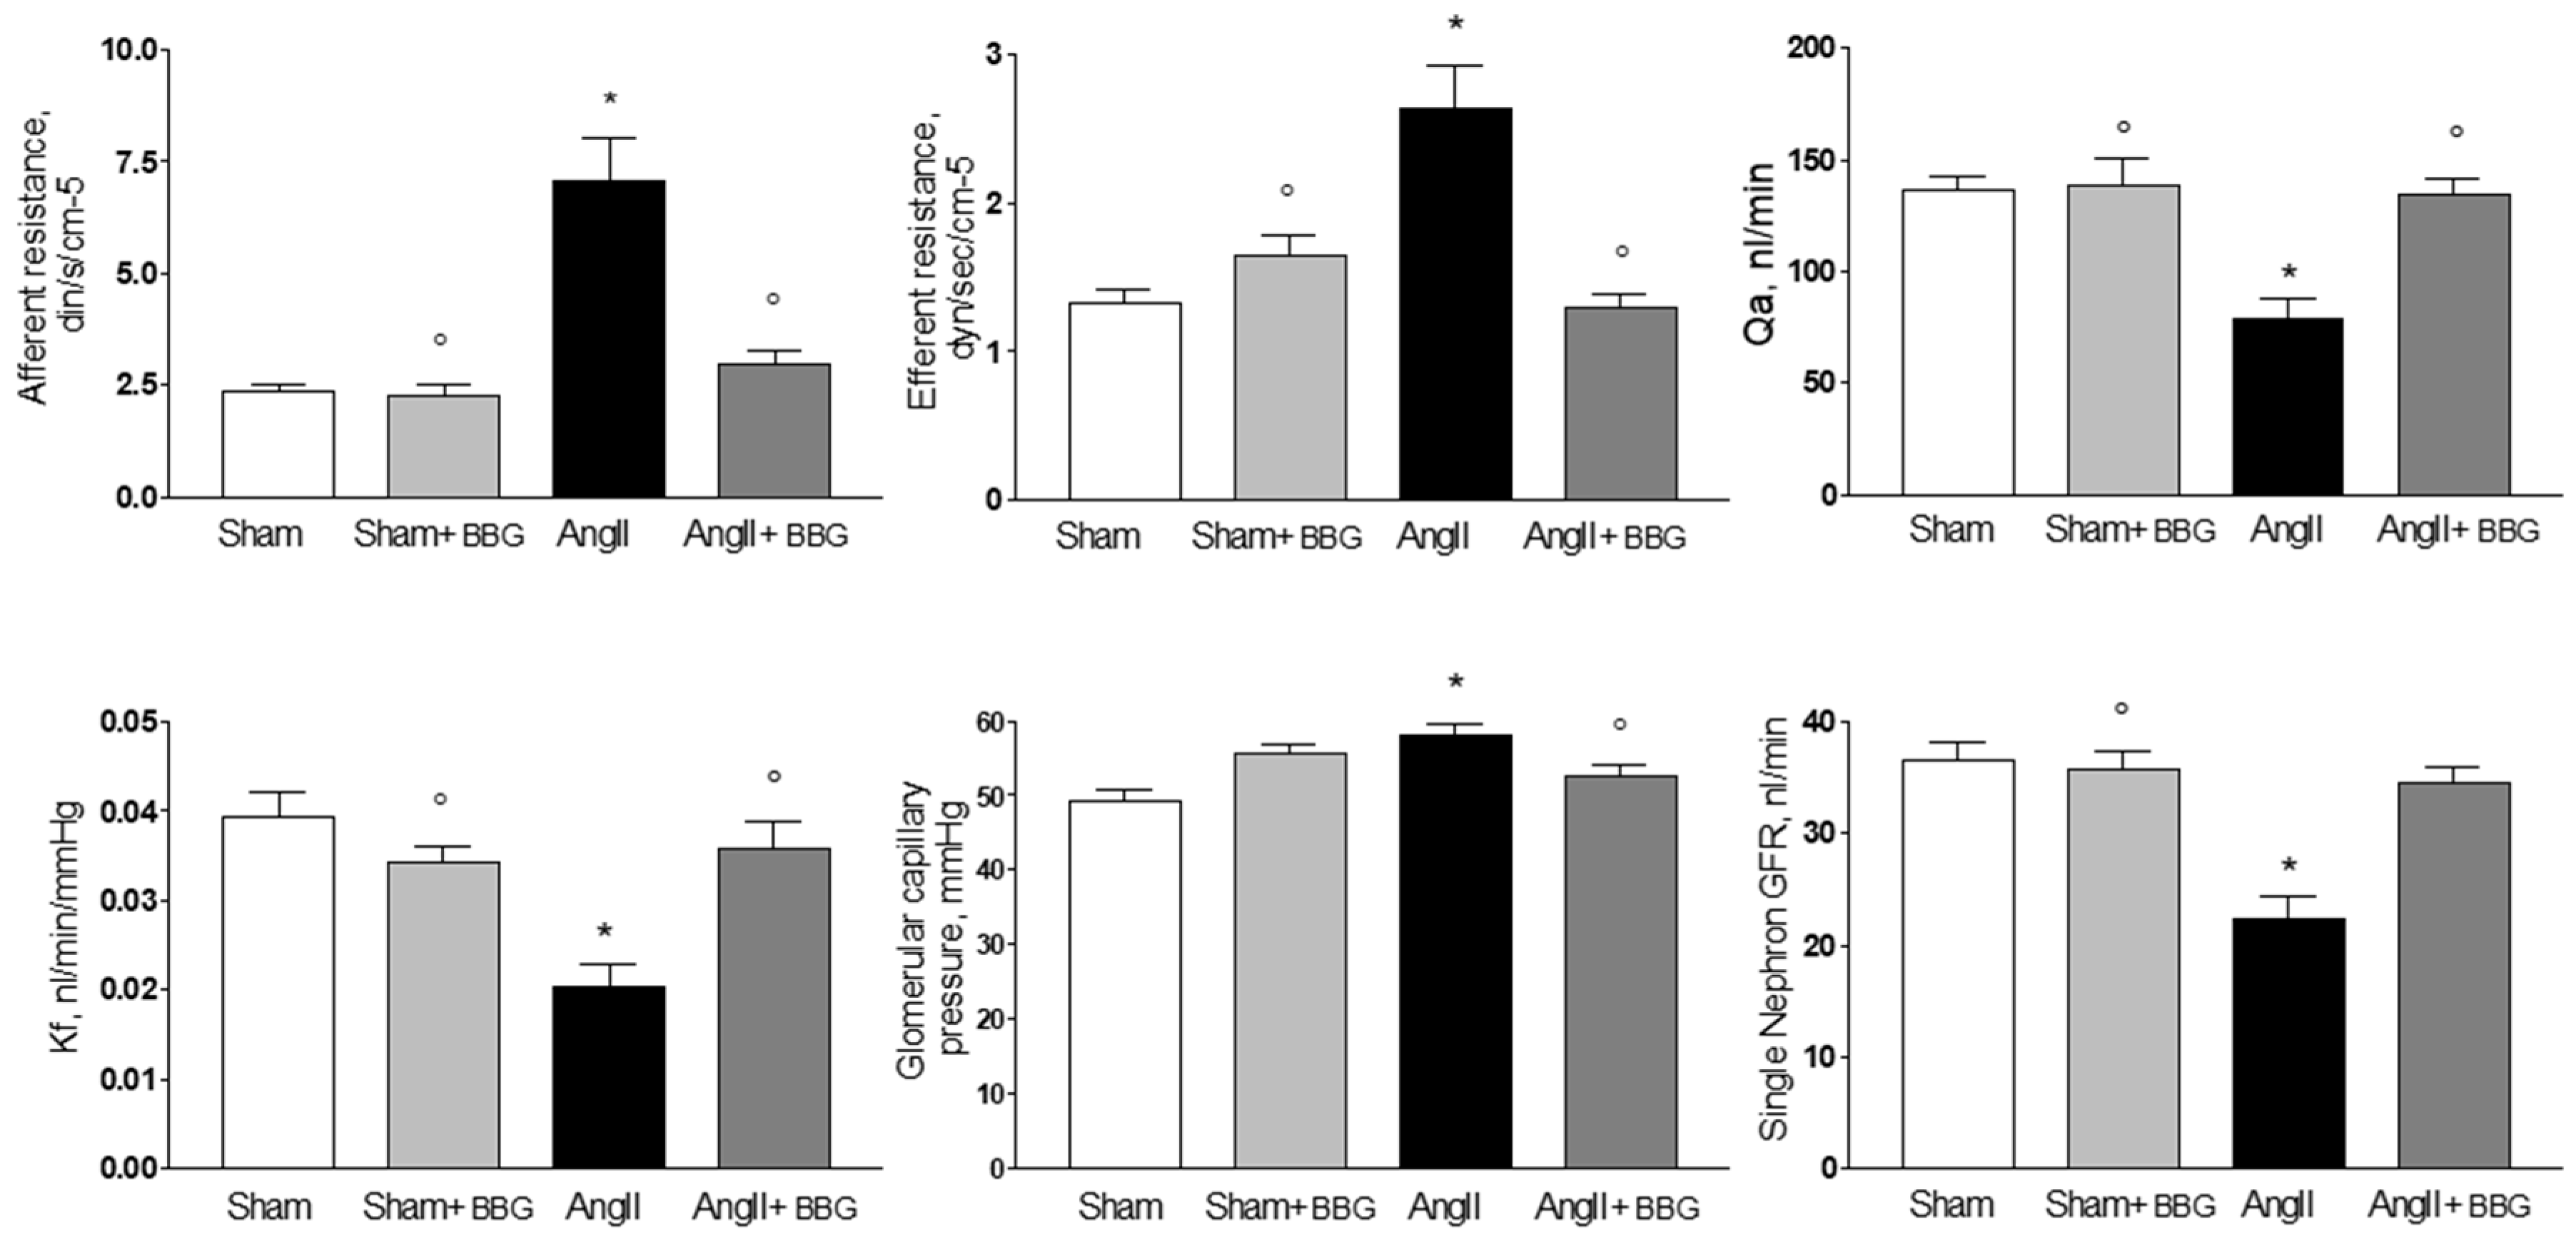
2.2. Micropuncture Studies
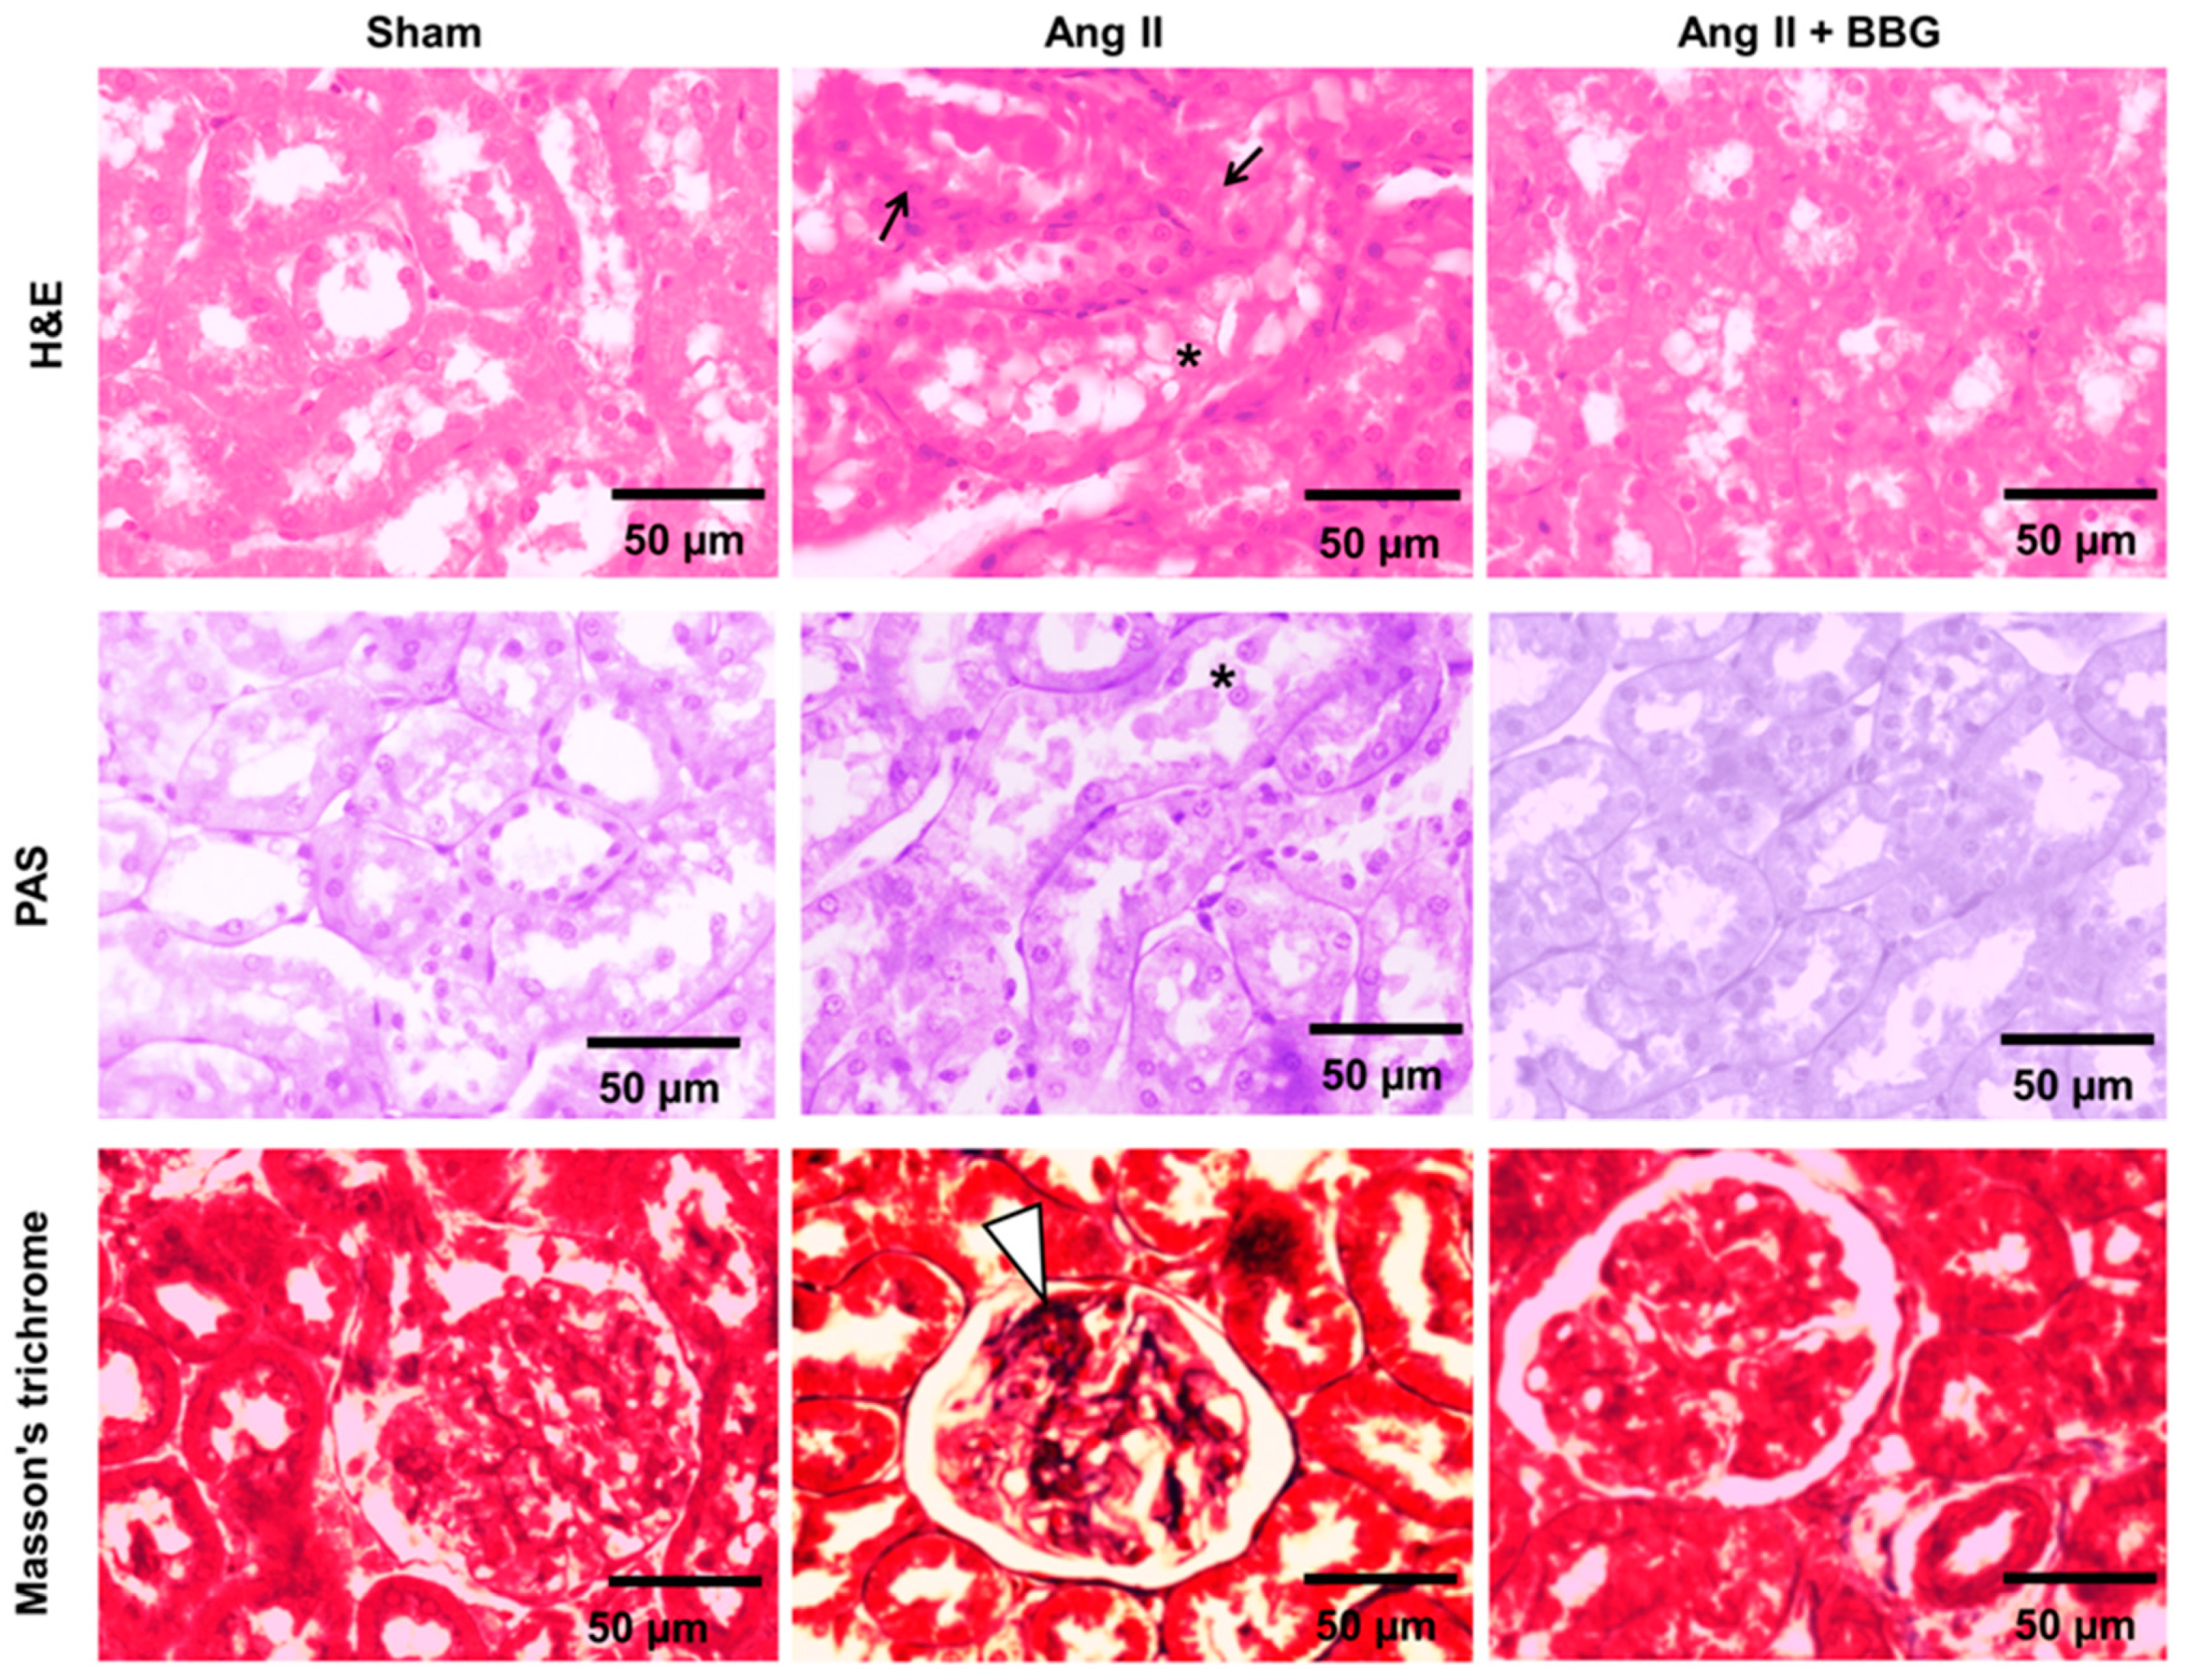
2.3. Histological Analysis
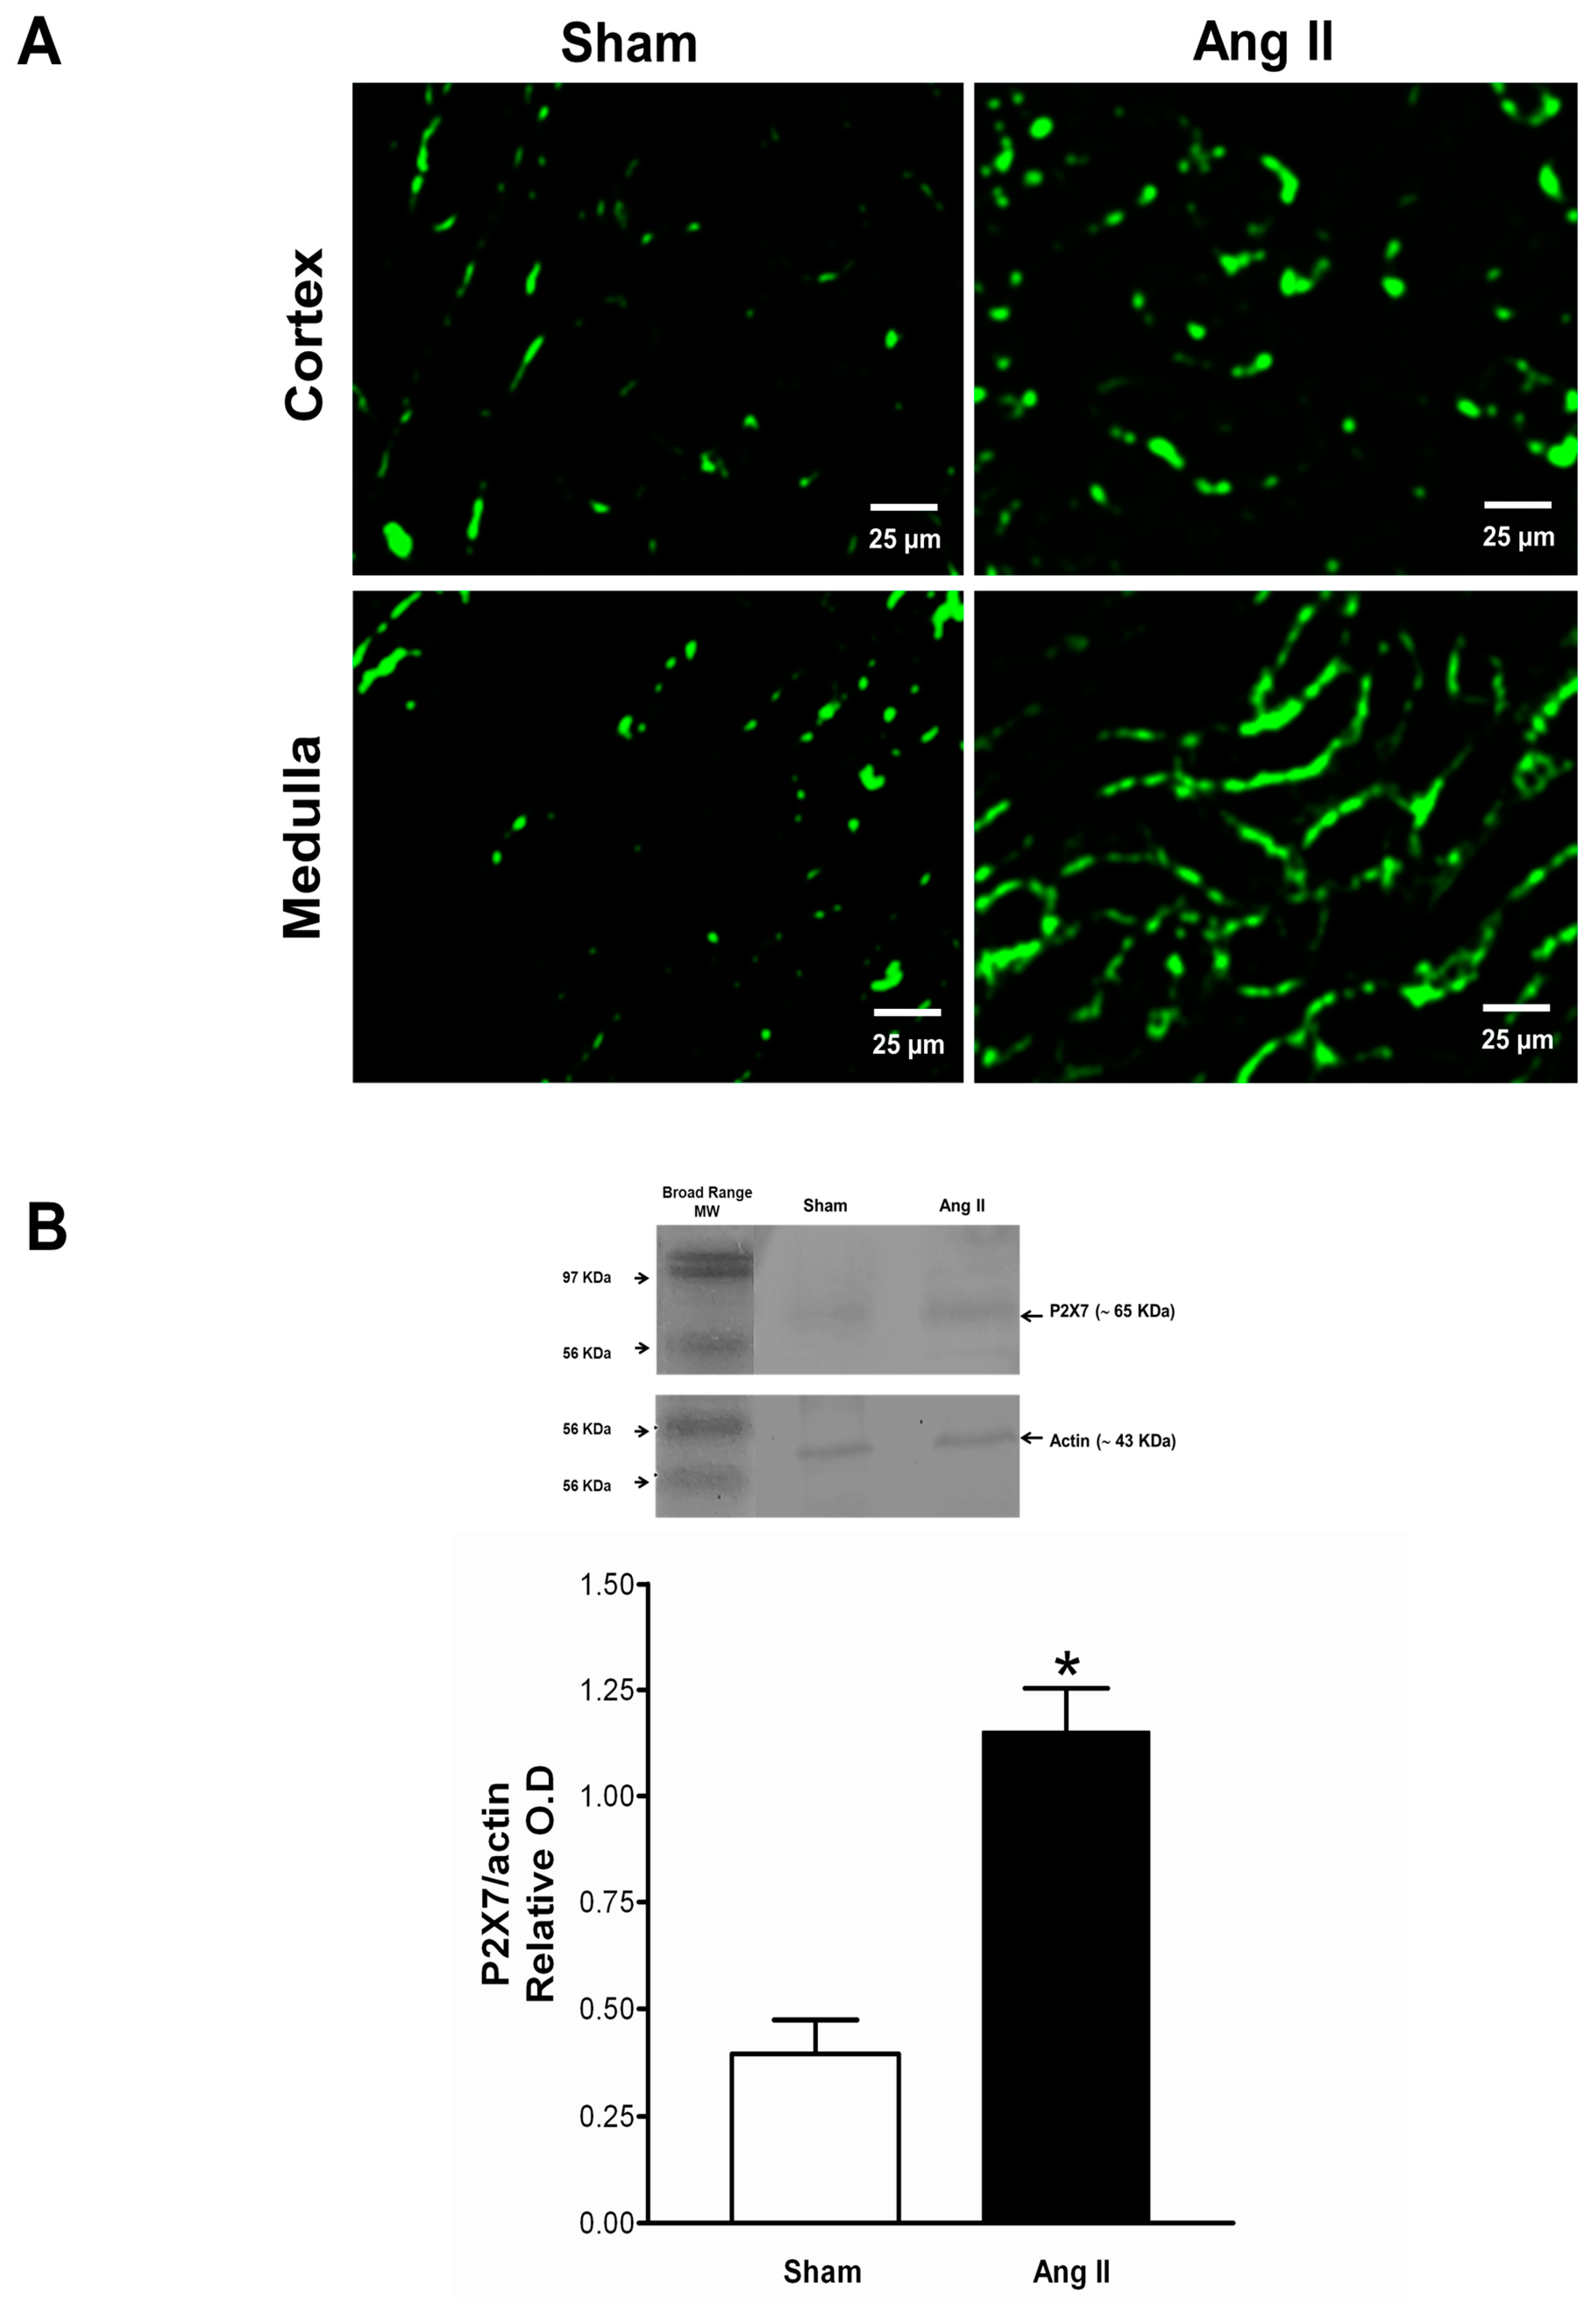
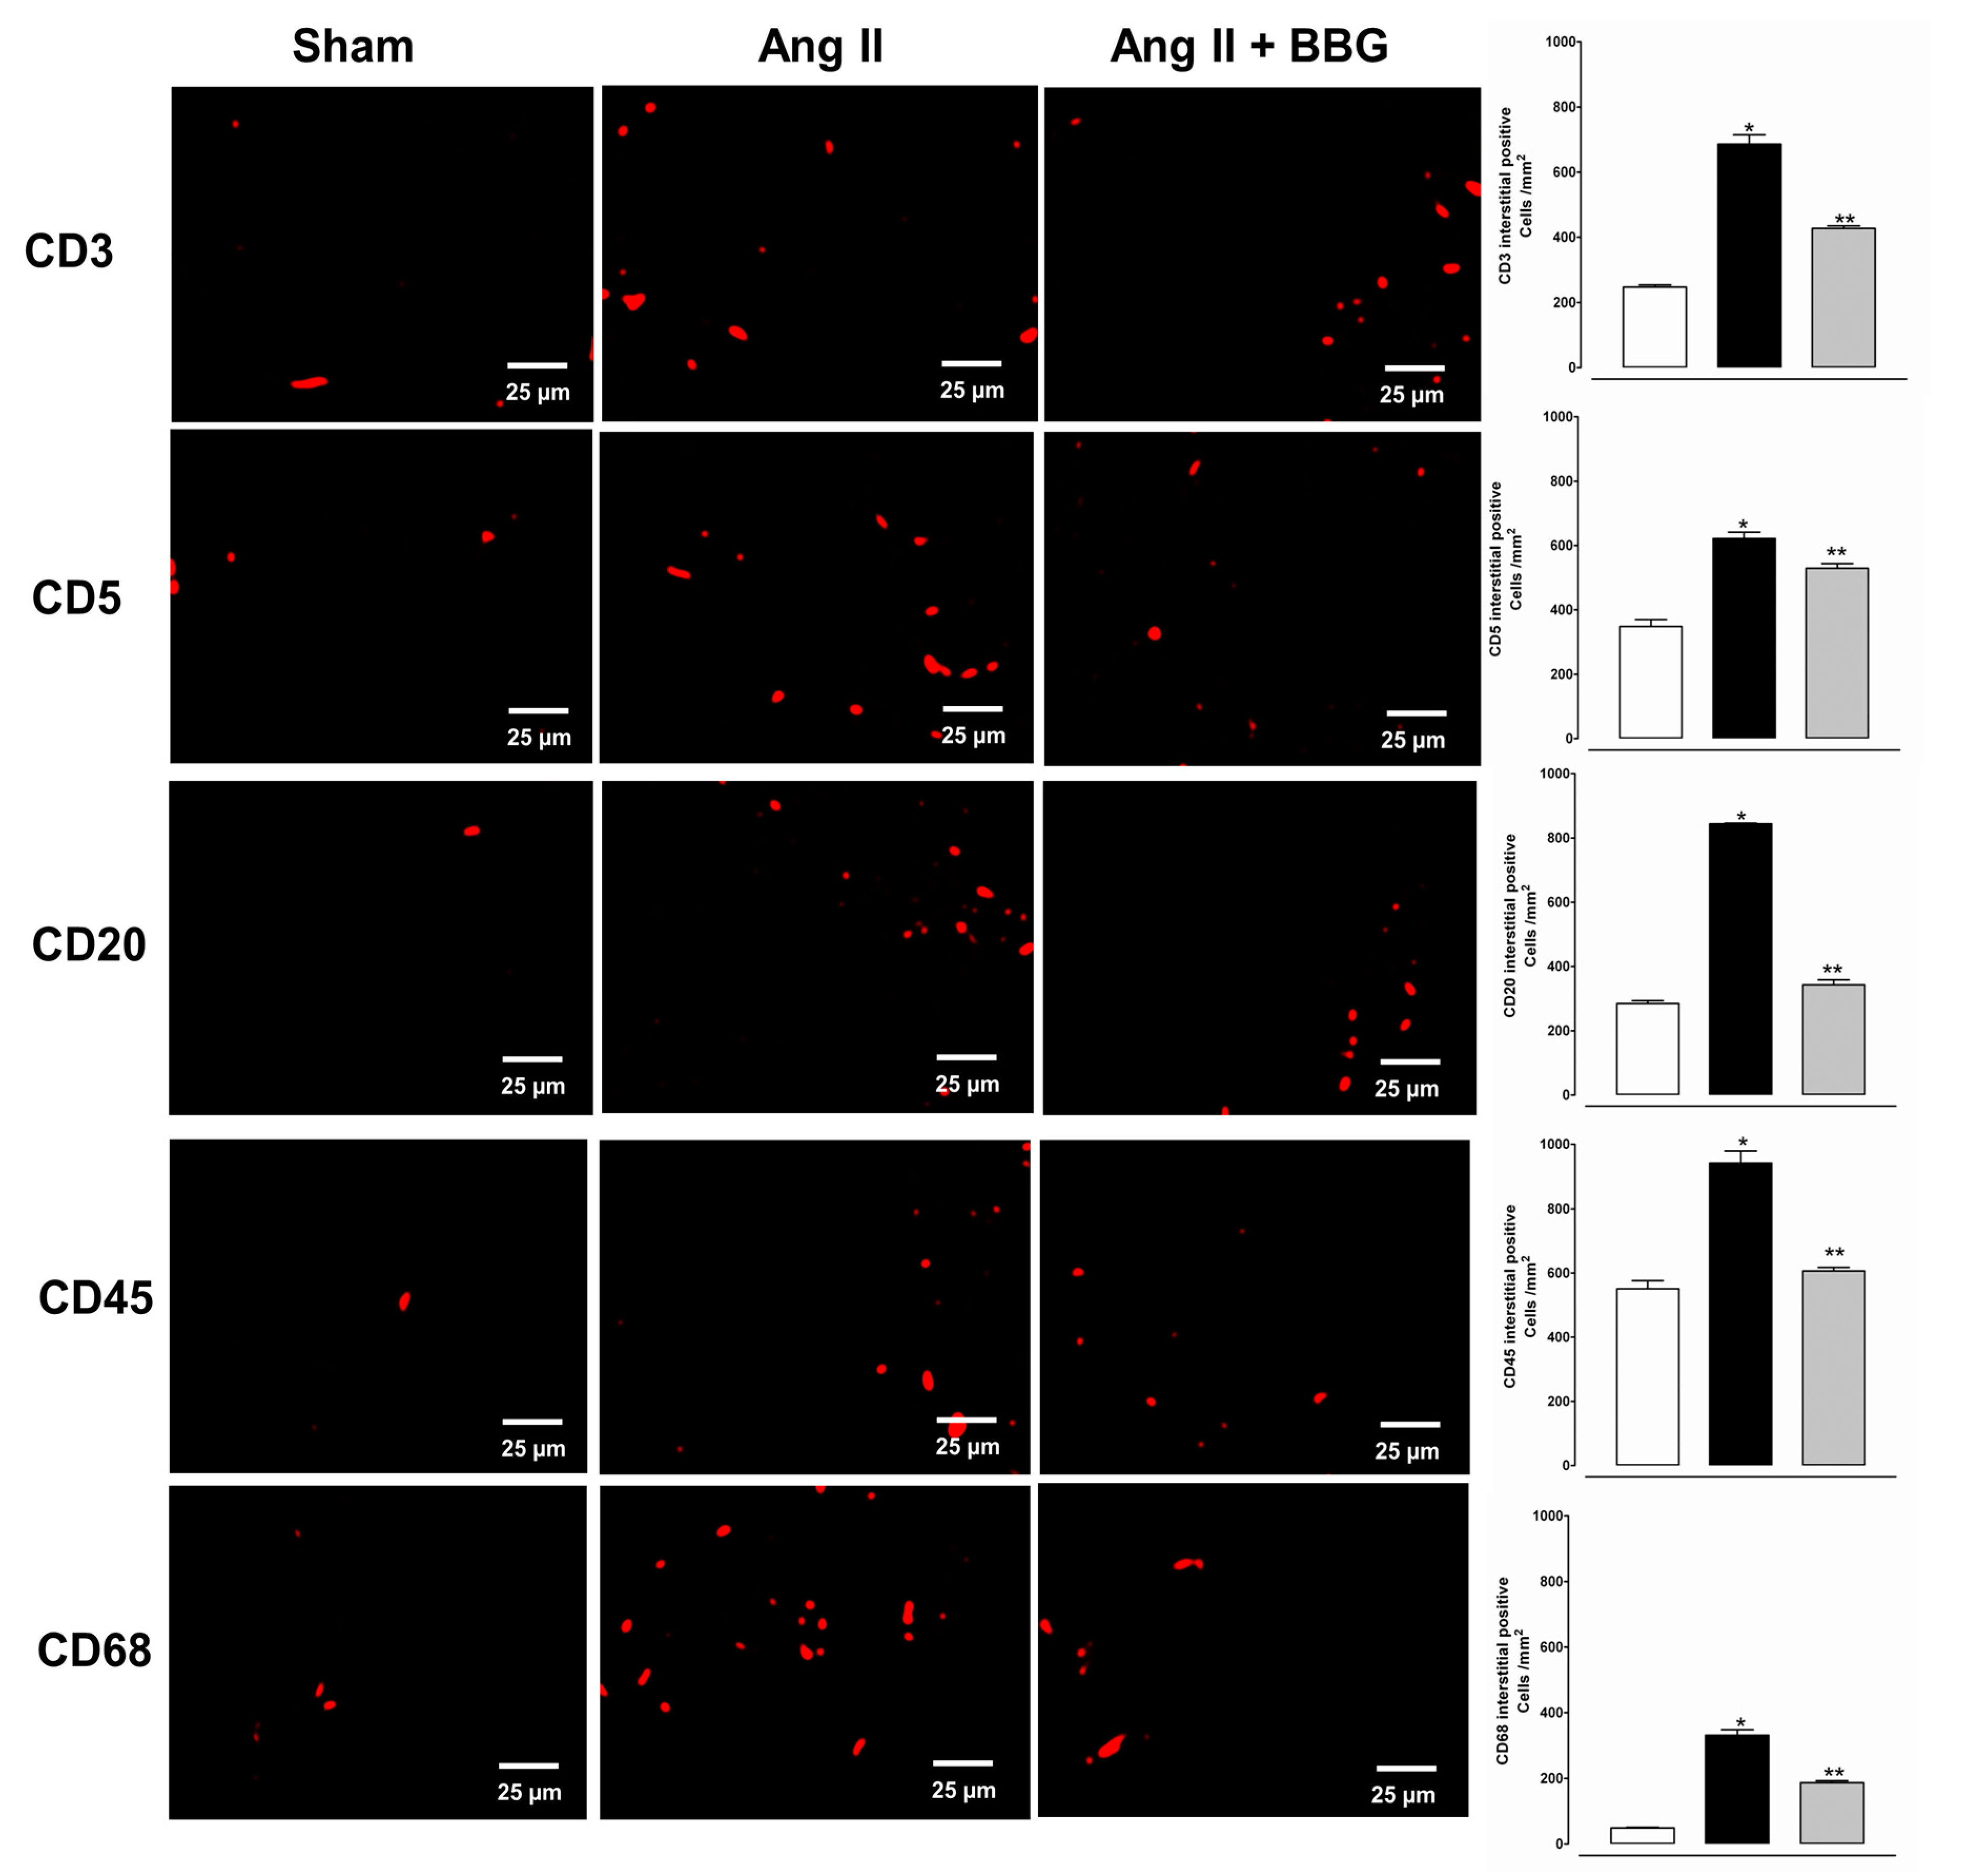
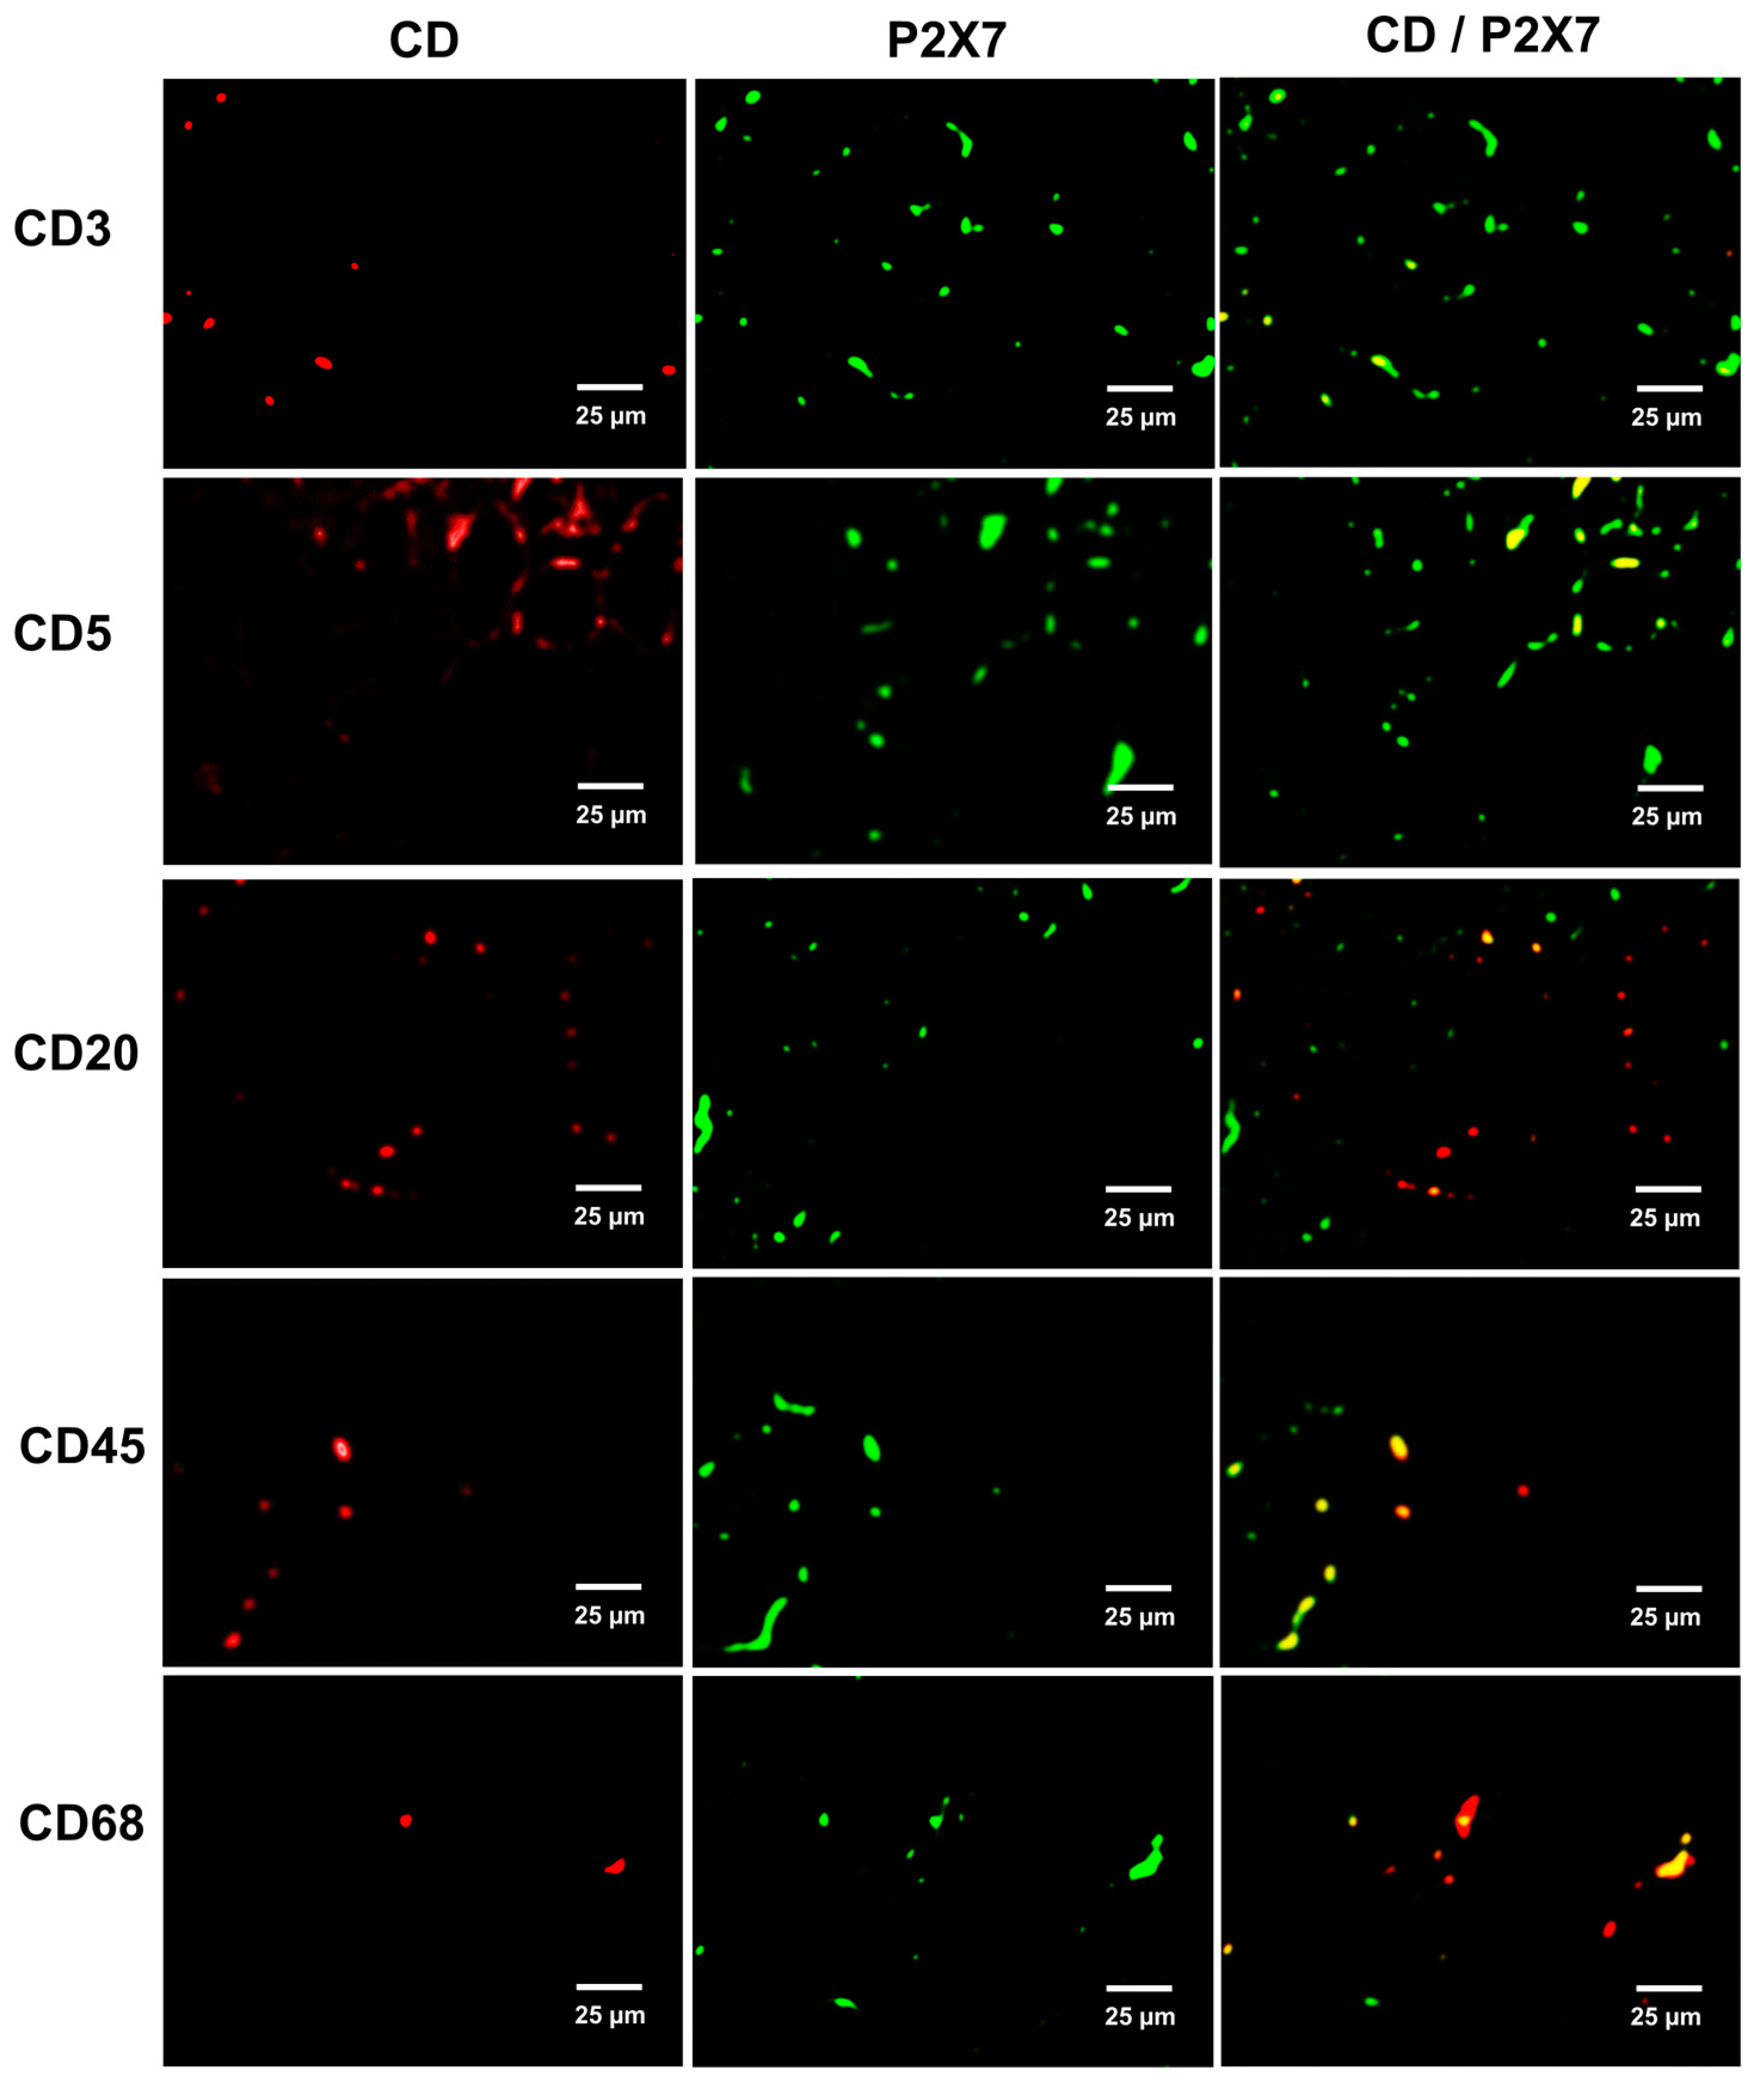
2.4. Immune Cell Infiltration and P2X7 Protein Expression
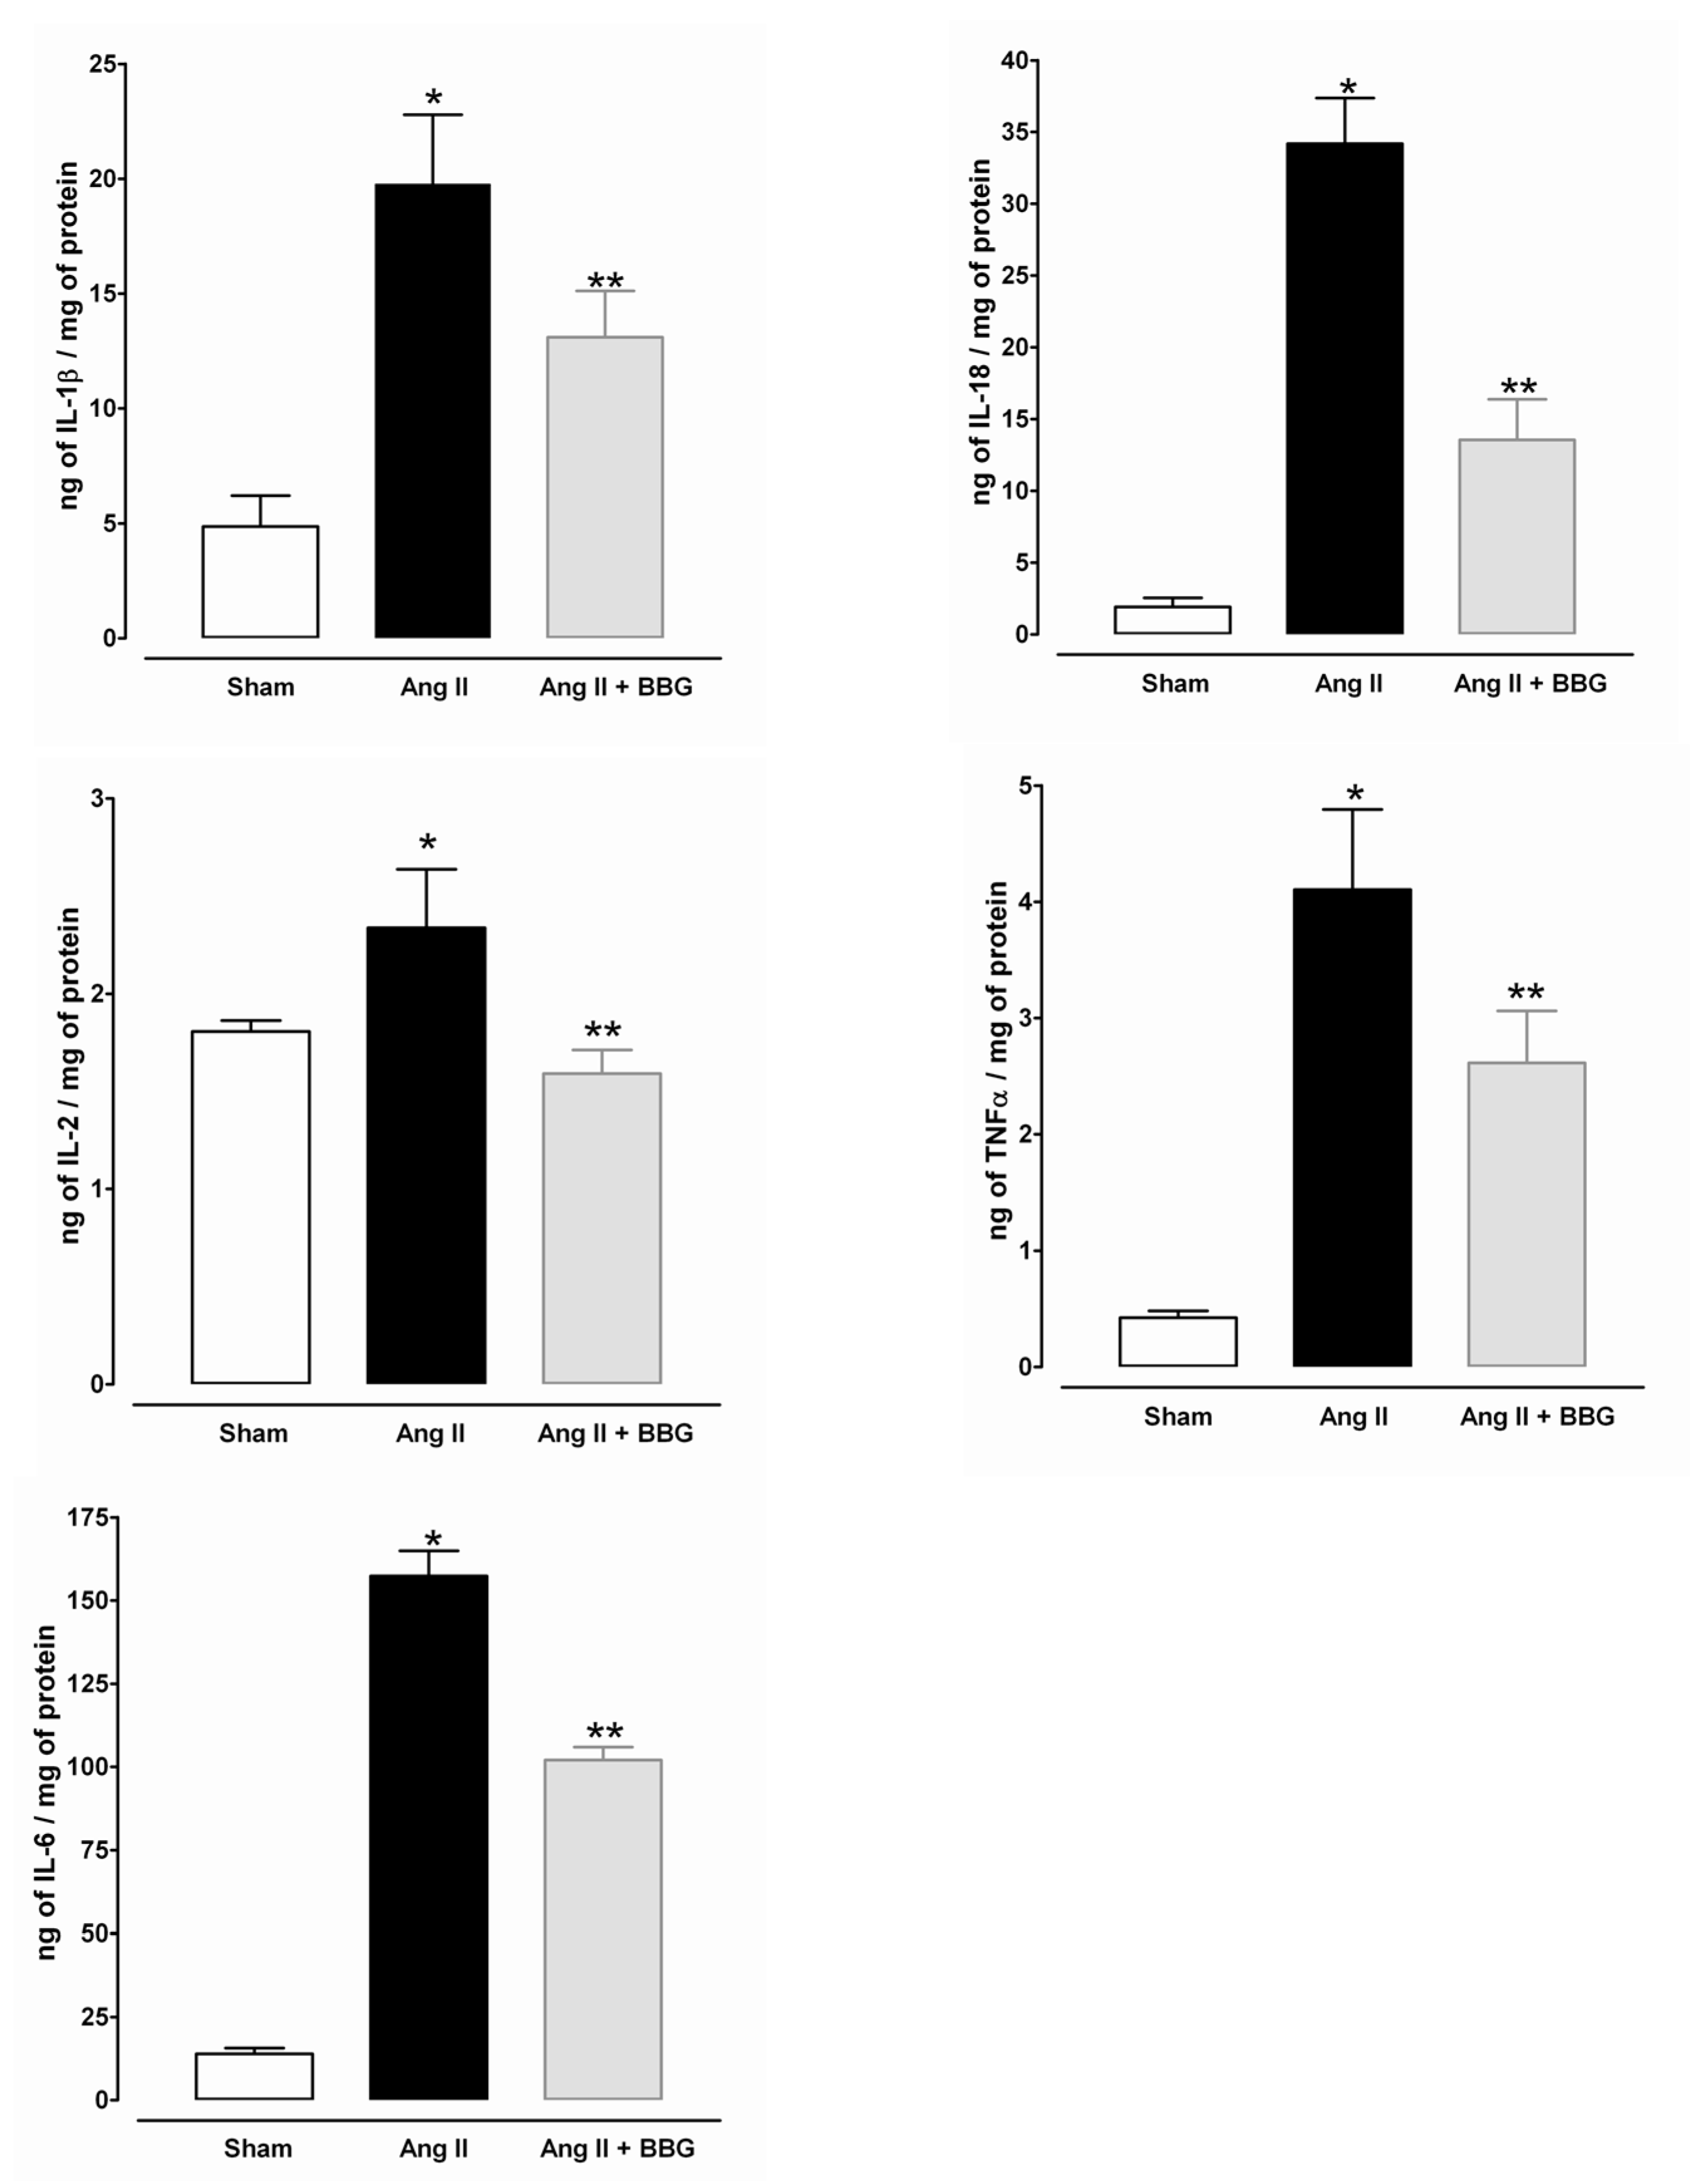
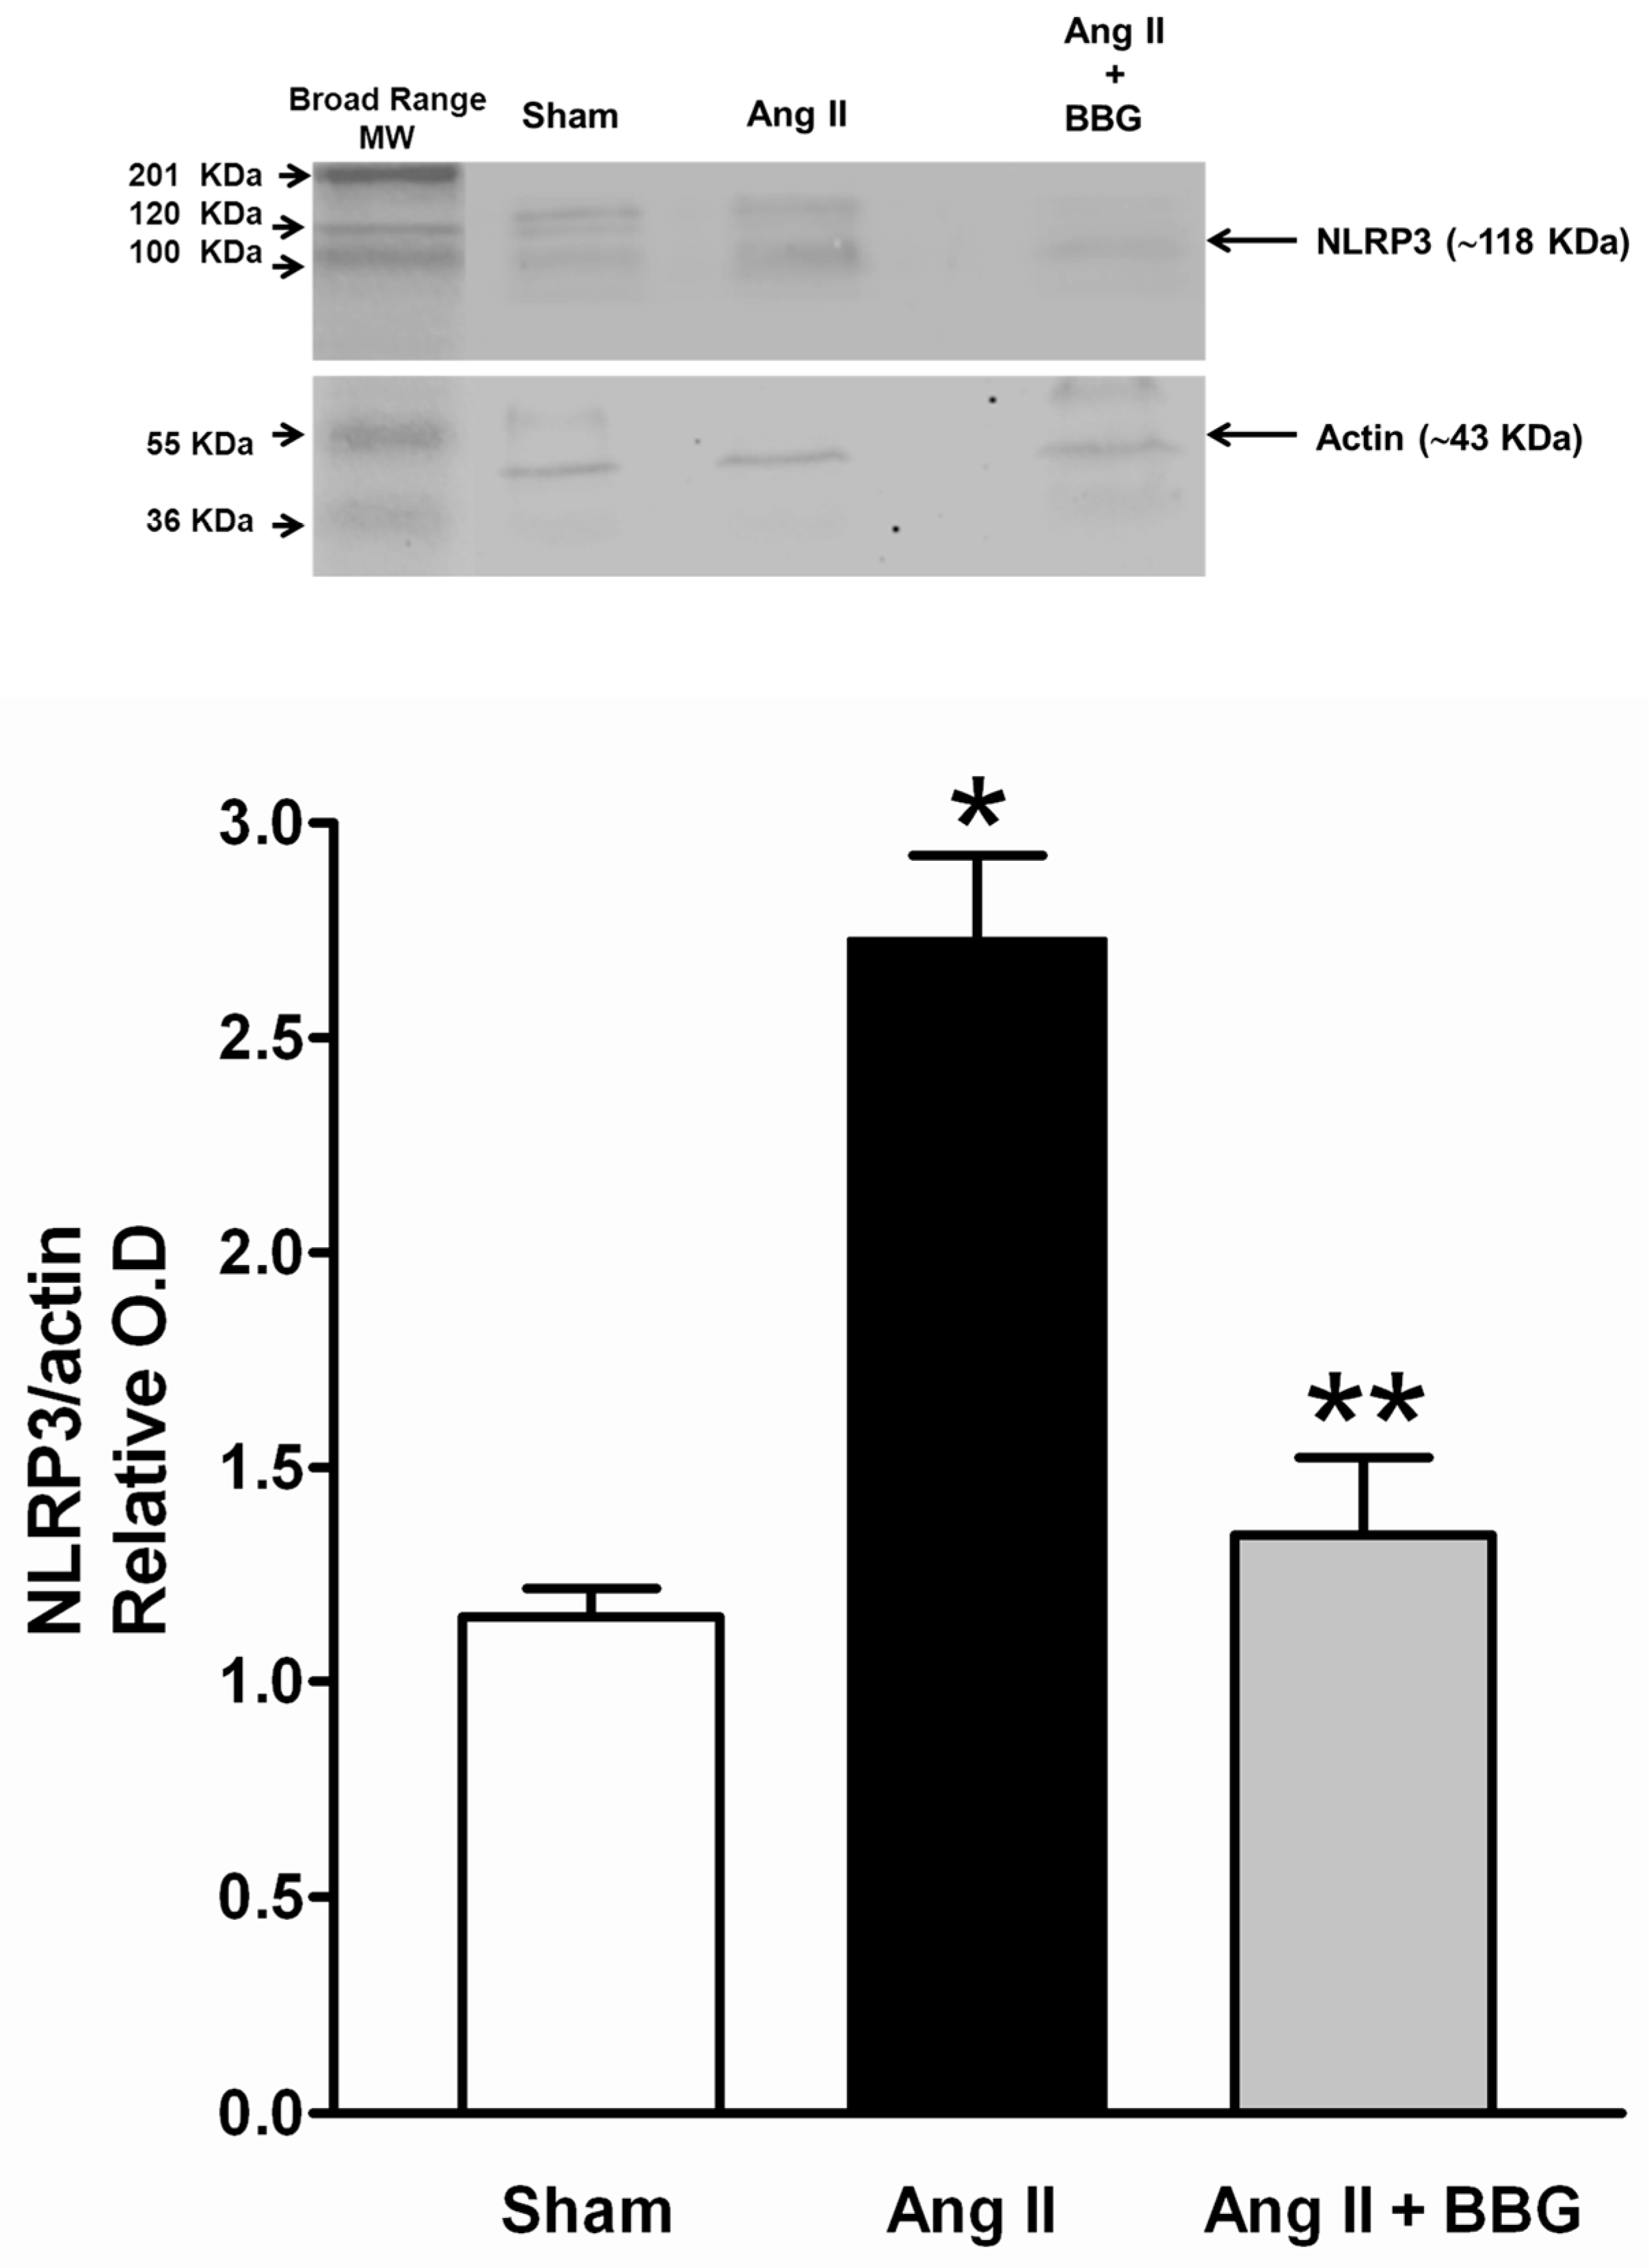
2.5. Interleukins, TNFα and NLRP3 Inflammasome
3. Discussion
4. Materials and Methods
4.1. Animal Procedures
4.1.1. Design of the Experiments
4.1.2. Micropuncture Studies
4.1.3. Immunofluorescence Studies
4.1.4. Western Blot for P2X7 Receptor and NLRP3 Proteins
4.1.5. Cytokines Determination
4.1.6. Histologic Analyses
4.1.7. Statistical Analysis
Author Contributions
Funding
Acknowledgments
Conflicts of Interest
Abbreviations
| Ang II | Angiotensin II |
| AR | Afferent resistance |
| ATP | Adenosine triphosphate |
| BBG | Brilliant blue G |
| ER | Efferent resistance |
| GFR | Glomerular filtration rate |
| H&E | Hematoxylin and eosin staining |
| Kf | Ultrafiltration coefficient |
| Qa | Glomerular plasma flow |
| PAS | Periodic acid Schiff staining |
| P2 × 1 | Purinergic P2 × 1 receptors |
| P2 × 4 | Purinergic P2 × 4 receptors |
| P2 × 7R | Purinergic P2 × 7 receptors. |
| P2Y1 | Purinergic P2Y1 receptors |
| SNGFR | Single-nephron glomerular filtration rate |
References
- Franco, M.; Martínez, F.; Rodriguez-Iturbe, B.; Johnson, R.J.; Santamaría, J.; Montoya, A.; Nepomuceno, T.; Bautista, R.; Tapia, E.; Herrera-Acosta, J. Angiotensin II, interstitial inflammation, and the pathogenesis of salt-sensitive hypertension. Am. J. Physiol. Ren. Physiol. 2006, 291, F1281–F1287. [Google Scholar] [CrossRef]
- Vonend, O.; Turner, C.M.; Chan, C.M.; Loesch, A.; Dell’Anna, G.C.; Srai, K.S.; Burnstock, G.; Unwin, R.; Vonend, C.M.T.O. Glomerular expression of the ATP-sensitive P2X7 receptor in diabetic and hypertensive rat models. Kidney Int. 2004, 66, 157–166. [Google Scholar] [CrossRef]
- Franco, M.; Bautista, R.; Tapia, E.; Soto, V.; Santamaría, J.; Osorio, H.; Pacheco, U.; Sanchez-Lozada, L.G.; Kobori, H.; Navar, L.G. Contribution of renal purinergic receptors to renal vasoconstriction in angiotensin II-induced hypertensive rats. Am. J. Physiol. Ren. Physiol. 2011, 300, F1301–F1309. [Google Scholar] [CrossRef]
- Mironova, E.; Boiko, N.; Bugaj, V.; Kucher, V.; Stockand, J.D. Regulation of Na+ excretion and arterial blood pressure by purinergic signalling intrinsic to the distal nephron: Consequences and mechanisms. Acta Physiol. 2014, 213, 213–221. [Google Scholar] [CrossRef]
- Franco, M.; Tapia, E.; Bautista, R.; Pacheco, U.; Santamaria, J.; Quiroz, Y.; Johnson, R.J.; Rodriguez-Iturbe, B. Impaired pressure natriuresis resulting in salt-sensitive hypertension is caused by tubulointerstitial immune cell infiltration in the kidney. Am. J. Physiol. Ren. Physiol. 2013, 304, F982–F990. [Google Scholar] [CrossRef]
- Rodriguez-Iturbe, B.; Johnson, R.J. The role of renal microvascular disease and interstitial inflammation in salt-sensitive hypertension. Hypertens. Res. 2010, 33, 975–980. [Google Scholar] [CrossRef]
- Mattson, D.L.; James, L.; Berdan, E.A.; Meister, C.J. Immune Suppression Attenuates Hypertension and Renal Disease in the Dahl Salt-Sensitive Rat. Hypertension 2006, 48, 149–156. [Google Scholar] [CrossRef]
- Bobadilla, N.A.; Tack, I.; Tapia, E.; Sánchez-Lozada, L.G.; Santamaría, J.; Jiménez, F.; Striker, L.J.; Striker, G.E.; Herrera-Acosta, J. Pentosan polysulfate prevents glomerular hypertension and structural injury despite persisting hypertension in 5/6 nephrectomy rats. J. Am. Soc. Nephrol. 2001, 12, 2080–2087. [Google Scholar]
- Ji, X.; Naito, Y.; Hirokawa, G.; Weng, H.; Hiura, Y.; Takahashi, R.; Iwai, N. P2X7 receptor antagonism attenuates the hypertension and renal injury in Dahl salt-sensitive rats. Hypertens. Res. 2011, 35, 173–179. [Google Scholar] [CrossRef]
- Menzies, R.I.; Unwin, R.; Rash, R.K.; Beard, D.A.; Cowley, A.W., Jr.; Callsin, B.E.; Mullins, J.J.; Bailey, M.A. Effect of P2 × 4 and P2 × 7 receptor antagonism on the pressure diuresis relationship in rats. Front. Physiol. 2013, 4, 235. [Google Scholar] [CrossRef]
- Rieg, T.; Bundey, R.A.; Chen, Y.; Deschenes, G.; Junger, W.; Insel, P.A.; Vallon, V. Mice lacking P2Y 2 receptors have salt-resistant hypertension and facilitated renal Na + and water reabsorption. FASEB J. 2007, 21, 3717–3726. [Google Scholar] [CrossRef] [PubMed]
- Osmond, D.A.; Inscho, E.W. P2 × 1 receptor blockade inhibits whole kidney autoregulation of renal blood flow in vivo. Am. J. Physiol. Ren. Physiol. 2010, 298, F1360–F1368. [Google Scholar] [CrossRef] [PubMed]
- Guan, Z.; Fellner, R.; Beusecum, J.; Inscho, E. P2 Receptors in Renal Autoregulation. Curr. Vasc. Pharmacol. 2014, 12, 818–828. [Google Scholar] [CrossRef]
- Franco, M.; Bautista, R.; Pérez-Méndez, O.; González, L.; Pacheco, U.; Sanchez-Lozada, L.G.; Santamaría, J.; Tapia, E.; Monreal, R.; Martínez, F. Renal interstitial adenosine is increased in angiotensin II-induced hypertensive rats. Am. J. Physiol. Ren. Physiol. 2008, 294, F84–F92. [Google Scholar] [CrossRef]
- Sasser, J.M.; Pollock, J.S.; Pollock, D.M. Renal endothelin in chronic angiotensin II hypertension. Am. J. Physiol. Integr. Comp. Physiol. 2002, 283, R243–R248. [Google Scholar] [CrossRef]
- Harrison, D. SY 17-2 INFLAMMATION, IMMUNITY AND HYPERTENSION. J. Hypertens. 2016, 34, e535. [Google Scholar] [CrossRef]
- Graciano, M.L.; Nishiyama, A.; Jackson, K.; Seth, D.M.; Ortiz, R.M.; Prieto-Carrasquero, M.C.; Kobori, H.; Navar, L.G. Purinergic receptors contribute to early mesangial cell transformation and renal vessel hypertrophy during angiotensin II-induced hypertension. Am. J. Physiol. Ren. Physiol. 2007, 294, F161–F169. [Google Scholar] [CrossRef]
- Menzies, R.I.; Howarth, A.R.; Unwin, R.J.; Frederick, W.K.; Mullis, J.J.; Bailey, M.A. Inhibition of the purinergic P2 × 7 receptor improves renal perfusion pressure in angiotensin II-infused rats. Kidney Int. 2015, 88, 1079–1087. [Google Scholar] [CrossRef]
- Franco, M.; Bautista-Pérez, R.; Cano-Martínez, A.; Pacheco, U.; Santamaría, J.; Del Valle-Mondragón, L.; Pérez-Méndez, O.; Navar, L.G. Physiopathological implications of P2 × 1 and P2 × 7 receptors in regulation of glomerular hemodynamics in angiotensin II-induced hypertension. Am. J. Physiol. Ren. Physiol. 2017, 312, 9–19. [Google Scholar] [CrossRef]
- Krishnan, S.M.; Ling, Y.H.; Huuskes, B.M.; Ferens, D.M.; Saini, N.; Chan, C.T.; Diep, H.; Kett, M.M.; Samuel, C.S.; Kemp-Harper, B.K.; et al. Pharmacological inhibition of the NLRP3 inflammasome reduces blood pressure, renal damage, and dysfunction in salt-sensitive hypertension. Cardiovasc. Res. 2018, 115, 776–787. [Google Scholar] [CrossRef]
- Shao, W.; Seth, D.M.; Navar, L.G.; Shao, Y.; Czymmek, K.J.A.; Jones, P.; Fomin, V.P.; Akanbi, K.; Duncan, R.L.; Farach-Carson, M.C. Augmentation of endogenous intrarenal angiotensin II levels in Val5-ANG II-infused rats. Am. J. Physiol. Ren. Physiol. 2009, 296, F1067–F1071. [Google Scholar] [CrossRef] [PubMed]
- Lombardi, D.; Gordon, K.L.; Polinsky, P.; Suga, S.; Schwartz, S.M.; Johnson, R.J. Salt-sensitive hypertension develops after short-term exposure to Angiotensin II. Hypertension 1999, 33, 1013–1019. [Google Scholar] [CrossRef] [PubMed]
- Jiang, L.-H.; Mackenzie, A.B.; North, R.A.; Surprenant, A. Brilliant Blue G Selectively Blocks ATP-Gated Rat P2 × 7 Receptors. Mol. Pharmacol. 2000, 58, 82–88. [Google Scholar] [CrossRef]
- Díaz-Hernández, M.; Díez-Zaera, M.; Sánchez-Nogueiro, J.; Gómez-Villafuertes, R.; Canals, J.M.; Alberch, J.; Miras-Portugal, M.T.; Lucas, J.J. Altered P2 × 7-receptor level and function in mouse models of Huntington’s disease and therapeutic efficacy of antagonist administration. FASEB J. 2009, 23, 1893–1906. [Google Scholar] [CrossRef] [PubMed]
- Nishiyama, A.; Inscho, E.W.; Navar, G. Interactions of adenosine A1 and A2areceptors on renal microvascular reactivity. Am. J. Physiol. Ren. Physiol. 2001, 280, F406–F414. [Google Scholar] [CrossRef]
- Al-Mashhadi, R.; Skøtt, O.; Vanhoutte, P.M.; Hansen, P.B.L.; Sk, O. Activation of A2 adenosine receptors dilates cortical efferent arterioles in mouse. Kidney Int. 2009, 75, 793–799. [Google Scholar] [CrossRef]
- Zhao, X.; Cook, A.K.; Field, M.; Edwards, B.; Zhang, S.; Zhang, Z.; Pollock, J.S.; Imig, J.D.; Inscho, E.W. Impaired Ca2+ Signaling Attenuates P2X Receptor–Mediated Vasoconstriction of Afferent Arterioles in Angiotensin II Hypertension. Hypertension 2005, 46, 562–568. [Google Scholar] [CrossRef]
- Heller, J.; Kramer, H.; Horácek, V. Comparative Effects of the Angiotensin II Receptor Blocker EXP 3174 and of the Angiotensin-Converting Enzyme Inhibitor Captopril on Renal Glomerular Hemodynamics in the Dog. Kidney Blood Press. Res. 1997, 20, 391–397. [Google Scholar] [CrossRef]
- Kulthinee, S.; Shao, W.; Franco, M.; Navar, L.G. Purinergic P2X1 receptor, purinergic P2X7 receptor, and angiotensin II type 1 receptor interactions in the regulation of renal afferent arterioles in angiotensin II-dependent hypertension. Am. J. Physiol. Ren. Physiol. 2020, 318, F1400–F1408. [Google Scholar] [CrossRef]
- Jacob, F.; Novo, C.P.; Bachert, C.; Van Crombruggen, K. Purinergic signaling in inflammatory cells: P2 receptor expression, functional effects, and modulation of inflammatory responses. Purinergic Signal. 2013, 9, 285–306. [Google Scholar] [CrossRef]
- Gombault, A.; Baron, L.; Couillin, I. ATP release and purinergic signaling in NLRP3 inflammasome activation. Front. Immunol. 2013, 3, 414. [Google Scholar] [CrossRef] [PubMed]
- Gong, T.; Yang, Y.; Jin, T.; Jiang, W.; Zhou, R. Orchestration of NLRP3 Inflammasome Activation by Ion Fluxes. Trends Immunol. 2018, 39, 393–406. [Google Scholar] [CrossRef] [PubMed]
- Hutton, H.L.; Ooi, J.; Holdsworth, S.R.; Kitching, A.R. The NLRP3 inflammasome in kidney disease and autoimmunity. Nephrology 2016, 21, 736–744. [Google Scholar] [CrossRef]
- Crowley, S.D.; Song, Y.-S.; Lin, E.E.; Griffiths, R.; Kim, H.-S.; Ruiz, P. Lymphocyte responses exacerbate angiotensin II-dependent hypertension. Am. J. Physiol. Integr. Comp. Physiol. 2010, 298, R1089–R1097. [Google Scholar] [CrossRef]
- Wen, Y.; Liu, Y.; Tang, T.; Lv, L.; Liu, H.; Ma, K.; Liu, B. NLRP3 inflammasome activation is involved in Ang II-induced kidney damage via mitochondrial dysfunction. Oncotarget 2016, 7, 54290–54302. [Google Scholar] [CrossRef]
- Volker, V.; Unwin, R.; Inscho, E.W.; Leipziger, J.; Kishore, B.K. Role of extracellular nucleotides in renal function. Physiol Rev. 2020, 100, 211–269. [Google Scholar]
- Rodriguez-Iturbe, B.; Vaziri, N.D.; Herrera-Acosta, J.; Johnson, R.J. Oxidative stress, renal infiltration of immune cells, and salt-sensitive hypertension: All for one and one for all. Am. J. Physiol. Ren. Physiol. 2004, 286, F606–F616. [Google Scholar] [CrossRef]
- Rodríguez-Iturbe, B.; Pons, H.; Quiroz, Y.; Gordon, K.; Rincón, J.; Chávez, M.; Parra, G.; Herrera-Acosta, J.; Gómez-Garre, D.; Largo, R.; et al. Mycophenolate mofetil prevents salt-sensitive hypertension resulting from angiotensin II exposure. Kidney Int. 2001, 59, 2222–2232. [Google Scholar]
- Zhang, K.; Fan, C.; Cai, D.; Zhang, Y.; Zuo, R.; Zhu, L.; Cao, Y.; Zhang, J.; Liu, C.; Chen, Y.; et al. Contribution of TGF-Beta-Mediated NLRP3-HMGB1 Activation to Tubulointerstitial Fibrosis in Rat with Angiotensin II-Induced Chronic Kidney Disease. Front. Cell Dev. Biol. 2020, 8, 1. [Google Scholar] [CrossRef]
- Azar, S.M.; Tobian, L.; Johnson, M.A. Glomerular, efferent arteriole peritubular capillary, and tubular pressures in hypertension. Am. J. Physiol. 1974, 227, 1045–1050. [Google Scholar] [CrossRef][Green Version]
- Deen, W.M.; Troy, J.L.; Robertson, C.R.; Brenner, B.M. Dynamics of glomerular filtration in the rat. IV: Determination of glomerular ultrafiltration coefficient. J. Clin. Investig. 1973, 52, 1500–1580. [Google Scholar]
- Davidson, W.D.; Sackner, M.A. Simplification of the Anthrone Method for the Determination of Inulin in Clearance Studies. J. Lab. Clin. Med. 1963, 62, 351–356. [Google Scholar]
- Vurek, G.G.; Pegram, S.E. Fluorometric method for the determination of nanogram quantities of inulin. Anal. Biochem. 1966, 16, 409–419. [Google Scholar] [CrossRef]
- Viets, J.W.; Deen, W.M.; Troy, J.L.; Brenner, B.M. Determination of serum protein concentration in nanoliter blood samples using fluorescamine or o-phthalaldehyde. Anal. Biochem. 1978, 88, 513–521. [Google Scholar] [CrossRef]
- Baylis, C.; Deen, W.; Myers, B.; Brenner, B. Effects of some vasodilator drugs on transcapillary fluid exchange in renal cortex. Am. J. Physiol. Content 1976, 230, 1148–1158. [Google Scholar] [CrossRef]
- Henry, R.J.; Sobel, C.; Segalove, M. Turbidimetric Determination of Proteins with Sulfosalicylic and Trichloracetic Acids. Exp. Biol. Med. 1956, 92, 748–751. [Google Scholar] [CrossRef]
- Gangadharan, V.; Nohe, A.; Caplan, J.; Czymmek, K.; Duncan, R.L. Caveolin-1 regulates P2 × 7 receptor signaling in osteoblasts. Am. J. Physiol. Cell Physiol. 2015, 308, C41–C50. [Google Scholar] [CrossRef]
- Sorrelle, N.; Ganguly, D.; Dominguez, A.; Zhang, Y.; Huang, H.; Dahal, L.N.; Burton, N.; Ziemys, A.; Brekken, R.A. Improved Multiplex Immunohistochemistry for Immune Microenvironment Evaluation of Mouse Formalin-Fixed, Paraffin-Embedded Tissues. J. Immunol. 2018, 202, 292–299. [Google Scholar] [CrossRef]
- Chen, M.L.; Lin, K.; Lin, S.K. NLRP3 inflammasome signaling as an early molecular response is negatively controlled by miR-186 in CFA-induced prosoplasia mice. Braz. J. Med. Biol. Res. 2018, 51, e7602. [Google Scholar]


© 2020 by the authors. Licensee MDPI, Basel, Switzerland. This article is an open access article distributed under the terms and conditions of the Creative Commons Attribution (CC BY) license (http://creativecommons.org/licenses/by/4.0/).
Share and Cite
Bautista-Pérez, R.; Pérez-Méndez, O.; Cano-Martínez, A.; Pacheco, U.; Santamaría, J.; Rodríguez-Sámano, F.; Rodríguez-Iturbe, B.; Navar, L.G.; Franco, M. The Role of P2X7 Purinergic Receptors in the Renal Inflammation Associated with Angiotensin II-Induced Hypertension. Int. J. Mol. Sci. 2020, 21, 4041. https://doi.org/10.3390/ijms21114041
Bautista-Pérez R, Pérez-Méndez O, Cano-Martínez A, Pacheco U, Santamaría J, Rodríguez-Sámano F, Rodríguez-Iturbe B, Navar LG, Franco M. The Role of P2X7 Purinergic Receptors in the Renal Inflammation Associated with Angiotensin II-Induced Hypertension. International Journal of Molecular Sciences. 2020; 21(11):4041. https://doi.org/10.3390/ijms21114041
Chicago/Turabian StyleBautista-Pérez, Rocio, Oscar Pérez-Méndez, Agustina Cano-Martínez, Ursino Pacheco, José Santamaría, Fernando Rodríguez-Sámano, Bernardo Rodríguez-Iturbe, L. Gabriel Navar, and Martha Franco. 2020. "The Role of P2X7 Purinergic Receptors in the Renal Inflammation Associated with Angiotensin II-Induced Hypertension" International Journal of Molecular Sciences 21, no. 11: 4041. https://doi.org/10.3390/ijms21114041
APA StyleBautista-Pérez, R., Pérez-Méndez, O., Cano-Martínez, A., Pacheco, U., Santamaría, J., Rodríguez-Sámano, F., Rodríguez-Iturbe, B., Navar, L. G., & Franco, M. (2020). The Role of P2X7 Purinergic Receptors in the Renal Inflammation Associated with Angiotensin II-Induced Hypertension. International Journal of Molecular Sciences, 21(11), 4041. https://doi.org/10.3390/ijms21114041