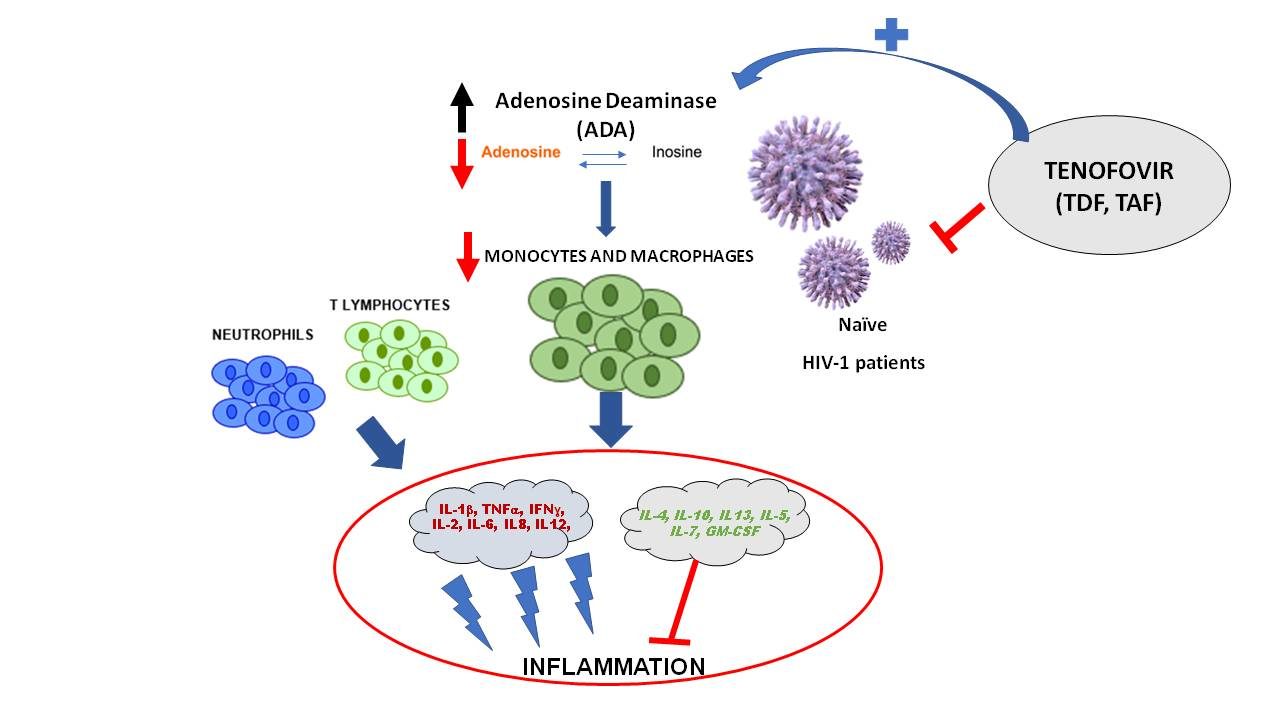
Adenosine Deaminase as a Biomarker of Tenofovir Mediated Inflammation in Naïve HIV Patients

 , ,
, ,  , and
, and
Abstract
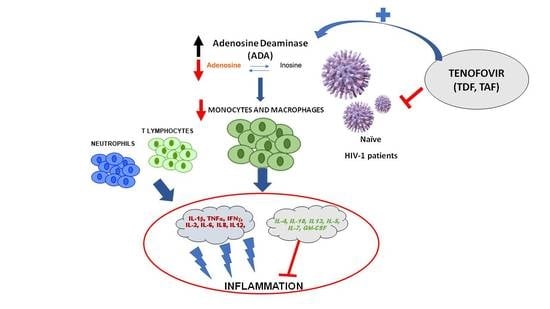
1. Introduction
2. Results
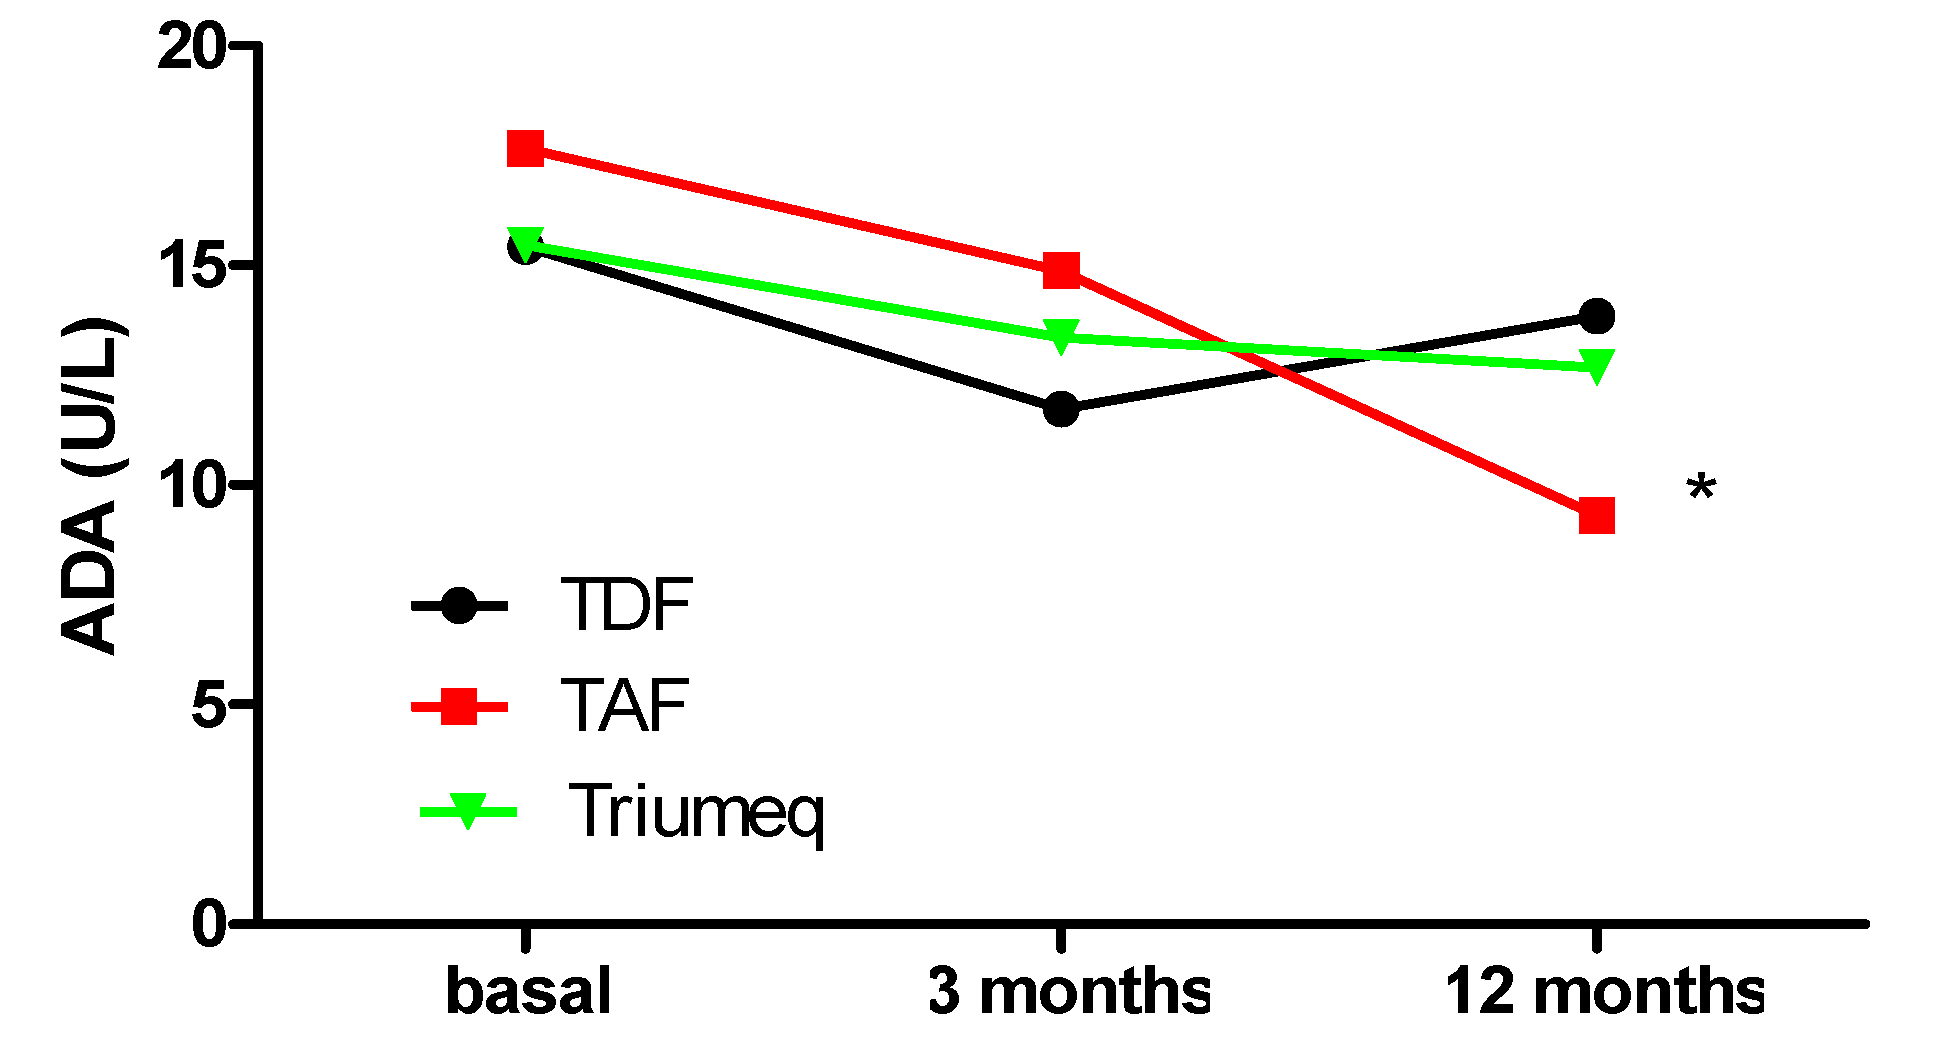
2.1. Comparative Evolution of ADA Expression at 3 and 12 Months after Treatment Initiation
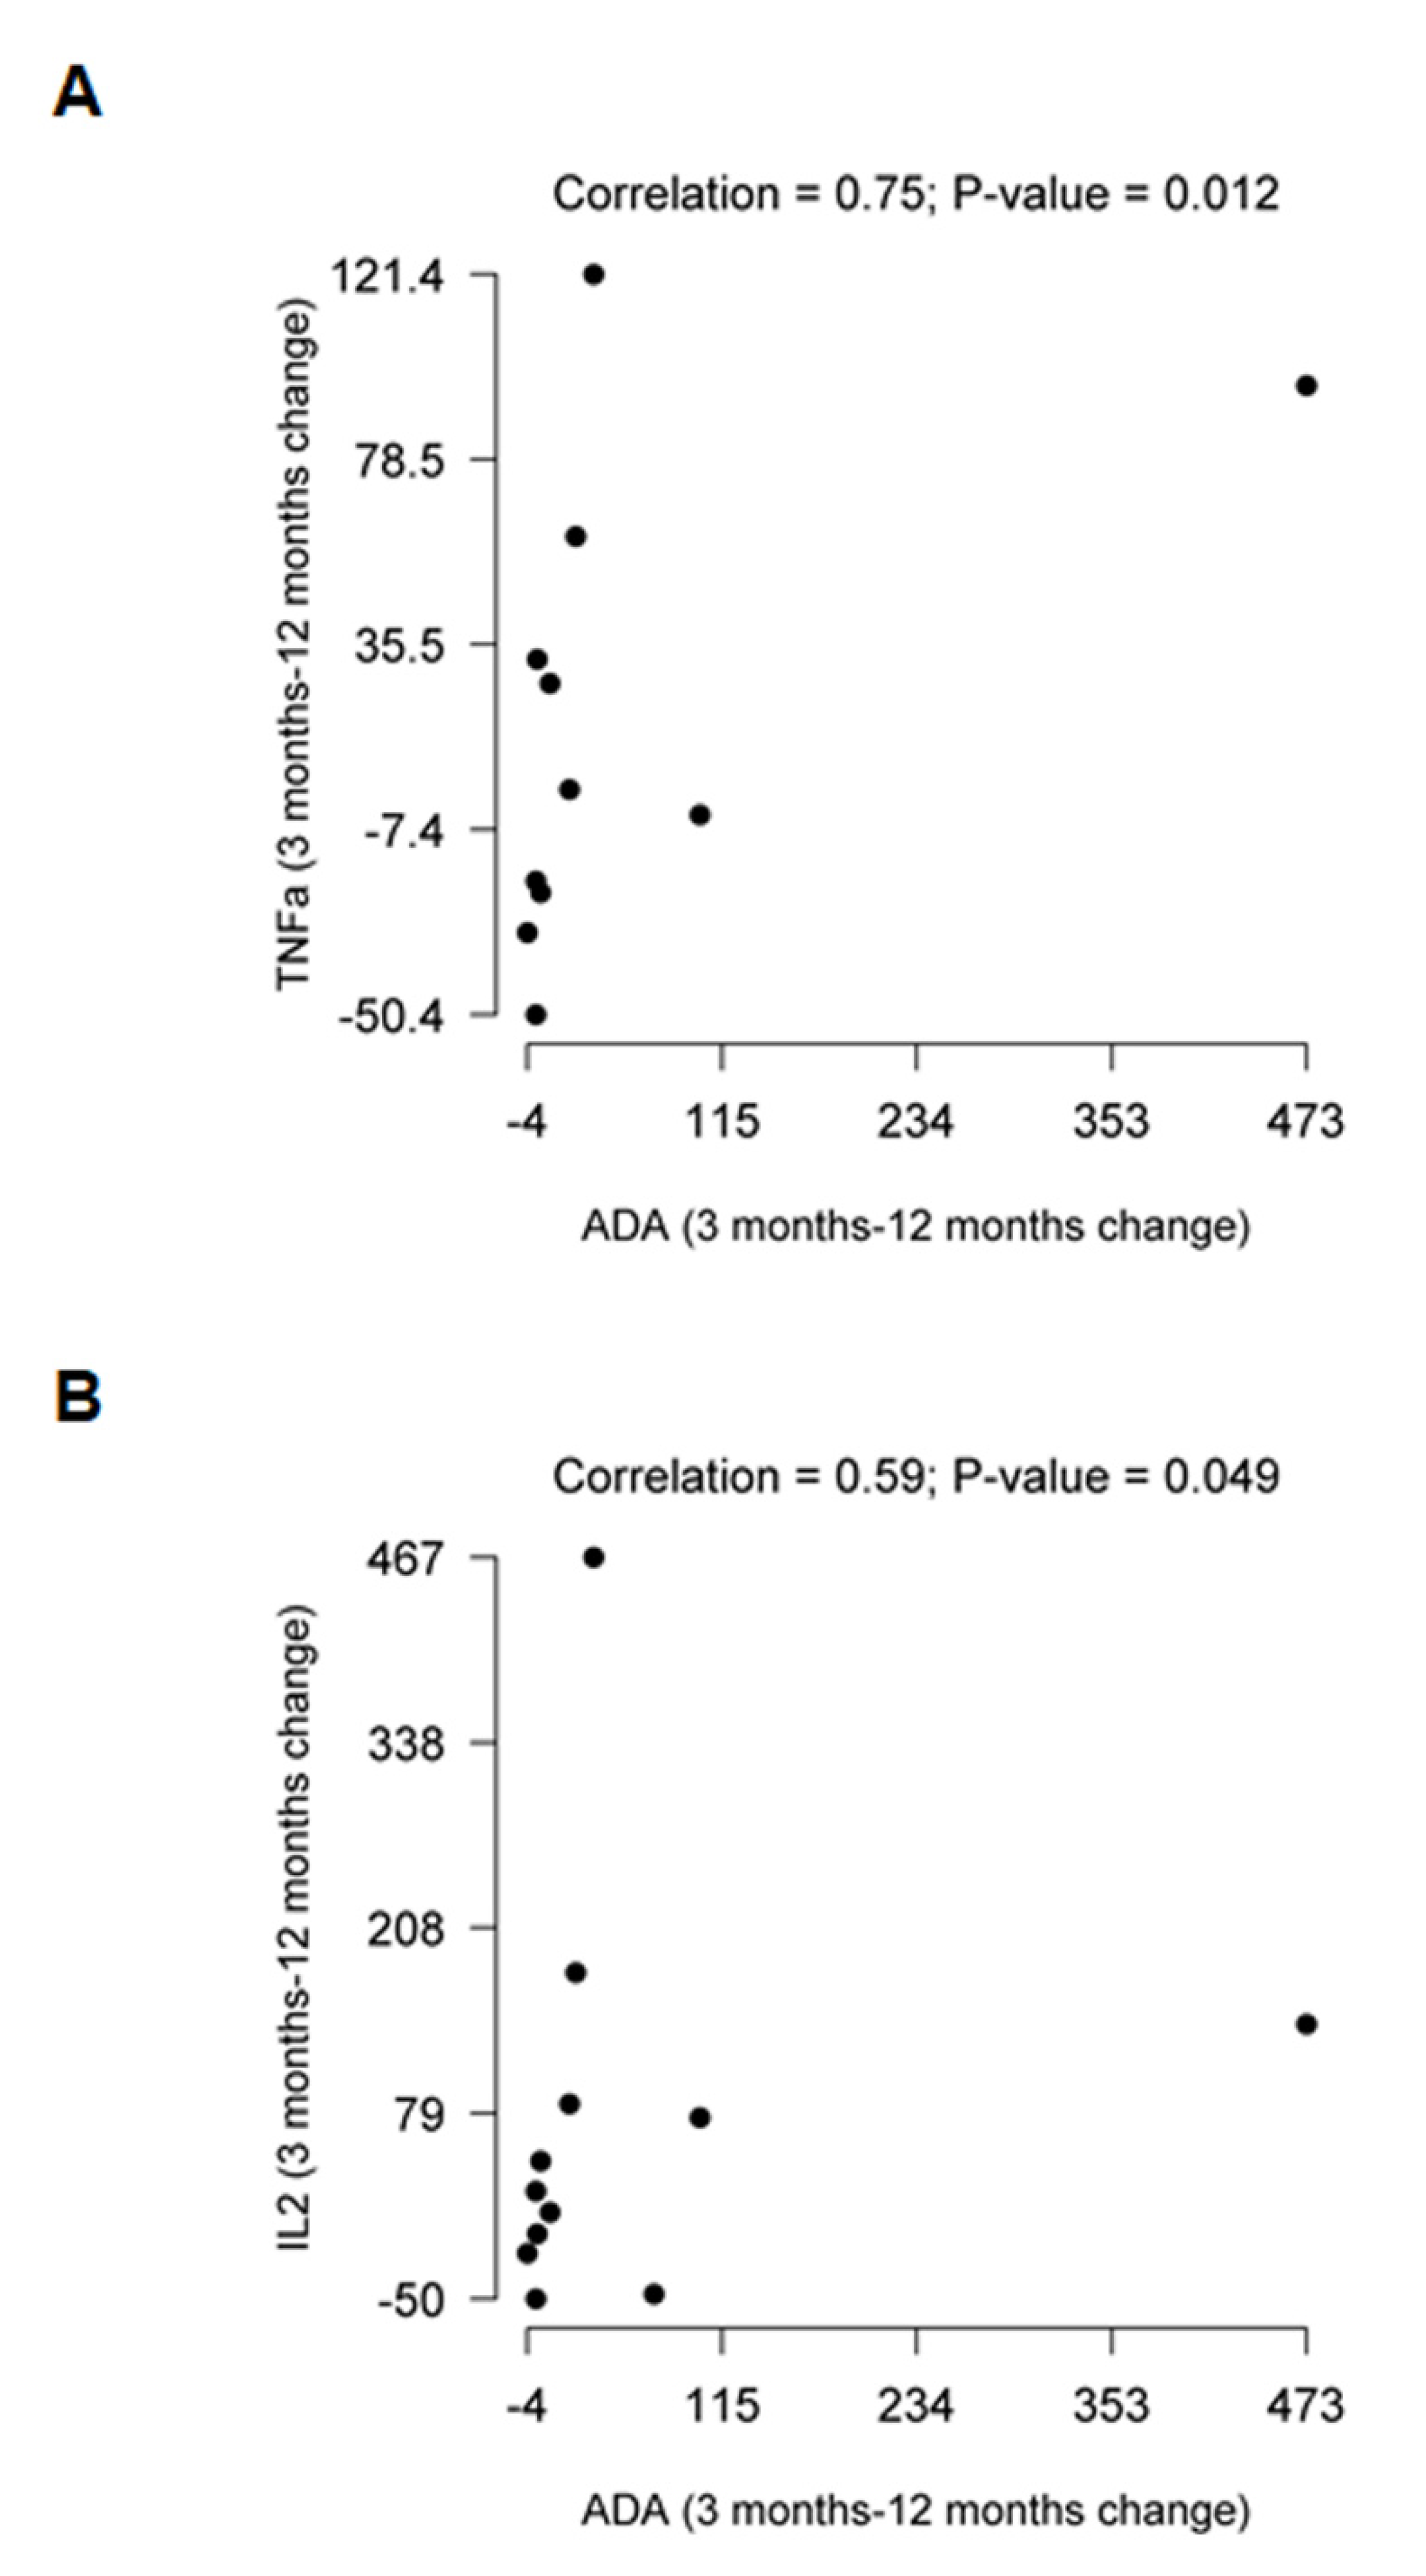
2.2. Comparative Evolution of Cytokine Expression at 12 Months after Treatment Initiation
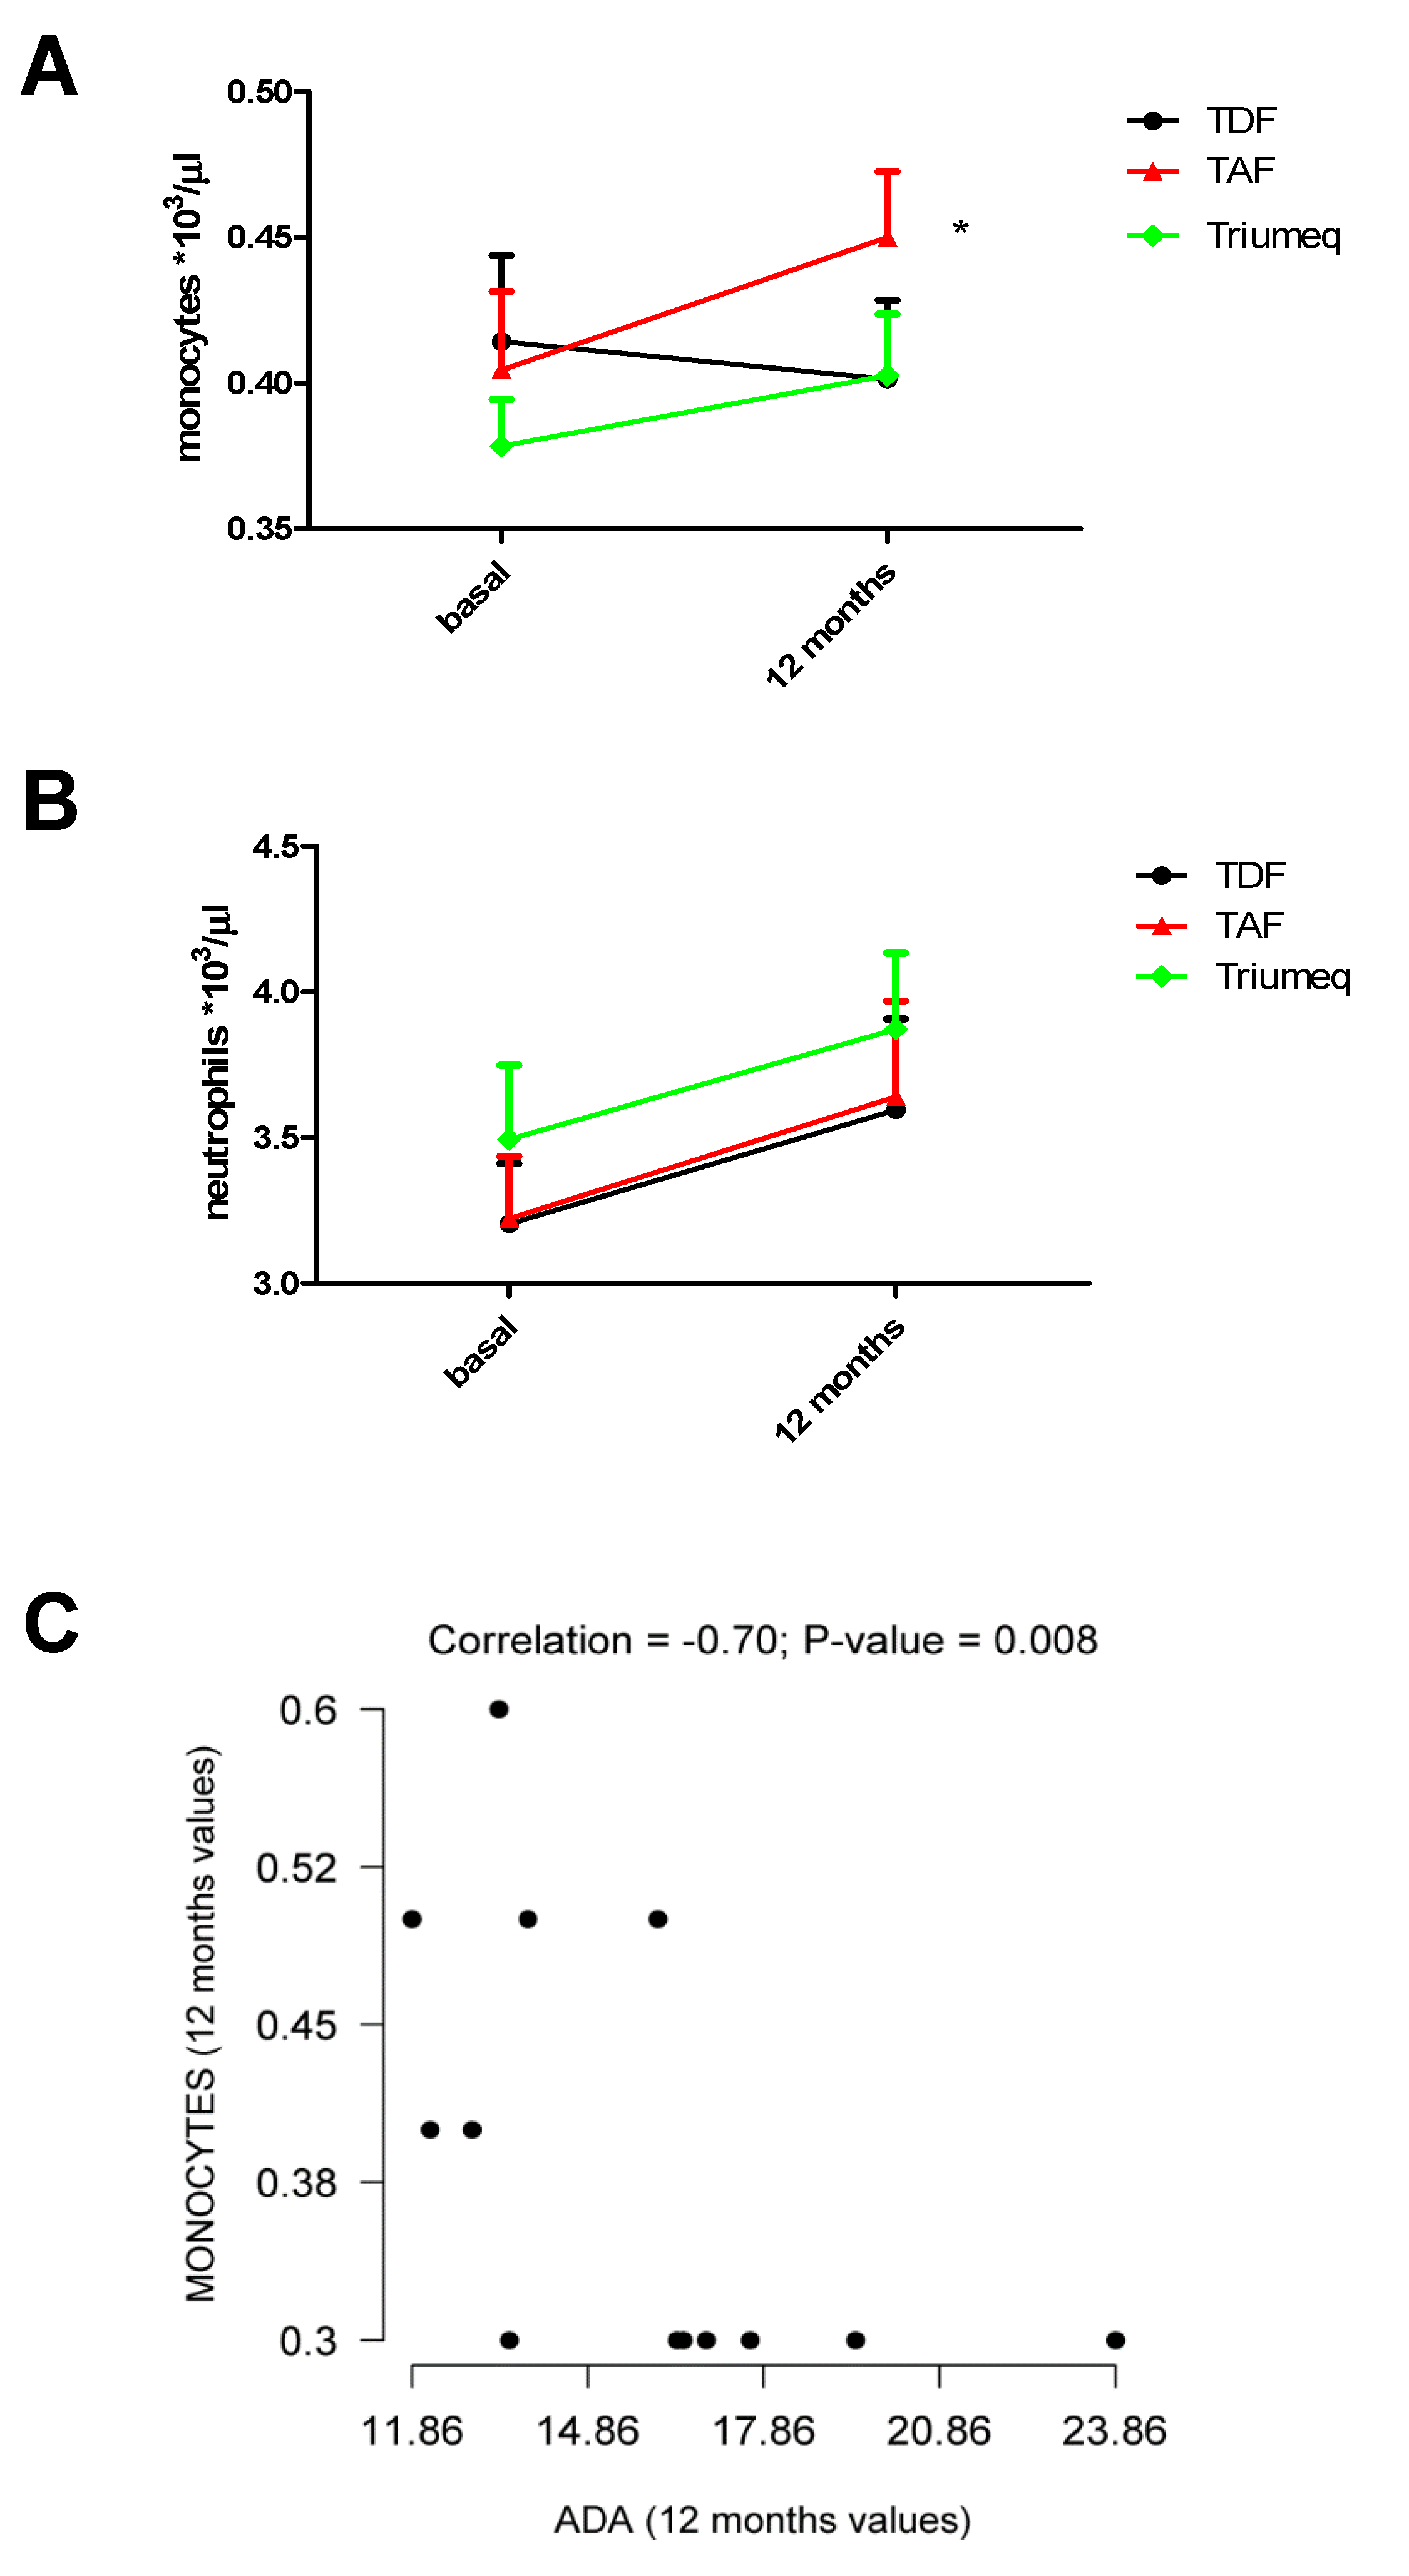
2.3. Changes in Monocytes and Neutrophils Within the 12 Months of Treatment
3. Discussion
4. Materials and Methods
4.1. Subject and Design—Inclusion and Exclusion Criteria and Ethical Aspects
4.2. Measurements and Reference Values
4.3. Cytokines Measurement by MILLIPLEX® Multiplex Assays Using Luminex®
4.4. Statistical Analysis
Supplementary Materials
Author Contributions
Funding
Acknowledgments
Conflicts of Interest
References
- Hasko, G.; Cronstein, B.N. Adenosine: An endogenous regulator of innate immunity. Trends Immunol. 2004, 25, 33–39. [Google Scholar] [CrossRef] [PubMed]
- Fredholm, B.B. Adenosine—A physiological or pathophysiological agent? Mole. Med. 2014, 95, 201–220. [Google Scholar] [CrossRef] [PubMed]
- Whitmore, K.V.; Gaspar, H.B. Adenosine Deaminase Deficiency-More Than Just an Immunodeficiency. Front. Immunol. 2016, 7, 314. [Google Scholar] [CrossRef] [PubMed]
- Shore, A.; Dosch, H.M.; Gelfand, E.W. Role of adenosine deaminase in the early stages of precursor T cell maturation. Clin. Exp. Immunol. 1981, 44, 152–155. [Google Scholar] [PubMed]
- Kaljas, Y.; Liu, C.; Skaldin, M.; Wu, C.; Zhou, Q.; Lu, Y.; Aksentijevich, I.; Zavialov, A.V. Human adenosine deaminases ADA1 and ADA2 bind to different subsets of immune cells. Cell Mol. Life Sci. 2016, 74, 555–570. [Google Scholar] [CrossRef]
- Conlon, B.A.; Law, W.R. Macrophages are a source of extracellular adenosine deaminase-2 during inflammatory responses. Clin. Exp. Immunol. 2004, 138, 14–20. [Google Scholar] [CrossRef]
- Antonioli, L.; Colucci, R.; La Motta, C.; Tuccori, M.; Awwad, O.; Da Settimo, F.; Blandizzi, C.; Fornai, M. Adenosine deaminase in the modulation of immune system and its potential as a novel target for treatment of inflammatory disorders. Curr. Drug Targets 2012, 13, 842–862. [Google Scholar] [CrossRef]
- Al-Shammary, F.J. Adenosine deaminase activity in serum and pleural effusions of tuberculous and non-tuberculous patients. Biochem. Mol. Biol. 1997, 43, 763–779. [Google Scholar] [CrossRef]
- Demir, G.; Borman, P.; Ayhan, F.; Ozgün, T.; Kaygısız, F.; Yilmez, G. Serum Adenosine Deaminase Level is High But Not Related with Disease Activity Parameters in Patients with Rheumatoid Arthritis. Open Rheumatol. J. 2014, 8, 24–28. [Google Scholar] [CrossRef]
- da Silva, J.L.G.; Passos, D.F.; Bernardes, V.M.; Leal, D.B.R. ATP and adenosine: Role in the immunopathogenesis of rheumatoid arthritis. Immunol. Lett. 2019, 214, 55–64. [Google Scholar] [CrossRef]
- Rodrigues, V.; Ruffin, N.; San-Roman, M.; Benaroch, P. Myeloid Cell Interaction with HIV: A Complex Relationship. Front. Immunol. 2017, 8, 1698. [Google Scholar] [CrossRef]
- Kedzierska, K.; Maerz, A.; Warby, T.; Jaworowski, A.; Chan, H.; Mak, J.; Sonza, S.; Lopez, A.; Crowe, S. Granulocyte-macrophage colony stimulating factor inhibits HIV-1 replication in monocyte-derived macrophages. AIDS 2000, 14, 1739–1748. [Google Scholar] [CrossRef]
- Sonza, S.; Maerz, A.; Deacon, N.; Meanger, J.; Mills, J.; Crowe, S. Human immunodeficiency virus type 1 replication is blocked prior to reverse transcription and integration in freshly isolated peripheral blood monocytes. J. Virol. 1996, 70, 3863–3869. [Google Scholar] [CrossRef]
- Osborn, L.; Kunkel, S.; Nabel, G.J. Tumor necrosis factor a and interleukin 1 stimulate the human immunodeficiency virus enhancer by activation of the nuclear factor Ƙb. Proc. Nat. Acad. Sci. USA 1989, 7, 2336–2340. [Google Scholar] [CrossRef]
- Schnittman, S.M.; Singer, K.H.; Greenhouse, J.J.; Stanley, S.K.; Whichard, L.P.; Le, P.T.; Haynes, B.F.; Fauci, A.S. Thymic microenvironment induces HIV expression. Physiologic secretion of IL-6 by thymic epithelial cells up-regulates virus expression in chronically infected cells. J. Immunol. 1991, 147, 2553–2558. [Google Scholar]
- Bogner, J.R.; Walli, R.; Goebel, F.D. Th1/Th2 shift in HIV lymph nodes: No contribution of CD60 cells. Infection 2001, 29, 32–36. [Google Scholar] [CrossRef]
- Klein, S.A.; Dobmeyer, J.M.; Dobmeyer, T.S.; Pape, M.; Ottmann, O.G.; Helm, E.B.; Hoelzer, D.; Rossol, R. Demonstration of the Th1 to Th2 cytokine shift during the course of HIV-1 infection using cytoplasmic cytokine detection on single cell level by flow cytometry. AIDS 1997, 11, 1111–1118. [Google Scholar] [CrossRef]
- Romagnani, S.; Maggi, E.; Del Petre, G. An alternative view of the Th1/Th2 switch hypothesis in HIV infection.Alternative view of the Th1/Th2 switch hypothesis in HIV infection. Aids Res. Hum. Retrovir. 1994, 10, 3–9. [Google Scholar] [CrossRef]
- Anthony, K.B.; Yoder, C.; Metcalf, J.A.; DerSimonian, R.; Orenstein, J.M.; Stevens, R.A.; Falloon, J.; Polis, M.A.; Lane, H.C.; Sereti, I. Incomplete CD4 T cell recovery in HIV-1 infection after 12 months of highly active antiretroviral therapy is associated with ongoing increased CD4 T cell activation and turnover. J. Aids 2003, 33, 125–133. [Google Scholar] [CrossRef]
- Massanella, M.; Fromentin, R.; Chomont, N. Residual inflammation and viral reservoirs: Alliance against an HIV cure. Curr. Opin. Hiv Aids 2016, 11, 234–241. [Google Scholar] [CrossRef]
- Zídek, Z.; Franková, D.; Holý, A. Activation by 9-(R)-[2-(phosphonomethoxy)propyl]adenine of chemokine (RANTES, macrophage inflammatory protein 1 alpha) and cytokine (tumor necrosis factor alpha, interleukin-10 [IL-10], IL-1beta) production. Antimicrob Agents Chemother 2001, 45, 3381–3386. [Google Scholar] [CrossRef] [PubMed]
- Zídek, Z.; Kmonícková, E.; Holý, A. Secretion of antiretroviral chemokines by human cells cultured with acyclic nucleoside phosphonates. Eur. J. Pharmacol. 2007, 574, 77–84. [Google Scholar] [CrossRef] [PubMed]
- Valenzuela, A.; Blanco, J.; Callebaut, C.; Jacotot, E.; Lluis, C.; Hovanessian, A.G.; Franco, R. Adenosine deaminase binding to human CD26 is inhibited by HIV-1 envelope glycoprotein gp120 and viral particles. J. Immunol. 1997, 158, 3721–3729. [Google Scholar] [PubMed]
- Blanco, J.; Valenzuela, A.; Herrera, C.; Lluís, C.; Hovanessian, A.G.; Franco, R. The HIV-1 gp120 inhibits the binding of adenosine deaminase to CD26 by a mechanism modulated by CD4 and CXCR4 expression. FEBS Lett. 2000, 477, 123–128. [Google Scholar] [CrossRef]
- Martinez-Navio, J.M.; Climent, N.; Pacheco, R.; Garcia, F.; Plana, M.; Nomdedeu, M.; Oliva, H.; Rovira, C.; Miralles, L.; Gatell, J.M.; et al. Immunological dysfunction in HIV-1-infected individuals caused by impairment of adenosine deaminase-induced costimulation of T-cell activation. Immunology 2009, 128, 393–404. [Google Scholar] [CrossRef] [PubMed]
- Nikolova, M.; Carriere, M.; Jenabian, M.A.; Limou, S.; Younas, M.; Kök, A.; Huë, S.; Seddiki, N.; Hulin, A.; Delaneau, O.; et al. CD39/adenosine pathway is involved in AIDS progression. PLoS Pathog. 2011, 7, e1002110. [Google Scholar] [CrossRef]
- Naval-Macabuhay, I.; Casanova, V.; Navarro, G.; Garcıa, F.; Leon, A.; Miralles, L.; Rovira, C.; Martinez-Navio, J.M.; Gallart, T.; Mallol, J.; et al. Adenosine deaminase regulates Treg expression in autologous T cell-dendritic cell cocultures from patients infected with HIV-1. J. Leuko Biol. 2016, 99, 349–359. [Google Scholar] [CrossRef]
- Passos, D.F.; Bernardes, V.M.; da Silva, J.L.G.; Schetinger, M.R.C.; Leal, D.B.R. Adenosine signaling and adenosine deaminase regulation of immune responses: Impact on the immunopathogenesis of HIV infection. Purinergic Signal 2018, 14, 309–320. [Google Scholar] [CrossRef]
- Ipp, H.; Zemlin, A.E.; Glashoff, R.H.; van Wyk, J.; Vanker, N.; Reid, T.; Bekker, L.G. Serum adenosine deaminase and total immunoglobulin G correlate with markers of immune activation and inversely with CD4 counts in asymptomatic, treatment-naive HIV infection. J. Clin. Immunol. 2013, 33, 605–612. [Google Scholar] [CrossRef]
- Hershfield, M.S.; Kurtzberg, J.; Chaffee, S.; Reisner, E.G. Adenosine deaminase (ada) expressed at high level in t lymphocytes of a patient with ada deficiency and severe combined immune deficiency disease (SCIDscid). Pediatric Res. 1988, 24, 120. [Google Scholar] [CrossRef][Green Version]
- Flinn, A.M.; Gennery, A.R. Adenosine deaminase deficiency: A review. Orphanet. J. Rare Dis. 2018, 13, 65. [Google Scholar] [CrossRef] [PubMed]
- Warby, T.J.; Crowe, S.M.; Jaworowski, A. Human Immunodeficiency Virus Type 1 Infection Inhibits Granulocyte-Macrophage Colony-Stimulating Factor-Induced Activation of STAT5A in Human Monocyte-Derived Macrophages. J. Virol. 2003, 77, 12630–12638. [Google Scholar] [CrossRef] [PubMed]
- Hammer, S.M.; Gillis, J.M.; Pinkston, P.; Rose, R.M. Effect of zidovudine and granulocyte-macrophage colony-stimulating factor on human immunodeficiency virus replication in alveolar macrophages. Blood 1990, 75, 1215–1219. [Google Scholar] [CrossRef] [PubMed]
- Perno, C.F.; Cooney, D.A.; Gao, W.Y.; Hao, Z.; Johns, D.G.; Foli, A.; Hartman, N.R.; Caliò, R.; Broder, S.; Yarchoan, R. Effects of bone marrow stimulatory cytokines on human immunodeficiency virus replication and the antiviral activity of dideoxynucleosides in cultures of monocyte/macrophages. Blood 1992, 80, 995–1003. [Google Scholar] [CrossRef]
- Chan, H.L.; Fung, S.; Seto, W.K.; Chuang, W.L.; Chen, C.Y.; Kim, H.J.; Hui, A.J.; Janssen, H.L.; Chowdhury, A.; Tsang, T.Y. GS-US-320-0110 Investigators. Tenofovir alafenamide versus tenofovir disoproxil fumarate for the treatment of HBeAg-positive chronic hepatitis B virus infection: A randomised, double-blind, phase 3, non-inferiority trial. Lancet Gastroenterol. Hepatol. 2016, 1, 185–195. [Google Scholar] [CrossRef]
- Buti, M.; Gane, E.; Seto, W.K.; Chan, H.L.; Chuang, W.L.; Stepanova, T.; Hui, A.J.; Lim, Y.S.; Mehta, R.; Janssen, H.L.; et al. GS-US-320-0108 Investigators. Tenofovir alafenamide versus tenofovir disoproxil fumarate for the treatment of patients with HBeAg-negative chronic hepatitis B virus infection: A randomised, double-blind, phase 3, non-inferiority tria. Lancet Gastroenterol. Hepatol. 2016, 1, 196–206. [Google Scholar] [CrossRef]
- Schepp, J.; Proietii, M.; Frede, N.; Buchta, M.; Hübscher, K.; Rojas Restrepo, J.; Goldacker, S.; Warnatz, K.; Pachlopnik Schmid, J.; Duppenthaler, A.; et al. Screening of 181 Patients With Antibody Deficiency for Deficiency of Adenosine Deaminase 2 Sheds New Light on the Disease in Adulthood. Arthritis Rheumatol. 2017, 69, 1689–1700. [Google Scholar] [CrossRef]
- de Arquer, G.R.; Peña, R.; Cabrera, C.; Coma, G.; Ruiz-Hernandez, R.; Guerola, R.; Clotet, B.; Ruiz, L.; Este, J.A.; Calle, M.L.; et al. Skewed expression and up-regulation of the IL-12 and IL-18 receptors in resting and activated CD4 T cells from HIV-1-infected patients. J. Leukoc. Biol. 2007, 82, 72–78. [Google Scholar] [CrossRef]
- Pauls, E.; Jimenez, E.J.; Ruiz, A.; Permanyer, M.; Ballana, E.; Costa, H.; Nascimiento, R.; Parkhouse, R.M.; Peña, R.; Riveiro-Muñoz, E.; et al. Restriction of HIV-1 replication in primary macrophages by IL-12 and IL-18 through the upregulation of SAMHD1. J. Immunol. 2013, 190, 4736–4741. [Google Scholar] [CrossRef]
- Ma, X.; Montaner, L.J. Proinflammatory response and IL-12 expression in HIV-1 infection. J. Leuko Biol. 2000, 68, 383–390. [Google Scholar]
- Osuji, F.N.; Onyenekwe, C.C.; Ahaneku, J.E.; Ukibe, N.R. The effects of highly active antiretroviral therapy on the serum levels of pro-inflammatory and anti-inflammatory cytokines in HIV infected subjects. J. Biomed. Sci. 2018, 25, 88. [Google Scholar] [CrossRef] [PubMed]
- Kaur, R.; Dhakad, M.; Goal, R.; Bhalla, P.; Dewan, R. Study of TH1/TH2 cytokine profiles in HIV/AIDS patients in a tertiary care hospital India. J. Med. Microbiol. Diagn. 2016, 5, 214–221. [Google Scholar] [CrossRef]
- Roff, S.R.; Noon-Song, E.N.; Yamamoto, J.K. The Significance of Interferon-γ in HIV-1 Pathogenesis, Therapy and Prophylaxis. Front. Immunol. 2014, 4, 498. [Google Scholar] [CrossRef] [PubMed]
- Watanabe, D.; Uehira, T.; Yonemoto, H.; Bando, H.; Ogawa, Y.; Yajima, K.; Taniguchi, T.; Kasai, D.; Nishida, Y.; Shirasaka, T. Sustained high levels of serum interferon-γ during HIV-1 infection: A specific trend different from other cytokines. Viral. Immunol. 2010, 23, 619–625. [Google Scholar] [CrossRef]
- Brockman, M.A.; Kwn, D.; Tighe, D.P.; Pavlik, D.F.; Rosato, P.C.; Sela, J.; Porichis, F.; Le Gall, S.; Waring, M.T.; Moss, K.; et al. IL-10 is up-regulated in multiple cell types during viremic HIV infection and reversibly inhibits virus-specific T cells. Blood 2009, 114, 346–356. [Google Scholar] [CrossRef]
- Burgess, L.J.; Reuter, H.; Carstens, M.E.; Taljaard, J.J.; Doubell, A.F. The use of adenosine deaminase and interferon-gamma as diagnostic tools for tuberculous pericarditis. Chest 2002, 122, 900–905. [Google Scholar] [CrossRef]
- Haskó, G.; Linden, J.; Cronstein, B.; Pacher, P. Adenosine receptors: Therapeutic aspects for inflammatory and immune diseases. Nat. Rev. Drug. Discov. 2008, 7, 759–770. [Google Scholar] [CrossRef]
- Haskó, G.; Kuhel, D.G.; Chen, J.F.; Schwarzschild, M.A.; Deitch, E.A.; Mabley, J.G.; Marton, A.; Szabó, C. Adenosine inhibits IL-12 and TNF-[alpha] production via adenosine A2a receptor-dependent and independent mechanisms. Faseb J. 2000, 14, 2065–2074. [Google Scholar] [CrossRef]
- Chan, E.S.; Fernandez, P.; Cronstein, B.N. Adenosine in inflammatory joint diseases. Purinergic Signal 2007, 3, 145–152. [Google Scholar] [CrossRef]
- Reddy, J.; Chastagner, P.; Fiette, L.; Liu, X.; Theze, J. IL-2-induced tumor necrosis factor (TNF)-β expression: Further analysis in the IL-2 knockout model, and comparison with TNF-α, lymphotoxin-β, TNFR1 and TNFR2 modulation. Int. Immunol. 2001, 13, 135–147. [Google Scholar] [CrossRef]
- Feig, J.L.; Mediero, A.; Corciulo, C.; Liu, H.; Zhang, J.; Perez-Aso, M.; Picard, L.; Wilder, T.; Cronstein, B. The antiviral drug tenofovir, an inhibitor of Pannexin-1-mediated ATP release, prevents liver and skin fibrosis by downregulating adenosine levels in the liver and skin. PLoS ONE 2017, 12, e0188135. [Google Scholar] [CrossRef] [PubMed]
- Grünig, G. IL-13 and adenosine: Partners in a molecular dance? J. Clin. Investig. 2003, 112, 329–331. [Google Scholar] [CrossRef] [PubMed]
- Conesa-Buendía, F.M.; Llamas-Granda, P.; Larrañaga-Vera, A.; Wilder, T.; Largo, R.; Herrero-Beaumont, G.; Cronstein, B.; Mediero, A. Tenofovir Causes Bone Loss via Decreased Bone Formation and Increased Bone Resorption, Which Can Be Counteracted by Dipyridamole in Mice. J. Bone Min. Res. 2019, 34, 923–938. [Google Scholar] [CrossRef]
- Ciruela, F.; Saura, C.; Canela, E.I.; Mallol, J.; Lluis, C.; Franco, R. Adenosine deaminase affects ligand-induced signalling by interacting with cell surface adenosine receptors. FEBS Lett. 1996, 380, 219–223. [Google Scholar] [CrossRef]
- Moreno, E.; Canet, J.; Gracia, E.; Lluís, C.; Mallol, J.; Canela, E.I.; Cortés, A.; Casadó, V. Molecular Evidence of Adenosine Deaminase Linking Adenosine A2A Receptor and CD26 Proteins. Front. Pharm. 2018, 9, 106. [Google Scholar] [CrossRef]
- He, W.; Cronstein, B. Adenosine A1 receptor regulates osteoclast formation by altering TRAF6/TAK1 signaling. Purinergic. Signal 2012, 8, 327–337. [Google Scholar] [CrossRef]
- He, W.; Wilder, T.; Cronstein, B.N. Rolofylline, an adenosine A1 receptor antagonist, inhibits osteoclast differentiation as an inverse agonist. Br. J. Pharm. 2013, 170, 1167–1176. [Google Scholar] [CrossRef]
- Mediero, A.; Kara, F.M.; Wilder, T.; Cronstein, B.N. Adenosine A(2A) receptor ligation inhibits osteoclast formation. Am. J. Pathol. 2012, 180, 775–786. [Google Scholar] [CrossRef]
- Samuel, C.E. Adenosine Deaminases Acting on RNA (ADARs) are both Antiviral and Proviral Dependent upon the Virus. Virology 2011, 411, 180–193. [Google Scholar] [CrossRef]
- Samuel, C.E. Adenosine deaminase acting on RNA (ADAR1), a suppressor of double-stranded RNA–triggered innate immune responses. JBC Rev. 2019, 294, 1710–1720. [Google Scholar] [CrossRef]


| ADA (U/L) Plasma Concentrations | |||
|---|---|---|---|
| Treatment | Baseline | 3 Months | 12 Months |
| TDF | 15.43 (12.76, 17.94) (n = 20) | 11.72 (9.55, 14.95) (n = 17) | 13.84 (12.53, 16.69) (n = 13) |
| TAF | 17.66 (13.50, 22.31) (n = 13) | 14.87 (12.52, 17.81) (n = 16) | 9.30 (7.95, 12.72) (n = 4) * |
| Triumeq | 15.46 (13.81, 21.60) (n = 37) | 13.36 (11.55, 17.92) (n = 33) | 12.68 (11.59, 14.75) (n = 23) |
| Cytokine Increments Baseline: 12 Months Post-Treatment | |||||||||
|---|---|---|---|---|---|---|---|---|---|
| TDF | TAF | Triumeq | |||||||
| Variable | Median (Q1, Q3) | p | Median (Q1, Q3) | p | Median (Q1, Q3) | p | p1 | p2 | p3 |
| Pro-Inflammatory Cytokines | |||||||||
| TNFα | −5.6 (−23.1, 33.6) | 0.893 | 44.8 (3.2, 81.3) | 0.007 | 1.8 (−29.0, 42.3) | 0.609 | 0.075 | 0.907 | 0.091 |
| IFNγ | 19.2 (−39.2, 69.6) | 0.358 | 30.5 (−10.4, 62.4) | 0.055 | −11.1 (−44.6, 55.9) | 0.228 | 0.627 | 0.663 | 0.224 |
| IL1β | −1.9 (−39.2, 17.1) | 0.946 | 28.9 (−32.9, 64.0) | 0.170 | −12.4 (−56.4, 30.7) | 0.902 | 0.395 | 0.711 | 0.235 |
| IL2 | 33.6 (−6.2, 113.4) | 0.042 | 62.1 (6.9, 106.6) | 0.002 | 21.7 (−17.5, 77.8) | 0.336 | 0.553 | 0.782 | 0.267 |
| IL6 | 55.3 (−2.9, 213.6) | 0.03 | 129.9 (4.0, 222.1) | 0.005 | 2.4 (−49.3, 119.6) | 0.540 | 0.837 | 0.218 | 0.083 |
| IL8 | 41.0 (−1.5, 152.5) | 0.078 | 108.5 (45.4, 207.3) | 0.000 | 27.9 (−31.3, 129.1) | 0.337 | 0.179 | 0.497 | 0.015 |
| IL12 | −4.0 (−44.8, 33.7) | 0.305 | −15.1 (−43.4, 34.4) | 0.651 | −36.0 (−59.0, 3.5) | 0.086 | 0.734 | 0.293 | 0.267 |
| Anti-Inflammatory Cytokines | |||||||||
| IL4 | −35.7 (−62.9, −3.4) | 0.005 | −59.4 (−74.2, −46.9) | 0.008 | −51.1 (−65.3, -18.0) | 0.231 | 0.255 | 0.636 | 0.315 |
| IL10 | −20.3 (−56.2, 15.0) | 0.153 | −7.0 (−39.4, 90.3) | 0.468 | −44.1 (−65.0, 2.3) | 0.378 | 0.180 | 0.468 | 0.036 |
| IL13 | 13.6 (−61.6, 81.3) | 0.542 | 32.6 (−35.9, 112.2) | 0.120 | −43.5 (−81.4, 34.0) | 0.144 | 0.316 | 0.427 | 0.035 |
| Colony Stimulating Factors | |||||||||
| IL5 | −17.2 (−53.3, 35.6) | 0.855 | 78.4 (−31.5, 160.7) | 0.027 | −25.0 (−53.6, 54.3) | 0.309 | 0.084 | 0.983 | 0.055 |
| IL7 | 56.2 (−7.0, 192.9) | 0.035 | −26.4 (−41.0, 12.7) | 0.156 | −2.9 (−35.9, 58.0) | 0.586 | 0.010 | 0.503 | 0.294 |
| GM-CSF | −35.1 (−57.7, −25.4) | 0.001 | 7.5 (−28.3, 42.7) | 0.490 | −37.8 (−60.1, 18.4) | 0.935 | 0.009 | 0.325 | 0.147 |
| Monocytes/µL on Blood Samples | ||
| Treatment | Baseline | 12 Months |
| TDF | 414 (0.02951) (n = 21) | 401 (0.02712) (n = 21) |
| TAF | 404 (0.02712) (n = 22) | 450 (0.02255) (n = 22) * |
| Triumeq | 378 (0.01604) (n = 39) | 403 (0.02104) (n = 39) |
| Neutrophils/µL on Blood Samples | ||
| Treatment | Baseline | 12 Months |
| TDF | 3205 (0.20620) (n = 21) | 3595 (0.31350) (n = 21) |
| TAF | 3223 (0.2136) (n = 22) | 3641 (0.3270) (n = 22) |
| Triumeq | 3495 (0.2538) (n = 39) | 3873 (0.2599) (n = 39) |
© 2020 by the authors. Licensee MDPI, Basel, Switzerland. This article is an open access article distributed under the terms and conditions of the Creative Commons Attribution (CC BY) license (http://creativecommons.org/licenses/by/4.0/).
Share and Cite
Conesa-Buendía, F.M.; Llamas-Granda, P.; Atencio, P.; Cabello, A.; Górgolas, M.; Largo, R.; Herrero-Beaumont, G.; Mediero, A. Adenosine Deaminase as a Biomarker of Tenofovir Mediated Inflammation in Naïve HIV Patients. Int. J. Mol. Sci. 2020, 21, 3590. https://doi.org/10.3390/ijms21103590
Conesa-Buendía FM, Llamas-Granda P, Atencio P, Cabello A, Górgolas M, Largo R, Herrero-Beaumont G, Mediero A. Adenosine Deaminase as a Biomarker of Tenofovir Mediated Inflammation in Naïve HIV Patients. International Journal of Molecular Sciences. 2020; 21(10):3590. https://doi.org/10.3390/ijms21103590
Chicago/Turabian StyleConesa-Buendía, Francisco Miguel, Patricia Llamas-Granda, Patricia Atencio, Alfonso Cabello, Miguel Górgolas, Raquel Largo, Gabriel Herrero-Beaumont, and Aránzazu Mediero. 2020. "Adenosine Deaminase as a Biomarker of Tenofovir Mediated Inflammation in Naïve HIV Patients" International Journal of Molecular Sciences 21, no. 10: 3590. https://doi.org/10.3390/ijms21103590
APA StyleConesa-Buendía, F. M., Llamas-Granda, P., Atencio, P., Cabello, A., Górgolas, M., Largo, R., Herrero-Beaumont, G., & Mediero, A. (2020). Adenosine Deaminase as a Biomarker of Tenofovir Mediated Inflammation in Naïve HIV Patients. International Journal of Molecular Sciences, 21(10), 3590. https://doi.org/10.3390/ijms21103590