MiR-519d-3p in Trophoblastic Cells: Effects, Targets and Transfer to Allogeneic Immune Cells via Extracellular Vesicles

 , , , and
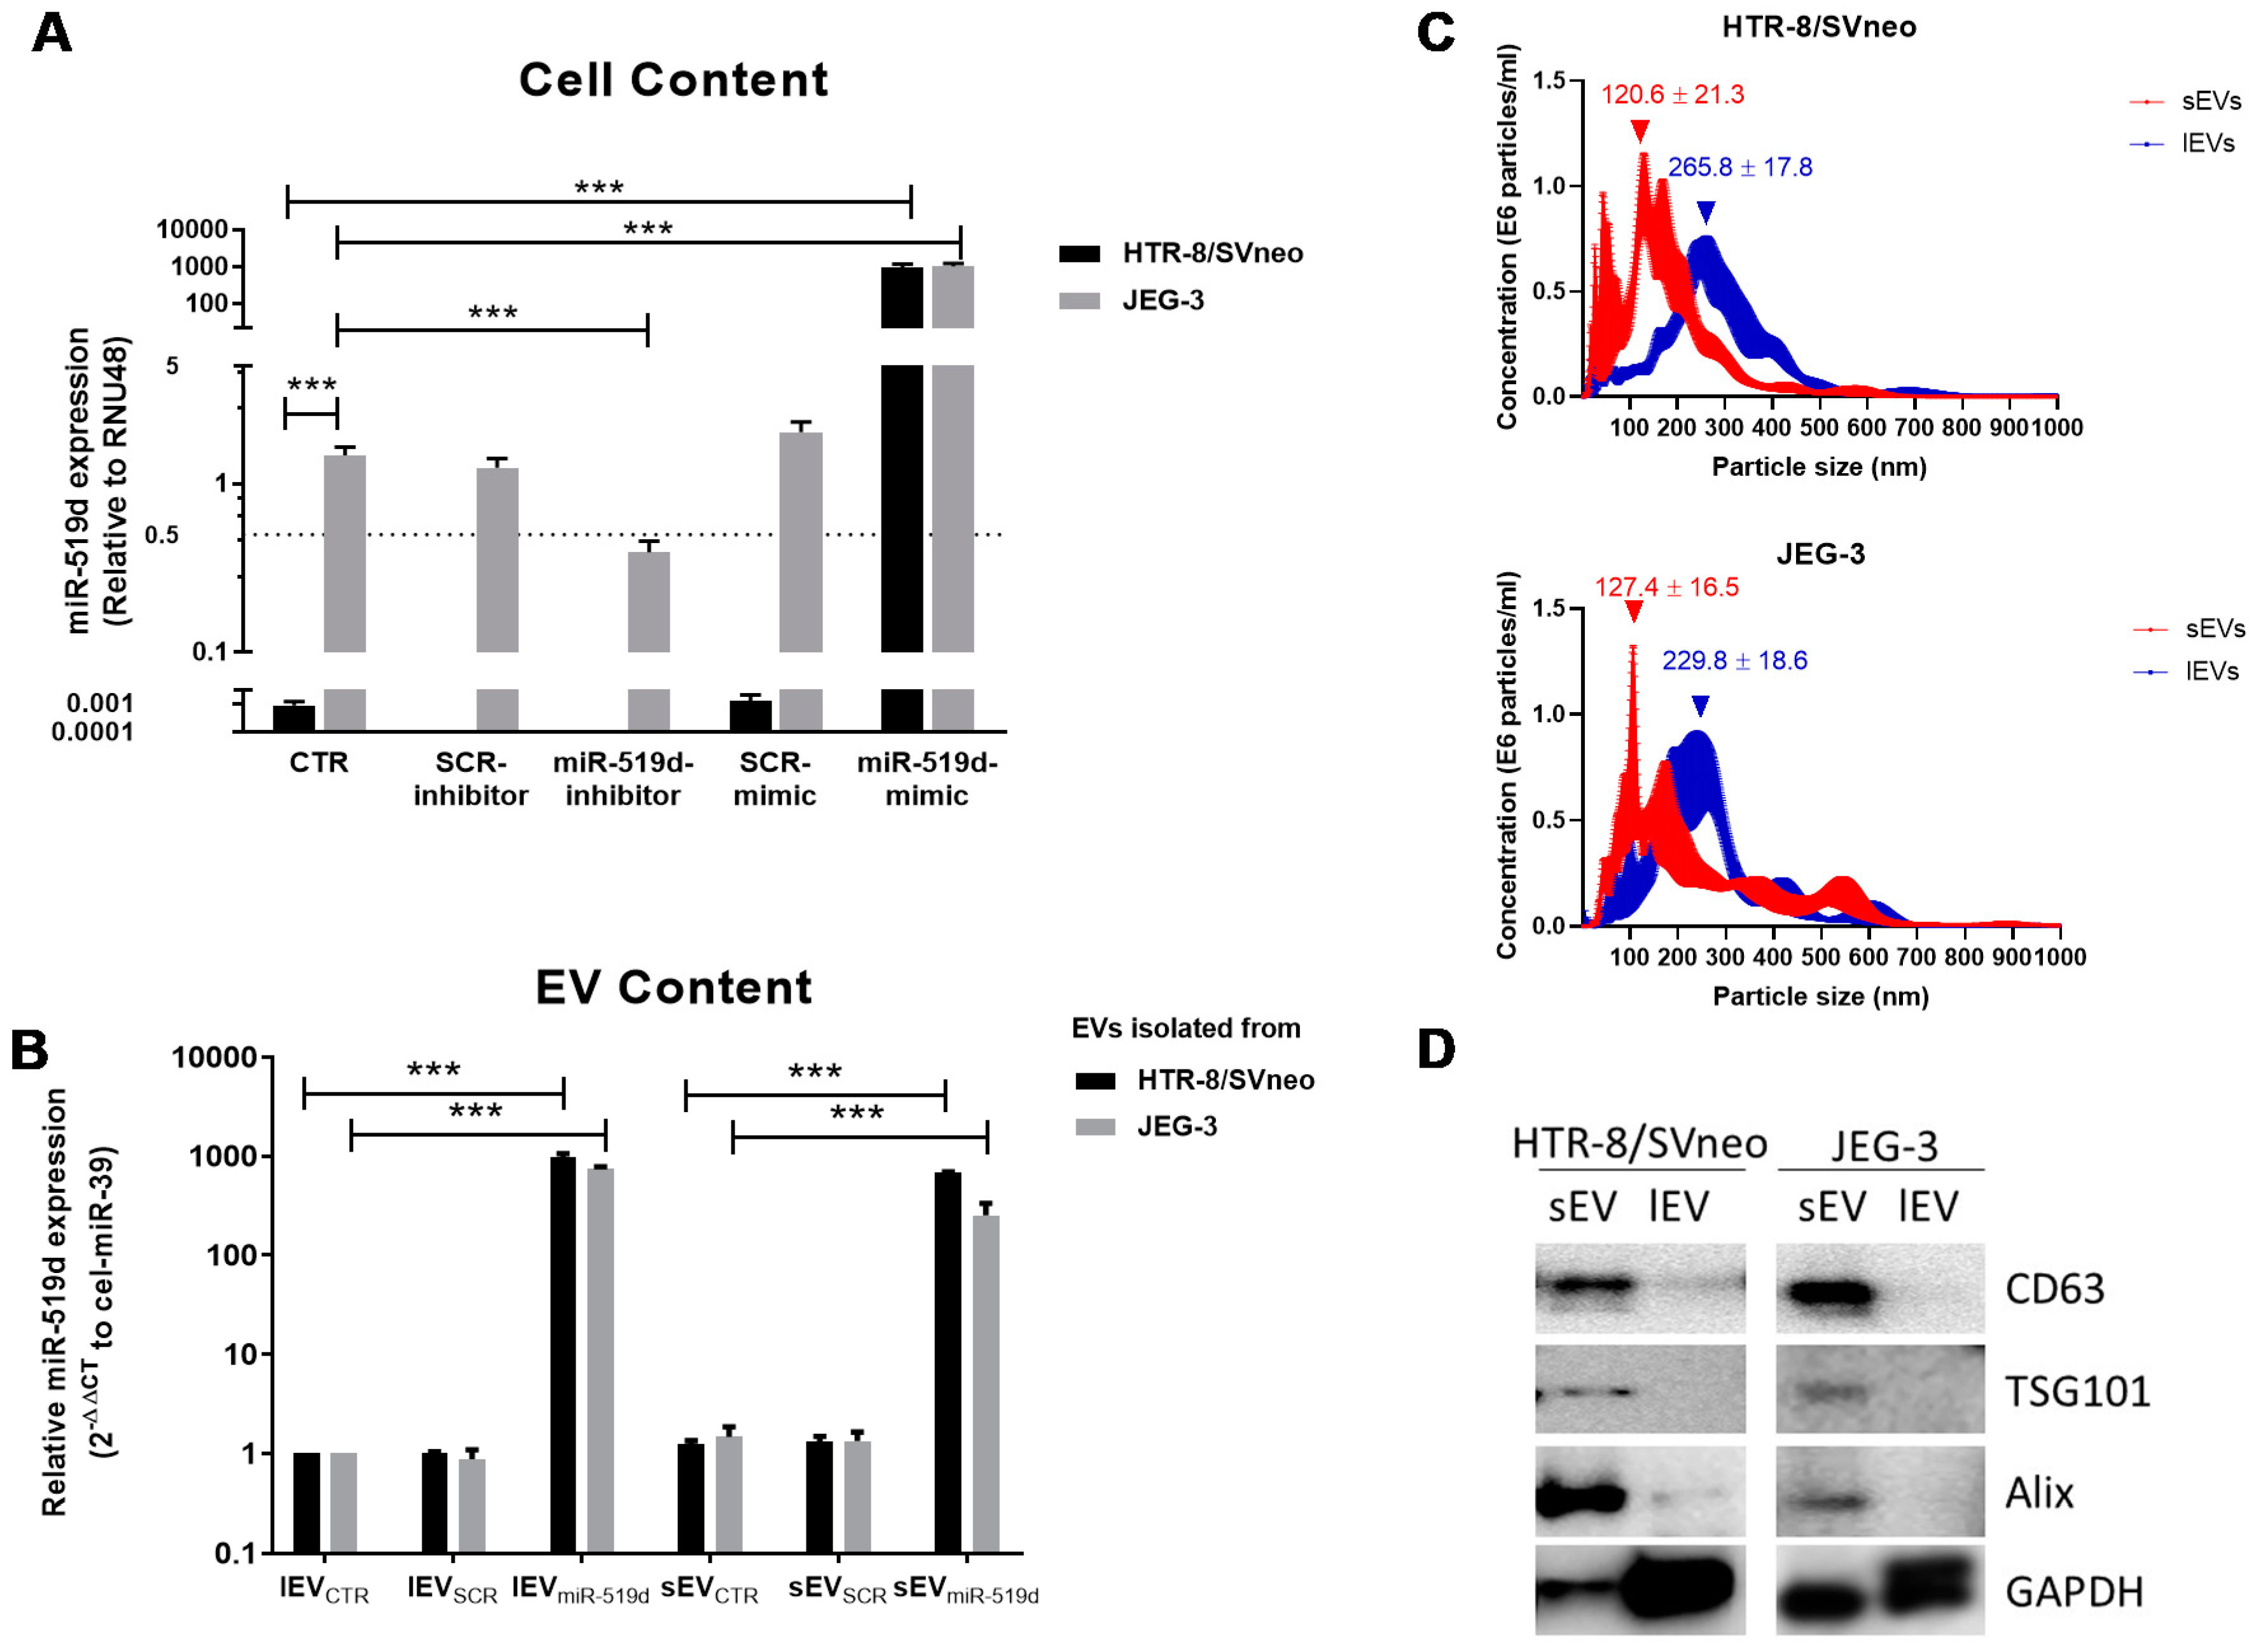
Abstract
1. Introduction
2. Results
2.1. Expression of miR-519d-3p in Trophoblastic Cell Lines and Their Secreted EVs
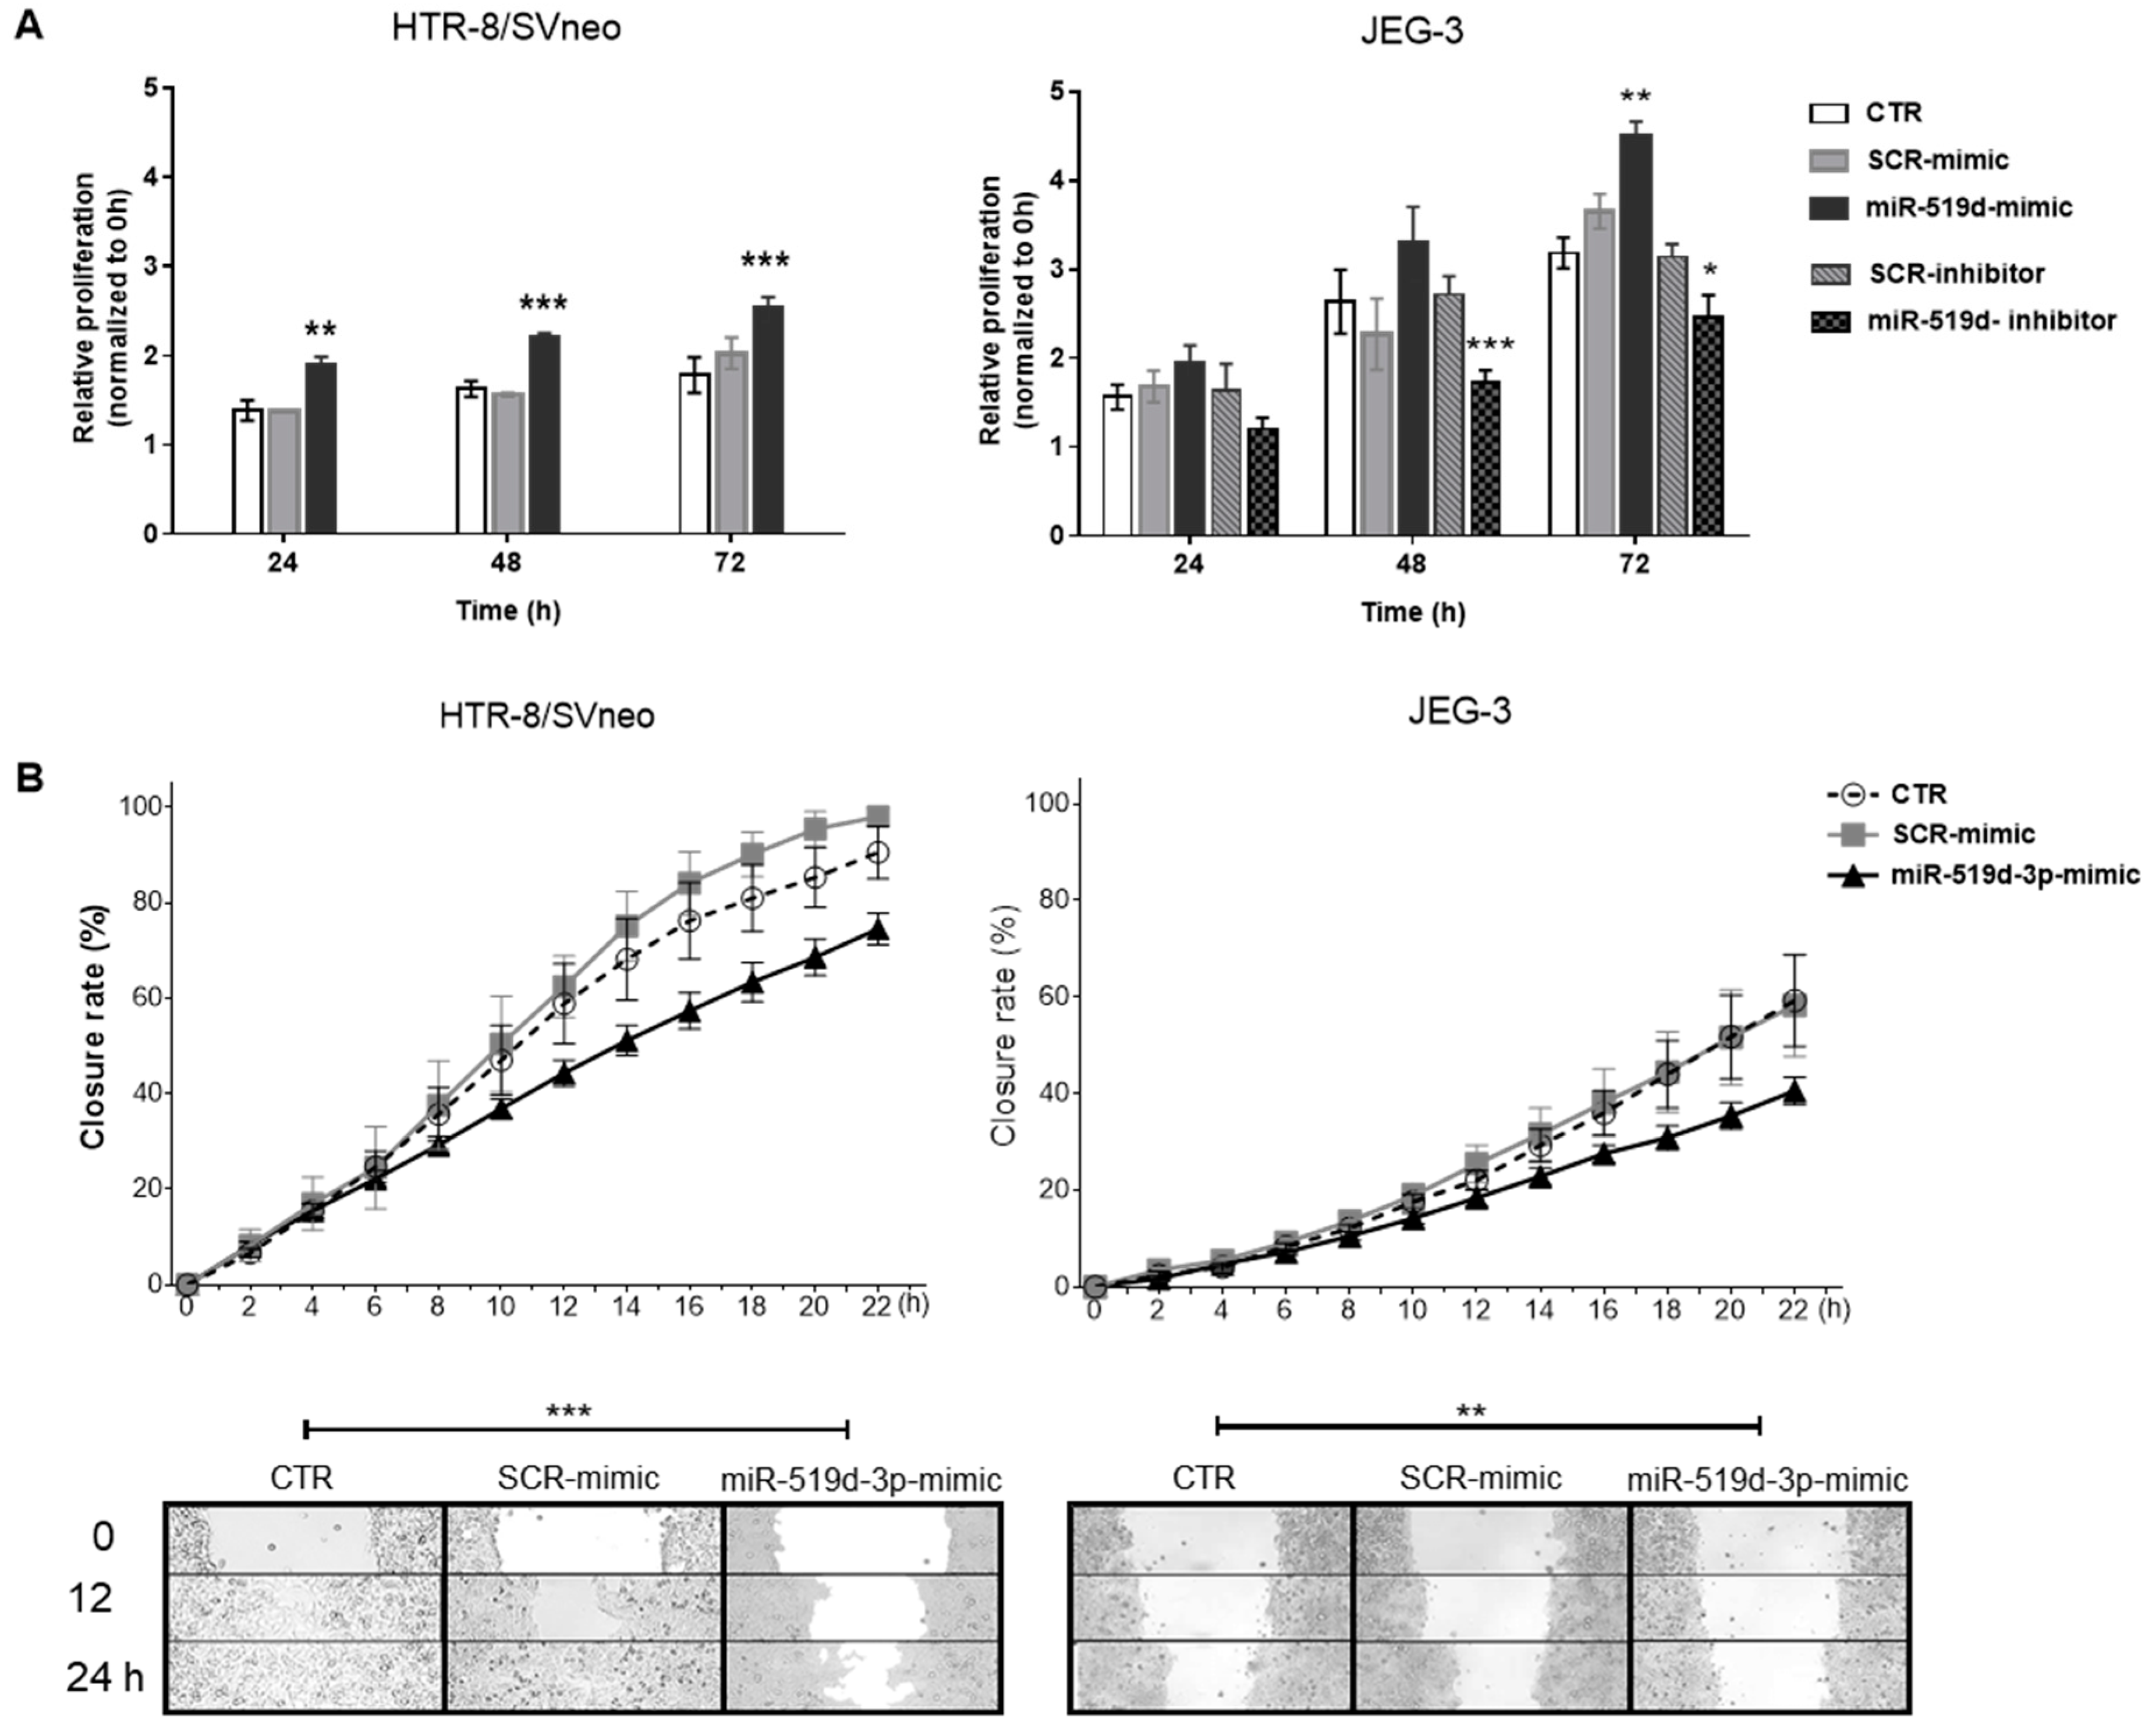
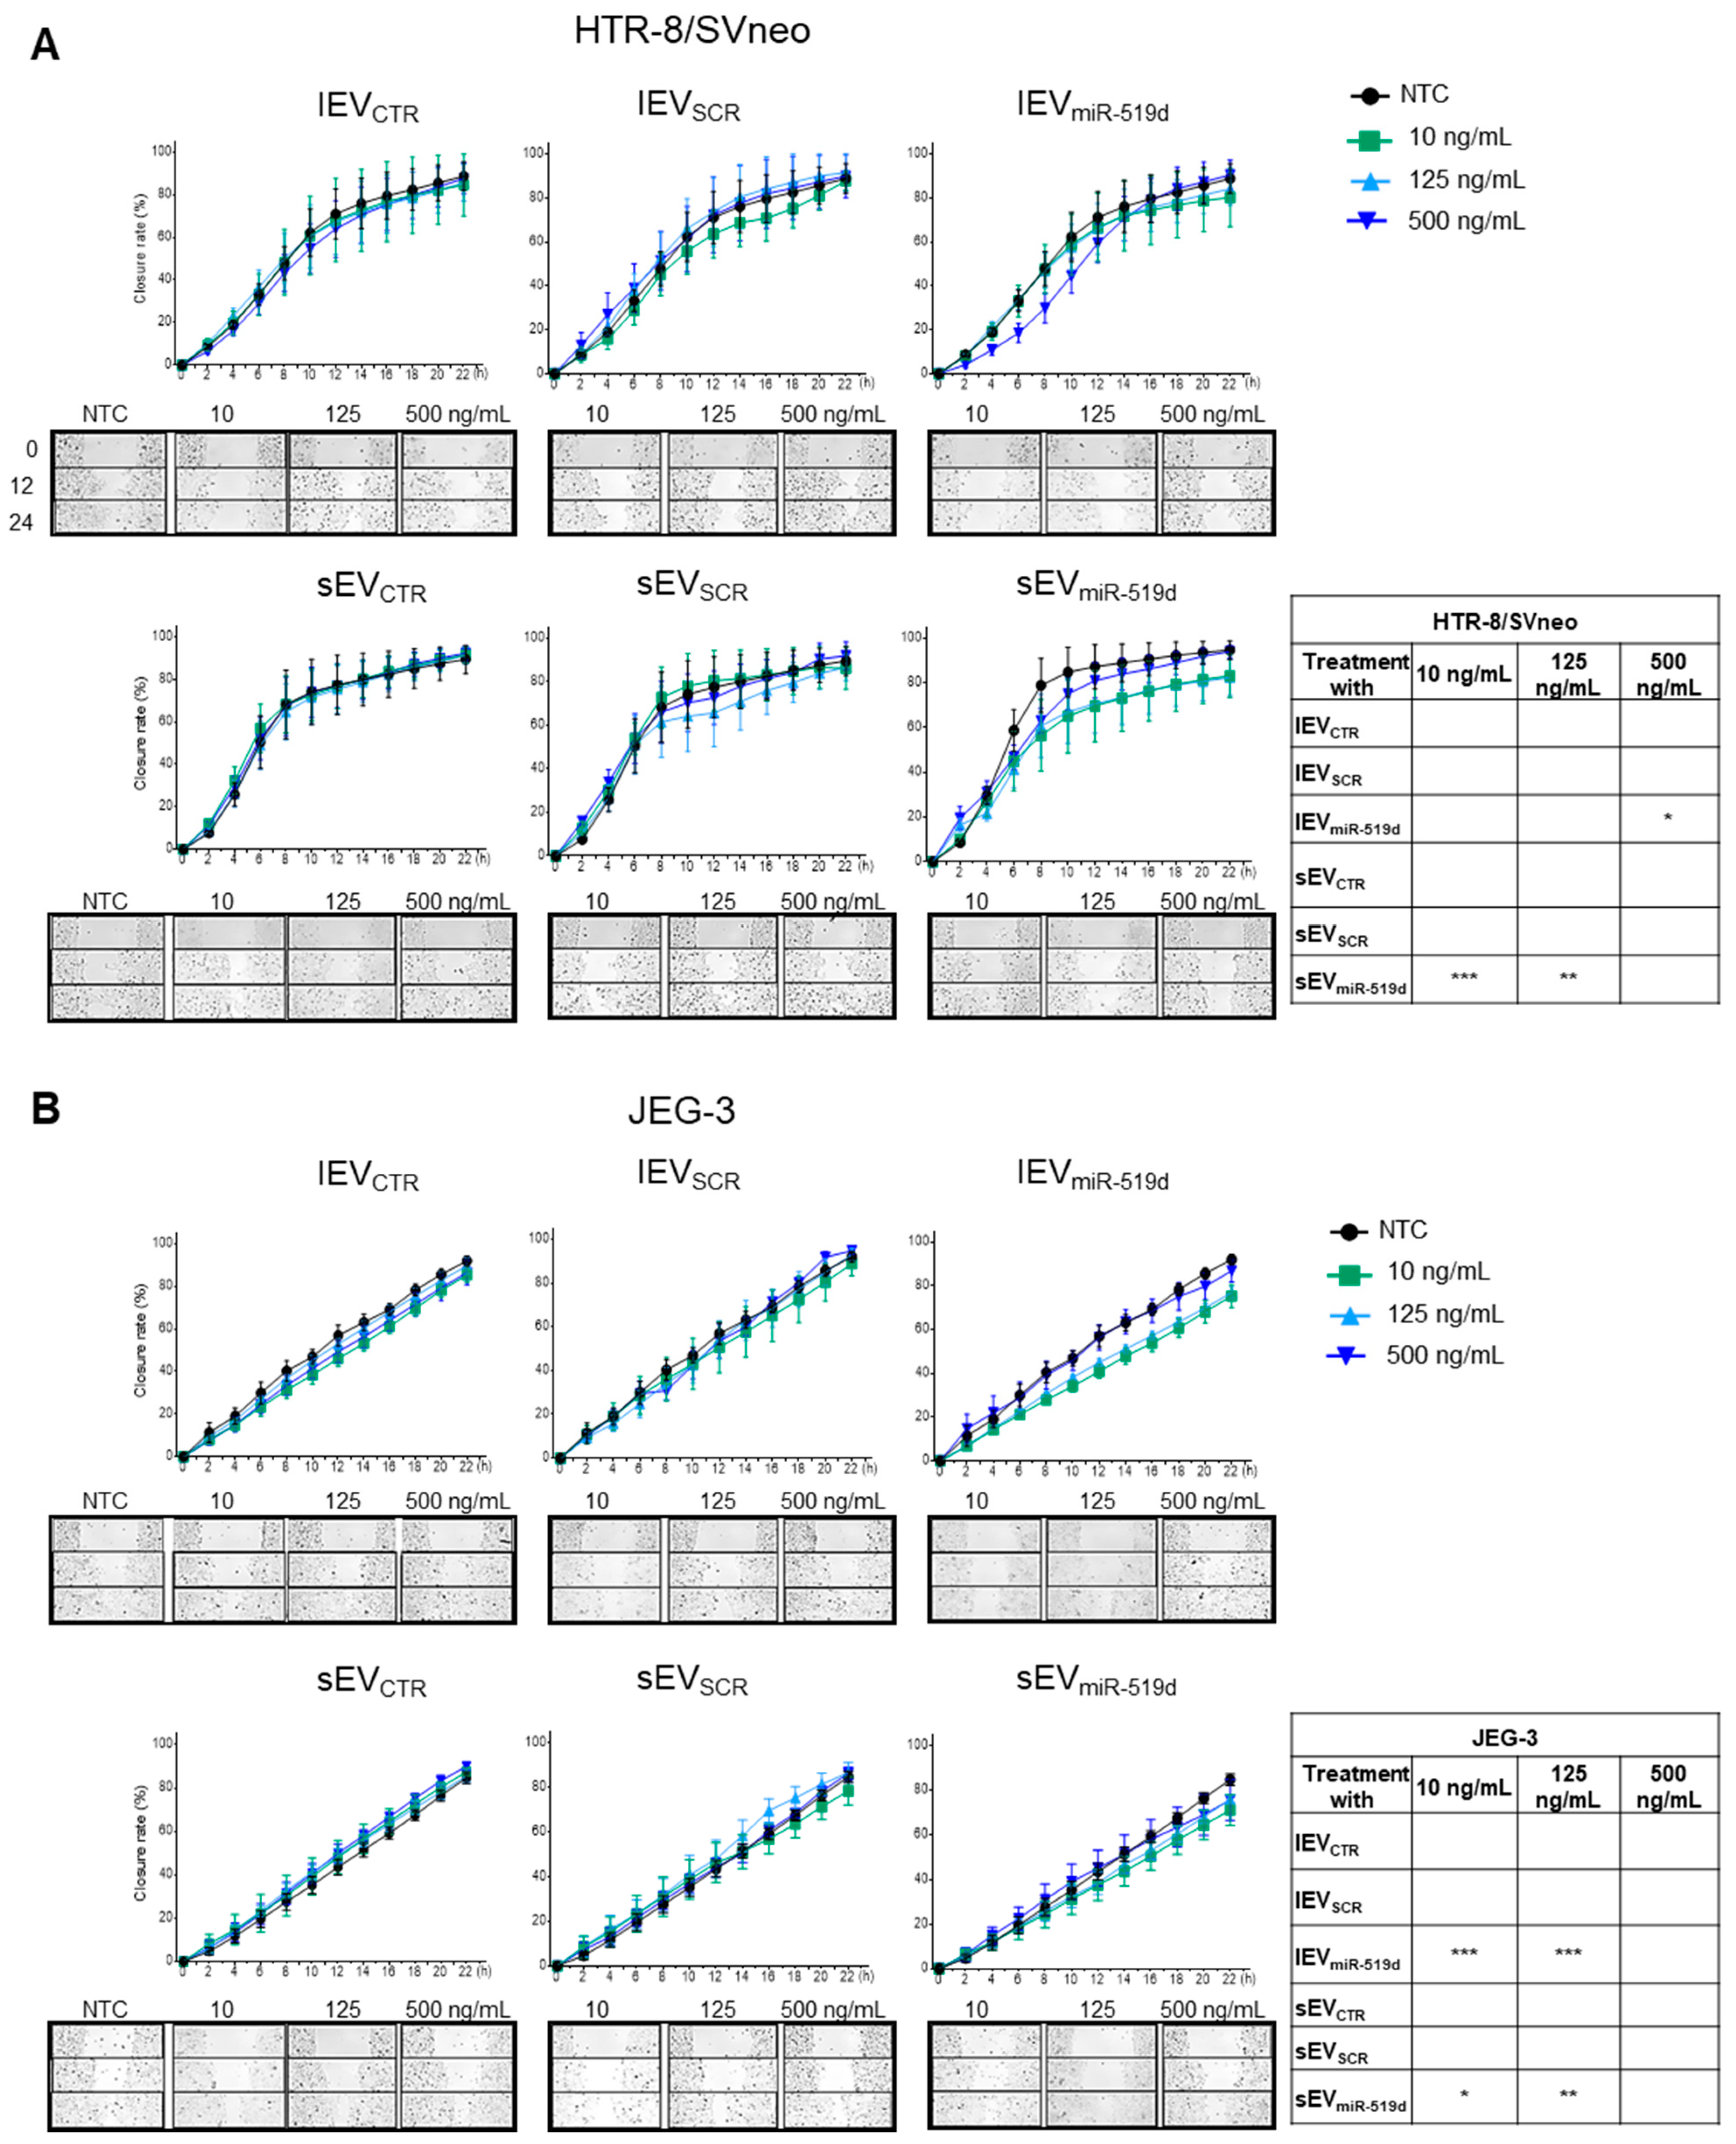
2.2. The Effects of miR-519d-3p on Trophoblast Cell Proliferation and Migration
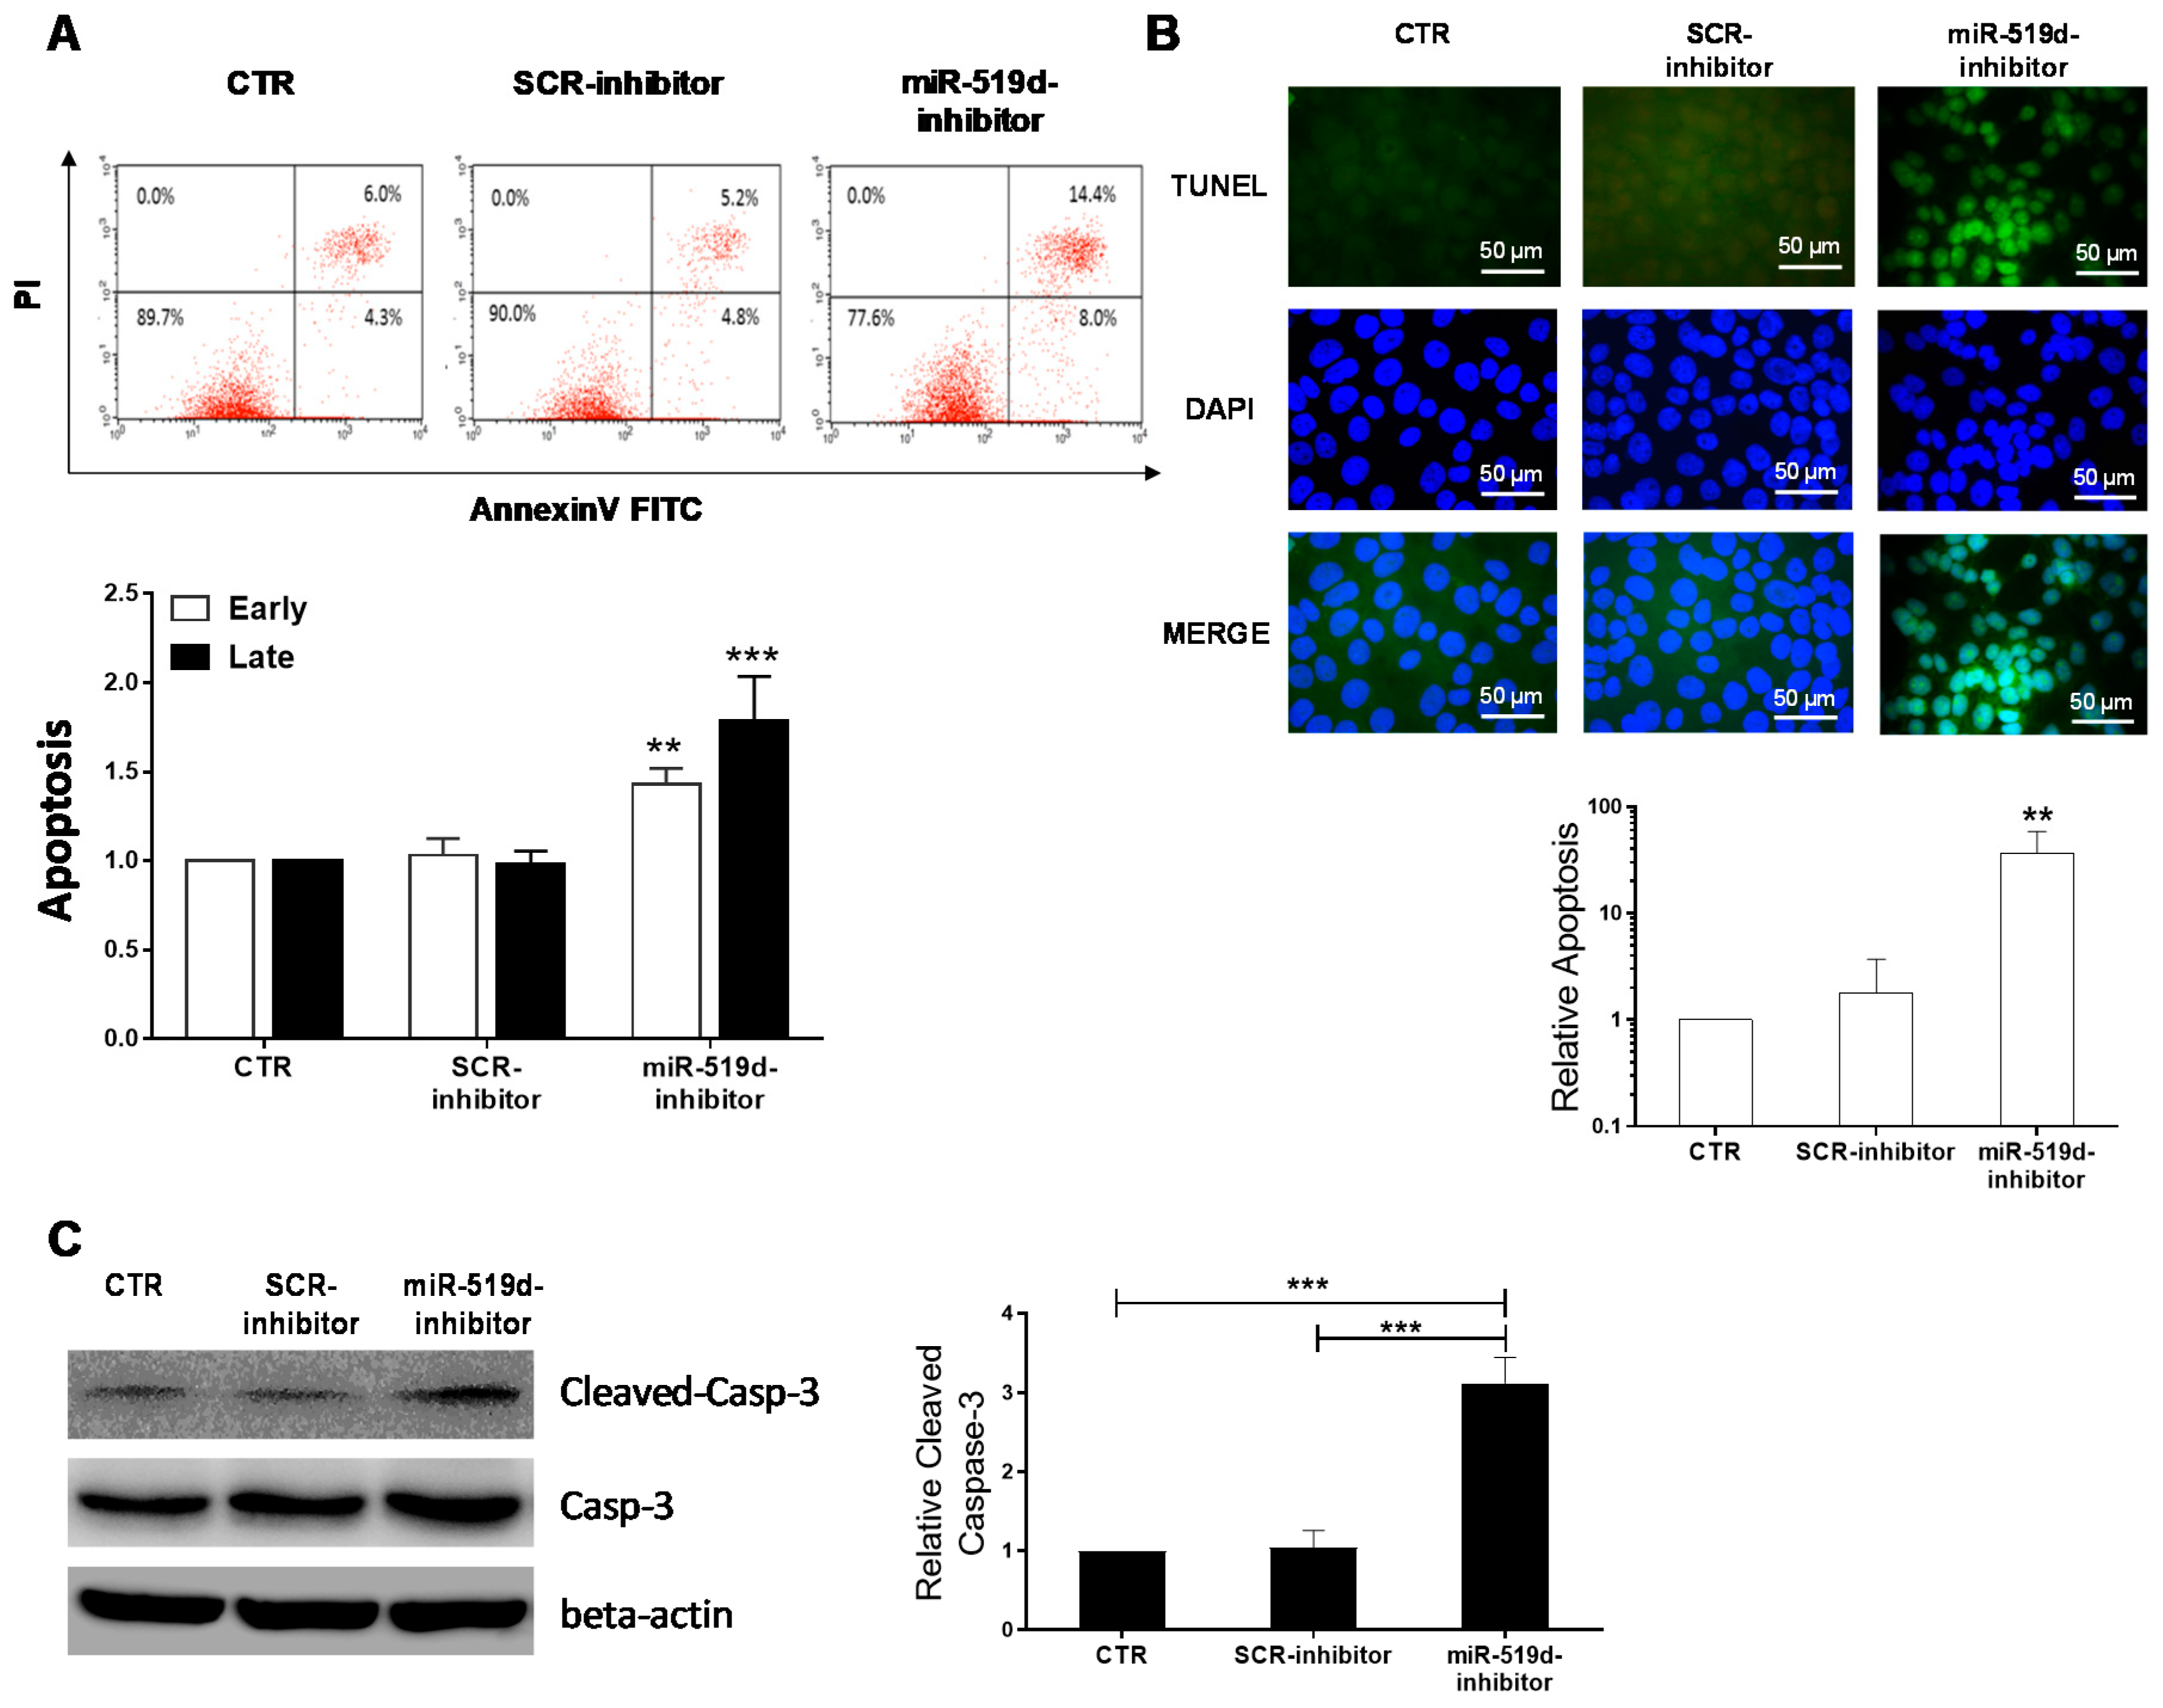
2.3. The Effect of miR-519d-3p Inhibition on the Apoptosis of Trophoblastic Cells
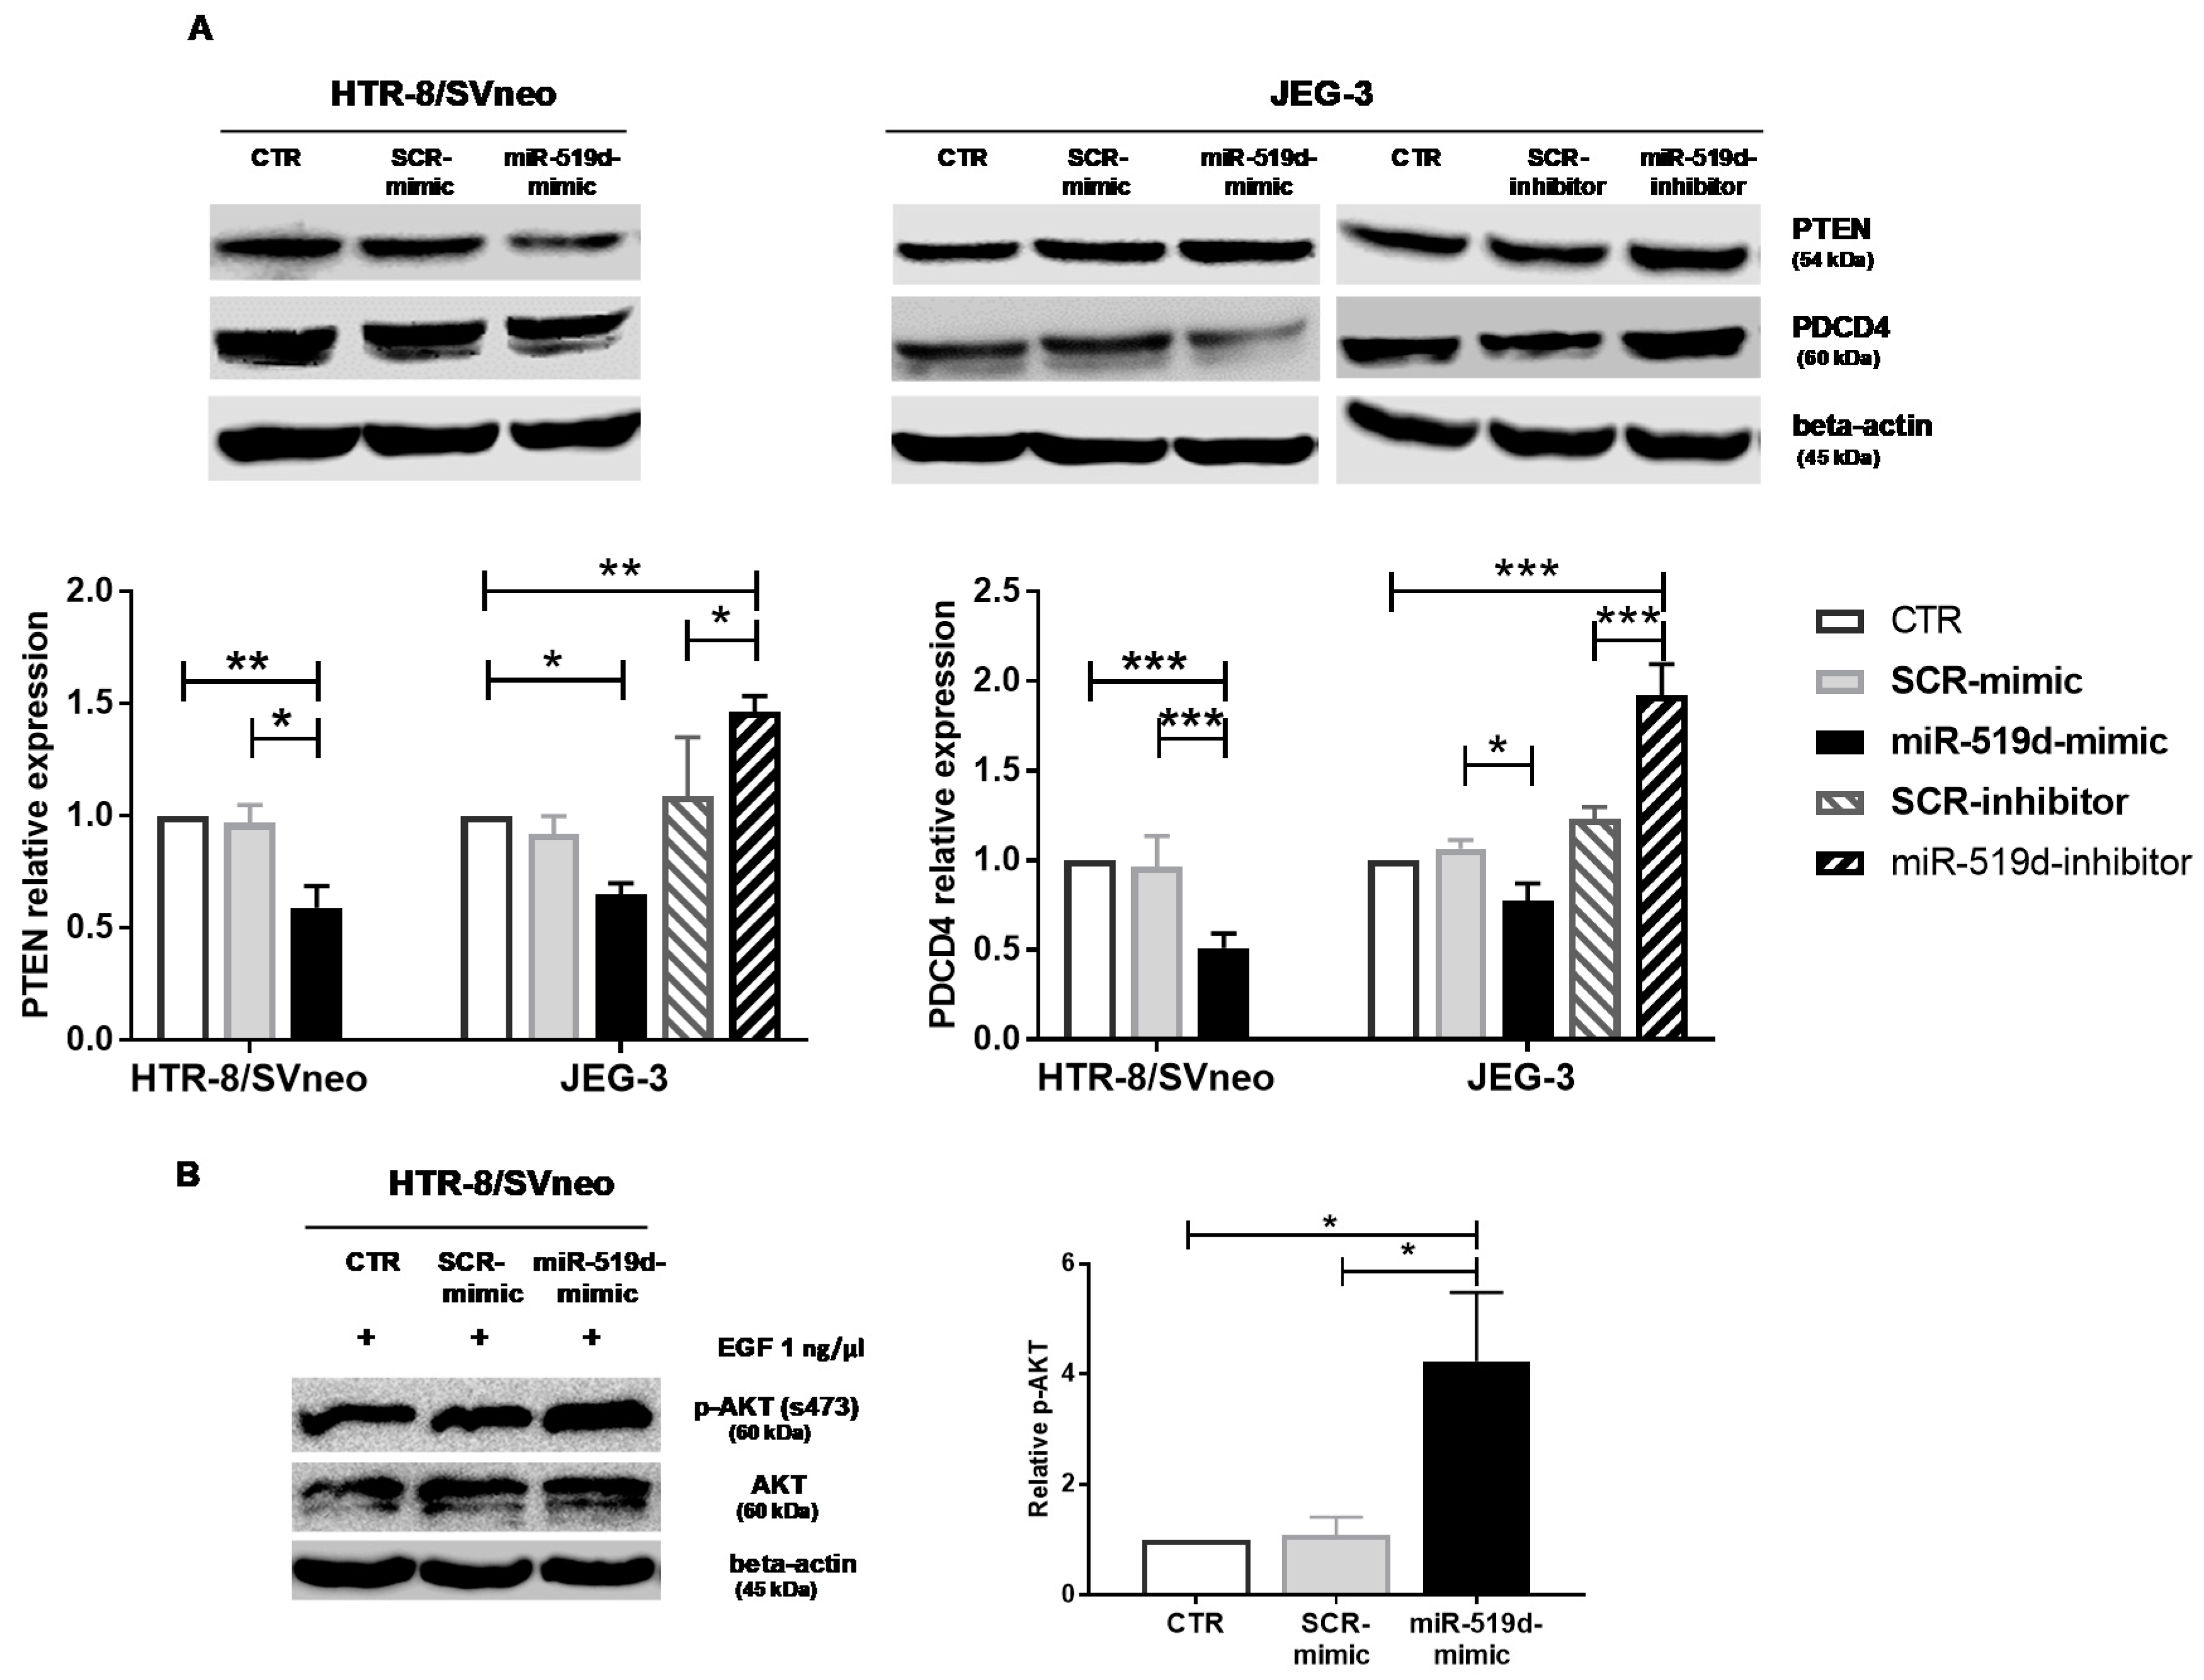
2.4. Targets of miR-519d-3p in Trophoblastic Cell Lines
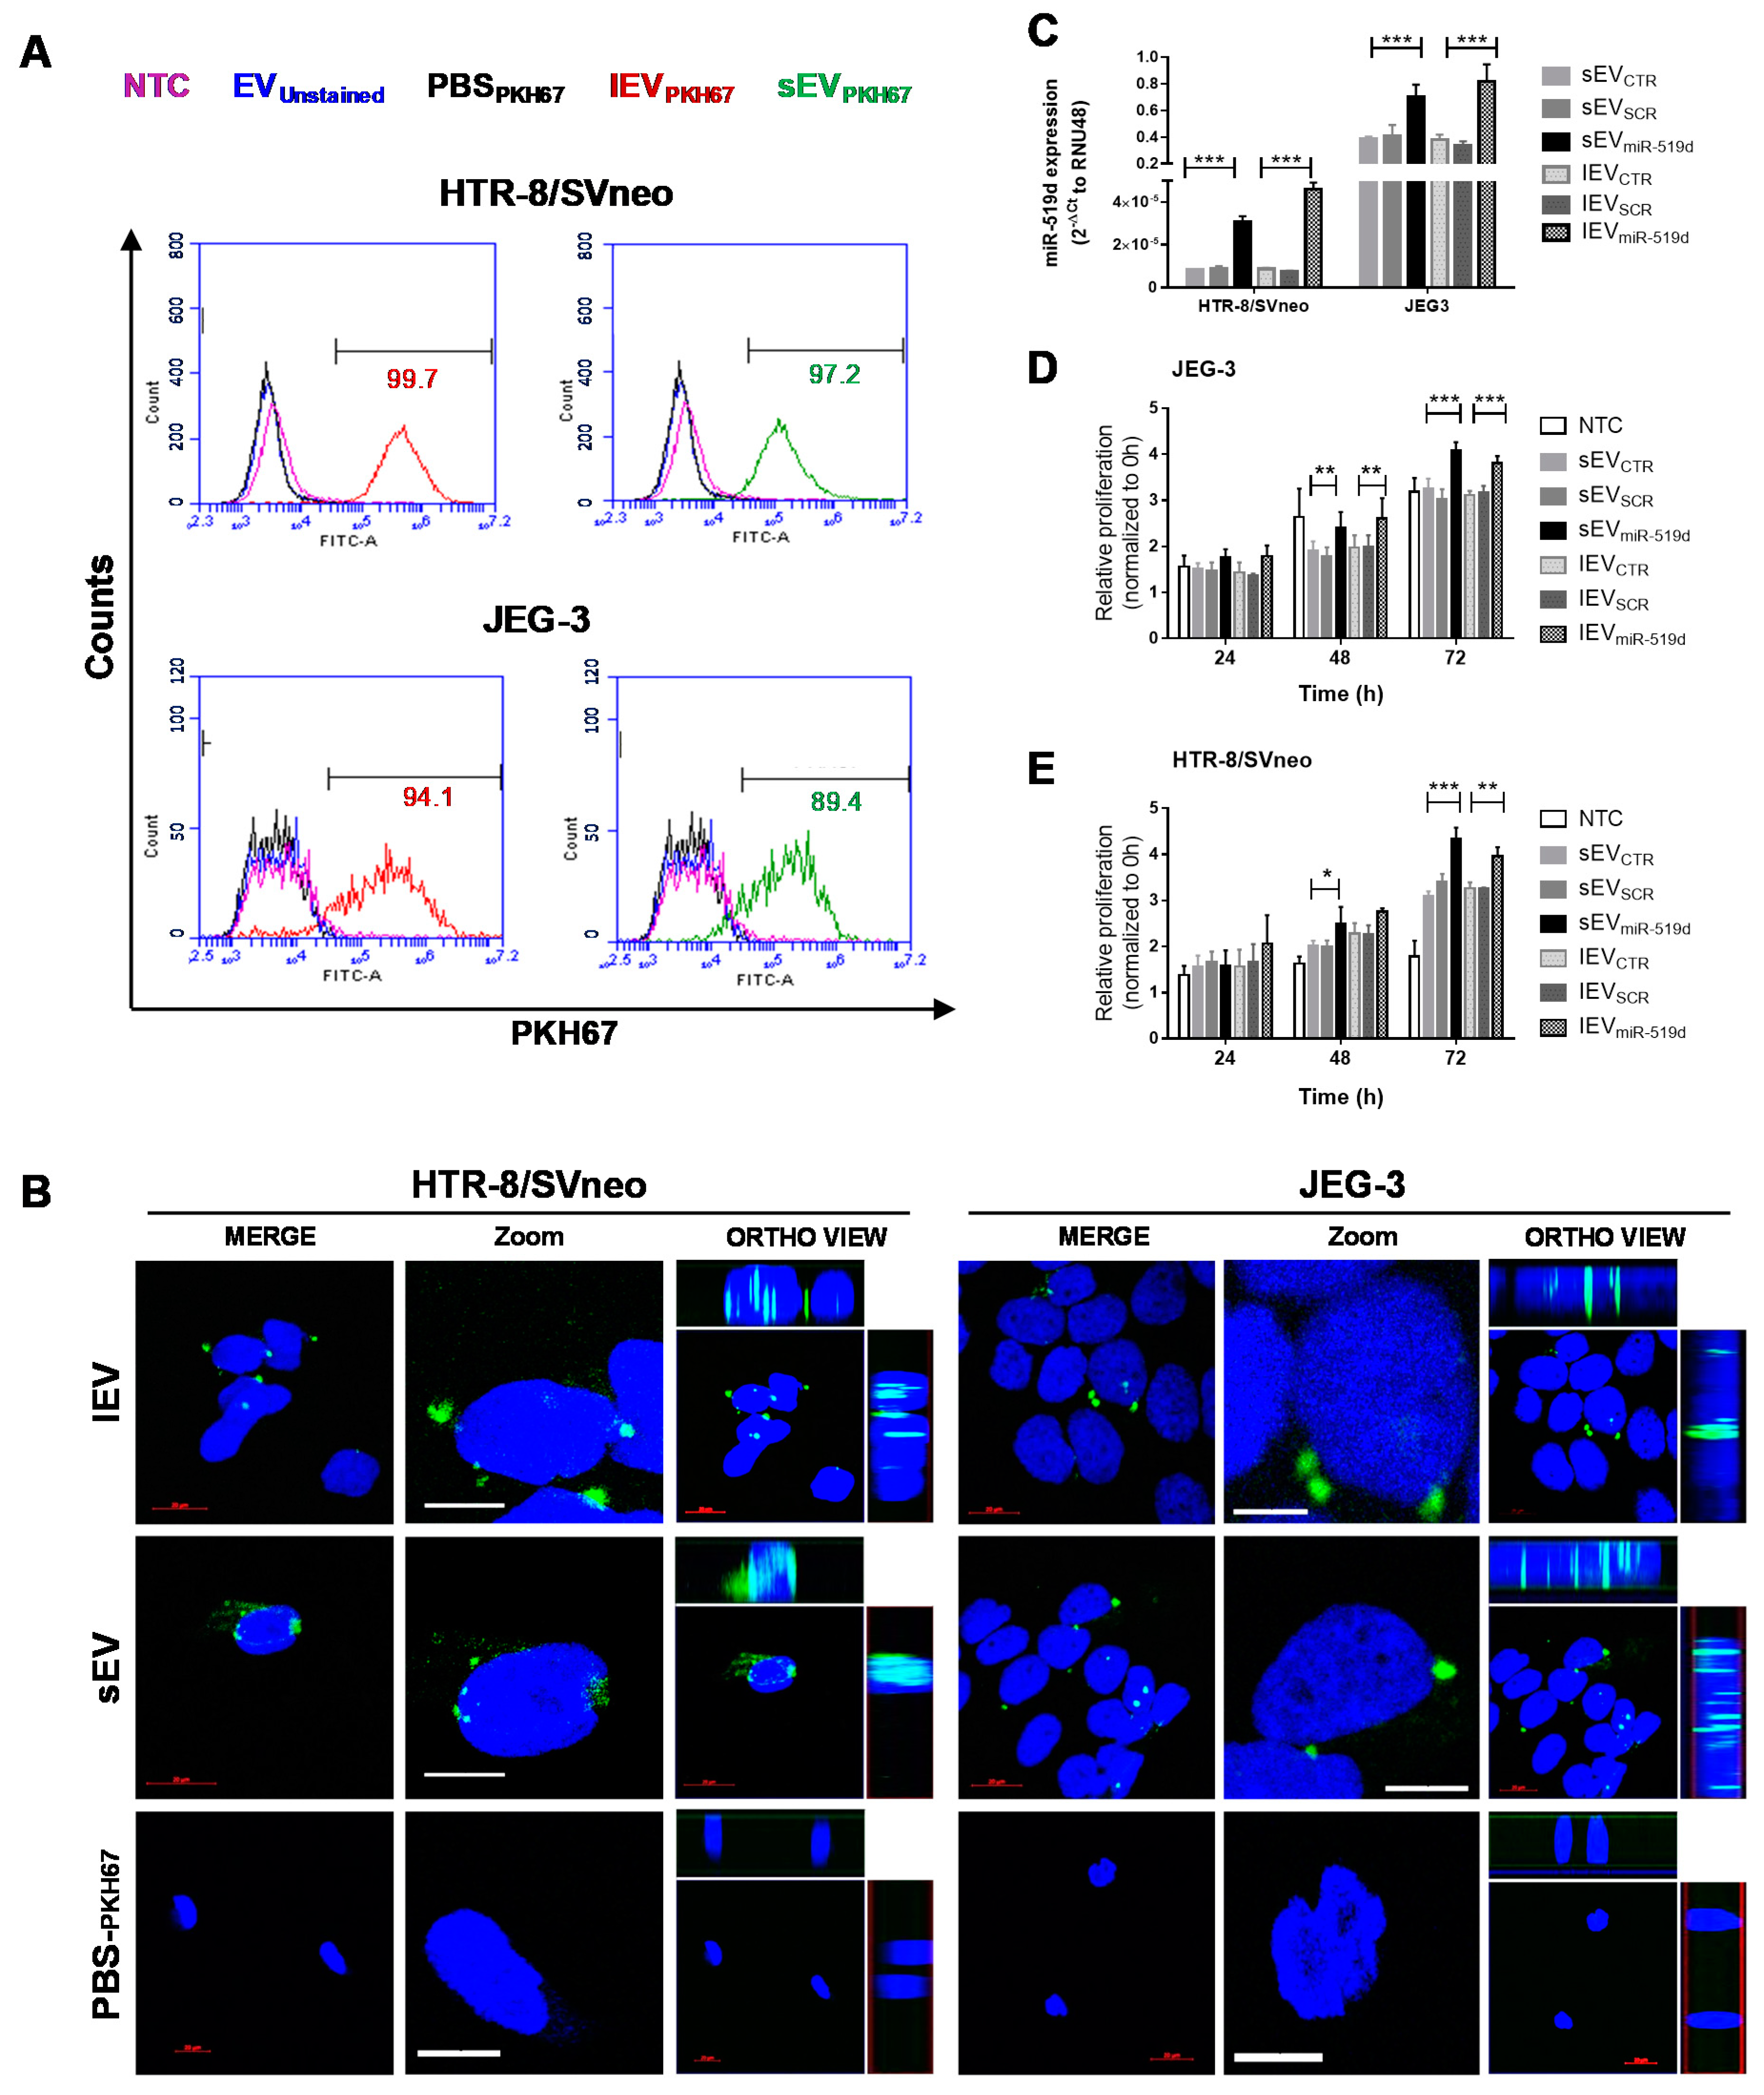
2.5. Uptake of EVs by Autologous Trophoblast Cells
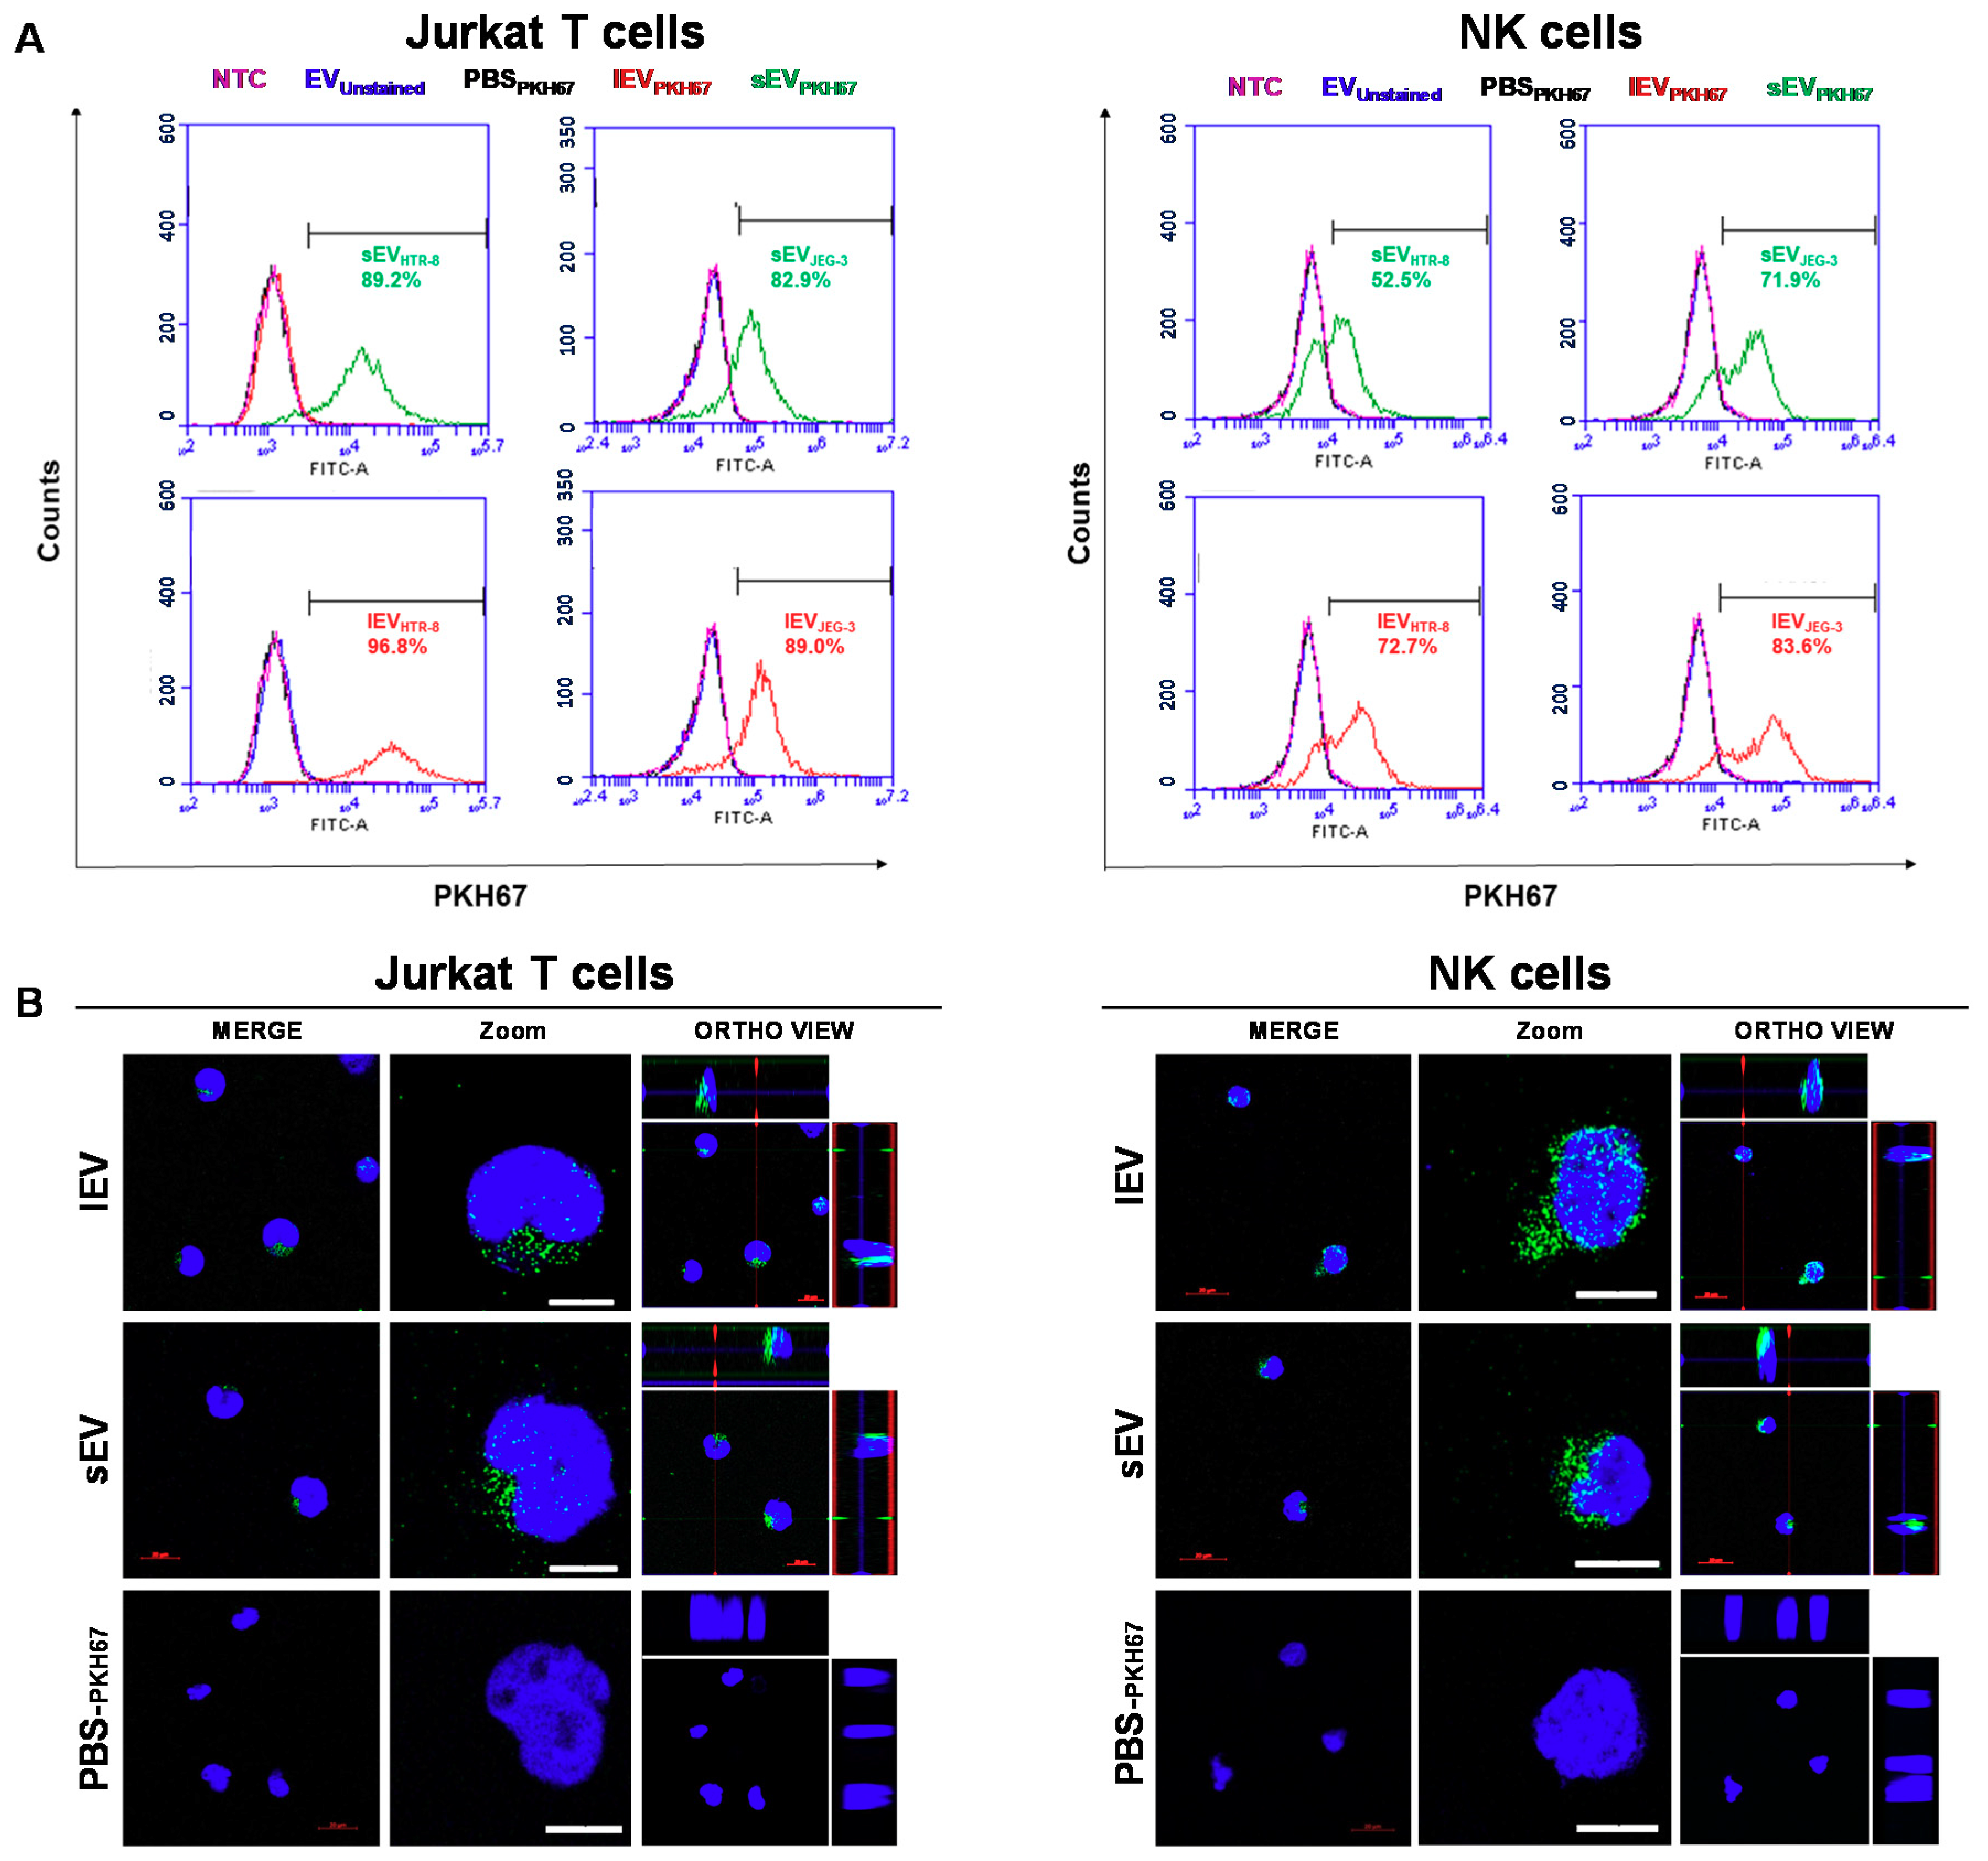
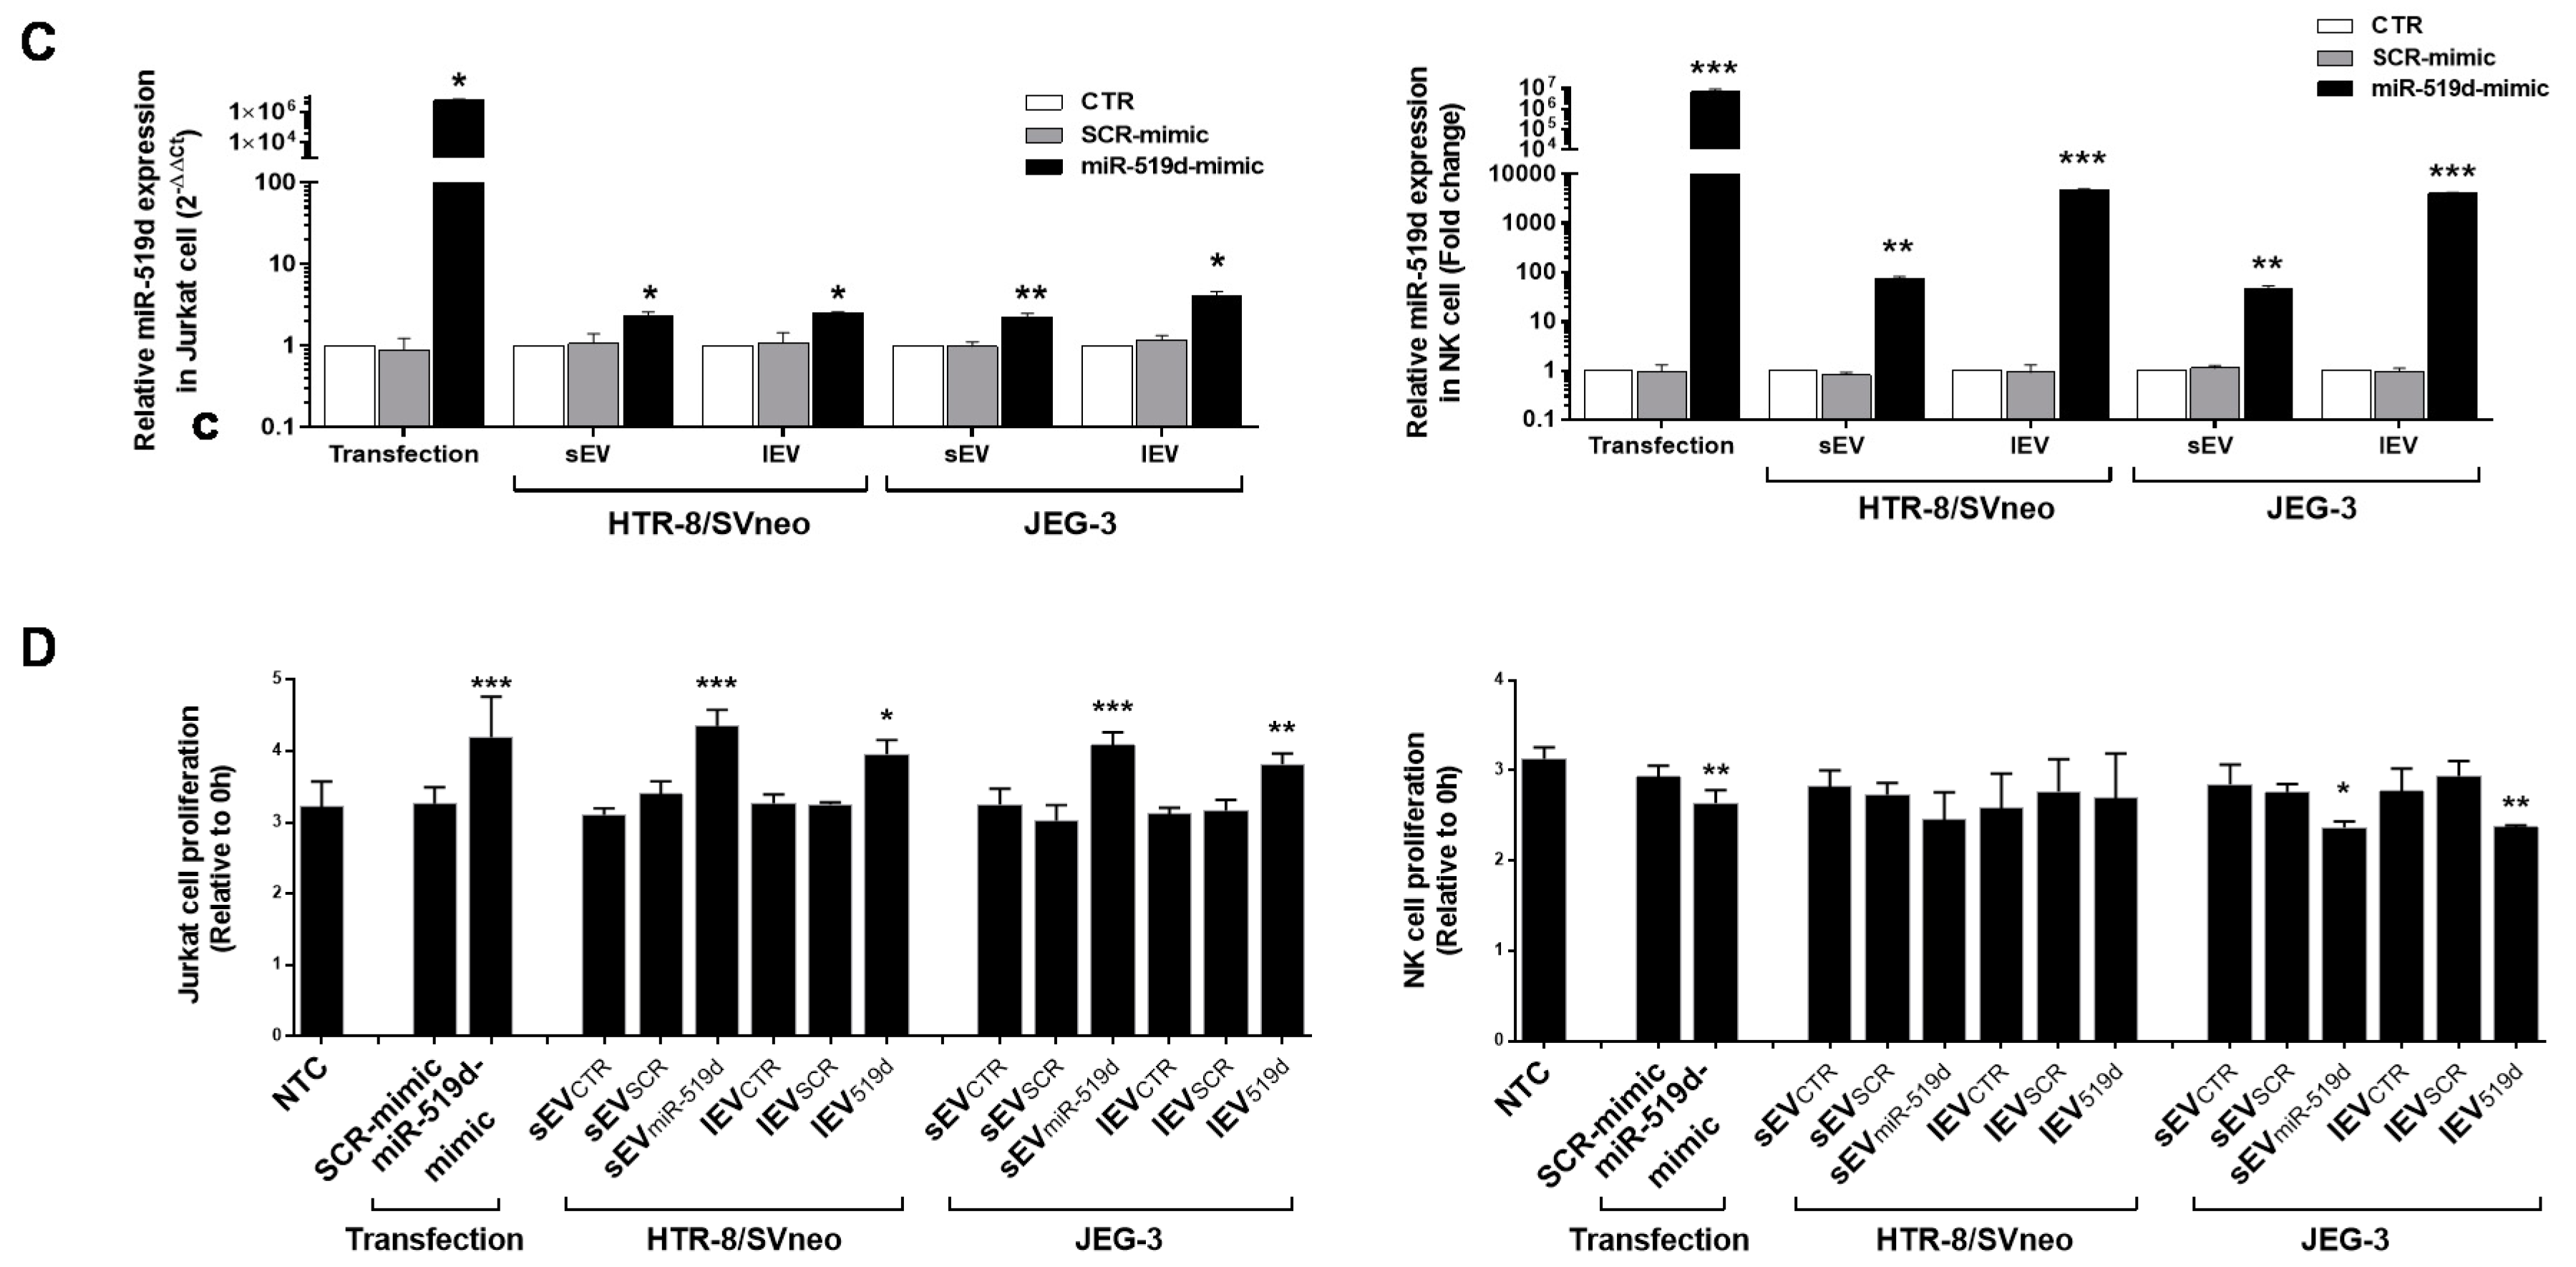
2.6. The Uptake by Heterologous Immune Cells of EVs, and Their Effects
3. Discussion
4. Materials and Methods
4.1. Cell Lines and Cell Culture
4.2. Transfection with miR-519d Mimic and miR-519d Inhibitor
4.3. Enrichment of sEV or lEV Populations from Cell Line Supernatants and Protein Quantification
4.4. Nanoparticle Tracking Analysis (NTA)
4.5. Quantification of miR-519d-3p by qPCR
4.6. Proliferation Assay
4.7. Wound Healing Migration Assay
4.8. Apoptosis Assays
4.9. Western Blot Analysis
4.10. AKT Activation in HTR-8/SVneo Cells
4.11. Cellular Uptake of Tophoblast-Derived EVs
4.12. Bioinformatic Prediction of miR-519d-3p Target Genes
4.13. Statistical Analysis
Supplementary Materials
Author Contributions
Funding
Acknowledgments
Conflicts of Interest
Abbreviations
| ED-FBS | exosome depleted fetal bovine serum |
| EVs | extracellular vesicles |
| NTC | non-treated cells |
| sEV | small EV |
| lEV | large EV |
| sEVmiR-519d | sEV derived from miR-519d mimic transfected cells |
| sEVSCR | sEV derived from non-genomic SCR mimic transfected cells |
| sEVCTR | sEV derived from non-transfected cells |
| lEVmiR-519d | lEV derived from miR-519d mimic transfected cells |
| lEVSCR | lEV derived from non-genomic SCR mimic transfected cells |
| lEVCTR | lEV derived from non-transfected cells |
| sEVPKH67 | sEV stained with PKH67 |
| lEVPKH67 | lEV stained with PKH67 |
| PBSPKH67 | pellet of PBS stained with PKH67 following the same protocol as for EVPKH67 |
References
- Anin, S.A.; Vince, G.; Quenby, S. Trophoblast invasion. Hum. Fertil. 2004, 7, 169–174. [Google Scholar] [CrossRef] [PubMed]
- Knofler, M.; Pollheimer, J. IFPA Award in Placentology lecture: Molecular regulation of human trophoblast invasion. Placenta 2012, 33, S55–S62. [Google Scholar] [CrossRef] [PubMed]
- Helige, C.; Ahammer, H.; Moser, G.; Hammer, A.; Dohr, G.; Huppertz, B.; Sedlmayr, P. Distribution of decidual natural killer cells and macrophages in the neighbourhood of the trophoblast invasion front: A quantitative evaluation. Hum. Reprod. 2014, 29, 8–17. [Google Scholar] [CrossRef] [PubMed]
- Liu, S.; Diao, L.; Huang, C.; Li, Y.; Zeng, Y.; Kwak-Kim, J.Y.H. The role of decidual immune cells on human pregnancy. J. Reprod. Immunol. 2017, 124, 44–53. [Google Scholar] [CrossRef]
- Lash, G.E.; Ernerudh, J. Decidual cytokines and pregnancy complications: Focus on spontaneous miscarriage. J. Reprod. Immunol. 2015, 108, 83–89. [Google Scholar] [CrossRef]
- Bidarimath, M.; Khalaj, K.; Wessels, J.M.; Tayade, C. MicroRNAs, immune cells and pregnancy. Cell. Mol. Immunol. 2014, 11, 538–547. [Google Scholar] [CrossRef]
- Robertson, S.A.; Zhang, B.; Chan, H.; Sharkey, D.J.; Barry, S.C.; Fullston, T.; Schjenken, J.E. MicroRNA regulation of immune events at conception. Mol. Reprod. Dev. 2017, 84, 914–925. [Google Scholar] [CrossRef]
- Morales Prieto, D.M.; Markert, U.R. MicroRNAs in pregnancy. J. Reprod. Immunol. 2011, 88, 106–111. [Google Scholar] [CrossRef]
- Chaiwangyen, W.; Ospina-Prieto, S.; Photini, S.M.; Schleussner, E.; Markert, U.R.; Morales-Prieto, D.M. Dissimilar microRNA-21 functions and targets in trophoblastic cell lines of different origin. Int. J. Biochem. Cell Biol. 2015, 68, 187–196. [Google Scholar] [CrossRef]
- Morales-Prieto, D.M.; Ospina-Prieto, S.; Schmidt, A.; Chaiwangyen, W.; Markert, U.R. Elsevier Trophoblast Research Award Lecture: Origin, evolution and future of placenta miRNAs. Placenta 2014, 35, S39–S45. [Google Scholar] [CrossRef]
- Slezak-Prochazka, I.; Durmus, S.; Kroesen, B.J.; van den Berg, A. MicroRNAs, macrocontrol: Regulation of miRNA processing. RNA 2010, 16, 1087–1095. [Google Scholar] [CrossRef] [PubMed]
- Bartel, D.P. MicroRNAs: Genomics, biogenesis, mechanism, and function. Cell 2004, 116, 281–297. [Google Scholar] [CrossRef]
- Morales-Prieto, D.M.; Ospina-Prieto, S.; Chaiwangyen, W.; Schoenleben, M.; Markert, U.R. Pregnancy-associated miRNA-clusters. J. Reprod. Immunol. 2013, 97, 51–61. [Google Scholar] [CrossRef] [PubMed]
- Morales-Prieto, D.M.; Chaiwangyen, W.; Ospina-Prieto, S.; Schneider, U.; Herrmann, J.; Gruhn, B.; Markert, U.R. MicroRNA expression profiles of trophoblastic cells. Placenta 2012, 33, 725–734. [Google Scholar] [CrossRef]
- Higashijima, A.; Miura, K.; Mishima, H.; Kinoshita, A.; Jo, O.; Abe, S.; Hasegawa, Y.; Miura, S.; Yamasaki, K.; Yoshida, A.; et al. Characterization of placenta-specific microRNAs in fetal growth restriction pregnancy. Prenat. Diagn. 2013, 33, 214–222. [Google Scholar] [CrossRef]
- Gilad, S.; Meiri, E.; Yogev, Y.; Benjamin, S.; Lebanony, D.; Yerushalmi, N.; Benjamin, H.; Kushnir, M.; Cholakh, H.; Melamed, N.; et al. Serum microRNAs are promising novel biomarkers. PLoS ONE 2008, 3, e3148. [Google Scholar] [CrossRef]
- Xie, L.; Sadovsky, Y. The function of miR-519d in cell migration, invasion, and proliferation suggests a role in early placentation. Placenta 2016, 48, 34–37. [Google Scholar] [CrossRef]
- Donker, R.B.; Mouillet, J.F.; Chu, T.; Hubel, C.A.; Stolz, D.B.; Morelli, A.E.; Sadovsky, Y. The expression profile of C19MC microRNAs in primary human trophoblast cells and exosomes. Mol. Hum. Reprod. 2012, 18, 417–424. [Google Scholar] [CrossRef]
- Ospina-Prieto, S.; Chaiwangyen, W.; Herrmann, J.; Groten, T.; Schleussner, E.; Markert, U.R.; Morales-Prieto, D.M. MicroRNA-141 is upregulated in preeclamptic placentae and regulates trophoblast invasion and intercellular communication. Transl. Res. 2016, 172, 61–72. [Google Scholar] [CrossRef]
- Gaus, G.; Funayama, H.; Huppertz, B.; Kaufmann, P.; Frank, H.G. Parent cells for trophoblast hybridization I: Isolation of extravillous trophoblast cells from human term chorion laeve. Placenta 1997, 18 (Suppl. 2), 181–190. [Google Scholar] [CrossRef]
- Graham, C.H.; Hawley, T.S.; Hawley, R.G.; MacDougall, J.R.; Kerbel, R.S.; Khoo, N.; Lala, P.K. Establishment and characterization of first trimester human trophoblast cells with extended lifespan. Exp. Cell Res. 1993, 206, 204–211. [Google Scholar] [CrossRef] [PubMed]
- Bilban, M.; Tauber, S.; Haslinger, P.; Pollheimer, J.; Saleh, L.; Pehamberger, H.; Wagner, O.; Knofler, M. Trophoblast invasion: Assessment of cellular models using gene expression signatures. Placenta 2010, 31, 989–996. [Google Scholar] [CrossRef] [PubMed]
- Novakovic, B.; Gordon, L.; Wong, N.C.; Moffett, A.; Manuelpillai, U.; Craig, J.M.; Sharkey, A.; Saffery, R. Wide-ranging DNA methylation differences of primary trophoblast cell populations and derived cell lines: Implications and opportunities for understanding trophoblast function. Mol. Hum. Reprod. 2011, 17, 344–353. [Google Scholar] [CrossRef] [PubMed]
- Théry, C.; Witwer, K.W.; Aikawa, E.; Alcaraz, M.J.; Anderson, J.D.; Andriantsitohaina, R.; Antoniou, A.; Arab, T.; Archer, F.; Atkin-Smith, G.K.; et al. Minimal information for studies of extracellular vesicles 2018 (MISEV2018): A position statement of the International Society for Extracellular Vesicles and update of the MISEV2014 guidelines. J. Extracell. Vesicles 2018, 7, 1535750. [Google Scholar] [CrossRef]
- Nguyen, P.N.; Huang, C.J.; Sugii, S.; Cheong, S.K.; Choo, K.B. Selective activation of miRNAs of the primate-specific chromosome 19 miRNA cluster (C19MC) in cancer and stem cells and possible contribution to regulation of apoptosis. J. Biomed. Sci. 2017, 24, 20. [Google Scholar] [CrossRef]
- Liang, Y.; Ridzon, D.; Wong, L.; Chen, C. Characterization of microRNA expression profiles in normal human tissues. BMC Genom. 2007, 8, 166. [Google Scholar] [CrossRef]
- Fu, G.; Brkic, J.; Hayder, H.; Peng, C. MicroRNAs in Human Placental Development and Pregnancy Complications. Int. J. Mol. Sci. 2013, 14, 5519–5544. [Google Scholar] [CrossRef]
- Xie, L.; Mouillet, J.F.; Chu, T.; Parks, W.T.; Sadovsky, E.; Knofler, M.; Sadovsky, Y. C19MC microRNAs regulate the migration of human trophoblasts. Endocrinology 2014, 155, 4975–4985. [Google Scholar] [CrossRef]
- Kim, K.M.; Abdelmohsen, K.; Mustapic, M.; Kapogiannis, D.; Gorospe, M. RNA in extracellular vesicles. Wiley Interdiscip. Rev. RNA 2017, 8, e1413. [Google Scholar] [CrossRef]
- Gyorgy, B.; Hung, M.E.; Breakefield, X.O.; Leonard, J.N. Therapeutic applications of extracellular vesicles: Clinical promise and open questions. Annu. Rev. Pharmacol. Toxicol. 2015, 55, 439–464. [Google Scholar] [CrossRef]
- Corcoran, C.; Friel, A.M.; Duffy, M.J.; Crown, J.; O’Driscoll, L. Intracellular and extracellular microRNAs in breast cancer. Clin. Chem. 2011, 57, 18–32. [Google Scholar] [CrossRef] [PubMed]
- Fornari, F.; Milazzo, M.; Chieco, P.; Negrini, M.; Marasco, E.; Capranico, G.; Mantovani, V.; Marinello, J.; Sabbioni, S.; Callegari, E.; et al. In hepatocellular carcinoma miR-519d is up-regulated by p53 and DNA hypomethylation and targets CDKN1A/p21, PTEN, AKT3 and TIMP2. J. Pathol. 2012, 227, 275–285. [Google Scholar] [CrossRef] [PubMed]
- Zhao, Z.; Zhao, Q.; Warrick, J.; Lockwood, C.M.; Woodworth, A.; Moley, K.H.; Gronowski, A.M. Circulating microRNA miR-323-3p as a biomarker of ectopic pregnancy. Clin. Chem. 2012, 58, 896–905. [Google Scholar] [CrossRef] [PubMed]
- Hromadnikova, I.; Kotlabova, K.; Ondrackova, M.; Pirkova, P.; Kestlerova, A.; Novotna, V.; Hympanova, L.; Krofta, L. Expression Profile of C19MC microRNAs in Placental Tissue in Pregnancy-Related Complications. DNA Cell Biol. 2015, 34, 437–457. [Google Scholar] [CrossRef] [PubMed]
- Ding, J.; Huang, F.; Wu, G.; Han, T.; Xu, F.; Weng, D.; Wu, C.; Zhang, X.; Yao, Y.; Zhu, X. MiR-519d-3p suppresses invasion and migration of trophoblast cells via targeting MMP-2. PLoS ONE 2015, 10, e0120321. [Google Scholar] [CrossRef] [PubMed]
- Zhou, J.Y.; Zheng, S.R.; Liu, J.; Shi, R.; Yu, H.L.; Wei, M. MiR-519d facilitates the progression and metastasis of cervical cancer through direct targeting Smad7. Cancer Cell Int. 2016, 16, 21. [Google Scholar] [CrossRef] [PubMed]
- Pang, Y.; Mao, H.; Shen, L.; Zhao, Z.; Liu, R.; Liu, P. MiR-519d represses ovarian cancer cell proliferation and enhances cisplatin-mediated cytotoxicity in vitro by targeting XIAP. Onco Targets Ther. 2014, 7, 587–597. [Google Scholar] [CrossRef][Green Version]
- Morales-Prieto, D.M.; Barth, E.; Murrieta-Coxca, J.M.; Favaro, R.R.; Gutiérrez-Samudio, R.N.; Chaiwangyen, W.; Ospina-Prieto, S.; Gruhn, B.; Schleußner, E.; Marz, M.; et al. Identification of miRNAs and associated pathways regulated by Leukemia Inhibitory Factor in trophoblastic cell lines. Placenta 2019, 88, 20–27. [Google Scholar] [CrossRef]
- van der Pol, E.; Coumans, F.A.; Grootemaat, A.E.; Gardiner, C.; Sargent, I.L.; Harrison, P.; Sturk, A.; van Leeuwen, T.G.; Nieuwland, R. Particle size distribution of exosomes and microvesicles determined by transmission electron microscopy, flow cytometry, nanoparticle tracking analysis, and resistive pulse sensing. J. Thromb. Haemost. 2014, 12, 1182–1192. [Google Scholar] [CrossRef]
- van Niel, G.; Charrin, S.; Simoes, S.; Romao, M.; Rochin, L.; Saftig, P.; Marks, M.S.; Rubinstein, E.; Raposo, G. The tetraspanin CD63 regulates ESCRT-independent and -dependent endosomal sorting during melanogenesis. Dev. Cell 2011, 21, 708–721. [Google Scholar] [CrossRef]
- Raiborg, C.; Stenmark, H. The ESCRT machinery in endosomal sorting of ubiquitylated membrane proteins. Nature 2009, 458, 445–452. [Google Scholar] [CrossRef] [PubMed]
- Ouyang, Y.; Bayer, A.; Chu, T.; Tyurin, V.A.; Kagan, V.E.; Morelli, A.E.; Coyne, C.B.; Sadovsky, Y. Isolation of human trophoblastic extracellular vesicles and characterization of their cargo and antiviral activity. Placenta 2016, 47, 86–95. [Google Scholar] [CrossRef] [PubMed]
- PrabhuDas, M.; Bonney, E.; Caron, K.; Dey, S.; Erlebacher, A.; Fazleabas, A.; Fisher, S.; Golos, T.; Matzuk, M.; McCune, J.M.; et al. Immune mechanisms at the maternal-fetal interface: Perspectives and challenges. Nat. Immunol. 2015, 16, 328–334. [Google Scholar] [CrossRef] [PubMed]
- Warning, J.C.; McCracken, S.A.; Morris, J.M. A balancing act: Mechanisms by which the fetus avoids rejection by the maternal immune system. Reproduction 2011, 141, 715–724. [Google Scholar] [CrossRef] [PubMed]
- Park, S.Y.; Yun, S.; Ryu, B.J.; Han, A.R.; Lee, S.K. Trophoblasts regulate natural killer cells via control of interleukin-15 receptor signaling. Am. J. Reprod. Immunol. 2017, 78, e12628. [Google Scholar] [CrossRef]
- Tao, Y.; Li, Y.H.; Piao, H.L.; Zhou, W.J.; Zhang, D.; Fu, Q.; Wang, S.C.; Li, D.J.; Du, M.R. CD56(bright)CD25+ NK cells are preferentially recruited to the maternal/fetal interface in early human pregnancy. Cell. Mol. Immunol. 2015, 12, 77–86. [Google Scholar] [CrossRef][Green Version]
- Rajagopalan, S. HLA-G-mediated NK cell senescence promotes vascular remodeling: Implications for reproduction. Cell. Mol. Immunol. 2014, 11, 460–466. [Google Scholar] [CrossRef]
- Tannetta, D.; Dragovic, R.; Alyahyaei, Z.; Southcombe, J. Extracellular vesicles and reproduction-promotion of successful pregnancy. Cell. Mol. Immunol. 2014, 11, 548–563. [Google Scholar] [CrossRef]
- Mulcahy, L.A.; Pink, R.C.; Carter, D.R. Routes and mechanisms of extracellular vesicle uptake. J. Extracell. Vesicles 2014, 3, 24641. [Google Scholar] [CrossRef]
- Kurian, N.K.; Modi, D. Extracellular vesicle mediated embryo-endometrial cross talk during implantation and in pregnancy. J. Assist. Reprod. Genet. 2019, 36, 189–198. [Google Scholar] [CrossRef]
- Alam, S.M.K.; Jasti, S.; Kshirsagar, S.K.; Tannetta, D.S.; Dragovic, R.A.; Redman, C.W.; Sargent, I.L.; Hodes, H.C.; Nauser, T.L.; Fortes, T.; et al. Trophoblast Glycoprotein (TPGB/5T4) in Human Placenta: Expression, Regulation, and Presence in Extracellular Microvesicles and Exosomes. Reprod. Sci. 2018, 25, 185–197. [Google Scholar] [CrossRef] [PubMed]
- Frängsmyr, L.; Baranov, V.; Nagaeva, O.; Stendahl, U.; Kjellberg, L.; Mincheva-Nilsson, L. Cytoplasmic microvesicular form of Fas ligand in human early placenta: Switching the tissue immune privilege hypothesis from cellular to vesicular level. Mol. Hum. Reprod. 2005, 11, 35–41. [Google Scholar] [CrossRef] [PubMed]
- Stenqvist, A.C.; Nagaeva, O.; Baranov, V.; Mincheva-Nilsson, L. Exosomes secreted by human placenta carry functional Fas ligand and TRAIL molecules and convey apoptosis in activated immune cells, suggesting exosome-mediated immune privilege of the fetus. J. Immunol. 2013, 191, 5515–5523. [Google Scholar] [CrossRef] [PubMed]
- Giacomini, E.; Alleva, E.; Fornelli, G.; Quartucci, A.; Privitera, L.; Vanni, V.S.; Viganò, P. Embryonic extracellular vesicles as informers to the immune cells at the maternal-fetal interface. Clin. Exp. Immunol. 2019, 198, 15–23. [Google Scholar] [CrossRef]
- Tong, M.; Abrahams, V.M.; Chamley, L.W. Immunological effects of placental extracellular vesicles. Immunol. Cell Biol. 2018, 97, 714–722. [Google Scholar] [CrossRef] [PubMed]


© 2020 by the authors. Licensee MDPI, Basel, Switzerland. This article is an open access article distributed under the terms and conditions of the Creative Commons Attribution (CC BY) license (http://creativecommons.org/licenses/by/4.0/).
Share and Cite
Chaiwangyen, W.; Murrieta-Coxca, J.M.; Favaro, R.R.; Photini, S.M.; Gutiérrez-Samudio, R.N.; Schleussner, E.; Markert, U.R.; Morales-Prieto, D.M. MiR-519d-3p in Trophoblastic Cells: Effects, Targets and Transfer to Allogeneic Immune Cells via Extracellular Vesicles. Int. J. Mol. Sci. 2020, 21, 3458. https://doi.org/10.3390/ijms21103458
Chaiwangyen W, Murrieta-Coxca JM, Favaro RR, Photini SM, Gutiérrez-Samudio RN, Schleussner E, Markert UR, Morales-Prieto DM. MiR-519d-3p in Trophoblastic Cells: Effects, Targets and Transfer to Allogeneic Immune Cells via Extracellular Vesicles. International Journal of Molecular Sciences. 2020; 21(10):3458. https://doi.org/10.3390/ijms21103458
Chicago/Turabian StyleChaiwangyen, Wittaya, José M. Murrieta-Coxca, Rodolfo R. Favaro, Stella M. Photini, Ruby N. Gutiérrez-Samudio, Ekkehard Schleussner, Udo R. Markert, and Diana M. Morales-Prieto. 2020. "MiR-519d-3p in Trophoblastic Cells: Effects, Targets and Transfer to Allogeneic Immune Cells via Extracellular Vesicles" International Journal of Molecular Sciences 21, no. 10: 3458. https://doi.org/10.3390/ijms21103458
APA StyleChaiwangyen, W., Murrieta-Coxca, J. M., Favaro, R. R., Photini, S. M., Gutiérrez-Samudio, R. N., Schleussner, E., Markert, U. R., & Morales-Prieto, D. M. (2020). MiR-519d-3p in Trophoblastic Cells: Effects, Targets and Transfer to Allogeneic Immune Cells via Extracellular Vesicles. International Journal of Molecular Sciences, 21(10), 3458. https://doi.org/10.3390/ijms21103458