Article

The Terrestrial Carnivorous Plant Utricularia reniformis Sheds Light on Environmental and Life-Form Genome Plasticity

by
Saura R. Silva
1,
Ana Paula Moraes
2,
Helen A. Penha
1,
Maria H. M. Julião
1,
Douglas S. Domingues
3,
Todd P. Michael
4,
Vitor F. O. Miranda
5,* and
Alessandro M. Varani
1,*
1
Departamento de Tecnologia, Faculdade de Ciências Agrárias e Veterinárias, UNESP—Universidade Estadual Paulista, Jaboticabal 14884-900, Brazil
2
Centro de Ciências Naturais e Humanas, Universidade Federal do ABC, São Bernardo do Campo 09606-070, Brazil
3
Departamento de Botânica, Instituto de Biociências, UNESP—Universidade Estadual Paulista, Rio Claro 13506-900, Brazil
4
J. Craig Venter Institute, La Jolla, CA 92037, USA
5
Departamento de Biologia Aplicada à Agropecuária, Faculdade de Ciências Agrárias e Veterinárias, UNESP—Universidade Estadual Paulista, Jaboticabal 14884-900, Brazil
*
Authors to whom correspondence should be addressed.
Int. J. Mol. Sci. 2020, 21(1), 3; https://doi.org/10.3390/ijms21010003
Submission received: 23 October 2019 / Revised: 13 December 2019 / Accepted: 15 December 2019 / Published: 18 December 2019
(This article belongs to the Special Issue Plant Genomics 2019)

Abstract

:
Utricularia belongs to Lentibulariaceae, a widespread family of carnivorous plants that possess ultra-small and highly dynamic nuclear genomes. It has been shown that the Lentibulariaceae genomes have been shaped by transposable elements expansion and loss, and multiple rounds of whole-genome duplications (WGD), making the family a platform for evolutionary and comparative genomics studies. To explore the evolution of Utricularia, we estimated the chromosome number and genome size, as well as sequenced the terrestrial bladderwort Utricularia reniformis (2n = 40, 1C = 317.1-Mpb). Here, we report a high quality 304 Mb draft genome, with a scaffold NG50 of 466-Kb, a BUSCO completeness of 87.8%, and 42,582 predicted genes. Compared to the smaller and aquatic U. gibba genome (101 Mb) that has a 32% repetitive sequence, the U. reniformis genome is highly repetitive (56%). The structural differences between the two genomes are the result of distinct fractionation and rearrangements after WGD, and massive proliferation of LTR-retrotransposons. Moreover, GO enrichment analyses suggest an ongoing gene birth–death–innovation process occurring among the tandem duplicated genes, shaping the evolution of carnivory-associated functions. We also identified unique patterns of developmentally related genes that support the terrestrial life-form and body plan of U. reniformis. Collectively, our results provided additional insights into the evolution of the plastic and specialized Lentibulariaceae genomes.

1. Introduction

The carnivorous plants from the Lentibulariaceae Rich. family exhibit different life-forms according to their habitats (terrestrial, aquatic, lithophytes, epiphytes, and rheophytes), showing an enormous diversity and worldwide distribution [1]. The family is composed of three genera: Genlisea A. St.-Hil. (corkscrew plants), Pinguicula L. (butterworts), and Utricularia L. (bladderworts). The sequencing of four Lentibulariaceae genomes: Genlisea aurea A. St.-Hil. [2], G. nigrocaulis Steyerm, G. hispidula Stapf [3], and Utricularia gibba L. [4,5], along with the estimation of genome size [6,7,8] and karyological analyses (e.g., [3,9,10,11,12]), revealed a wide distribution of genome size and chromosome numbers. In Utricularia, genome size ranges from ultra-small (~79 Mb) in U. purpurea Walter to large (~706 Mb) in U. caerulea L., with a variable number of chromosomes (e.g., 2n = 18, 28, 30, 36, 38, 40, 44, 48, and 56), supporting the occurrence of polyploidy and aneuploidy/dysploidy (for review see [8,12]).
Lentibulariaceae genome shrinkage has been attributed to a decrease in the number and length of introns and intergenic regions, associated with transposable elements (TEs) silencing. This phenomenon was primarily observed in U. gibba (101 Mb) and G. aurea (63–131 Mb according to [8,12]) genomes [2,13,14]. One of the leading hypotheses to explain the genome shrinkage is based on the high respiration rates caused by the carnivorous traps [15], which can increase reactive oxygen species (ROS) formation. Moreover, the U. gibba and the 86 Mb G. nigrocaulis genomes have suffered high rates of gene deletion in comparison to other eudicots, and in the former, a positive selection of tandemly repeated genes implicated in the adaptation to the carnivorous habit is observed [3,5,16].
In contrast, genome size expansion is generally attributed to TEs proliferation, whole-genome duplication (WGD) (represented by retained polyploid duplicates), and small-scale duplication (mainly represented by proximal and tandem copies) [17,18], which are the standard processes for plant genome evolution [19,20]. Together, TEs and WGDs are considered to be the key players in generating genomic novelties and genomic diversification [21,22,23]. Even among the minimal Lentibulariaceae genomes, the importance of these events it is clear, since the changes in size between the large, 1.5-Gb genome of G. hispidula and that of G. nigrocaulis (86 Mb) are consequences of WGDs, along with the LTR-retrotransposons expansion in the former, and the double-strand break repair-mediated deletions in the latter [3]. Additionally, the LTR-retrotransposons silencing and significant fractionation, which returned several genes to a single copy after multiple rounds of WGDs molded the U. gibba genome [4]. Therefore, the dynamic and specialized Lentibulariaceae genomes can provide a natural platform for the study of genome duplication, fractionation, and TEs expansion and silencing, and their impact on the evolution of the angiosperms [4,5,8].
Utricularia reniformis A.St.-Hil. is endemic to the Brazilian Atlantic Forest, growing as a terrestrial species in wet grasslands or as an epiphyte in moist habitats [1,24]. Some but limited information is available on the U. reniformis nuclear genome, such as its high levels of polymorphism [25], its genome size of 292 Mb (which is an intermediate size in comparison to other Utricularia) and a GC content of 38% [8]. We have also previously reported the sequence analyses of U. reniformis chloroplast (cpDNA) and mitochondrial (mtDNA) genomes [26,27]. In order to develop insights into the forces that have shaped the genomes of the Lentibulariaceae species, here we estimated the genome size and chromosome number, and deep-sequenced the terrestrial bladderwort U. reniformis genome and transcriptome. We also compared the U. reniformis draft genome against the aquatic species U. gibba and other angiosperms, revealing that the U. reniformis has a distinct genome structure, mostly due to lineage-specific WGDs and a TE expansion, reflecting a diversified repertoire of plant developmental and carnivory-associated genes and their underlying terrestrial adaptation.

2. Results

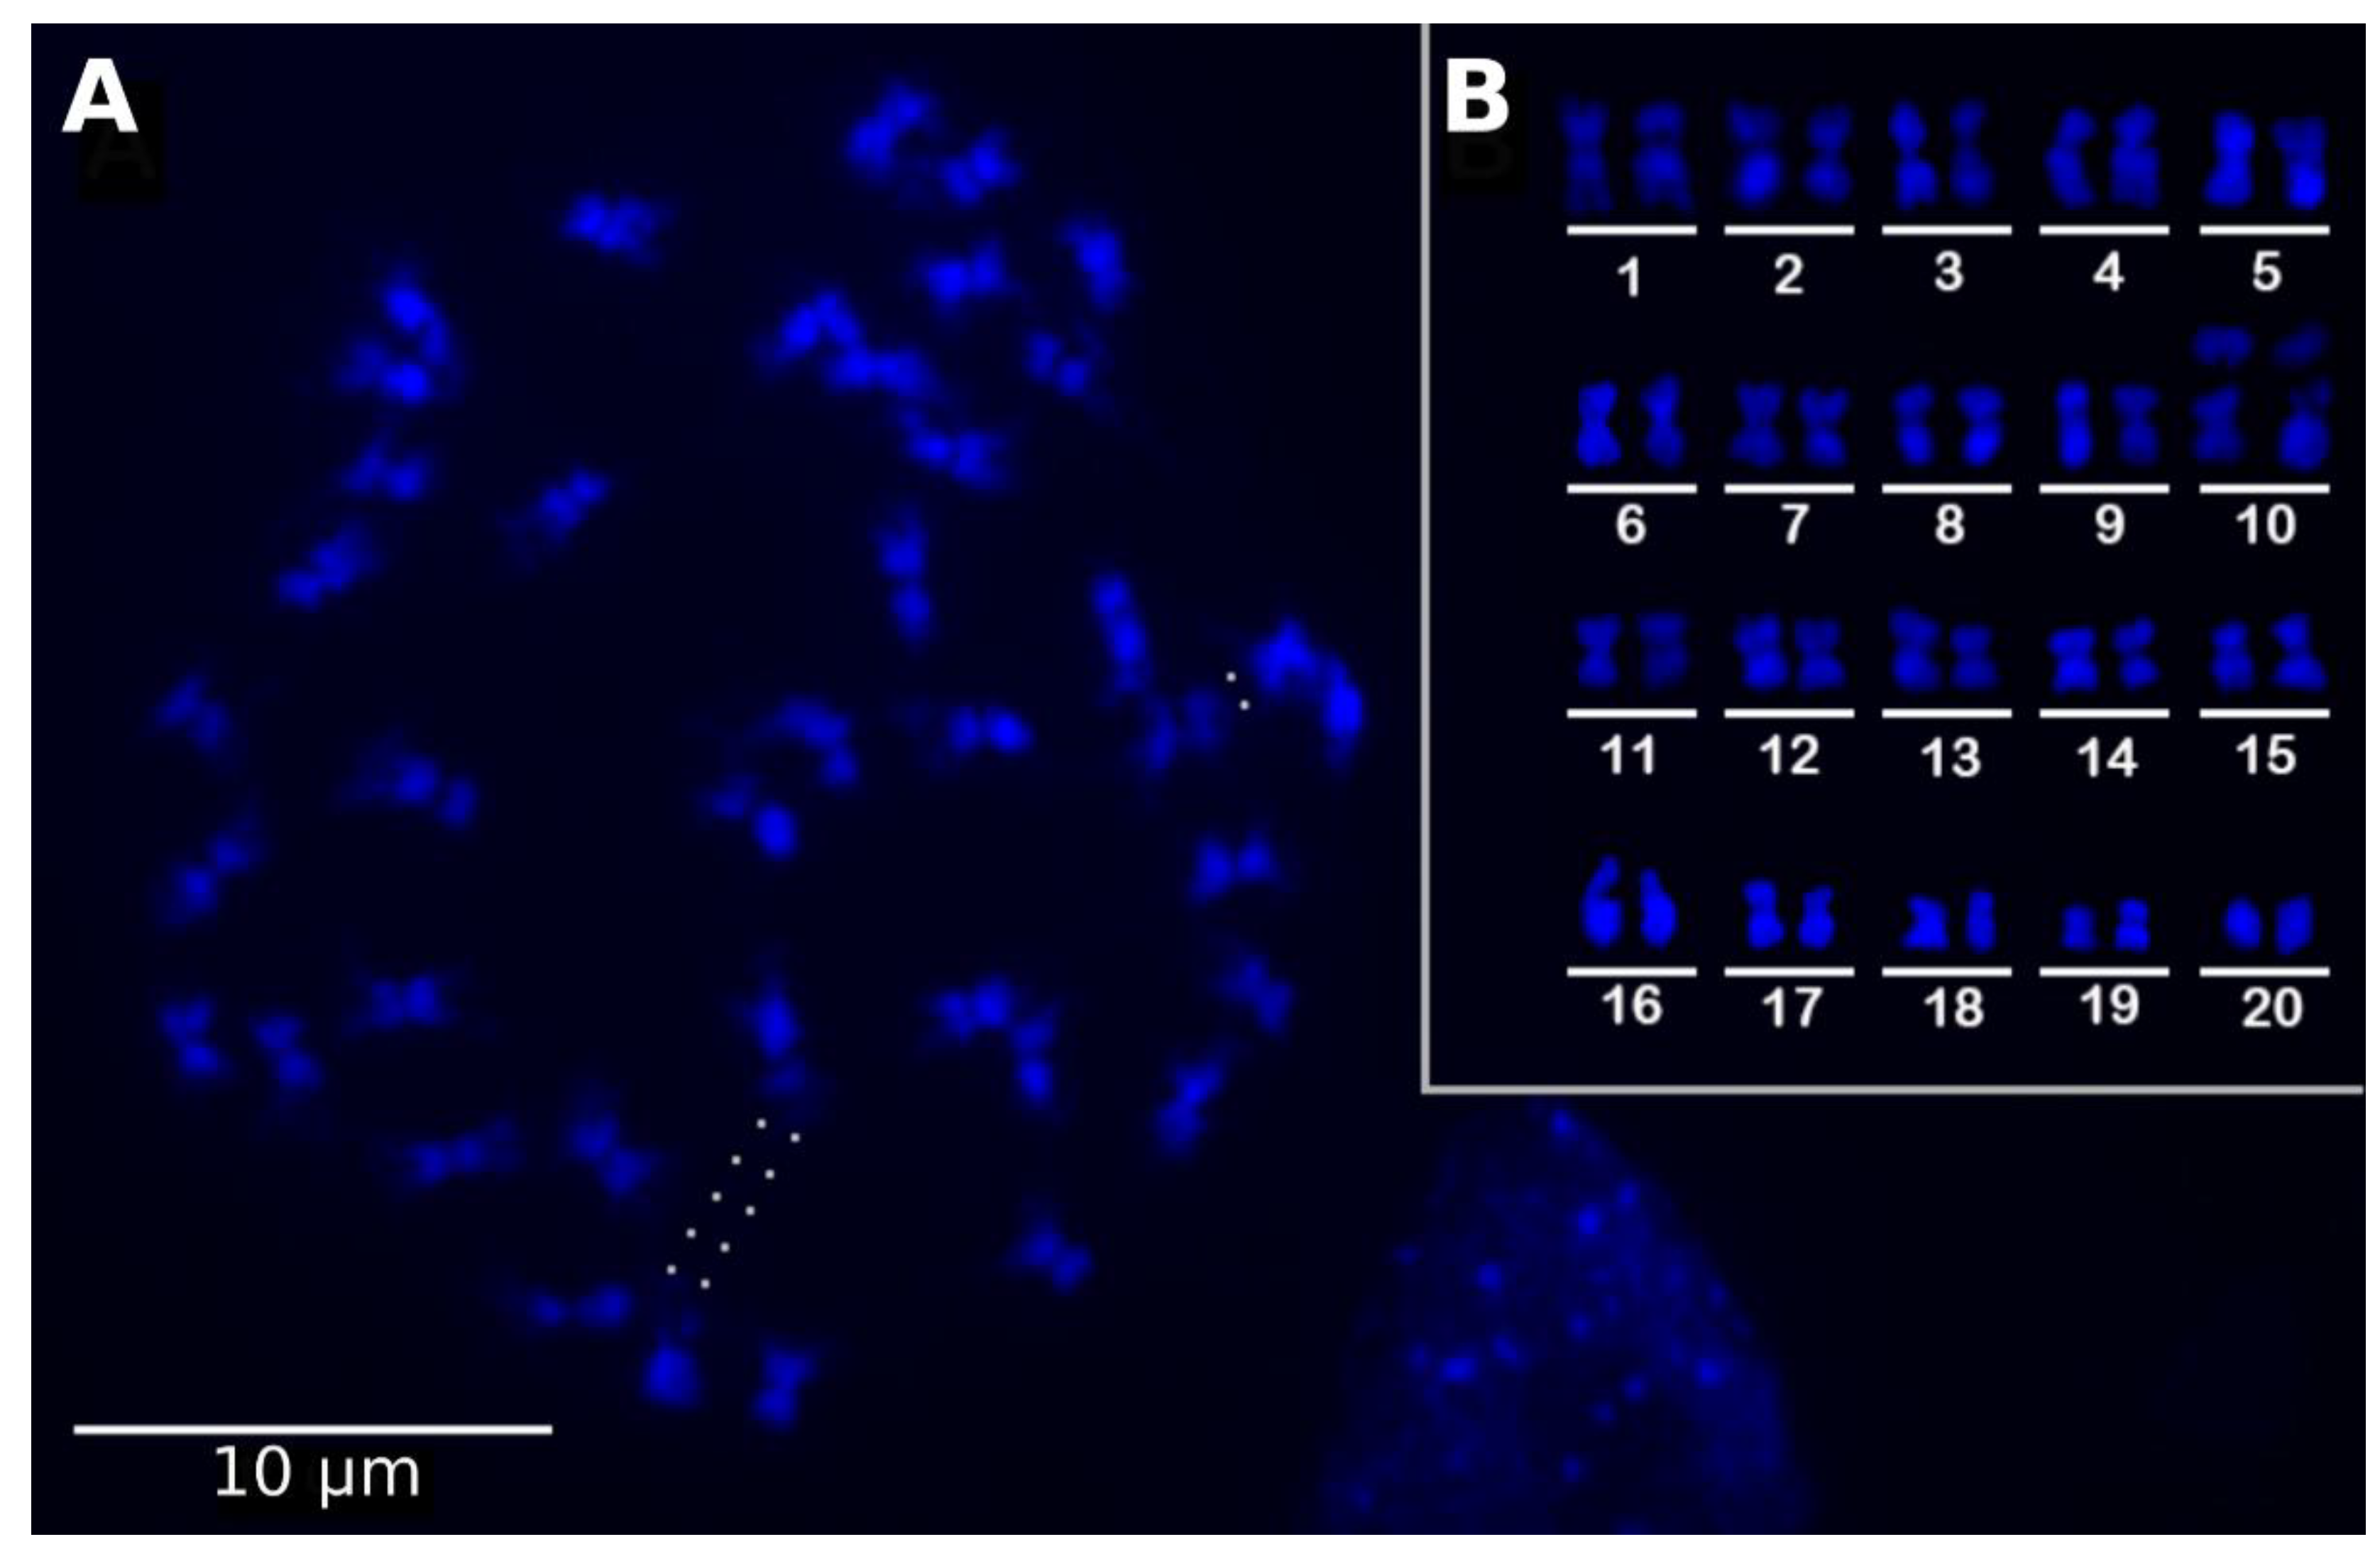
2.1. The Utricularia reniformis Genome

We first determined the chromosome number of U. reniformis as 2n = 40 (Figure 1A,B). The small chromosomes (~1.65 µm) varied between metacentric to submetacentric, with one pair holding a distended satellite, probably representing the ribosomal DNA 45S sites (see dots in Figure 1A and the chromosome pair 10 in Figure 1B). The genome size, estimated by the flow cytometry of the nuclei from leaves, was found to be 2C = 0.652 pg (SD = 1.48%), which represents a haploid genome size of 1C = 317.1 Mb (or 0.324 pg) (Table S1).
We generated 350 gigabytes of genomic and transcriptomic data for U. reniformis (Table 1). The k-mer frequency analysis demonstrated that U. reniformis exhibits a high heterozygosity rate of 1.8% (Figure 2 and Figure S1). In addition, the k-mer frequency plot was consistent with a tetraploid genome with the haploid at 149 Mb. Moreover, the predicted genome unique content and repeated content lengths are ~88 Mb (29%) and ~220 Mb (71%), respectively.
The assembled draft genome spanned 304 Mb (96% of the flow cytometry-estimated genome size), with an average coverage of 145× (based on the number and length of aligned reads, divided by the assembled genome size), had an NG50 of 466-Kb and a BUSCO completeness of 87.8%, showing a duplication rate of ~26%, which might correspond with a partial genome duplication (Table S2) and 42,582 gene model predictions. The estimated number of error-free bases was 93% (283 of 304 Mb), which also indicated that multiple repeated genomic regions (e.g., non-autonomous LTR elements, centromeres, and telomeres) remained partial or non-assembled. However, this finding also supported that a large amount of the heterozygous content present in U. reniformis genome was represented in the assembled draft genome (Table 2 and Figure 2).
Moreover, several cpDNA- and mtDNA-derived regions were also identified, thus, providing support for the lateral transfer between the organelles and the nuclear genome, as previously reported [26,27]. We also detected simple sequence repeat (SSRs) markers already developed for U. reniformis [25], in our draft genome. Among all markers, for two SSR loci, we found corresponding regions in U. gibba and U. reniformis (Table S3). In both cases, we recovered two scaffolds in U. reniformis and only one syntenic genomic region in U. gibba (Figure S2). For all other markers, we were not able to detect loci shared in both genomes. In addition to the Arabidopsis-type telomeric repeats identified at the scaffolds ends, we also found Chlamydomonas- and Genlisea-type telomeric repeats in their vicinity, as previously observed for U. gibba [5]. Furthermore, U. reniformis exhibited a considerable amount of TE-derived sequences, when compared to U. gibba (56% vs. 32%).

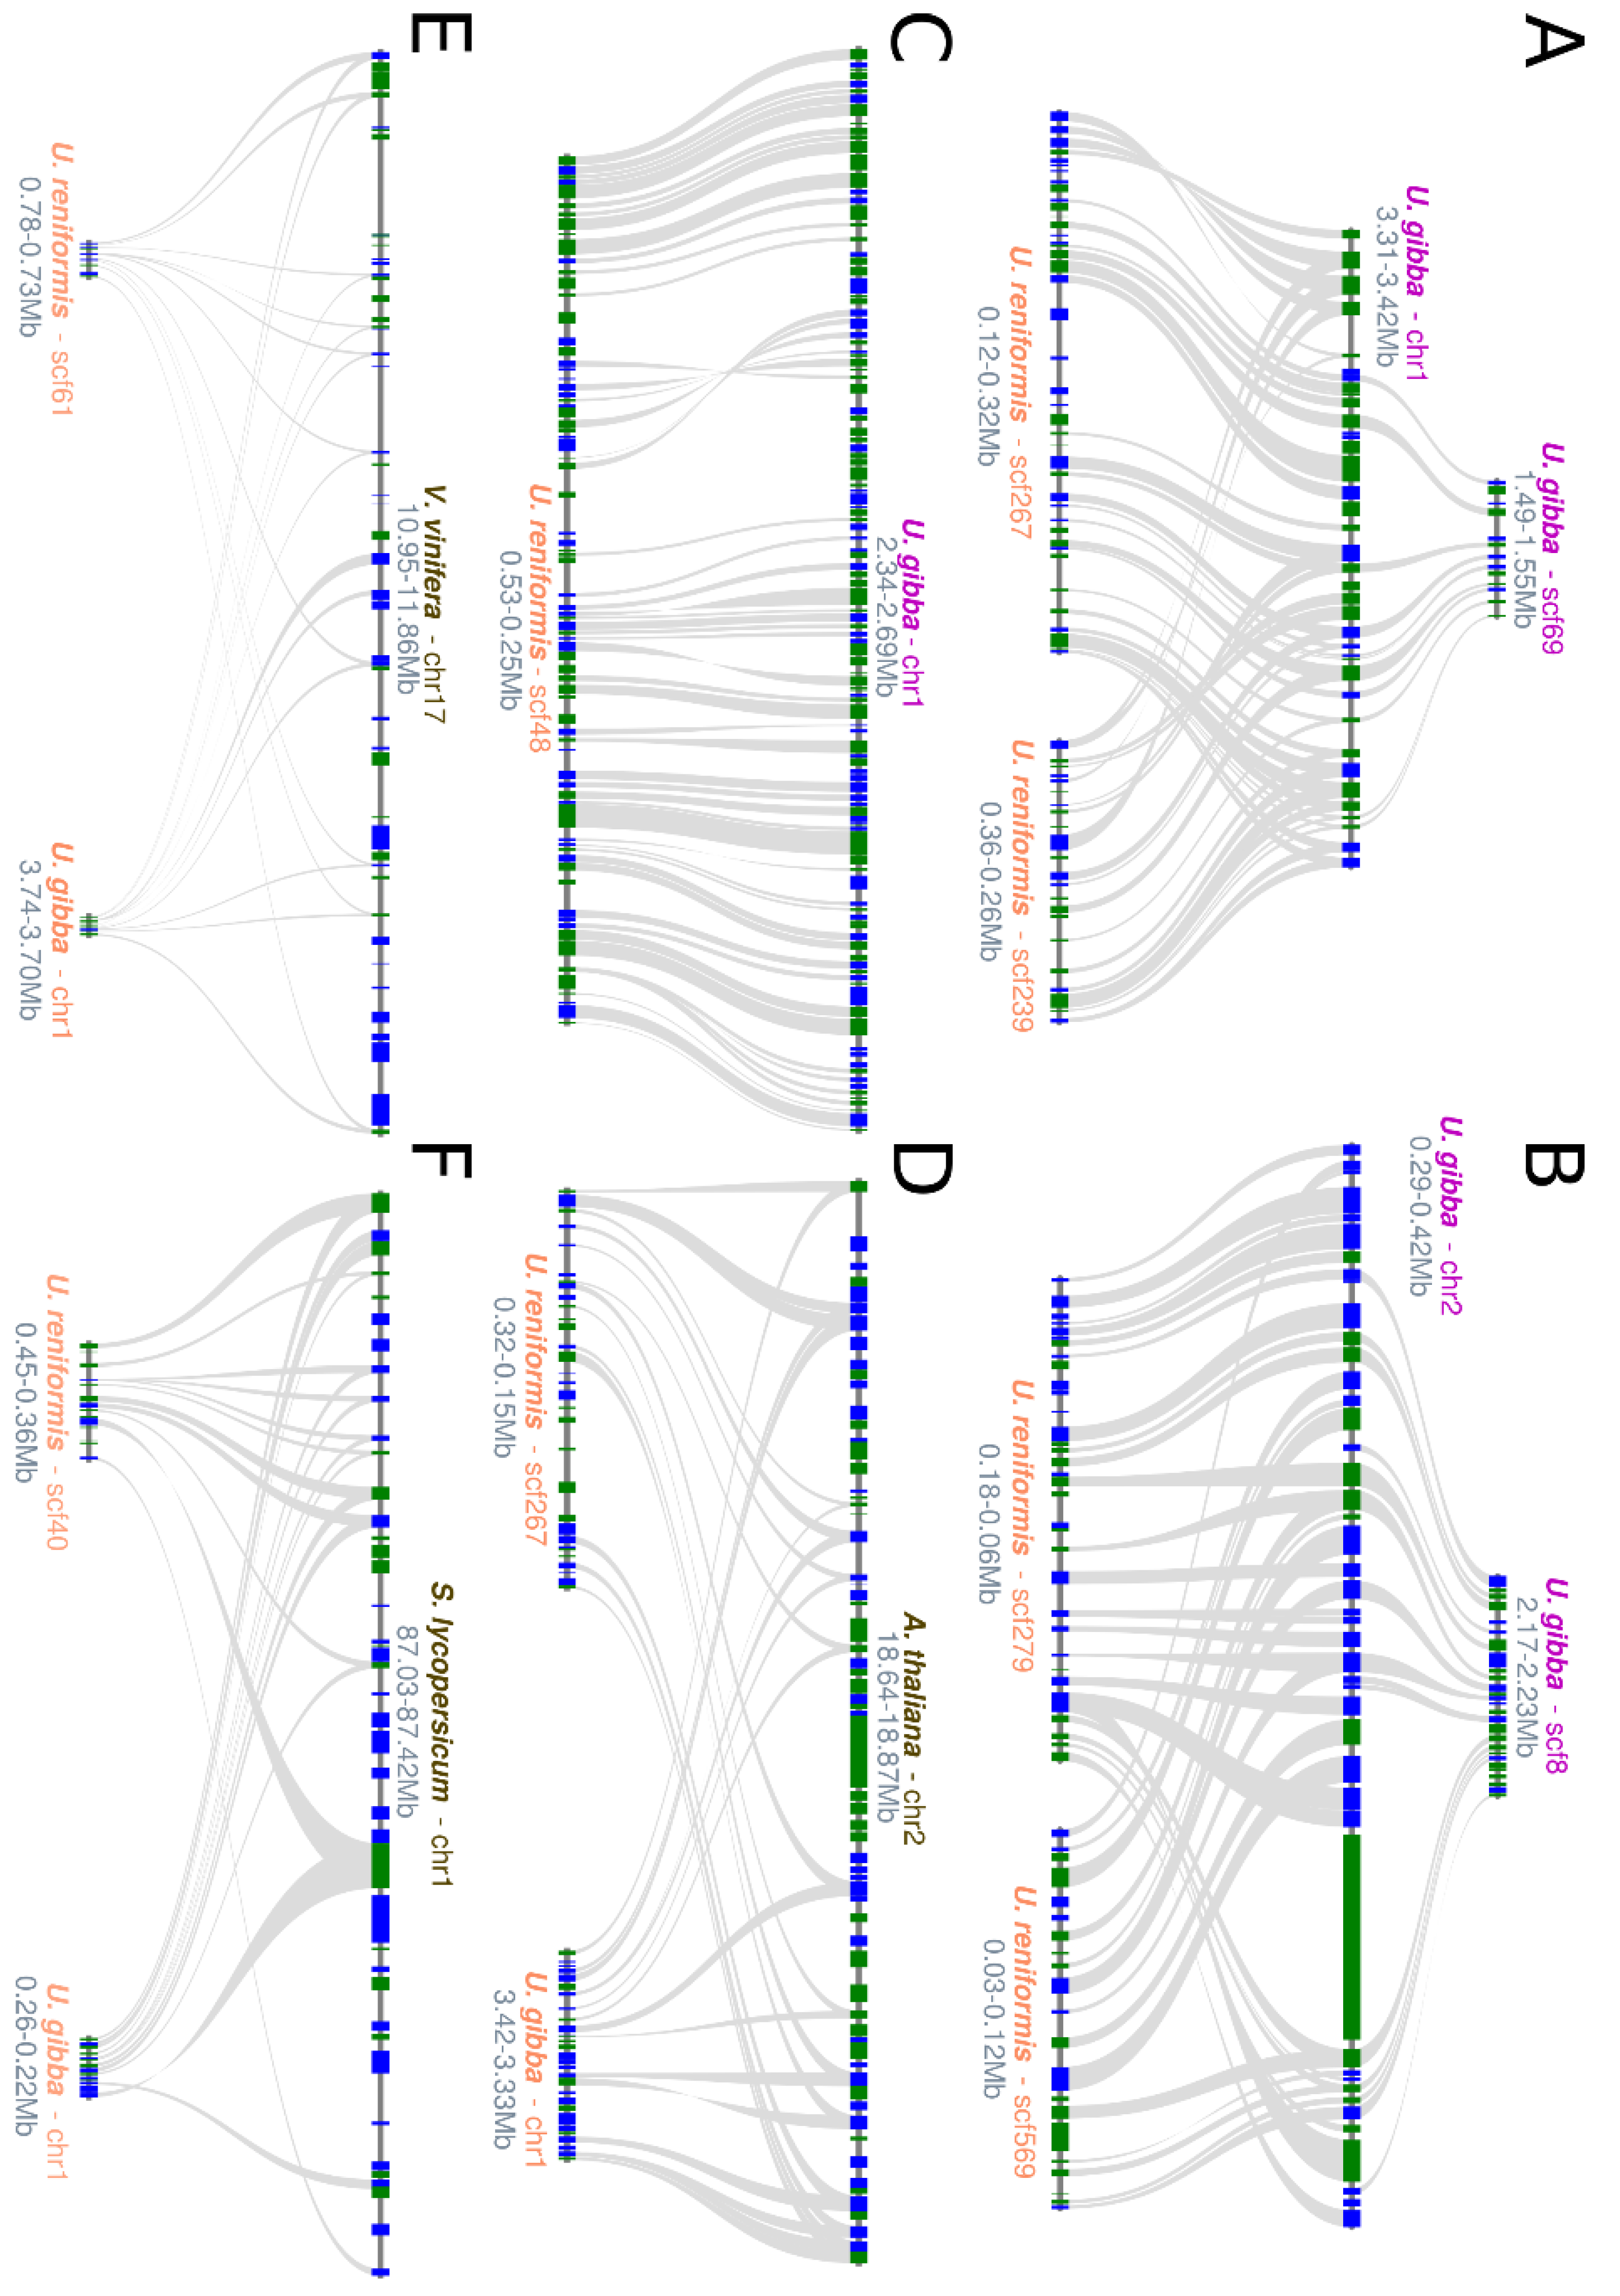
2.2. Structural Comparative Analysis

In order to infer U. reniformis genome structure and WGD history, we compared the draft genome to U. gibba and other angiosperms. In spite of the low assembly contiguity, we were able to detect at least one WGD round since the core eudicot γ whole-genome triplication (WGT), according to the Ks values for estimates of individual genome duplication events (Figure S3A). Moreover, blockwise relationships between U. reniformis and U. gibba were about 4:2 (Figure S3B), supporting that U. reniformis is a tetraploid, as compared to U. gibba. This finding also suggested that the two Utricularia genomes responded distinctly after the WGD events.
The U. reniformis and U. gibba structural genome differences become more obvious by comparative pairwise alignment. We observed 77% (SD:4%) average nucleotide identity (ANI) between the U. reniformis and U. gibba assemblies by reciprocal best blast (RBB). Additionally, we observed low global collinearity, which indicated that the U. reniformis genome presents a mosaic structure in comparison to U. gibba (Figure 3A,B). Approximately 114 Mb of the U. reniformis genome exhibited partial matches (average length of 84-Kb) to U. gibba (Table S4). The unaligned blocks corresponded to the segments exclusive to U. reniformis, which were mostly related to the TE-related regions (Figure 3B).
Additionally, we mapped less than 37% of the U. reniformis trimmed paired-end reads consistently with the right distance and orientation onto the U. gibba assembly, which also supported the considerable structural differences between these species (Table S5). As a result, it was not possible to employ the reference-assisted assembly procedure to anchor the U. reniformis scaffolds into the U. gibba fully-assembled chromosomes to reconstruct potential pseudo-molecules.
Moreover, in comparison to other angiosperms, U. reniformis also showed a lower percentage of macrosyntenic blocks. For instance, U. reniformis retained at least 47 Mb (average length of 76-Kb and ANI of 82%), 35 Mb (average length of 46-Kb and ANI of 76%), and 53 Mb (average range of 63-Kbp and ANI of 77%) of shared blocks to A. thaliana, V. vinifera, and S. lycopersicum. In contrast, its closest relative, U. gibba, retained 71 Mb (average length of 44-Kb and ANI of 80%), 57 Mb (average length of 26-Kb and ANI of 75%), and 58 Mb (average length of 35-Kb and ANI of 77%) blocks, respectively (Table S4).
We further evaluated the microsyntenic level and verified that U. reniformis and U. gibba present distinct patterns of retention and alternative deletion of duplicated genes between the polyploid subgenomes, which is consistent with the distinct post-speciation evolutionary paths (Figure 4A–C). This feature is also observed among the Utricularia species and A. thaliana, yet with fewer microsynteny blocks (Figure 4D). When both Utricularia genomes are compared to the phylogenetically distant eudicotyledons, such as V. vinifera and S. lycopersicum, a significant fractionation is prominent (Figure 4E,F).
However, in general, the two Utricularia species were far more similar in gene order to each other than either were to A. thaliana, V. vinifera, and S. lycopersicum. The phylogenetic and ANI analyses based on 336 core eukaryotic genes corroborated our microsynteny analysis, supporting the same common ancestor for U. reniformis and U. gibba, and also for the Utricularia and Genlisea clades (Figure 5).

2.3. Utricularia reniformis Comparative Annotation

In general, U. reniformis and U. gibba show different arrays of gene duplication that might directly reflect support that they are retaining genes in a biased manner. This was exemplified by the more significant number of tandem, proximal, and dispersed gene pairs identified in U. reniformis, when compared to U. gibba (Table 3). In contrast, U. gibba displayed more singletons and segmental duplicates. However, the more significant number of segmental copies identified in U. gibba might be related to the assembled genome using long-reads, which permitted a better identification of large syntenic blocks, in comparison to the U. reniformis genome based on short-reads. Moreover, the considerable number of singletons in U. gibba might also represent retained duplicates that have reverted to a single copy after the WGD, which supported the genome size reduction observed in this species.
It is noteworthy that the gene space in U. reniformis represents ~26% of the genome, which also demonstrated that the intergenic regions are replete with TEs-related sequences constituting more than half of the genome size. Conversely, TEs covered ~32% of U. gibba genome, while the gene space represented ~51%.

2.4. Utricularia reniformis Shows a Massive Expansion of LTR from the Gypsy Superfamily

Utricularia reniformis presents a prominent LTR-retrotransposons expansion, representing up to 145 Mb (Figure 6 and Table S6). In general, a separate array of expansion and contraction of distinct evolutionary lineages from the Copia and Gypsy superfamilies stand as the main differences between U. reniformis and U. gibba. The most noticeable increase of the Gypsy superfamily was observed within the Ogre evolutionary lineage, accounting up to 72 Mb of U. reniformis genome. It is noteworthy that the LTR-LARDs, Angela, CRM, are more prevalent in U. gibba, including the Athila evolutionary lineage, which was exclusively found in U. gibba. In contrast, from the Copia superfamily, the evolutionary lineages Alesia, Bianca, Ikeros, and SIRE were found solely in U. reniformis. As observed in other plant genomes, the Class II elements were less prominent in both species, and except for the Helitron super-family which we were not able to identify in U. gibba, mostly known super-families and evolutionary lineages commonly found in plant genomes were present.

2.5. Distinct Functional Enrichment Patterns Among Tandem and Dispersed Duplicate Genes

Self–self-genome comparisons among the singletons and duplicated genes (dispersed, proximal + tandem, and segmentals) revealed exciting patterns of enriched GO terms and KEGG enzymes (p < 0.05, Fisher’s exact test, Bonferroni corrected) between U. reniformis and U. gibba (Tables S7–S9). Both species retained a conserved arrangement of cellular components related to organelles and nucleus among the singletons, such as, chloroplast (GO:0009507), thylakoid (GO:0009579), mitochondrion (GO:0005739), nucleoplasm (GO:0005654), nuclear envelope (GO:0005635), endoplasmic reticulum (GO:0005783), and biological processes related to photosynthesis (GO:0015979) and DNA metabolic process (GO:0006259). Additionally, KEGG enzymes with associated functions that act on NADH or NADPH (EC:1.6.99.5), NADH dehydrogenase (EC:1.6.99.3), NADH—ubiquinone reductase (EC:7.1.1.2) were also augmented among the singletons. Together, these findings support a conserved organellar functional activity including the control of energy homeostasis functions among the singletons.
Among the dispersed duplicates, the nuclease activity (GO:0004518) was enriched in both species. However, the hydrolase activity (GO:0016787), transcription regulator activity (GO:0140110), DNA-binding transcription factor activity (GO:0003700), and tropism (GO:0009606) were significantly overrepresented in U. reniformis, while carbohydrate metabolic process (GO:0005975), transport (GO:0006810), kinase activity (GO:0016301), and lipid metabolic process (GO:0006629) were enriched in U. gibba.
It was previously observed in many angiosperm genomes that secondary metabolic function and transcriptional function are enriched among tandems and segmental duplicates, respectively [5,28,29,30]. Our results corroborate this observation for secondary metabolic function in the tandem repeats of both Utricularia, and the transcriptional functions only in U. gibba segmental duplicates. Interestingly, and opposite to what has been previously observed, the transcriptional features were augmented in U. reniformis dispersed duplicates genes. Since the dispersed copies could arise from TEs movements, and the U. reniformis genome had a high level of LTR-elements, this result might suggest a central role of LTR transposition in molding these genomic differences.
We also checked the potential role of tandem and proximal duplicates with the evolution of novel functions, such as those related to carnivory and the ROS metabolism, which revealed an enrichment of many GO terms and KEGG enzymes in both species (Figure 7). For instance, catalytic activity (GO:0003824), biotic stimulus (GO:0009607), transferase activity (GO:0016740), and the cellular components—lysosome (GO:0005764), lytic vacuole (GO:0000323), and the cell wall (GO:0005618) were overrepresented. The enrichment of the cell wall (GO:0005618) term, could be related to the trap movement during the prey capture, which demands profound and dynamic cell-wall changes [5], and the lysosome and lytic vacuole enrichment might be related to the digestion of preys. However, we also identified distinct GO and KEGG enrichment arrangement among species, strongly suggesting a functional divergence, subfunctionalization, or neofunctionalization among the tandem and proximal duplicates (Figure 7). Comparatively, U. reniformis showed an enrichment of response to chemicals (GO:0042221), a response to external stimulus (GO:0009605), and signaling (GO:0023052), whereas, as observed in the dispersed duplicates, the lipid metabolic process (GO:0006629) was also augmented in U. gibba tandem duplicates. Regarding the well-known carnivory [4,5] and ROS enzymatic functions, U. gibba presented chitinase (EC:3.2.1.14), cysteine protease (EC:3.4.22), and peroxidases (EC:1.11.1.7) enriched in tandem duplicates regions, as previously described [5], whereas U. reniformis exhibited glutathione transferases (EC:3.4.16), carboxylesterase (EC:2.5.1.18), acylglycerol lipase (EC:3.1.1.23), pectinesterase (EC:3.1.1.11), and enzymes that acted on the paired donors, with an incorporation or reduction of molecular oxygen (EC:1.14.13). Therefore, these findings indicated that both species presented distinct enrichment patterns of GO terms and KEGG enzymes, supporting an ongoing gene birth–death–innovation process that included metabolism and carnivory-associated functions, among the tandem and proximal duplicated genes.
Interestingly, among the segmental duplicates, similar patterns of functions related to the primary metabolism, and the plant developmental process were enriched in both species, for example the amide biosynthetic process (GO:0043604), anatomical structure development (GO:0048856), reproduction (GO:0000003), nitrogen compound metabolic process (GO:0006807), peptide metabolic process (GO:0006518), and the primary metabolic process (GO:0044238).

2.6. Utricularia reniformis Displays Unique Patterns of Carnivory-Associated, Land Adaptation, and Developmentally Related Genes

Previous studies, including literature review and comparative annotation approaches, accurately identified GO terms and KEGG enzymes strictly related to the carnivory-associated functions among the sequenced carnivorous plants available in public databases [31,32]. Based on this data, we investigated our functional annotation results and observed that U. reniformis had an extensive gene repertoire of carnivory-associated and ROS-related functions (Table 4). In addition, we also identified an extensive repertoire of plant development, reproduction, and life-form adaption GO terms in U. reniformis (Table 5), which might be related to the different life-forms in comparison to U. gibba. Moreover, distinct patterns of ABC transporters were observed between U. reniformis and U. gibba (Figure 8A,B). Terrestrial plants exhibited, on average, a repertoire of 128 ABC transporters, while the aquatic plants had fewer copies [33]. At least 132 and 86 ABC transporters were identified in U. reniformis and U. gibba, respectively (Figure 8A and Table S10), suggesting that U. reniformis had more copies due to its terrestrial adaptation. This was especially apparent from the expansion of the ABC transporter B (Figure 8A and Figure S4) and ABC transporter C families, which are commonly related to developmental processes and functions necessary for life on dry land, and the ABC G family (Figure 8A and Figure S5), which are related to response to biotic stress [33]. Furthermore, plant developmental-related transcription factor (TFs) containing the wuschel-like homeobox (WOX), homeobox-leucine zipper (HD-Zip), agamous-like (MADS-box), TCP, WRKY, RADIALIS, DIVARICATA, DICHOTOMA, and the scarecrow-like gene families present distinct patterns of expansion and contraction among both species (Figure 8B and Tables S11–S14), and thus, provide support for the two distinct life-forms between these species.

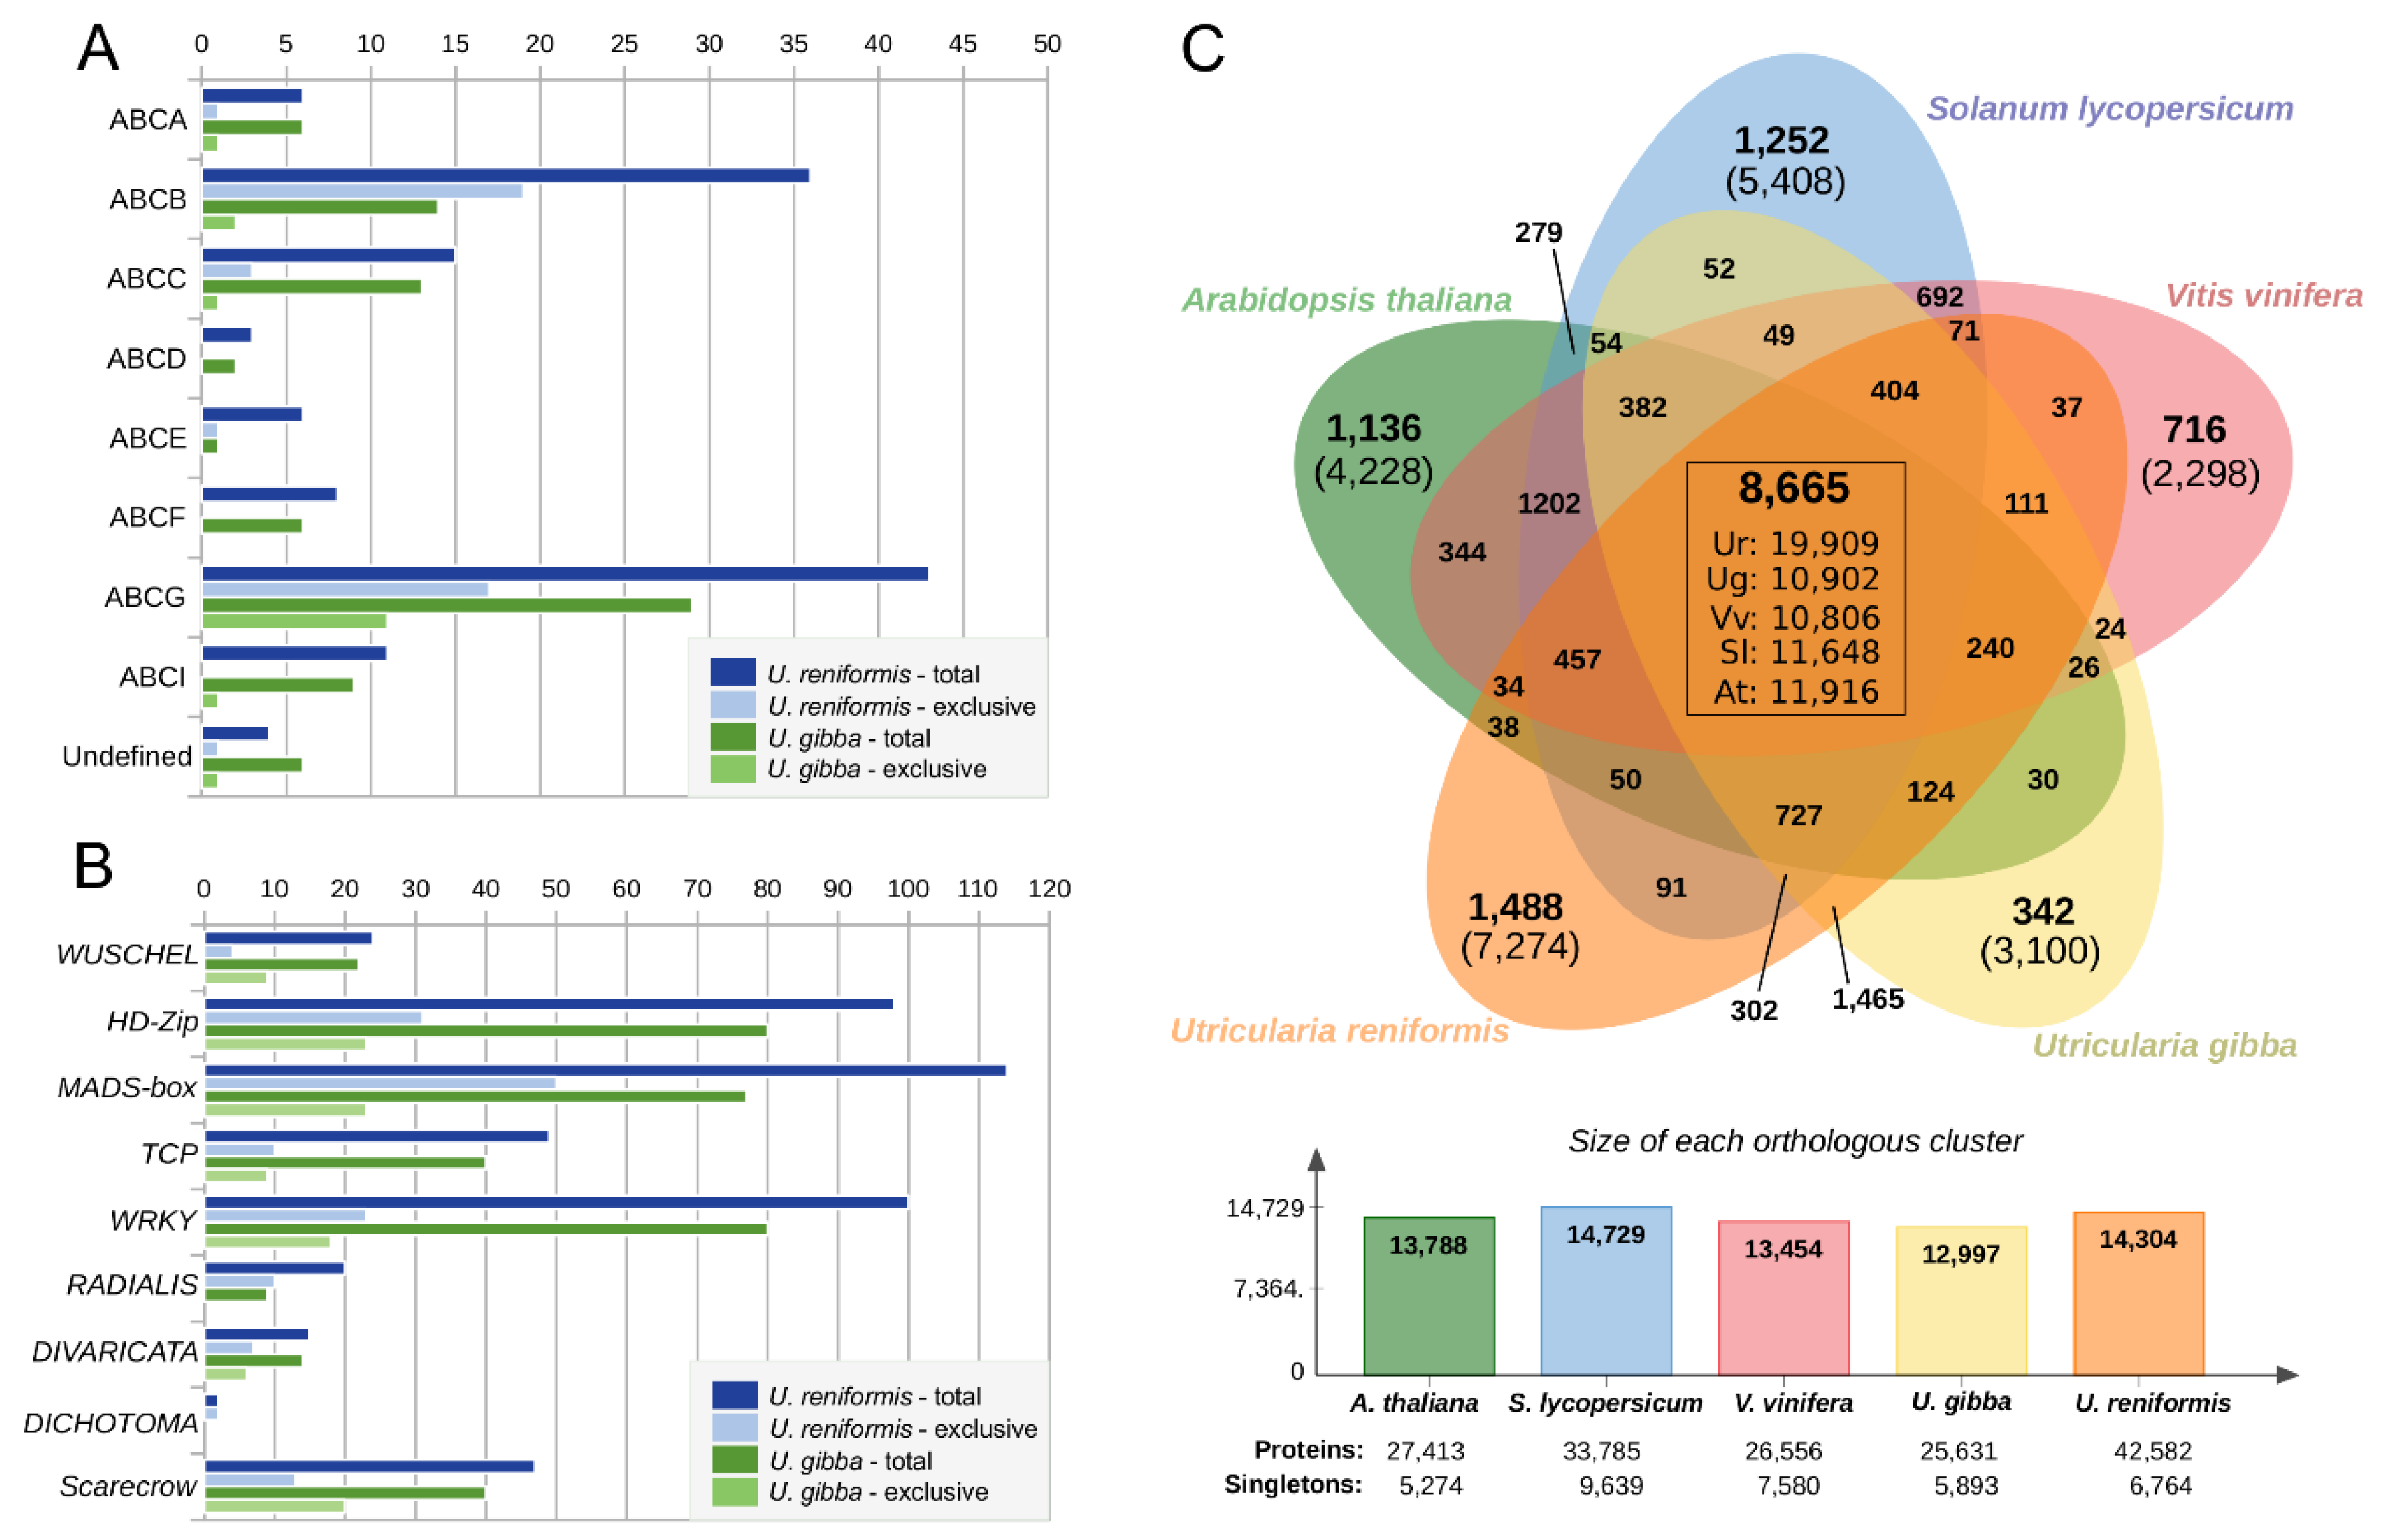
2.7. Comparative Annotation Among Other Angiosperms Genomes Reveals Species-Specific Genes Strictly Related to the Environment and Life-Form Adaptations

The comparative orthologous gene cluster analysis revealed that approximately 60% of U. reniformis and U. gibba genes are shared, indicating that they were inherited from the last common ancestor. Interestingly, U. reniformis presents an almost duplicated core gene set from that observed in U. gibba, V. vinifera, A. thaliana, and S. lycopersicum, and thus, supports a species-specific WGD event (Figure 8C and Table S15). In general, a significant fraction of the species-specific genes (genes for which no orthologs could be found in any of the other species compared) and single-copy gene clusters from U. reniformis and U. gibba encode uncharacterized or hypothetical proteins (63% for U. reniformis and 50% for U. gibba). Among the species-specific genes, we highlighted ABC transporters, and several developmental-related TF gene families (Figure 8A,B), supporting the role of the species-specific genes with plant development, reproduction, prey strategies, and life-from adaptations. GO enrichment analysis (p < 0.05, Fisher’s exact test, Bonferroni corrected) among the species-specific genes revealed an augmented functions related to the reproductive process (GO:0022414), hydrolase activity (GO:0016788), nuclease activity (GO:0004518), catalytic activity (GO:0003824), protein binding (GO:0005515), and organelles (GO:0043226) in both species. However, U. reniformis present a unique enrichment of kinase activity (GO:0016301), transferase activity (GO:0016740), carbohydrate metabolic process (GO:0005975), lytic vacuole (GO:0000323), and lysosome (GO:0005764), whereas, U. gibba exhibited cellular nitrogen compound metabolic process (GO:0034641), peptide metabolic process (GO:0006518), and signal transduction (GO:0007165). Taken together, these results indicate that the species-specific gene set might play an essential role in the diversification and adaptation to different life-forms.

3. Discussion

3.1. The Role of WGD in Utricularia reniformis Genome Evolution

Polyploid occurred multiple times during angiosperms evolution, and this is not an exception for Utricularia lineages. For instance, multi-way microsynteny analysis revealed three sequential WGD events in U. gibba, in addition to the γ WGT event shared by all core eudicots [4,5,34]. Additionally, out-crossing events might be broad among the Utricularia clade, and a comparative analyses revealed that the most recent U. gibba WGD was derived from an allopolyploidization event [5]. Allopolyploidization is recognized as a driving evolutionary innovation and is often associated with speciation when resulting in a duplicated genome structure [35,36,37]. Therefore, the current hypothesis is that not only was the U. gibba genome shaped by WGD events, but other Utricularia genomes and specifically the U. reniformis genome were shaped by WGD-induced variation and adaptation.
After a polyploidy event, each lineage undergoes distinct patterns of gene retention and fractionation, which generally leads to the genome returning to the diploid state [38]. Our results for U. reniformis and U. gibba support that each species has distinct patterns of deletions, duplicated genes, and rearrangements, suggesting that after speciation and WGD, they took distinct evolutionary paths that were consistent with their life-histories. This is exemplified by the significant number of tandem, proximal, and dispersed gene pairs identified in U. reniformis, when compared to U. gibba. Indeed, gene duplication is recognized as one of the major sources of evolutionary innovation [39]. For instance, tandem and proximal duplicated genes are often associated with the emergence of functional novelty, which commonly originated from isolated events in which an individual gene gets duplicated by unequal crossing-over between similar alleles [39]. Together with a large number of dispersed duplicates identified, the tandem duplicated genes might also arise by translocations mediated by TEs [39], generating single-gene transposition-duplication, and therefore, indicating for an essential role of TEs molding the genome structure and evolution. Additionally, WGD analysis confirmed that U. reniformis experienced at least one WGD round since the core eudicot WGT. However, it should be taken into account that the low assembly contiguity based on short-read technology hindered the identification of large syntenic blocks, and thus, complicated the evaluation of the complete history of U. reniformis WGD events.

3.2. LTR-Retrotransposons are Key Agents Governing Utricularia Genome Size Changes

One of the most common repetitive content of U. reniformis is related to TEs-related sequences, corresponding to at least 56% of the genome. The TEs drive the genome evolution, mainly by rearrangements, gene promoters repression, enhancers disruption, epigenetic regulation, and also by inflating the genome size by its copy-and-paste mechanism [40,41]. Apart from their deleterious effects, TEs also provide genome variation that can lead to the plant adapting more rapidly to new environmental conditions, and thus, leading to speciation [42,43]. The increased number of TEs in U. reniformis vs. U. gibba suggests that TEs might be playing a role in the genome innovation we are observing, but it could also just reflect a difference in the ability of the two genomes to purge mobile TEs.
The most prominent TE expansion in U. reniformis is related to LTR-retrotransposons elements from the Gypsy superfamily, which was also observed in the Solanaceae and Brassicaceae families [44,45]. In particular, elements from the Tat lineage were the most prominent, which are commonly broader in other plants, constituting up to 40% of the genome of some species [46].
Except for LTR-LARDs, all other TE groups are expanded in U. reniformis. The LTR-LARD and CRM are generally located in complex and highly repeated genomic loci, such as heterochromatic and pericentromeric regions [47,48]. These regions are often partially assembled using short-read technology, and we verified that most LTR-LARDs identified in U. reniformis are incompletely assembled, suggesting that they were partially determined and underestimated. Therefore, LTR-LARD and CRM elements might potentially represent a considerable fraction of the genome that remains unresolved in the U. reniformis assembly, and the results presented might be biased due to the assembly contiguity limits.

3.3. The Genomic Landmarks for Terrestrial Adaptation

Adaptation to the environment and life-form plasticity are hallmarks of the selective pressures that govern genome evolution in the Utricularia lineage. A common reproductive strategy for several Utricularia is to produce clones by stolon fragmentation, which is a usual asexual reproduction of aquatic species from the section Utricularia (the section in which U. gibba is nested), with some species being sterile and rarely flowering [49,50]. In contrast, U. reniformis presents a specialized sexual reproductive strategy that is entirely dependent on pollinators, and is specifically dependent on self-pollination [51]. Moreover, U. gibba seems to have a more severe degree of Fuzzy Arberian Morphology, such as no clear delimitation of distinct vegetative organs [52]. In contrast, U. reniformis presents a more traditional vegetative organ delimitation (as stems and leaves), similar to other angiosperms.
Consequently, the vegetative plasticity found in different Utricularia species might be essential strategies used to colonize the distinct habitats. Considering the different environments (water, soil, rock surface, etc.), the various trap designs [53,54,55] might be shaped as adaptation for different prey faunas [56,57,58,59]. Ultimately this might impact the absorption and assimilation of nutrients. At the genomic scale, both species display distinct patterns of development-related genes and TFs, such as WOX, HD-Zip, MADS-box, WRKY, TCP, RADIALIS, DIVARICATA, DICHOTOMA, and scarecrow-like gene families. These TFs play specialized roles in plant growth and development by regulating cell division and differentiation, in particular, the trap and floral meristem and trichome development, and might also develop an important role in the regulation of flowering time and the ontogeny of reproductive organs [16,60,61,62,63,64]. For instance, the WOX1 (3 vs. 5 species-specific genes) from the WOX family, is possibly associated with the trap development [16] SOC1 (11 vs. 6 species-specific genes) from the MADS-box family, which might develop a role with phosphorus scavenging from the trapped prey [4], and ATHB51 (5 vs. 6 species-specific genes) related to the leaf morphogenesis. These findings are suggestive to a different array of target genes, and the processes that these TFs control, and in addition to the distinct number of developmental genes identified in both species, might apply in different body plan adaptations and prey strategies.
Moreover, both species display a distinct repertoire of ABC transporters that are considered essential to terrestrial life-form adaption [33]. Some ABC transporters members are exclusively found in U. reniformis. For instance, the ABCB member 9 is related to plant hormone transport, regulation of growth, and in development [65]. Additionally, the mitochondrial ABCB family member 25 was directly involved with the molybdenum cofactor biosynthesis, and nitrogen assimilation from the soil [66]. Interestingly, aquatic plants mainly rely on ammonium as their primary nitrogen source, and the molybdenum cofactor biosynthesis deficiency is commonly associated with the use of ammonium as an alternative nitrogen source in habitats with increased relative humidity [66]. This suggests that the absence of ABCB members 25 in U. gibba might be directly related to their aquatic adaptation. Finally, the ABCG member 36, exclusively found in U. reniformis, is related to the export of related defence compounds and callose deposition at the site of pathogen contact to restrict pathogen development [67,68], supporting that U. reniformis needs extra protection for cellular damage, which is a common characteristic of terrestrial plants.
It is known that carnivorous plants experience different and variable levels of nutritional stress [69], and the emergence of the carnivory-associated function in each lineage was a result of multiple evolutionary paths [31]. Interestingly, U. reniformis presents a distinct and augmented set of well-known carnivory-associated functions. Among them, alpha-galactosidase, amidase, actin filament, aspartic-type endopeptidase, beta-galactosidase, cellulase, chitinase and cysteine-type peptidase, myosin heavy chain kinase, and polygalacturonases might be related to carbon and energy cycles maintenance with cellulose and its associated polymers-decomposing activity, suggesting a potential role in the breakdown of prey polysaccharides. Moreover, the enrichment of ATPase activities might be correlated with the trap acidity and molecular transport functions, such as the release of digestive enzymes and the absorption of digested material from the preys [5,31,70].
Conversely, in addition to carnivory-associated functions, the ROS-related enzymes are also augmented in U. reniformis. For instance, catalase, superoxide dismutase, peroxidase, and glutathione transferase might contribute to cellular homeostasis and impacting the control of the high respiration rates possibly originated through the carnivory process. In addition, U. reniformis exhibits much more dispersed, tandem, and proximal duplicated genes. The emergence of tandem duplicated genes might contribute to the evolution of novel functions and adaptation. Our results provide support for an ongoing gene birth–death–innovation, occurring mainly among tandem and dispersed duplicates, impacting a number of different GO terms and KEGG enzymes, including carnivory-associated functions across both Utricularia. This process might give a fine-tuning of carnivory-associated functions in each selective environment (aquatic and terrestrial). For instance, a high diversity of bacteria, fungi, algae, and protozoa compose the ecosystem inside the Utricularia trap and act synergistically to convert complicated organic matter into a nutrients source for the plants [71]. The trap ecosystem and prey biota can significantly vary between the terrestrial and aquatic habitat. The aquatic Utricularia species usually have a prey spectra dominated by copepodids, cladocerans, ostracods, rotifers, and aquatic insect larvae, while terrestrial species can also have acari, nematodes, and other terrestrial microorganisms [56,58,69,72,73]. Moreover, the environment and the capacity to capture preys can be determined by the trap and prey size [74]. Thus, the trap size difference between the two species (U. gibba possess traps c. 0.7–1.5 mm and U. reniformis c. 1–2.5 mm long; [1]) can also be the result of selection pressure for the different adaptation to aquatic (U. gibba) and terrestrial and epiphytic life-forms. Therefore, both plants might present a distinct trap ecosystem and an enzymatic digestive repertoire to uptake nutrients, and our results supported this hypothesis at a genomic scale. However, this hypothesis warrants further functional studies for confirmation.

4. Materials and Methods

4.1. Plant Material, Genome Size Estimation, and Cytogenetic Analysis

Utricularia reniformis samples were collected in the fall of 2015 in the Serra do Mar Atlantic Forest, in the Municipality of Salesópolis, SP, Brazil, and were deposited in the Herbarium JABU at the São Paulo State University (voucher—V.F.O. de Miranda et al., 1725). The plants were grown in a jar culture before procedures. These samples were recorded in the Brazilian National System of Management of Genetic Heritage and Associated Traditional Knowledge (SisGen) under the access number #A68D114, in accordance with the Brazilian Access and Benefit Sharing (ABS) legal framework introduced by the Federal Law No. 13,123 of 2015. No permission for collecting was necessary, as the sample was not collected in protected areas and U. reniformis is not a threatened species, according to the global IUCN (The IUCN Red List of Threatened Species: http://www.iucnredlist.org) and the Brazilian List of Threatened Plant Species.
For the genome size estimation, approximately 25 mg of leaf tissue was macerated in 1 mL of cold Ebihara buffer [75] supplied with 0.025 µg mL−1 RNAse, using a scalpel blade to release the nuclei into suspension with the same mass of the internal reference standard Raphanus sativus var. Saxa (2C = 1.11 pg; [76]). The nuclei suspensions were stained by adding 25 µL of a 1 mg mL−1 solution of propidium iodide (PI, Sigma). The analysis was performed using the FACSCanto II cytometer (Becton Dickinson, San Jose, CA, USA). The histograms were obtained through the FACSDiva software based on 5000 events, and the statistical evaluation was performed using the Flowing Software 2.5.1 (http://www.flowingsoftware.com/). Three individuals were analyzed in triplicates. The quality control of samples was based on the coefficient of variation (CV) of each measurement (which should be below 5%) and the standard deviation (SD) among the 2C-values (which should be below 3%). Such limits ensure that the variations observed inside and among measurements are due to technical factors and do not represent intraspecific variation among individuals [77].
For the cytogenetic analysis, stolon tips were pre-treated in 8-hydroxyquinoline (0.002 M) for 24 h, at 10 °C, fixed in ethanol:acetic acid (3:1, v/v) for 24 h, at room temperature, and were stored at −20 °C. The fixed stolon tips were washed in distilled water and digested in a 2% (w/v) cellulase (Onozuka)/20% (v/v) pectinase (Sigma-Aldrich, St. Louis, MO, USA)/1% macerozyme (Sigma-Aldrich, St. Louis, MO, USA) solution, at 37 °C for 15 min. The meristems were squashed in a drop of 45% acetic acid, and the coverslip was later removed in liquid nitrogen. Metaphases were DAPI (1 µg·mL−1) stained and photographed with an XM10 camera coupled to a BX 53 Olympus epifluorescence microscope.

4.2. Genome and Transcriptome Sequencing

One individual was sampled, producing the three different DNA libraries used in this study. DNA was extracted using the QIAGEN DNeasy Plant Maxi Kit extraction protocol (Qiagen, Hilden, Germany) to prepare libraries for Illumina TruSeq PCR-free and Nextera XT paired-end reads, with ~350 bp (2 × 100 bp) and ~450 bp (2 × 300 bp), insert sizes, and Illumina Nextera mate-pair gel free with insert sizes ranging from 3.5 to 10 Kb (2 × 100 bp). Illumina libraries were sequenced on HiScanSQ and MiSeq machines. The paired reads (2 × 100 bp and 2 × 300 bp) adapters were removed with Trimmomatic v0.27 [78], while the mate-pair reads (2 × 100 bp) internal adapters were trimmed with the NxTrim [79]. Sequences with phred value below 24 (<Q24) and spanning less than 50 bp were removed. For transcriptome sequencing, we used samples from leaves, stolon, and utricles. The RNA extraction and sequencing was performed according with the U. reniformis previous research [26,27]. Trimmed RNAseq reads from the leaves, stolon, and utricles were concatenated, and de novo assembled using Trinity v2.7.0 [80], and were exclusively used for gene model predictions (see below).

4.3. Genome Assembly and WGD Analysis

The trimmed reads were filtered against the cpDNA (NC_029719) and mtDNA (NC_034982) organellar genomes [26,27] with bowtie2 v2.26 [81]. The assembly was carried out with MaSuRCA v3.1.3 [82], SSPACE [83], and GapCloser [84]. REAPR v1.0.18 [85] was used to generate the corrected assembly and estimate the percentage of error-free bases (additional details are provided in Supplementary Materials). CEGMA v2.5 [86] and BUSCO v3 [87] using Eudicotyledons_odb10 from the OrthoDB database [88] were used to measure the genome completeness. We used GenomeScope v1 [89], the K-mer Analysis Toolkit (KAT) [90], and KmerSpectrumPlot.pl from ALLPATHS-LG [91] to estimate genome size and heterozygosity.
The predicted WGDs events that occurred in the U. reniformis evolutionary history were predicted on the basis of the distribution of synonymous substitutions per synonymous site (Ks) of gene pairs, using the SynMap2 tool from the Comparative Genomics Platform (CoGe) [92]. MCScanX [93] was employed to identify dispersed, proximal, and tandem (small-scale duplication) and segmental duplicates (WGDs). Tandem duplicates are defined as paralogs that are adjacent to each other, and the maximum distance to call a proximal copy was set to 10 genes. The anchor genes in collinear blocks inferred segmental duplicates. Structural and comparative analyses (pairwise alignment) were carried out with D-GENIES [94]. Macrosynteny and microsynteny analyses were carried out with VGSC2 and MCscan (Python version) (https://github.com/tanghaibao/jcvi.wiki.git).

4.4. Transposable Elements Identification, Classification, and Genome Annotation

The de novo detection and classification of TEs were carried out by the REPET v2.5 [95] with the “—struct” parameter. The identified elements from the REPET package were manually validated and characterized into super-families and evolutionary lineages with the usage of the Domain-based ANnotation of Transposable Elements (DANTE) with the Viridiplantae database v3.0 [96]. The TE masking was performed with the RepeatMasker Open-v4.0.7 (http://www.repeatmasker.org) using the parameter: “-s -cutoff 260”.
The gene prediction was performed using the BRAKER v2 pipeline [97], and the TE-related genes were discarded. PASA pipeline [98] was used to produce spliced alignment assemblies based on RNA-seq data. The gene predictions and transcript alignments were combined with the EVidence Modeler software [99]. Finally, two PASA pipeline iterations were used to update the EVidence Modeler consensus predictions, adding UTR annotations and models for the alternatively spliced isoforms. Functional annotation was performed using Blast2GO v5 [100], InterProScan 5 [101], and EggNOG-mapper v1.0.3 with the EggNOG 5.0 database [102]. For the protein assignment, the UniProtKB/TrEMBL [103] viridiplantae database was used. The final predicted gene models were scanned against the DANTE and RepeatMasker predictions results, and all TE-related genes were further discarded.
For consistency in the comparative analysis, Utricularia gibba transcriptomes read from NCBI Sequence Read Archive (SRA): SRX2368915, SRX247091, and SRX038704 were assembled, and the U. gibba genome (Genbank Accession Number: NEEC01000001-NEEC01000518) was re-annotated using the same pipeline.

4.5. Phylogenetic Analysis

The phylogenetic analyses were performed using maximum likelihood (ML), and Bayesian inference (BI) approaches. For the ML, RAxML v. 8.2.10 [104] was used with default parameters, and the clade support estimates were calculated using rapid bootstrapping of 1000 pseudoreplicates. The BI was performed with Mr. Bayes v.3.2.6 [105] using MCMCMC, with random starting trees, of about 5,000,000 generations, with sampling for each 100 trees, using two runs and four chains and the trees were considered only after a stationary position was reached, with 25% of initially elaborated trees discarded. The GTR + G + I was used as the best-of-fit model according to the AIC (Akaike Information Criterion) with the jModeltest v. 2.1.10 [106].

4.6. Comparative Analysis

OrthoVenn v2 [107] was used to determine the orthologous gene families among Utricularia reniformis, U. gibba, and other angiosperms (Arabidopsis thaliana, Vitis vinifera, and Solanum lycopersicum) retrieved from the Phytozome database [108]. Functional enrichment analyses of the GO terms and the KEGG enzymes were conducted using Fisher’s exact test and was corrected for multiple testing using two methods employed by the Blast2GO (GO terms and KEGG enzymes) and GOATOOLS (GO terms) [109]. The p-values were determined after the correction for multiple tests through False Discovery Rate (FDR) control, according to the Benjamini–Hochberg. The WOX, HD-Zip, MADS-Box Transcription Factors (TFs), and ABC transporters comparative analyses were based on previous [16,33] and manual annotation using the A. thaliana reviewed entries from UniProt Database as reference [110].

4.7. Availability of Supporting Data

The raw sequencing reads have been deposited into GenBank, BioProject PRJNA290588, linked directly to the SRA under the accession numbers SRR8289569, SRR8289570, and SRR8289571 for the Illumina datasets and SRR8289572 for Ion Torrent’s RNA-Seq data. This Whole Genome Shotgun project has been stored at DDBJ/ENA/GenBank under the accession RWGZ00000000. The version described in this paper is version RWGZ01000000. The gene models and genome browser of Utricularia reniformis are available at https://genomevolution.org/coge/GenomeInfo.pl?gid=54799. The Gene Ontology annotation (Blast2GO) and all the raw data generated for this study are freely available at the Zenodo platform at http://doi.org/10.5281/zenodo.3268745.

5. Conclusions

In this work, we generated a draft genome sequence and annotation for the terrestrial carnivorous plant U. reniformis and compared it against its sister, aquatic species U. gibba. Our results demonstrated that a massive proliferation and loss of lineage-specific LTR-retrotransposons, predominantly from the Gypsy super-family and WGDs are the main governing agents of the genome size changes and evolution between these species. Interestingly, our results strongly suggest that both genomes responded distinctly after the WGD events. This is mainly observed by specific patterns of gene fractionation and retention after the lineage split, which might be reflected in an ongoing gene birth–death–innovation process among the duplicated genes. Additionally, each species carries a diversified set of plant ontogeny and carnivory-associated gene repertoire, supporting that the reproductive isolation and terrestrial and aquatic life-form constraints (e.g., different nutrients repertoire and availability, prey diversity, and trap microbiome ecosystem) in an evolutionary time scale are associated with speciation.

Supplementary Materials

Supplementary Materials can be found at https://www.mdpi.com/1422-0067/21/1/3/s1.

Author Contributions

Conceptualization, S.R.S., A.M.V., and V.F.O.M.; methodology, A.M.V., T.P.M., V.F.O.M., S.R.S., and A.P.M.; software, A.M.V., T.P.M., S.R.S., and V.F.O.M.; validation, A.M.V., T.P.M., S.R.S., and V.F.O.M.; formal analysis, A.M.V., S.R.S., A.P.M., H.A.P., M.H.M.J., D.S.D., T.P.M., and V.F.O.M.; investigation, S.R.S., T.P.M., V.F.O.M., and A.M.V.; resources, A.P.M., V.F.O.M., and A.M.V.; data curation, A.M.V., T.P.M., and V.F.O.M.; writing—original draft preparation, A.M.V., S.R.S., and V.F.O.M.; writing—review and editing, A.M.V., S.R.S., V.F.O.M., H.A.P., A.P.M., M.H.M.J., D.S.D., and T.P.M.; visualization, S.R.S., T.P.M., V.F.O.M., and A.M.V.; supervision, A.M.V., T.P.M., and V.F.O.M.; project administration, V.F.O.M. and A.M.V.; funding acquisition, V.F.O.M. and A.M.V. All authors have read and agreed to the published version of the manuscript.

Funding

This study was funded by the São Paulo Research Foundation/Brazil, FAPESP [13/25164-6] to A.M.V. V.F.O.M. was funded by FAPESP [13/05144-0]. A.P.M. was funded by National Council for the Scientific and Technological Development—CNPq [460990/2014-4] and FAPESP Young Investigator Project [11/22215-3]. S.R.S. was funded by a post-doctoral research fellowship from FAPESP [18/02285-6], and H.A.P. was funded by the PNPD fellowship from Coordenação de Aperfeiçoamento de Pessoal de Nível Superior—Brasil (CAPES)—Finance Code 001.

Acknowledgments

We thank the Microbiology and Immunology Department of IBB-UNESP/Botucatu, Brazil that kindly made available the usage of the equipment FACSCanto II cytometer for the Genome size estimation through flow cytometry. We thank the Laboratory of Plant Systematics for all support, specially Yani Aranguren Díaz for help with the DNA extractions.

Conflicts of Interest

The authors declare no conflict of interest. The funders had no role in the design of the study; in the collection, analyses, or interpretation of data; in the writing of the manuscript, or in the decision to publish the results.

References

  1. Taylor, P. The Genus Utricularia-A Taxonomic Monograph; The Royal Botanic Gardens, Kew: London, UK, 1989. [Google Scholar]
  2. Leushkin, E.V.; Sutormin, R.A.; Nabieva, E.R.; Penin, A.A.; Kondrashov, A.S.; Logacheva, M.D. The miniature genome of a carnivorous plant Genlisea aurea contains a low number of genes and short non-coding sequences. BMC Genom. 2013, 14, 476. [Google Scholar] [CrossRef] [PubMed] [Green Version]
  3. Vu, G.T.H.; Schmutzer, T.; Bull, F.; Cao, H.X.; Fuchs, J.; Tran, T.D.; Jovtchev, G.; Pistrick, K.; Stein, N.; Pecinka, A.; et al. Comparative genome analysis reveals divergent genome size evolution in a carnivorous plant genus. Plant Genome 2015, 8, 1–14. [Google Scholar] [CrossRef] [Green Version]
  4. Ibarra-Laclette, E.; Lyons, E.; Hernández-Guzmán, G.; Pérez-Torres, C.A.; Carretero-Paulet, L.; Chang, T.H.; Lan, T.; Welch, A.J.; Juárez, M.J.A.; Simpson, J.; et al. Architecture and evolution of a minute plant genome. Nature 2013, 498, 94–98. [Google Scholar] [CrossRef] [PubMed] [Green Version]
  5. Lan, T.; Renner, T.; Ibarra-Laclette, E.; Farr, K.M.; Chang, T.H.; Cervantes-Pérez, S.A.; Zheng, C.; Sankoff, D.; Tang, H.; Purbojati, R.W.; et al. Long-read sequencing uncovers the adaptive topography of a carnivorous plant genome. Proc. Natl. Acad. Sci. USA 2017, 114, E4435–E4441. [Google Scholar] [CrossRef] [PubMed] [Green Version]
  6. Hanson, L.; Mc Mahon, K.A.; Johnson, M.A.T.; Bennett, M.D. First nuclear DNA C-values for another 25 angiosperm families. Ann. Bot. 2001, 87, 251–258. [Google Scholar] [CrossRef] [Green Version]
  7. Greilhuber, J.; Borsch, T.; Müller, K.; Worberg, A.; Porembski, S.; Barthlott, W. Smallest angiosperm genomes found in Lentibulariaceae, with chromosomes of bacterial size. Plant Biol. 2006, 8, 770–777. [Google Scholar] [CrossRef] [PubMed]
  8. Veleba, A.; Bureš, P.; Adamec, L.; Šmarda, P.; Lipnerová, I.; Horová, L. Genome size and genomic GC content evolution in the miniature genome-sized family Lentibulariaceae. New Phytol. 2014, 203, 22–28. [Google Scholar] [CrossRef]
  9. Kondo, K. A Comparison of Variability in Utricularia cornuta and Utricularia juncea. Am. J. Bot. 1972, 59, 23. [Google Scholar] [CrossRef]
  10. Rahman, D.M.O.; Adamec, L.; Kondo, K. Chromosome numbers of Utricularia bremii and Utricularia dimorphantha (Lentibulariaceae). Chromosom. Sci. 2001, 5, 105–108. [Google Scholar]
  11. Casper, S.J.; Stimper, R. Chromosome numbers in Pinguicula (Lentibulariaceae): Survey, atlas, and taxonomic conclusions. Plant Syst. Evol. 2009, 277, 21–60. [Google Scholar] [CrossRef]
  12. Fleischmann, A.; Michael, T.P.; Rivadavia, F.; Sousa, A.; Wang, W.; Temsch, E.M.; Greilhuber, J.; Müller, K.F.; Heubl, G. Evolution of genome size and chromosome number in the carnivorous plant genus Genlisea (Lentibulariaceae), with a new estimate of the minimum genome size in angiosperms. Ann. Bot. 2014, 114, 1651–1663. [Google Scholar] [CrossRef] [PubMed] [Green Version]
  13. Ibarra-Laclette, E.; Albert, V.A.; Herrera-Estrella, A.; Herrera-Estrella, L. Is GC bias in the nuclear genome of the carnivorous plant Utricularia driven by ros-based mutation and biased gene conversion? Plant Signal. Behav. 2011, 6, 1631–1634. [Google Scholar] [CrossRef] [PubMed] [Green Version]
  14. Ibarra-laclette, E.; Albert, V.A.; Pérez-torres, C.A.; Zamudio-Hernández, F.; de Ortega-estrada, M.J.; Herrera-Estrella, A.; Herrera-estrella, L. Transcriptomics and molecular evolutionary rate analysis of the bladderwort (Utricularia), a carnivorous plant with a minimal genome. BMC Plant Biol. 2011, 11, 101. [Google Scholar] [CrossRef] [PubMed] [Green Version]
  15. Albert, V.A.; Jobson, R.W.; Michael, T.P.; Taylor, D.J. The carnivorous bladderwort (Utricularia, Lentibulariaceae): A system inflates. J. Exp. Bot. 2010, 61, 5–9. [Google Scholar] [CrossRef] [Green Version]
  16. Carretero-Paulet, L.; Chang, T.H.; Librado, P.; Ibarra-Laclette, E.; Herrera-Estrella, L.; Rozas, J.; Albert, V.A. Genome-wide analysis of adaptive molecular evolution in the carnivorous plant Utricularia gibba. Genome Biol. Evol. 2015, 7, 444–456. [Google Scholar] [CrossRef] [Green Version]
  17. Grover, C.E.; Wendel, J.F. Recent Insights into Mechanisms of Genome Size Change in Plants. J. Bot. 2010, 2010, 1–8. [Google Scholar] [CrossRef] [Green Version]
  18. Hakes, L.; Pinney, J.W.; Lovell, S.C.; Oliver, S.G.; Robertson, D.L. All duplicates are not equal: The difference between small-scale and genome duplication. Genome Biol. 2007, 8, R209. [Google Scholar] [CrossRef]
  19. Pellicer, J. Genome Size Diversity and Its Impact on the Evolution of Land Plants. Genes 2018, 9, 88. [Google Scholar] [CrossRef] [Green Version]
  20. Schatz, M.C.; Witkowski, J.; McCombie, W.R. Current challenges in de novo plant genome sequencing and assembly. Genome Biol. 2012, 13, 243. [Google Scholar] [CrossRef]
  21. Moriyama, Y.; Koshiba-Takeuchi, K. Significance of whole-genome duplications on the emergence of evolutionary novelties. Brief. Funct. Genom. 2018, 17, 329–338. [Google Scholar] [CrossRef]
  22. Bennetzen, J.L. Transposable element contributions to plant gene and genome evolution. Plant Mol. Biol. 2000, 42, 251–269. [Google Scholar] [CrossRef] [PubMed]
  23. Magallón, S.; Sánchez-Reyes, L.L.; Gómez-Acevedo, S.L. Thirty clues to the exceptional diversification of flowering plants. Ann. Bot. 2018, 123, 491–503. [Google Scholar] [CrossRef] [PubMed]
  24. BFG-The Brazil Flora Group Growing knowledge: An overview of Seed Plant diversity in Brazil. Rodriguésia 2015, 66, 1085–1113. [CrossRef]
  25. Clivati, D.; Gitzendanner, M.A.; Hilsdorf, A.W.S.; Araújo, W.L.; de Miranda, V.F.O. Microsatellite markers developed for Utricularia reniformis (Lentibulariaceae). Am. J. Bot. 2012, 99, 375–378. [Google Scholar] [CrossRef] [Green Version]
  26. Silva, S.R.; Alvarenga, D.O.; Aranguren, Y.; Penha, H.A.; Fernandes, C.C.; Pinheiro, D.G.; Oliveira, M.T.; Michael, T.P.; Miranda, V.F.O.; Varani, A.M. The mitochondrial genome of the terrestrial carnivorous plant Utricularia reniformis (Lentibulariaceae): Structure, comparative analysis and evolutionary landmarks. PLoS ONE 2017, 12, e0180484. [Google Scholar] [CrossRef] [Green Version]
  27. Silva, S.R.; Diaz, Y.C.A.; Penha, H.A.; Pinheiro, D.G.; Fernandes, C.C.; Miranda, V.F.O.; Michael, T.P.; Varani, A.M. The chloroplast genome of Utricularia reniformis sheds light on the evolution of the ndh gene complex of terrestrial carnivorous plants from the Lentibulariaceae family. PLoS ONE 2016, 11, e0165176. [Google Scholar] [CrossRef]
  28. Cheng, F.; Wu, J.; Cai, X.; Liang, J.; Freeling, M.; Wang, X. Gene retention, fractionation and subgenome differences in polyploid plants. Nat. Plants 2018, 4, 258. [Google Scholar] [CrossRef]
  29. Salojärvi, J.; Smolander, O.-P.; Nieminen, K.; Rajaraman, S.; Safronov, O.; Safdari, P.; Lamminmäki, A.; Immanen, J.; Lan, T.; Tanskanen, J.; et al. Genome sequencing and population genomic analyses provide insights into the adaptive landscape of silver birch. Nat. Genet. 2017, 49, 904–912. [Google Scholar] [CrossRef]
  30. Rendón-Anaya, M.; Ibarra-Laclette, E.; Méndez-Bravo, A.; Lan, T.; Zheng, C.; Carretero-Paulet, L.; Perez-Torres, C.A.; Chacón-López, A.; Hernandez-Guzmán, G.; Chang, T.-H.; et al. The avocado genome informs deep angiosperm phylogeny, highlights introgressive hybridization, and reveals pathogen-influenced gene space adaptation. Proc. Natl. Acad. Sci. USA 2019, 116, 17081–17089. [Google Scholar] [CrossRef] [Green Version]
  31. Wheeler, G.L.; Carstens, B.C. Evaluating the adaptive evolutionary convergence of carnivorous plant taxa through functional genomics. PeerJ 2018, 6, e4322. [Google Scholar] [CrossRef] [Green Version]
  32. Ravee, R.; Mohd Salleh, F.-. ’Imadi; Goh, H.H. Discovery of digestive enzymes in carnivorous plants with focus on proteases. PeerJ 2018, 6, e26940. [Google Scholar] [CrossRef] [PubMed]
  33. Hwang, J.-U.; Song, W.-Y.; Hong, D.; Ko, D.; Yamaoka, Y.; Jang, S.; Yim, S.; Lee, E.; Khare, D.; Kim, K.; et al. Plant ABC Transporters enable many unique aspects of a terrestrial plant’s lifestyle. Mol. Plant 2016, 9, 338–355. [Google Scholar] [CrossRef] [PubMed] [Green Version]
  34. Jiao, Y.; Leebens-Mack, J.H.; Ayyampalayam, S.; Bowers, J.E.; McKain, M.R.; McNeal, J.; Rolf, M.; Ruzicka, D.R.; Wafula, E.K.; Wickett, N.J.; et al. A genome triplication associated with early diversification of the core eudicots. Genome Biol. 2012, 13, R3. [Google Scholar] [CrossRef] [PubMed] [Green Version]
  35. Feldman, M.; Levy, A.A. Allopolyploidy–A shaping force in the evolution of wheat genomes. Cytogenet. Genome Res. 2005, 109, 250–258. [Google Scholar] [CrossRef]
  36. Alix, K.; Gérard, P.R.; Schwarzacher, T.; Heslop-Harrison, J.S.P. Polyploidy and interspecific hybridization: Partners for adaptation, speciation and evolution in plants. Ann. Bot. 2017, 120, 183–194. [Google Scholar] [CrossRef]
  37. Clark, J.W.; Donoghue, P.C.J. Whole-genome duplication and plant macroevolution. Trends Plant Sci. 2018, 23, 933–945. [Google Scholar] [CrossRef] [Green Version]
  38. Bertioli, D.J.; Jenkins, J.; Clevenger, J.; Dudchenko, O.; Gao, D.; Seijo, G.; Leal-Bertioli, S.C.M.; Ren, L.; Farmer, A.D.; Pandey, M.K.; et al. The genome sequence of segmental allotetraploid peanut Arachis hypogaea. Nat. Genet. 2019, 51, 877–884. [Google Scholar] [CrossRef] [Green Version]
  39. Panchy, N.; Lehti-Shiu, M.; Shiu, S.-H. Evolution of Gene Duplication in Plants. Plant Physiol. 2016, 171, 2294–2316. [Google Scholar] [CrossRef] [Green Version]
  40. Fedoroff, N. Transposons and genome evolution in plants. Proc. Natl. Acad. Sci. USA 2000, 97, 7002–7007. [Google Scholar] [CrossRef] [Green Version]
  41. Bennetzen, J.L.; Wang, H. The Contributions of Transposable Elements to the Structure, Function, and Evolution of Plant Genomes. Annu. Rev. Plant Biol. 2014, 65, 505–530. [Google Scholar] [CrossRef]
  42. Serrato-Capuchina, A.; Matute, D.R. The role of transposable elements in speciation. Genes 2018, 9, 254. [Google Scholar] [CrossRef] [PubMed] [Green Version]
  43. Dubin, M.J.; Mittelsten Scheid, O.; Becker, C. Transposons: A blessing curse. Curr. Opin. Plant Biol. 2018, 42, 23–29. [Google Scholar] [CrossRef] [PubMed]
  44. Kim, K.M.; Caetano-Anollés, G. The proteomic complexity and rise of the primordial ancestor of diversified life. BMC Evolut. Biol. 2011, 11, 140. [Google Scholar] [CrossRef] [PubMed] [Green Version]
  45. Willing, E.M.; Rawat, V.; Mandáková, T.; Maumus, F.; James, G.V.; Nordström, K.J.V.; Becker, C.; Warthmann, N.; Chica, C.; Szarzynska, B.; et al. Genome expansion of Arabis alpi. Nat. Plants 2015, 1, 1–7. [Google Scholar]
  46. Macas, J.; Neumann, P. Ogre elements-A distinct group of plant Ty3/gypsy-like retrotransposons. Gene 2007, 390, 108–116. [Google Scholar] [CrossRef]
  47. Neumann, P.; Navrátilová, A.; Koblí, A.; Kejnovský, E.; Eva, H.; Hobza, R.; Widmer, A.; Dole, J. Plant centromeric retrotransposons: A structural and cytogenetic perspective. Mob. DNA 2011, 1–16. [Google Scholar] [CrossRef] [Green Version]
  48. Jiang, N.; Bao, Z.; Temnykh, S.; Cheng, Z.; Jiang, J.; Wing, R.A.; McCouch, S.R.; Wessier, S.R. Dasheng: A recently amplified nonautonomous long terminal repeat element that is a major component of pericentromeric regions in rice. Genetics 2002, 161, 1293–1305. [Google Scholar]
  49. Kameyama, Y.; Toyama, M.; Ohara, M. Hybrid origins and F1 dominance in the free-floating, sterile bladderwort, Utricularia australis F. australis (Lentibulariaceae). Am. J. Bot. 2005, 92, 469–476. [Google Scholar] [CrossRef]
  50. Astuti, G.; Peruzzi, L. Are shoots of diagnostic value in Central European bladderworts (Utricularia L., Lentibulariaceae)? Plant Biosyst. 2018, 152, 1214–1226. [Google Scholar] [CrossRef]
  51. Clivati, D.; Cordeiro, G.D.; Płachno, B.J.; de Miranda, V.F.O. Reproductive biology and pollination of Utricularia reniformis A.St.-Hil. (Lentibulariaceae). Plant Biol. 2014, 16, 677–682. [Google Scholar] [CrossRef]
  52. Rutishauser, R.; Isler, B. Developmental genetics and morphological evolution of flowering plants, especially bladderworts (Utricularia): Fuzzy Arberian Morphology complements Classical Morphology. Ann. Bot. 2001, 88, 1173–1202. [Google Scholar] [CrossRef] [Green Version]
  53. Fineran, B.A. Glandular trichomes in Utricularia—A review of their structure and function. Isr. J. Bot. 1985, 34, 295–330. [Google Scholar]
  54. Płachno, B.J.; Adamec, L.; Kamińska, I. Relationship between trap anatomy and function in Australian carnivorous bladderworts (Utricularia) of the subgenus Polypompholyx. Aquat. Bot. 2015, 120, 290–296. [Google Scholar] [CrossRef]
  55. Płachno, B.J.; Stpiczyńska, M.; Krajewski, Ł.; Świątek, P.; Adamec, L.; Miranda, V.F.O. Flower palate structure of the aquatic bladderworts Utricularia bremii Heer and U. minor L. from section Utricularia (Lentibulariaceae). Protoplasma 2017, 254, 2007–2015. [Google Scholar] [CrossRef] [Green Version]
  56. Jobson, R.W.; Morris, E.C. Feeding ecology of a carnivorous bladderwort (Utricularia uliginosa, Lentibulariaceae). Austral Ecol. 2001, 26, 680–691. [Google Scholar] [CrossRef]
  57. Reifenrath, K.; Theisen, I.; Schnitzler, J.; Porembski, S.; Barthlott, W. Trap architecture in carnivorous Utricularia (Lentibulariaceae). Flora Morphol. Distrib. Funct. Ecol. Plants 2006, 201, 597–605. [Google Scholar] [CrossRef]
  58. Sanabria-Aranda, L.; González-Bermúdez, A.; Torres, N.N.; Guisande, C.; Manjarrés-Hernández, A.; Valoyes-Valois, V.; Díaz-Olarte, J.; Andrade-Sossa, C.; Duque, S.R. Predation by the tropical plant Utricularia foliosa. Freshw. Biol. 2006, 51, 1999–2008. [Google Scholar] [CrossRef]
  59. Rajasekar, C.; Rajendran, A. Prey composition of Utricularia striatula Sm. (Lentibulariaceae): Lithophytic carnivore Southern Western Ghats, India. Int. J. Fish. Aquat. Stud. 2018, 6, 382–388. [Google Scholar]
  60. Elhiti, M.; Stasolla, C. Structure and function of homodomain-leucine zipper (HD-Zip) proteins. Plant Signal. Behav. 2009, 4, 86. [Google Scholar] [CrossRef] [Green Version]
  61. Lian, G.; Ding, Z.; Wang, Q.; Zhang, D.; Xu, J. Origins and Evolution of WUSCHEL-Related Homeobox Protein Family in Plant Kingdom. Sci. World J. 2014, 2014, 1–12. [Google Scholar] [CrossRef] [Green Version]
  62. Messenguy, F.; Dubois, E. Role of MADS box proteins and their cofactors in combinatorial control of gene expression and cell development. Gene 2003, 316, 1–21. [Google Scholar] [CrossRef]
  63. Jack, T. Molecular and genetic mechanisms of floral control. Plant Cell 2004, 16, S1–S17. [Google Scholar] [CrossRef] [PubMed] [Green Version]
  64. Yang, J.; Ding, C.; Xu, B.; Chen, C.; Narsai, R.; Whelan, J.; Hu, Z.; Zhang, M. A Casparian strip domain-like gene, CASPL, negatively alters growth and cold tolerance. Sci. Rep. 2015, 5, 14299. [Google Scholar] [CrossRef] [PubMed] [Green Version]
  65. Cho, M.; Cho, H.-T. The function of ABCB transporters in auxin transport. Plant Signal. Behav. 2013, 8, e22990. [Google Scholar] [CrossRef] [PubMed] [Green Version]
  66. Teschner, J.; Lachmann, N.; Schulze, J.; Geisler, M.; Selbach, K.; Santamaria-Araujo, J.; Balk, J.; Mendel, R.R.; Bittner, F. A Novel Role for Arabidopsis Mitochondrial ABC Transporter ATM3 in Molybdenum Cofactor Biosynthesis. Plant Cell 2010, 22, 468–480. [Google Scholar] [CrossRef] [Green Version]
  67. Stein, D.J.; Chamberlain, S.R.; Fineberg, N. An A-B-C Model of Habit Disorders: Hair-Pulling, Skin-Picking, and Other Stereotypic Conditions. CNS Spectr. 2006, 11, 824–827. [Google Scholar] [CrossRef] [Green Version]
  68. Clay, N.K.; Adio, A.M.; Denoux, C.; Jander, G.; Ausubel, F.M. Glucosinolate metabolites required for an Arabidopsis innate immune response. Science 2009, 323, 95–101. [Google Scholar] [CrossRef] [Green Version]
  69. Juniper, B.E.; Robins, R.J.; Joel, D.M. The Carnivorous Plants; Academic Press: London, UK; San Diego, CA, USA, 1989; ISBN 978-0-12-392170-3. [Google Scholar]
  70. Brownlee, C. Carnivorous plants: Trapping, digesting and absorbing all in one. Curr. Biol. 2013, 23, R714–R716. [Google Scholar] [CrossRef] [Green Version]
  71. Sirová, D.; Bárta, J.; Šimek, K.; Posch, T.; Pech, J.; Stone, J.; Borovec, J.; Adamec, L.; Vrba, J. Hunters or farmers? Microbiome characteristics help elucidate the diet composition in an aquatic carnivorous plant. Microbiome 2018, 6, 225. [Google Scholar] [CrossRef] [Green Version]
  72. Mette, N.; Wilbert, N.; Barthlott, W. Food composition of Aquatic Bladderworts (Utricularia, Lentibulariaceae) in Various Habiats. Beiträge Biol. Pflanz. 2000, 72, 1–13. [Google Scholar]
  73. Kurbatova, S.A.; Yershov, I.Y. Crustaceans and Rotifers in the Predatory Feeding of Utricularia. Inland Water Biol. 2009, 2, 271–275. [Google Scholar] [CrossRef]
  74. Harms, S. Prey selection in three species of the carnivorous aquatic plant Utricularia (bladderwort). Arch. Hydrobiol. 1999, 146, 449–470. [Google Scholar] [CrossRef]
  75. Ebihara, A.; Ishikawa, H.; Matsumoto, S.; Lin, S.-J.; Iwatsuki, K.; Takamiya, M.; Watano, Y.; Ito, M. Nuclear DNA, chloroplast DNA, and ploidy analysis clarified biological complexity of the Vandenboschia radicans complex (Hymenophyllaceae) in Japan and adjacent areas. Am. J. Bot. 2005, 92, 1535–1547. [Google Scholar] [CrossRef] [PubMed]
  76. Doležel, J.; Sgorbati, S.; Lucretti, S. Comparison of three DNA fluorochromes for flow cytometric estimation of nuclear DNA content in plants. Physiol. Plant. 1992, 85, 625–631. [Google Scholar] [CrossRef]
  77. Pellicer, J.; Leitch, I.J. The application of flow cytometry for estimating genome size and ploidy level in plants. In Molecular Plant Taxonomy. Methods in Molecular Biology (Methods and Protocols); Bresse, P., Ed.; Humana Press: Totowa, NJ, USA, 2014; pp. 279–307. ISBN 9781627037662. [Google Scholar]
  78. Bolger, A.M.; Lohse, M.; Usadel, B. Trimmomatic: A flexible trimmer for Illumina sequence data. Bioinformatics 2014, 30, 2114–2120. [Google Scholar] [CrossRef] [Green Version]
  79. O’Connell, J.; Schulz-Trieglaff, O.; Carlson, E.; Hims, M.M.; Gormley, N.A.; Cox, A.J. NxTrim: Optimized trimming of Illumina mate pair reads. Bioinformatics 2015, 31, 2035–2037. [Google Scholar] [CrossRef] [Green Version]
  80. Grabherr, M.G.; Haas, B.J.; Yassour, M.; Levin, J.Z.; Thompson, D.A.; Amit, I.; Adiconis, X.; Fan, L.; Raychowdhury, R.; Zeng, Q.; et al. Full-length transcriptome assembly from RNA-Seq data without a reference genome. Nat. Biotechnol. 2011, 29, 644–652. [Google Scholar] [CrossRef] [Green Version]
  81. Langmead, B.; Salzberg, S.L. Fast gapped-read alignment with Bowtie 2. Nat. Methods 2012, 9, 357–359. [Google Scholar] [CrossRef] [Green Version]
  82. Zimin, A.V.; Marçais, G.; Puiu, D.; Roberts, M.; Salzberg, S.L.; Yorke, J.A. The MaSuRCA genome assembler. Bioinformatics 2013, 29, 2669–2677. [Google Scholar] [CrossRef] [Green Version]
  83. Boetzer, M.; Henkel, C.V.; Jansen, H.J.; Butler, D.; Pirovano, W. Scaffolding pre-assembled contigs using SSPACE. Bioinformatics 2011, 27, 578–579. [Google Scholar] [CrossRef] [Green Version]
  84. Luo, R.; Liu, B.; Xie, Y.; Li, Z.; Huang, W.; Yuan, J.; He, G.; Chen, Y.; Pan, Q.; Liu, Y.; et al. SOAPdenovo2: An empirically improved memory-efficient short-read de novo assembler. Gigascience 2012, 1, 18. [Google Scholar] [CrossRef] [PubMed]
  85. Hunt, M.; Kikuchi, T.; Sanders, M.; Newbold, C.; Berriman, M.; Otto, T.D. REAPR: A universal tool for genome assembly evaluation. Genome Biol. 2013, 14, R47. [Google Scholar] [CrossRef] [PubMed] [Green Version]
  86. Parra, G.; Bradnam, K.; Korf, I. CEGMA: A pipeline to accurately annotate core genes in eukaryotic genomes. Bioinformatics 2007, 23, 1061–1067. [Google Scholar] [CrossRef] [PubMed]
  87. Simão, F.A.; Waterhouse, R.M.; Ioannidis, P.; Kriventseva, E.V.; Zdobnov, E.M. BUSCO: Assessing genome assembly and annotation completeness with single-copy orthologs. Bioinformatics 2015, 31, 3210–3212. [Google Scholar] [CrossRef] [Green Version]
  88. Kriventseva, E.V.; Kuznetsov, D.; Tegenfeldt, F.; Manni, M.; Dias, R.; Simão, F.A.; Zdobnov, E.M. OrthoDB v10: Sampling the diversity of animal, plant, fungal, protist, bacterial and viral genomes for evolutionary and functional annotations of orthologs. Nucleic Acids Res. 2019, 47, D807–D811. [Google Scholar] [CrossRef] [Green Version]
  89. Vurture, G.W.; Sedlazeck, F.J.; Nattestad, M.; Underwood, C.J.; Fang, H.; Gurtowski, J.; Schatz, M.C. GenomeScope: Fast reference-free genome profiling from short reads. Bioinformatics 2017, 33, 2202–2204. [Google Scholar] [CrossRef] [Green Version]
  90. Mapleson, D.; Garcia Accinelli, G.; Kettleborough, G.; Wright, J.; Clavijo, B.J. KAT: A K-mer analysis toolkit to quality control NGS datasets and genome assemblies. Bioinformatics 2017, 33, 574–576. [Google Scholar] [CrossRef]
  91. Gnerre, S.; MacCallum, I.; Przybylski, D.; Ribeiro, F.J.; Burton, J.N.; Walker, B.J.; Sharpe, T.; Hall, G.; Shea, T.P.; Sykes, S.; et al. High-quality draft assemblies of mammalian genomes from massively parallel sequence data. Proc. Natl. Acad. Sci. USA 2011, 108, 1513–1518. [Google Scholar] [CrossRef] [Green Version]
  92. Haug-Baltzell, A.; Stephens, S.A.; Davey, S.; Scheidegger, C.E.; Lyons, E. SynMap2 and SynMap3D: Web-based whole-genome synteny browsers. Bioinformatics 2017, 33, 2197–2198. [Google Scholar] [CrossRef]
  93. Wang, Y.; Tang, H.; Debarry, J.D.; Tan, X.; Li, J.; Wang, X.; Lee, T.; Jin, H.; Marler, B.; Guo, H.; et al. MCScanX: A toolkit for detection and evolutionary analysis of gene synteny and collinearity. Nucleic Acids Res. 2012, 40, e49. [Google Scholar] [CrossRef] [Green Version]
  94. Cabanettes, F.; Klopp, C. D-GENIES: Dot plot large genomes in an interactive, efficient and simple way. PeerJ 2018, 6, e4958. [Google Scholar] [CrossRef] [PubMed]
  95. Flutre, T.; Duprat, E.; Feuillet, C.; Quesneville, H. Considering Transposable Element Diversification in De Novo Annotation Approaches. PLoS ONE 2011, 6, e16526. [Google Scholar] [CrossRef] [PubMed]
  96. Neumann, P.; Novák, P.; Ho, N. Systematic survey of plant LTR- retrotransposons elucidates phylogenetic relationships of their polyprotein domains and provides a reference for element classification. Mob. DNA 2019, 10, 1–17. [Google Scholar] [CrossRef] [PubMed]
  97. Hoff, K.; Lomsadze, A.; Borodovsky, M.; Stanke, M. Whole-Genome Annotation with BRAKER. In Gene Prediction. Methods in Molecular Biology; Kollmar, M., Ed.; Humana: New York, NY, USA, 2019; pp. 65–95. [Google Scholar]
  98. Haas, B.J.; Delcher, A.L.; Mount, S.M.; Wortman, J.R.; Smith, R.K.S., Jr.; Hannick, L.I.; Maiti, R.; Ronning, C.M.; Rusch, D.B.; Town, C.D.; et al. Improving the Arabidopsis genome annotation using maximal transcript alignment assemblies. Nucleic Acids Res. 2003, 31, 5654–5666. [Google Scholar] [CrossRef] [PubMed] [Green Version]
  99. Haas, B.J.; Salzberg, S.L.; Zhu, W.; Pertea, M.; Allen, J.E.; Orvis, J.; White, O.; Buell, C.R.; Wortman, J.R. Automated eukaryotic gene structure annotation using EVidenceModeler and the program to assemble spliced alignments. Genome Biol. 2008, 9, R7. [Google Scholar] [CrossRef] [PubMed] [Green Version]
  100. Conesa, A.; Götz, S. Blast2GO: A comprehensive suite for functional analysis in plant genomics. Int. J. Plant Genom. 2008, 2008, 619832. [Google Scholar] [CrossRef]
  101. Jones, P.; Binns, D.; Chang, H.-Y.; Fraser, M.; Li, W.; McAnulla, C.; McWilliam, H.; Maslen, J.; Mitchell, A.; Nuka, G.; et al. InterProScan 5: Genome-scale protein function classification. Bioinformatics 2014, 30, 1236–1240. [Google Scholar] [CrossRef] [Green Version]
  102. Huerta-Cepas, J.; Forslund, K.; Coelho, L.P.; Szklarczyk, D.; Jensen, L.J.; von Mering, C.; Bork, P. Fast genome-wide functional annotation through orthology massignment by eggNOG-Mapper. Mol. Biol. Evol. 2017, 34, 2115–2122. [Google Scholar] [CrossRef] [Green Version]
  103. Pundir, S.; Magrane, M.; Martin, M.J.; O’Donovan, C. Searching and navigating UniProt databases. Curr. Protoc. Bioinform. 2015, 50, 1–27. [Google Scholar] [CrossRef] [Green Version]
  104. Stamatakis, A. RAxML version 8: A tool for phylogenetic analysis and post-analysis of large phylogenies. Bioinformatics 2014, 30, 1312–1313. [Google Scholar] [CrossRef]
  105. Ronquist, F.; Teslenko, M.; Van Der Mark, P.; Ayres, D.L.; Darling, A.; Höhna, S.; Larget, B.; Liu, L.; Suchard, M.A.; Huelsenbeck, J.P. Mrbayes 3.2: Efficient bayesian phylogenetic inference and model choice across a large model space. Syst. Biol. 2012, 61, 539–542. [Google Scholar] [CrossRef] [PubMed] [Green Version]
  106. Darriba, D.; Taboada, G.L.; Doallo, R.; Posada, D. JModelTest 2: More models, new heuristics and parallel computing. Nat. Methods 2012, 9, 772. [Google Scholar] [CrossRef] [PubMed] [Green Version]
  107. Xu, L.; Dong, Z.; Fang, L.; Luo, Y.; Wei, Z.; Guo, H.; Zhang, G.; Gu, Y.Q.; Coleman-Derr, D.; Xia, Q.; et al. OrthoVenn2: A web server for whole-genome comparison and annotation of orthologous clusters across multiple species. Nucleic Acids Res. 2019, 47, W52–W58. [Google Scholar] [CrossRef] [PubMed] [Green Version]
  108. Goodstein, D.M.; Shu, S.; Howson, R.; Neupane, R.; Hayes, R.D.; Fazo, J.; Mitros, T.; Dirks, W.; Hellsten, U.; Putnam, N.; et al. Phytozome: A comparative platform for green plant genomics. Nucleic Acids Res. 2012, 40, 1178–1186. [Google Scholar] [CrossRef]
  109. Klopfenstein, D.V.; Zhang, L.; Pedersen, B.S.; Ramírez, F.; Warwick Vesztrocy, A.; Naldi, A.; Mungall, C.J.; Yunes, J.M.; Botvinnik, O.; Weigel, M.; et al. GOATOOLS: A Python library for Gene Ontology analyses. Sci. Rep. 2018, 8, 10872. [Google Scholar] [CrossRef]
  110. Consortium, T.U. UniProt: A worldwide hub of protein knowledge. Nucleic Acids Res. 2018, 47, D506–D515. [Google Scholar] [CrossRef] [Green Version]
Figure 1. Utricularia reniformis metaphases with 2n = 40. (A) Metaphase stained with DAPI. (B) Karyogram using the same metaphase presented in (A). Dots in (A) represent the distended and unstained region. The bar is equivalent to 10 µm.
Ijms 21 00003 g001
Figure 2. Genome assembly analysis: Read k-mer frequency versus Utricularia reniformis assembly copy number stacked histograms generated by the KAT comp tool. Read content in black is absent from the assembly, red occurs once, purple twice, and green occurs three times, indicating a scenario of both heterozygous and polyploidy genome. The heterozygous content is represented by the first peak at x = 40 and the homozygous content in the second peak at x = 80. The hidden content (the black peak) represents the heterozygous content that is lost when the assembly bubbles are collapsed. The genome assembly contains most (but not all) of the heterozygous content and introduces duplications on both heterozygous and homozygous content.
Ijms 21 00003 g002
Figure 3. Utricularia reniformis vs. U. gibba genome comparisons. (A) Macrosynteny karyotype visualization of U. gibba chromosome 1 (CM007989.1), 2 (CM007990.1), 3 (CM007991.1), and 4 (CM007992.1), against the corresponding U. reniformis scaffolds showing matches (generated with the MCscan tool with minspan = 10 option). (B) Dual synteny bar plot, created by the ‘dual-bar plotter’ from the MCScanX. The upper panel represents U. gibba chromosomes and scaffolds; the lower panel represents the U. reniformis scaffolds. The syntenic blocks are shown in colors. Most of the white blocks present in each U. reniformis scaffolds corresponds to exclusive regions and transposable elements. The asterisks correspond to the U. reniformis scaffolds showing no matches to U. gibba chromosomes and scaffolds.
Ijms 21 00003 g003
Figure 4. Microsynteny analysis of Utricularia reniformis against U. gibba and other eudicotyledons: (A,B) Polyploid subgenomes of U. reniformis vs. U. gibba microsynteny showing an alternative deletion of the duplicated genes. (C) Highly conserved regions of U. reniformis vs. U. gibba microsynteny. (D) Arabidopsis thaliana vs. U. reniformis, with U. gibba showing moderately conserved regions of microsynteny. (E) Vitis vinifera vs. U. reniformis, with U. gibba showing a considerable fractionation. (F) Lycopersicon esculentum vs. U. reniformis, with U. gibba showing a moderate fractionation.
Ijms 21 00003 g004
Figure 5. Overall similarity heatmap and maximum likelihood and Bayesian inference phylogenetic tree of 336 core-eukaryotic genes shared among seven carnivorous plant genomes (Utricularia reniformis, U. gibba, Genlisea aurea, G. nigrocaulis, G. pygmaea, G. repens, and G. hispidula) and Arabidopsis thaliana as an out-group. Numbers above and below the lines indicate the maximum likelihood bootstrap values and the Bayesian posterior probabilities for each clade. The G. pygmaea and G. repens genomes used in this analysis are yet to be published. However, the concatenated core nucleotide gene fasta sequence used to construct this dataset is freely available at http://doi.org/10.5281/zenodo.3268745.
Ijms 21 00003 g005
Figure 6. Transposable elements discovery in Utricularia reniformis and U. gibba genomes: Length occupied (bp) of each super-family and evolutionary lineage. A detailed distribution of each element identified is presented in Table S6. The y-axis on the left indicated the total length occupied in the megabases of each evolutionary lineage, whereas the y-axis on the right meant the % of the corresponding genome. Blue and Grey asterisk correspond to the absent evolutionary lineages in U. gibba and U. reniformis, respectively.
Ijms 21 00003 g006
Figure 7. Functional enrichment comparative analysis of tandem duplicates among Utricularia reniformis and U. gibba: The enriched GO terms and KEGG enzymes with the corrected p-value < 0.05 are presented. The color of the circle represents the statistical significance of the enriched GO terms (A) and the KEGG Enzymes (B). The size of the circles represents the number of occurrences of a GO term (A) and the KEGG Enzyme (B).
Ijms 21 00003 g007
Figure 8. (A) Distribution of ABC transporters and (B) developmental-related transcription factors among Utricularia reniformis and U. gibba. Exclusive genes are species-specific genes for which no orthologs could be found in any of the other species compared. (C) Venn diagram showing the distribution of shared orthologous gene families among U. reniformis, U. gibba, Arabidopsis thaliana, Vitis vinifera, and Lycopersicon esculentum (using an MCL inflation factor of 1.5). The values present inside the box correspond to the number of core genes of each species. The number present inside the parentheses represent the total number of species-specific genes from each species cluster.
Ijms 21 00003 g008
Table 1. DNA and RNA read produced for the Utricularia reniformis genome assembly and annotation.
TechnologyLibraryRead LengthRaw ReadsTrimmed Reads
DNAseqIllumina HiScan and MiSeqPaired-end (~350 bp)100 bp285,403,944187,288,003
Paired-end (~450 bp)300 bp49,185,07435,963,241
Mate-paired (3–9 Kb)100 bp177,044,06660,011,867
RNAseqIon ProtonSingle-end
- Leaves
- Stolon
- Utricules (preys)
~200 bp46,622,745
41,894,450
112,414,083
40,853,284
34,716,966
97,821,388
Table 2. Utricularia reniformis genome assembly status.
U. reniformis Genome
Total size of scaffolds (bp)304,550,249
Number of scaffolds1830
Number of contigs5452
Useful amount of scaffold sequences (≥25-Kb)297,419,257
% of assembled genome that is useful93.8%
Longest scaffold (bp)1,862,935
Longest contig (bp)926,419
Scaffolds longer than 1-Kb1830 (100%)
Scaffolds longer than 100-Kb688 (37.6%)
Scaffolds longer than 1 Mb47 (2.6%)
NG50 scaffold length (bp)466,988
LG50 scaffold count196
N50 contig length (bp)161,226
Percentage of assembly in scaffolded contigs91
Gaps number3677
Unknown bases (Ns) (bp)5,790,542
Average gap size (bp)/Longest gap (bp)157510,802
Table 3. Utricularia reniformis and U. gibba comparative and structural annotation.
U. reniformisU. gibba
Total number of identified genes42,58225,509
- Singletons30835120
- Dispersed duplicates26,5468831
- Proximal duplicates1679683
- Tandem duplicates2994999
- Segmental duplicates82809876
Annotation status
- Annotated genes †35,89921,283
- Genes with GOs27,75117,760
- Unknown and Hypothetical genes66834348
Total gene length (bp)79,419,96751,346,373
Total exon length (bp)44,971,96628,891,859
Total intron length (bp)29,871,20216,875,684
Longest gene (bp)84,57061,898
Longest exon (bp)73096002
Longest intron (bp)78,77453,378
Longest CDS (bp)15,20115,801
Mean gene length (bp)18722016
Mean exons per gene55
% of genome covered by genes2651
% of genome covered by CDS1538
% of genome covered by TEs-like regions5632
† high-confidence genes models (showing a potential product, GO term, and hits to UniProt viridiplantae clade).
Table 4. Carnivory-associated and reactive oxygen species (ROS) detoxification GO terms distribution. Utricularia reniformis (7200 unique genes: Singletons—3.5%, Dispersed—65.5%, Tandem and Proximal—10.5%, and Segmental—20.5%) and U. gibba (3918 unique genes: Singletons—10%, Dispersed—48%, Tandem and Proximal—6%, and Segmental—36%).
Gene Ontology TermGO CodeU. renif n# GenesU. gibba n# Genes
amidase activityGO:00040401310
actin filamentGO:00058842011
alpha-galactosidase activityGO:00045571513
alternative oxidase activityGO:000991664
ammonium transmembrane transportGO:0008519; 00724881816
aspartic-type endopeptidase activityGO:000419028994
ATP:ADP antiporter activityGO:000547199
ATPase activityGO:00168871831792
beta-galactosidase activityGO:0004565720125
catalase activityGO:00040961711
cellulase activityGO:00088106234
chitinase activityGO:00045682113
cinnamyl-alcohol dehydrogenase activityGO:00455513415
cyclic-nucleotide phosphodiesterase activityGO:000411211
cysteine-type peptidase activityGO:0008234384185
nuclease activityGO:000451819551094
fructose-bisphosphate aldolase activityGO:00043321210
glutathione transferase activityGO:00043645421
glutathione peroxidase activityGO:0004602149
hydrolase activity, acting on ester bondsGO:001678827671259
heat shock protein activityGO:0042026; 0006986; 003462012972
lipase activityGO:0016298231140
lipid transportGO:0006869170113
myosin heavy chain kinase activityGO:00169053623
peroxidase activityGO:0004601192140
peptidase activityGO:000823326501269
phosphatase activityGO:0016791287186
phospholipase activityGO:00046208043
polygalacturonase activityGO:000465010950
polygalacturonase inhibitor activityGO:009035351
protein homodimerization activityGO:0042803809525
ribonuclease activityGO:0004540390154
serine-type carboxypeptidase activityGO:00041858238
superoxide dismutase activityGO:00047841710
symplastGO:00550441060679
urease activityGO:000903921
water channel activityGO:00152504626
Table 5. Distribution of GO terms related to the biological process related to plant development, reproduction, and life-form adaptation. (U. reniformis; 11,468 unique genes: Singletons—3%, Dispersed—62%, Tandem and Proximal—10%, and Segmental—23%. U. gibba; 7071 unique genes: Singletons—11%, Dispersed—41%, Tandem and Proximal—4%, and Segmental—43%).
Gene Ontology TermGO CodeU. renif n# GenesU. gibba n# Genes
developmental process involved in reproductionGO:000300619651237
reproductionGO:000000325461600
reproductive processGO:002241422231388
multicellular organism developmentGO:000727547492773
embryo developmentGO:0009790744465
post-embryonic developmentGO:000979124471578
flower developmentGO:0009908915601
developmental maturationGO:0021700264171
developmental processGO:003250241262704
reproductive structure developmentGO:004860816851065
anatomical structure developmentGO:004885640462639
cellular developmental processGO:00488691352880
reproductive shoot system developmentGO:0090567655437
pollinationGO:0009856343210
tropismGO:0009606215129
circadian rhythmGO:0007623261161
response to stressGO:000695045132869
response to radiation and light stimulusGO:0009314, GO:00094161012711
response to external stimulusGO:000960521081352
response to biotic stimulusGO:00096071526981
response to abiotic stimulusGO:000962831612041
response to endogenous stimulusGO:000971926651693
response to chemicalGO:004222145902984
response to stimulusGO:005089665794277

