Comparative Proteomic Analysis Reveals the Regulatory Effects of H2S on Salt Tolerance of Mangrove Plant Kandelia obovata


Abstract
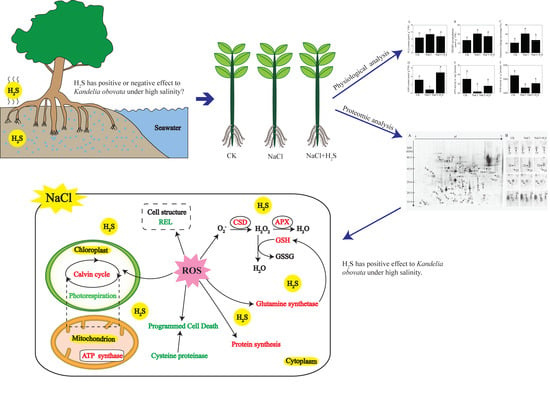
1. Introduction
2. Results
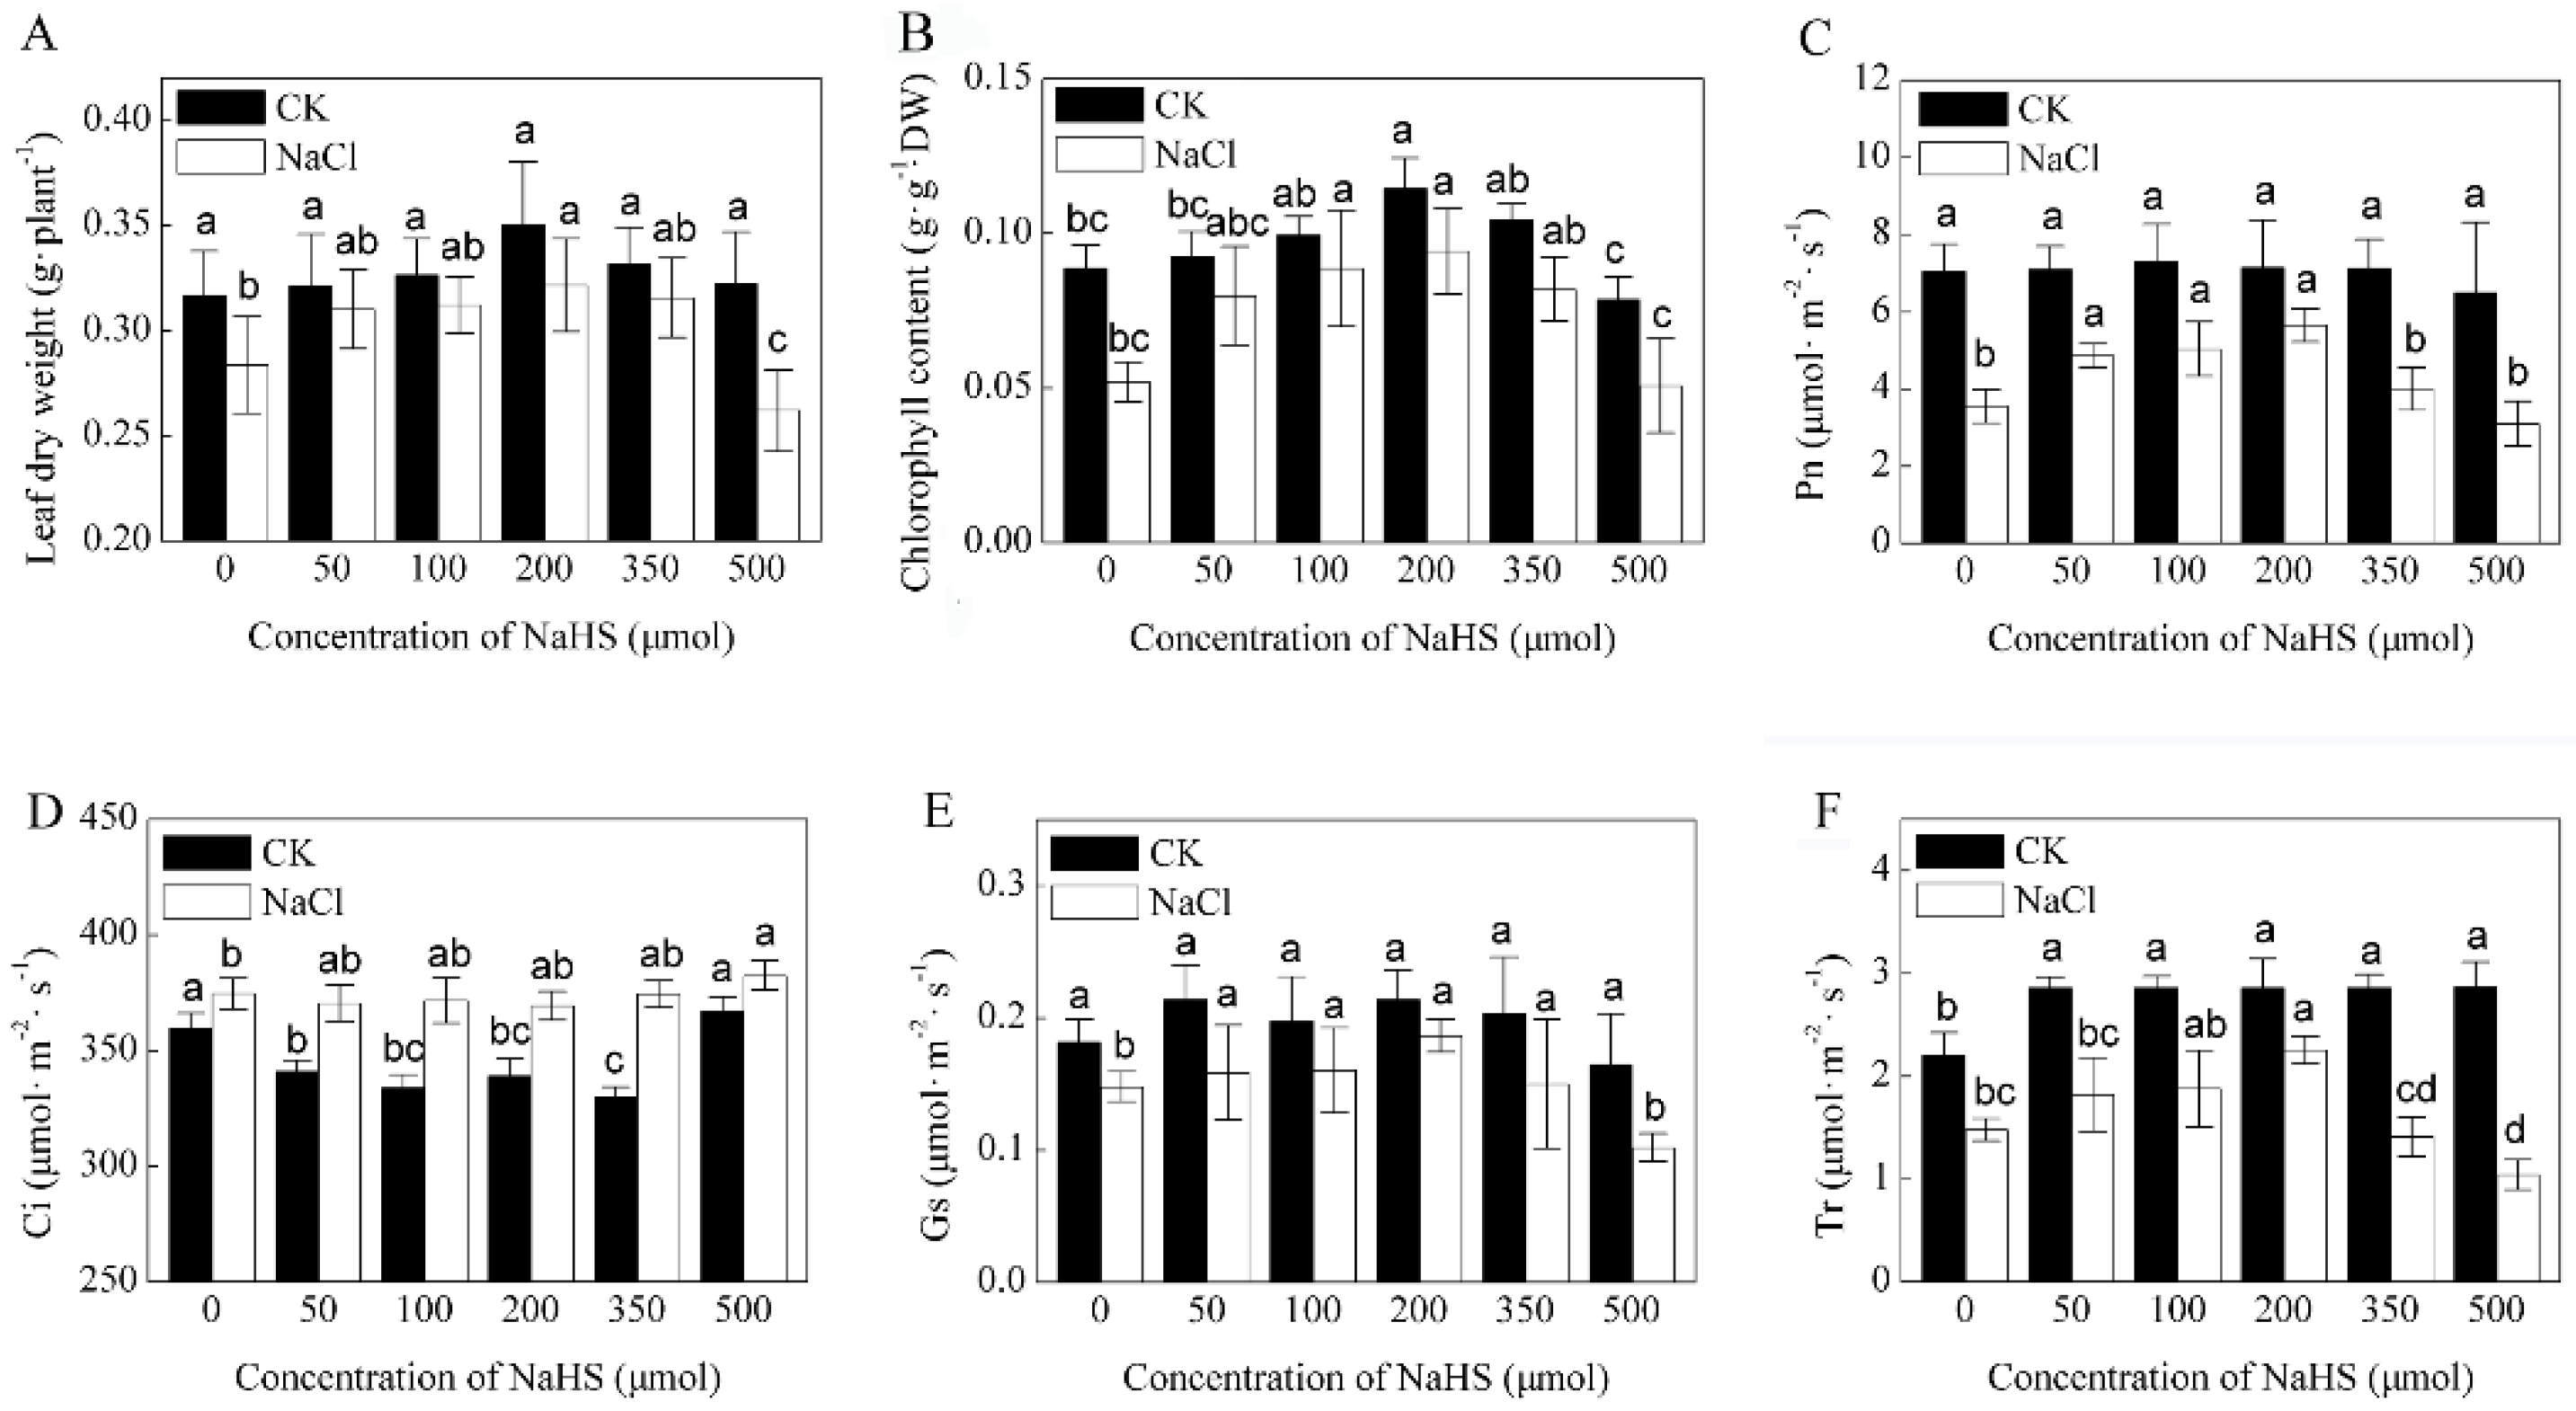
2.1. Effects of H2S and NaCl on Growth and Photosynthesis of K. Obovata Seedlings
2.2. H2S Rather than other Derivatives from Nahs Alleviates NaCl-Induced Reduction in Chlorophyll Content
2.3. Effects of H2S and NaCl on the Characteristics of Chlorophyll Fluorescence
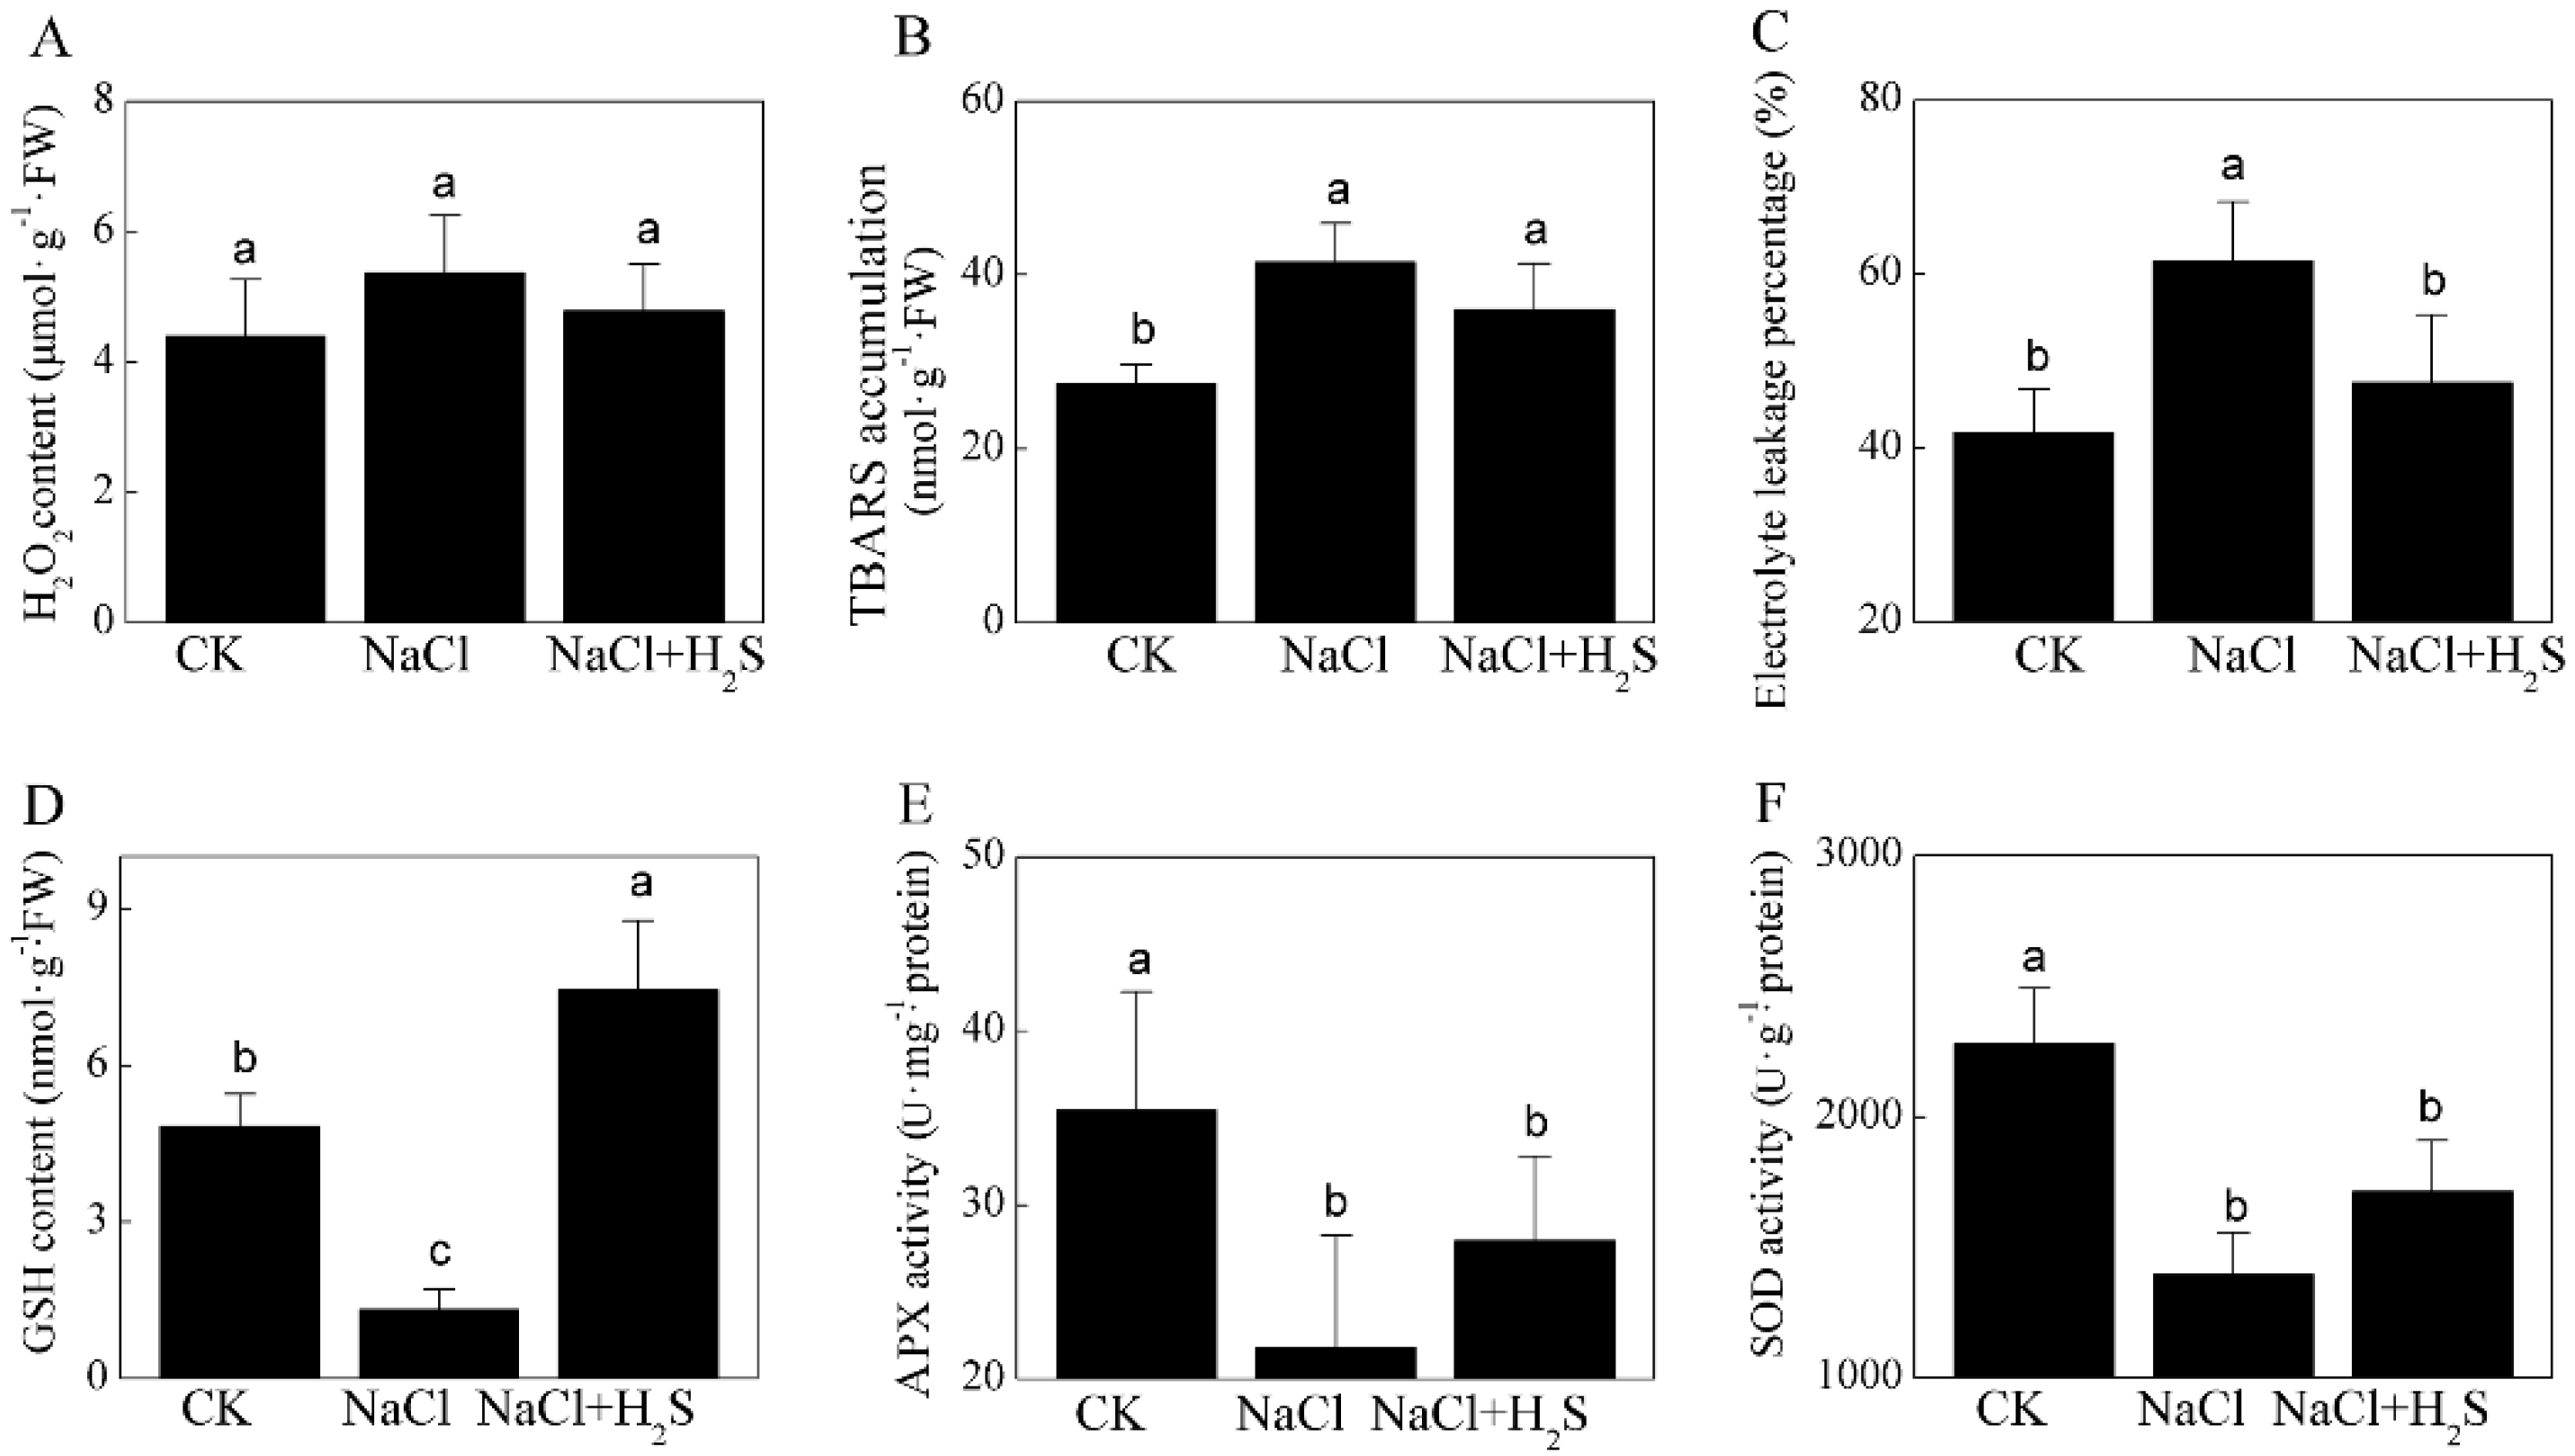
2.4. Effects of H2S and NaCl on Oxidative Stress and Activity of the Antioxidant System
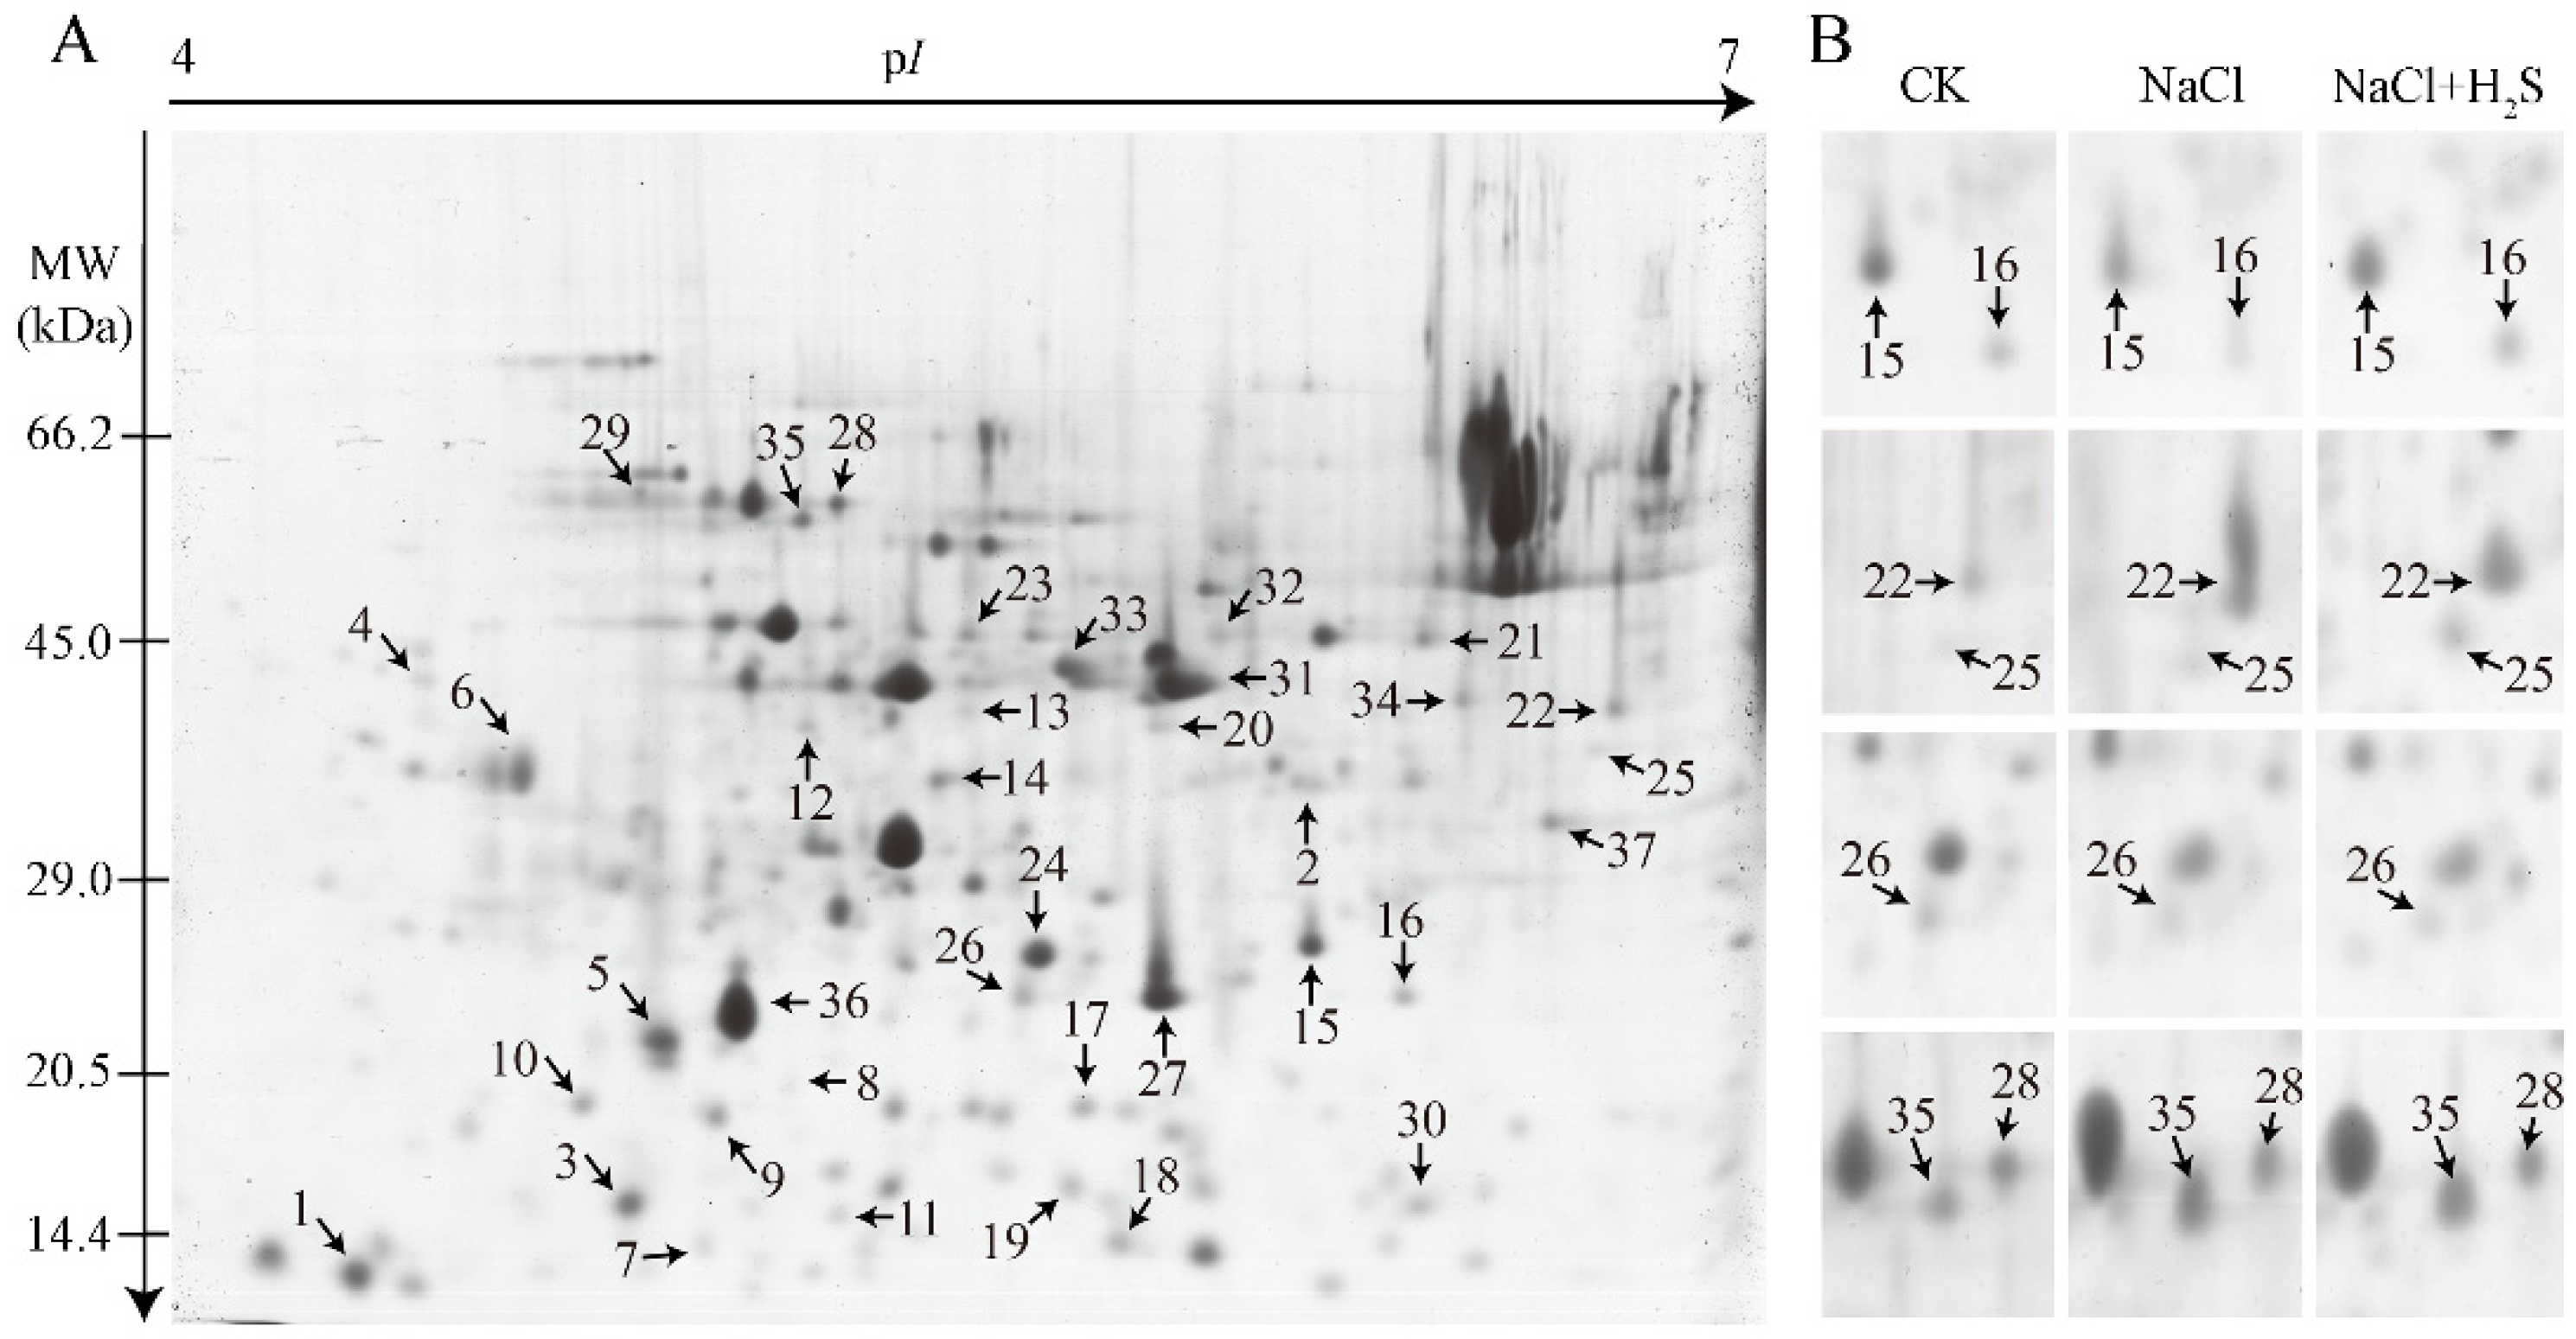
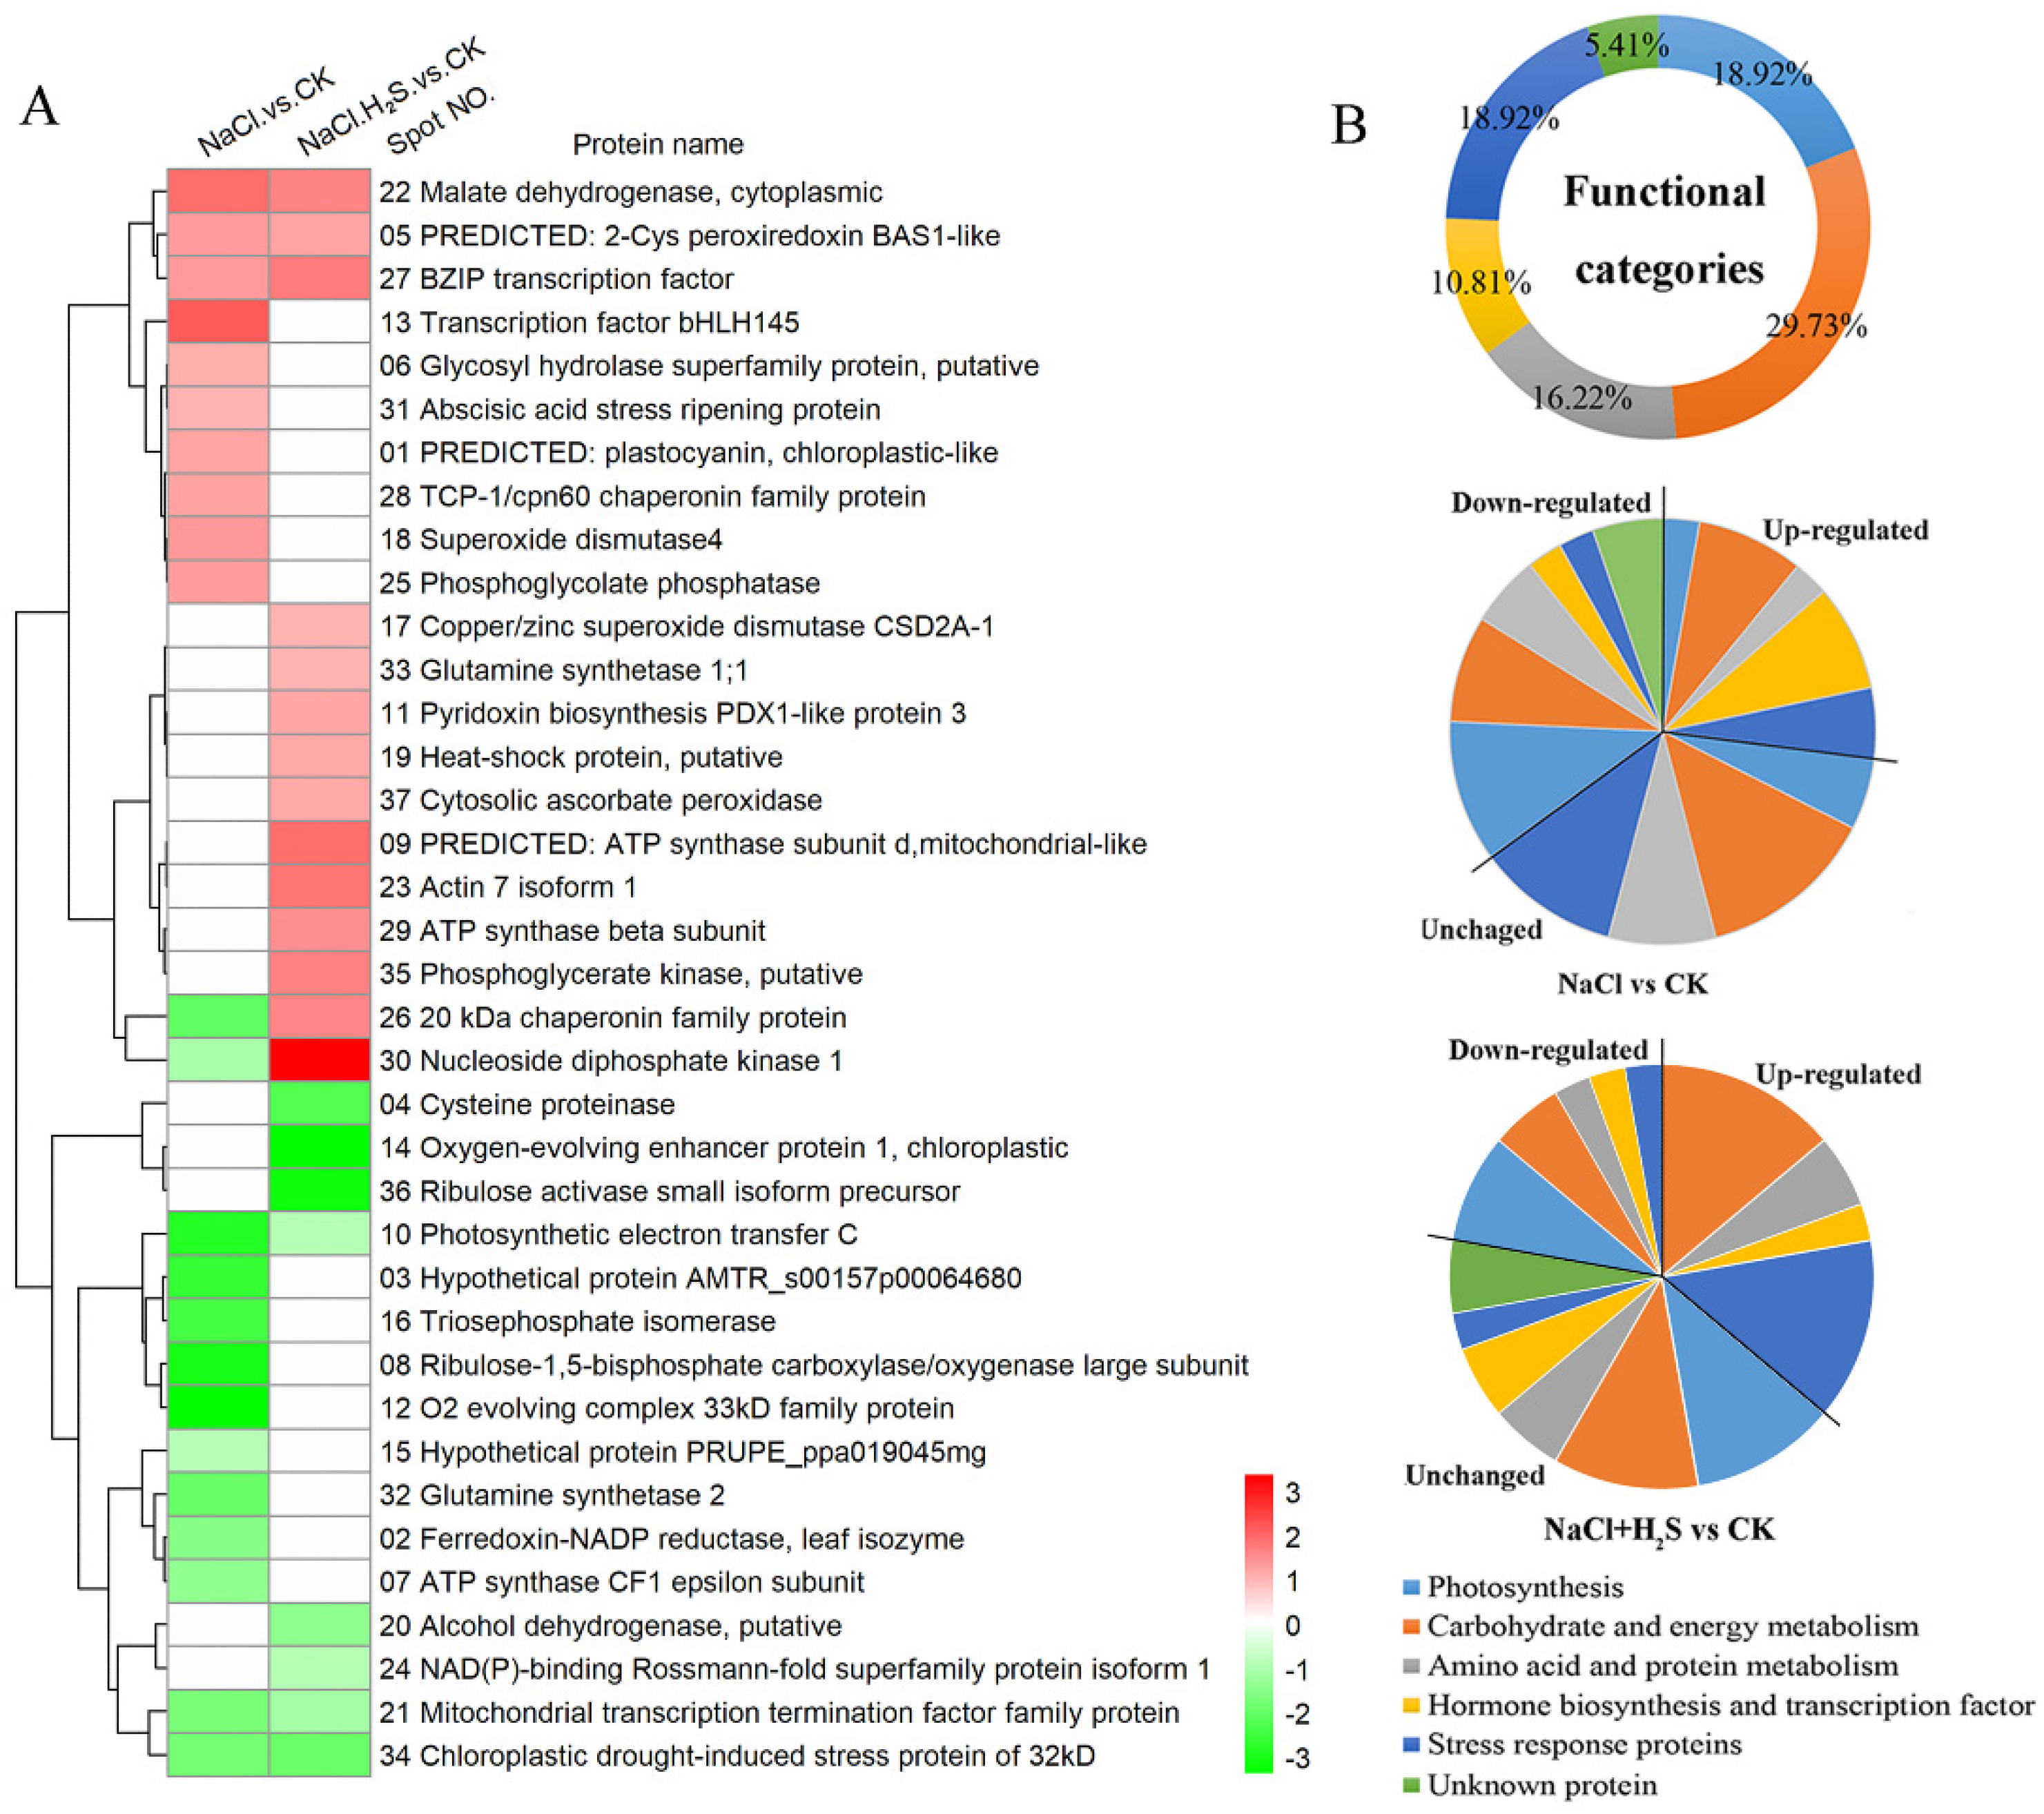
2.5. Identification and Classification of DEPs
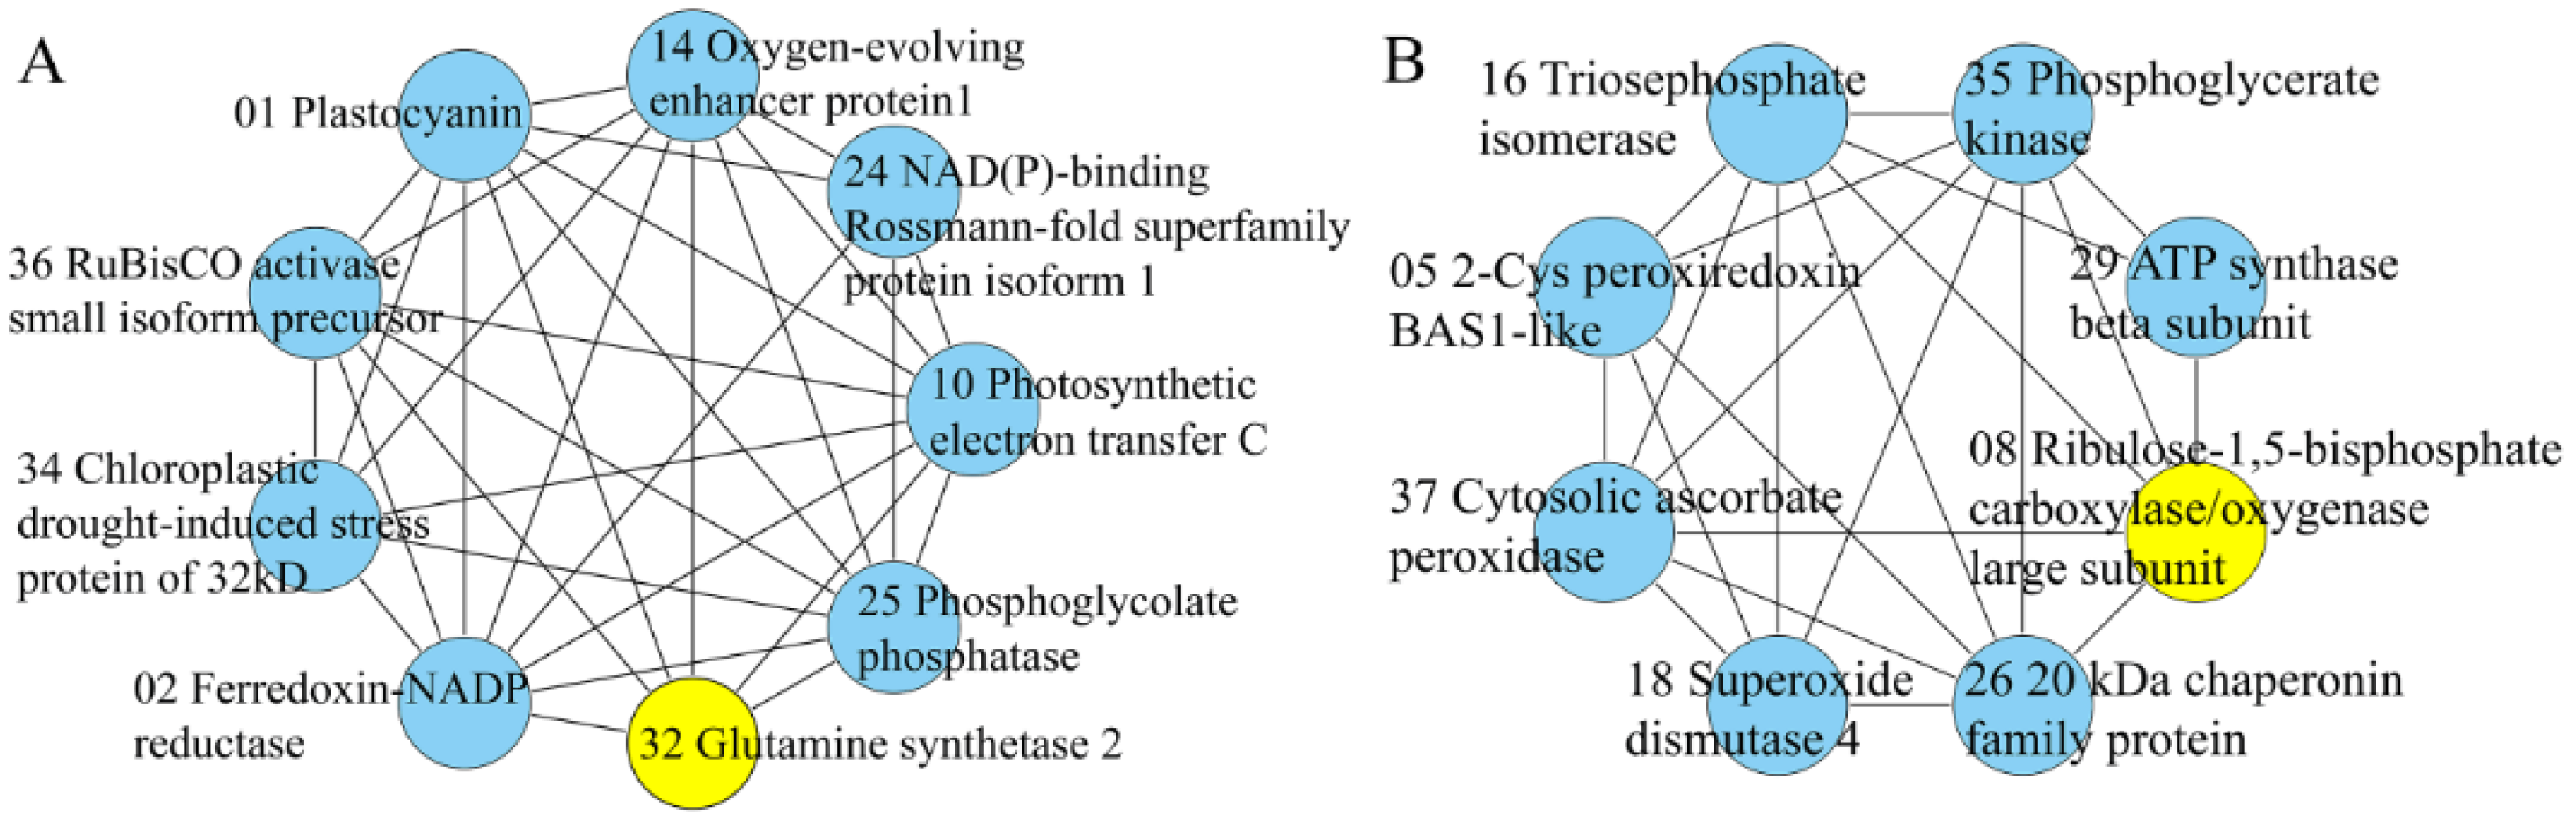
2.6. STRING Interaction Networks among DEPs
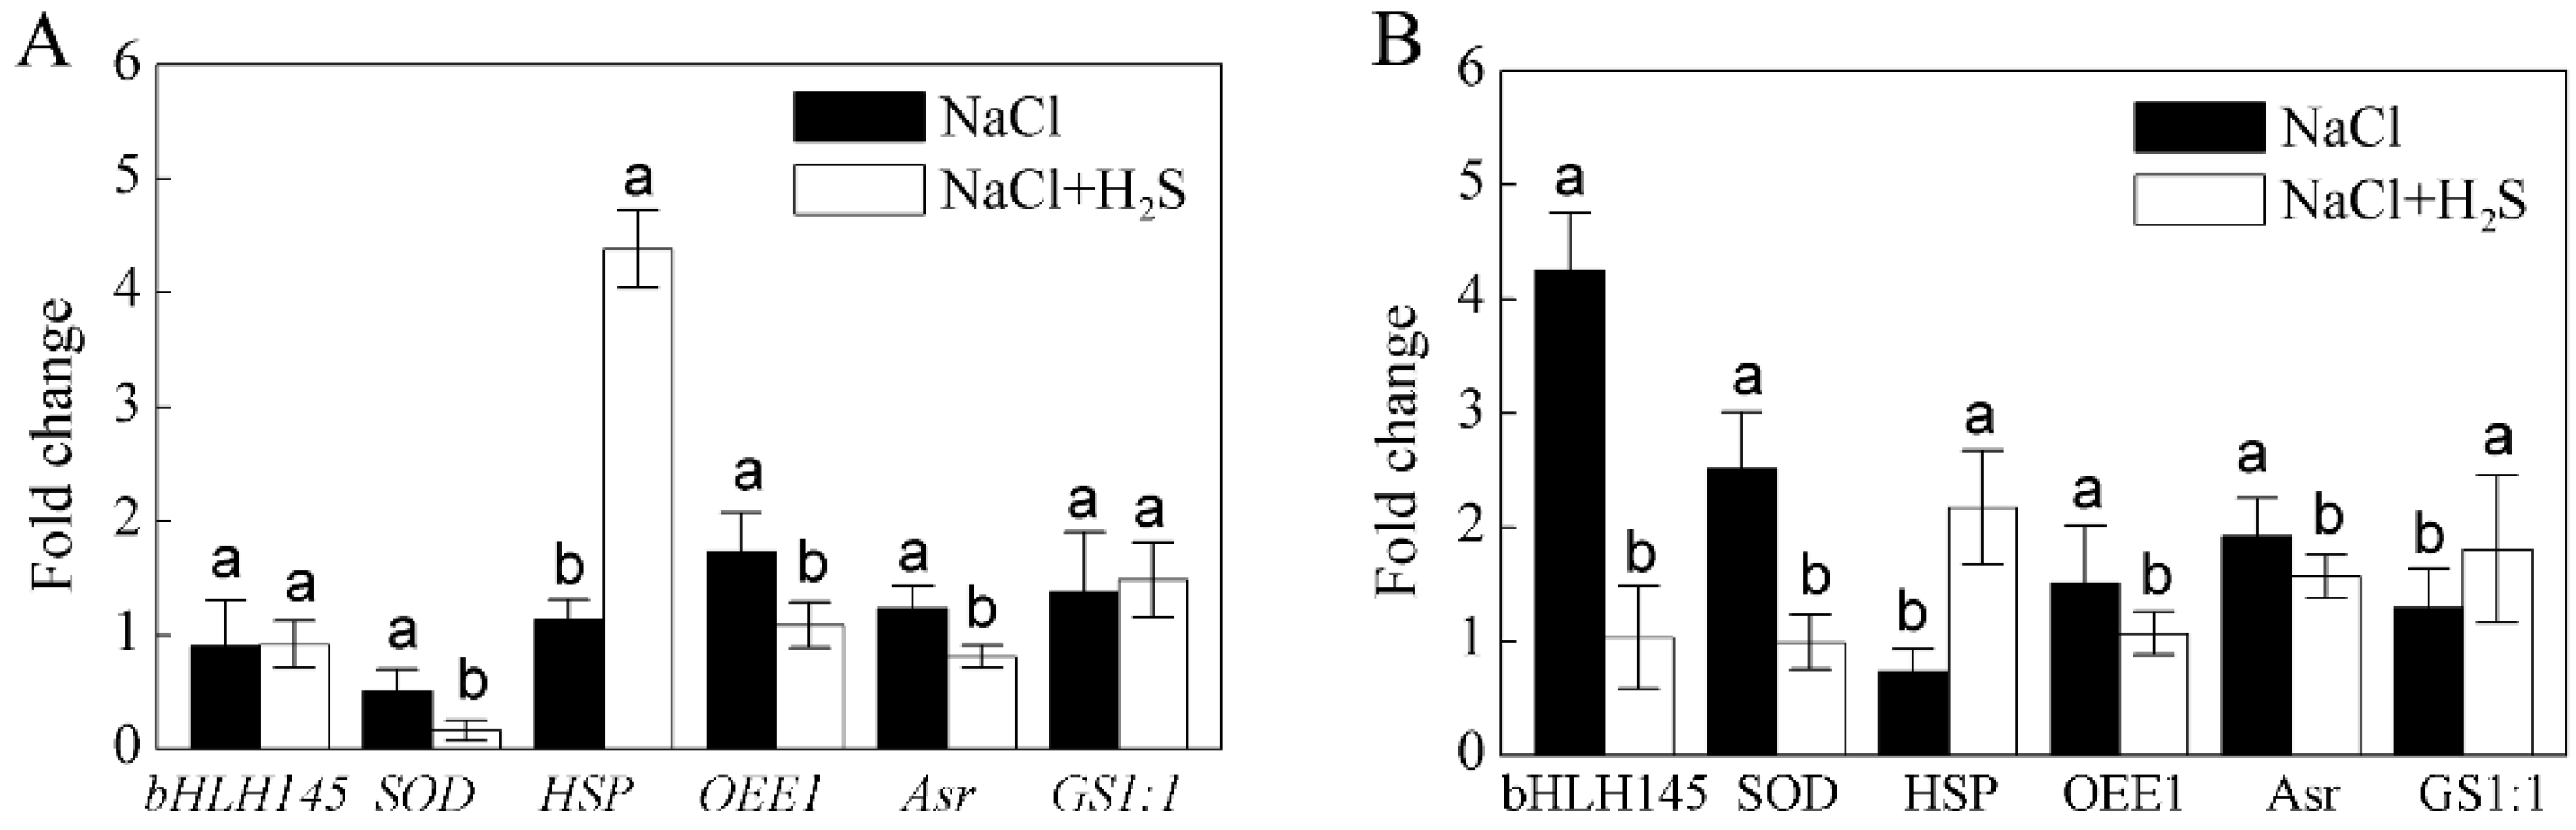
2.7. Comparisons of Expression Patterns between Protein and Transcript of Selected DEPs
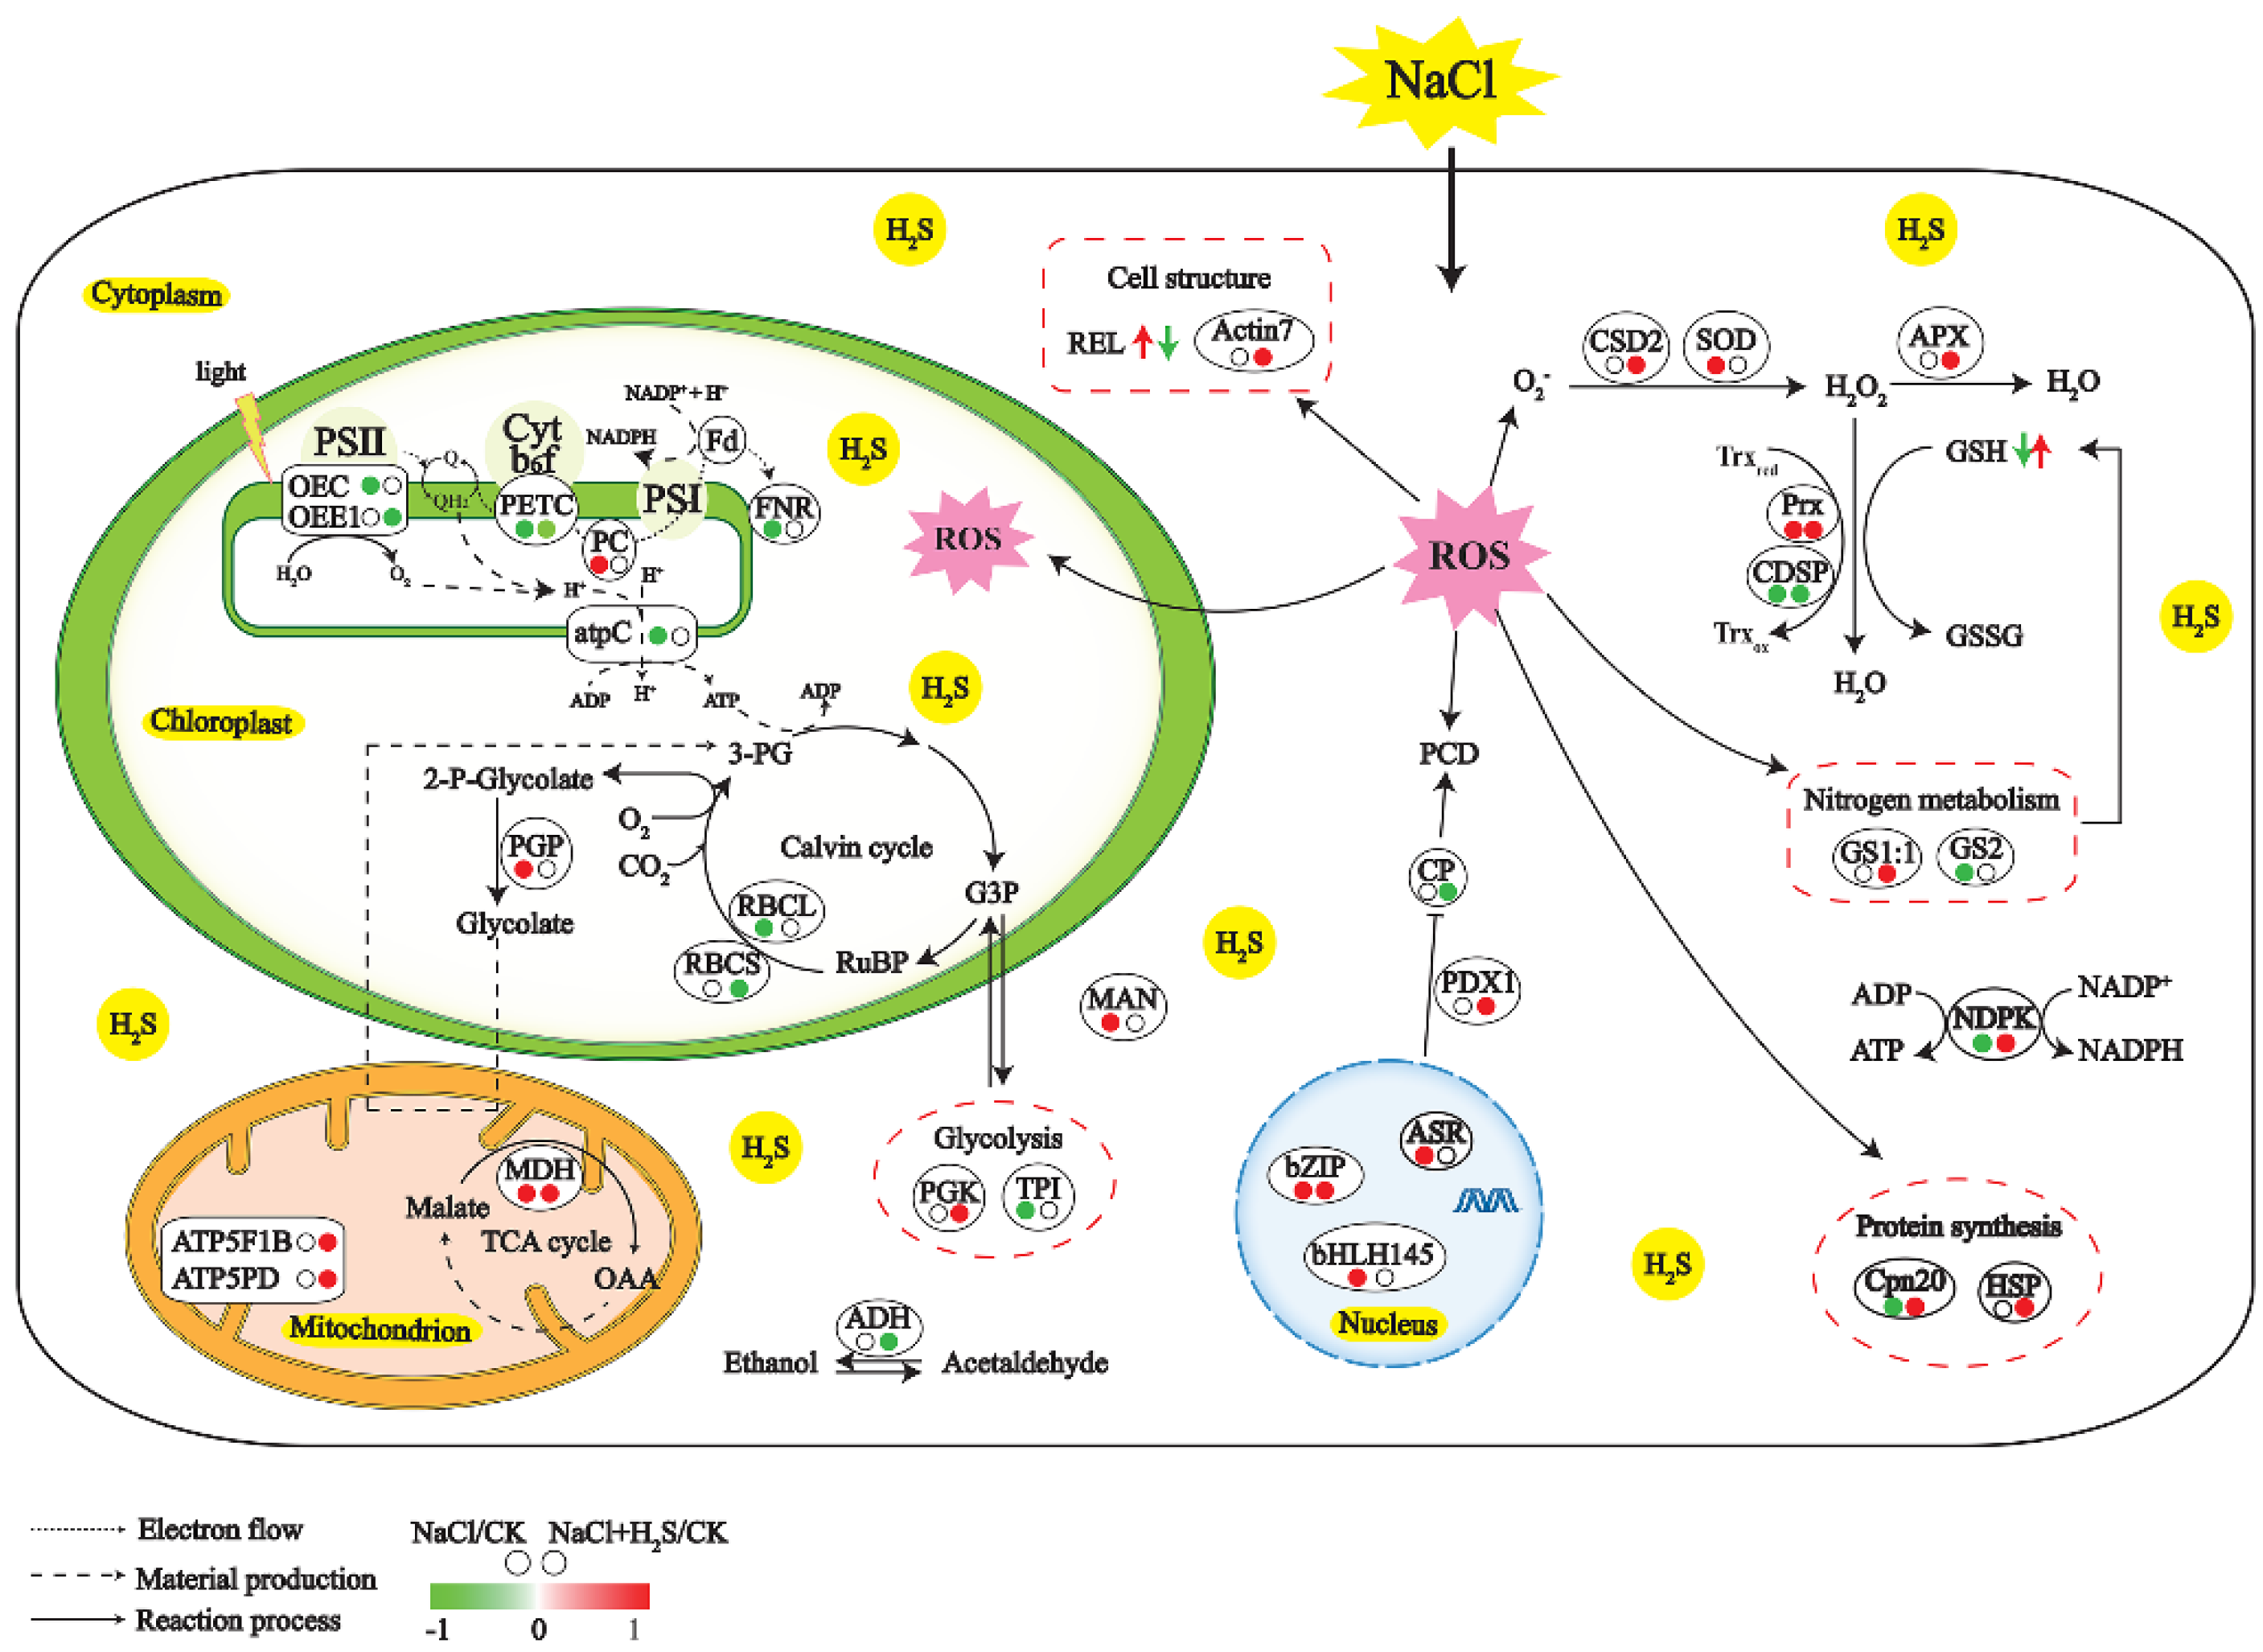
3. Discussion
3.1. H2S but Not Other NaHS Derivatives Contributes to Chlorophyll Content Recovery Decreased by NaCl Treatment
3.2. Exogenous H2S Alleviates Growth and Photosynthesis Inhibition Induced by NaCl in K. obovata Seedlings
3.3. H2S Rescues the Primary Metabolism Altered by NaCl
3.4. H2S Relieves Oxidative Stress Induced by NaCl
3.5. H2S Regulates Hormone Biosynthesis and Transcription Factor
3.6. Protein–Protein Interaction Networks Analysis
4. Materials and Methods
4.1. Plant Growth and Treatment
4.2. Measurements of Leaf Photosynthetic Pigment, Photosynthetic Rate and Chlorophyll Fluorescence Quenching
4.3. Determination of Dry Weight and the Content of Endogenous H2S
4.4. Measurements of Oxidative Stress and Antioxidant System Activity
4.5. Protein Extraction from K. Obovata Leaves and 2-DE PAGE and Image/Data Analysis
4.6. In-Gel Digestion, Identification and Classification of Differentially Expressed Proteins
4.7. Quantitative Real-Time PCR Analysis
4.8. Statistical Analysis
5. Conclusions
Supplementary Materials
Author Contributions
Funding
Conflicts of Interest
References
- Parida, A.K.; Jha, B. Salt tolerance mechanisms in mangroves: A review. Trees-Struct. Funct. 2010, 24, 199–217. [Google Scholar]
- Jayatissa, L.P.; Wickramasinghe, W.; Dahdouh-Guebas, F.; Huxham, M. Interspecific variations in responses of mangrove seedlings to two contrasting salinities. Int. Rev. Hydrobiol. 2008, 93, 700–710. [Google Scholar] [CrossRef]
- Yang, S.C.; Shih, S.S.; Hwang, G.W.; Adams, J.B.; Lee, H.Y.; Chen, C.P. The salinity gradient influences on the inundation tolerance thresholds of mangrove forests. Ecol. Eng. 2013, 51, 59–65. [Google Scholar] [CrossRef]
- Li, N.; Chen, S.L.; Zhou, X.Y.; Li, C.Y.; Shao, J.; Wang, R.G.; Fritz, E.; Hüttermann, A.; Polle, A. Effect of NaCl on photosynthesis, salt accumulation and ion compartmentation in two mangrove species, Kandelia candel and Bruguiera gymnorhiza. Aquat. Bot. 2008, 88, 303–310. [Google Scholar] [CrossRef]
- Watson, E.B.; Szura, K.; Wigand, C.; Raposa, K.B.; Blount, K.; Cencer, M. Sea level rise, drought and the decline of Spartina patens in New England marshes. Biol. Conserv. 2016, 196, 173–181. [Google Scholar] [CrossRef]
- Luo, M.; Huang, J.F.; Zhu, W.F.; Tong, C. Impacts of increasing salinity and inundation on rates and pathways of organic carbon mineralization in tidal wetlands: A review. Hydrobiologia 2019, 827, 31–49. [Google Scholar] [CrossRef]
- Ganguly, D.; Ray, R.; Majumdar, N.; Chowdhury, C.; Jana, T.K. Biogenic hydrogen sulphide emissions and non-sea sulfate aerosols over the Indian Sundarban mangrove forest. J. Atmos. Chem. 2018, 75, 319–333. [Google Scholar]
- Lyimo, T.J.; Pol, A.; den Camp, H.J.O. Sulfate reduction and methanogenesis in sediments of Mtoni mangrove forest, Tanzania. Ambio 2002, 31, 614–617. [Google Scholar] [CrossRef]
- Hou, Z.H.; Liu, J.; Hou, L.X.; Li, X.D.; Liu, X. H2S may function downstream of H2O2 in jasmonic acid-induced stomatal closure in Vicia faba. Chin. Bull. Bot. 2011, 46, 396–406. [Google Scholar]
- Li, Z.G.; Gong, M.; Xie, H.; Yang, L.; Li, J. Hydrogen sulfide donor sodium hydrosulfide-induced heat tolerance in tobacco (Nicotiana tabacum L.) suspension cultured cells and involvement of Ca2+ and calmodulin. Plant Sci. 2012, 185, 185–189. [Google Scholar] [CrossRef]
- Yarsi, G.; Sivaci, A.; Dasgan, H.Y.; Altuntas, O.; Binzet, R.; Akhoundnejad, Y. Effects of salinity stress on chlorophyll and carotenoid contents and stomata size of grafted and ungrafted galia C8 melon cultivar. Pak. J. Bot. 2017, 49, 421–426. [Google Scholar]
- Yu, L.X.; Zhang, C.J.; Shang, H.Q.; Wang, X.F.; Min, W.E.I.; Yang, F.J.; Shi, Q.H. Exogenous hydrogen sulfide enhanced antioxidant capacity, amylase activities and salt tolerance of cucumber hypocotyls and radicles. J. Integr. Agric. 2013, 12, 445–456. [Google Scholar] [CrossRef]
- Sun, Y.D.; Luo, W.R. Effects of exogenous hydrogen sulphide on seed germination and seedling growth of cucumber (Cucumis sativus) under sodium bicarbonate stress. Seed Sci. Technol. 2014, 42, 126–131. [Google Scholar] [CrossRef]
- Christou, A.; Manganaris, G.A.; Papadopoulos, I.; Fotopoulos, V. Hydrogen sulfide induces systemic tolerance to salinity and non-ionic osmotic stress in strawberry plants through modification of reactive species biosynthesis and transcriptional regulation of multiple defence pathways. J. Exp. Bot. 2013, 64, 1953–1966. [Google Scholar] [CrossRef]
- Mostofa, M.G.; Saegusa, D.; Fujita, M.; Tran, L.S.P. Hydrogen sulfide regulates salt tolerance in rice by maintaining Na+/K+ balance, mineral homeostasis and oxidative metabolism under excessive salt stress. Front. Plant Sci. 2015, 6, 1055. [Google Scholar] [CrossRef]
- Koch, M.S.; Mendelssohn, I.A.; Mckee, K.L. Mechanism for the hydrogen sulfide-induced growth limitation in wetland macrophytes. Limnol. Oceanogr. 1990, 35, 399–408. [Google Scholar] [CrossRef]
- Krishnamurthy, P.; Tan, X.F.; Lim, T.K.; Lim, T.M.; Kumar, P.P.; Loh, C.S.; Lin, Q. Proteomic analysis of plasma membrane and tonoplast from the leaves of mangrove plant Avicennia officinalis. Proteomics 2014, 14, 2545–2557. [Google Scholar] [CrossRef]
- Maxwell, K.; Johnson, G.N. Chlorophyll fluorescence-a practical guide. J. Exp. Bot. 2000, 51, 659–668. [Google Scholar] [CrossRef]
- Hosoki, R.; Matsuki, N.; Kimura, H. The possible role of hydrogen sulfide as an endogenous smooth muscle relaxant in synergy with nitric oxide. Biochem. Biophys. Res. Co. 1997, 237, 527–531. [Google Scholar] [CrossRef]
- Chen, J.; Wu, F.H.; Wang, W.H.; Zheng, C.J.; Lin, G.H.; Dong, X.J.; He, J.X.; Pei, Z.M.; Zheng, H.L. Hydrogen sulphide enhances photosynthesis through promoting chloroplast biogenesis, photosynthetic enzyme expression, and thiol redox modification in Spinacia oleracea seedlings. J. Exp. Bot. 2011, 62, 4481–4493. [Google Scholar] [CrossRef]
- Flexas, J.; Medrano, H. Drought-inhibition of photosynthesis in C3 plants: Stomatal and non-stomatal limitations revisited. Ann. Bot-London 2002, 89, 183–189. [Google Scholar] [CrossRef] [PubMed]
- Mulo, P.; Medina, M. Interaction and electron transfer between ferredoxin-NADP+ oxidoreductase and its partners: Structural, functional, and physiological implications. Photosynth. Res. 2017, 134, 265–280. [Google Scholar] [CrossRef] [PubMed]
- Sugihara, K.; Hanagata, N.; Dubinsky, Z.; Baba, S.; Karube, I. Molecular characterization of cDNA encoding oxygen evolving enhancer protein 1 increased by salt treatment in the mangrove Bruguiera gymnorrhiza. Plant Cell Physiol. 2000, 41, 1279–1285. [Google Scholar] [CrossRef] [PubMed]
- Sanda, S.; Yoshida, K.; Kuwano, M.; Kawamura, T.; Munekage, Y.N.; Akashi, K.; Yokota, A. Responses of the photosynthetic electron transport system to excess light energy caused by water deficit in wild watermelon. Physiol. Plant 2011, 142, 247–264. [Google Scholar] [CrossRef] [PubMed]
- Wang, L.; Pan, D.Z.; Li, J.; Tan, F.; Hoffmann-Benning, S.; Liang, W.; Chen, W. Proteomic analysis of changes in the Kandelia candel chloroplast proteins reveals pathways associated with salt tolerance. Plant Sci. 2015, 231, 159–172. [Google Scholar] [CrossRef] [PubMed]
- Wang, D.; Lu, Q.; Li, X.F.; Jiang, Q.S.; Wu, J.X.; Jiang, D.A. Relationship between Rubisco activase isoform levels and photosynthetic rate in different leaf positions of rice plant. Photosynthetica 2009, 47, 621–629. [Google Scholar] [CrossRef]
- Bauwe, H.; Hagemann, M.; Kern, R.; Timm, S. Photorespiration has a dual origin and manifold links to central metabolism. Curr. Opin. Plant Biol. 2012, 15, 269–275. [Google Scholar] [CrossRef]
- Wingler, A.; Lea, P.J.; Quick, W.P.; Leegood, R.C. Photorespiration: Metabolic pathways and their role in stress protection. Philos. Trans. R. Soc. London Ser. B 2000, 355, 1517–1529. [Google Scholar] [CrossRef]
- Matuszyńska, A.; Saadat, N.P.; Ebenhoeh, O. Balancing energy supply during photosynthesis–a theoretical perspective. Physiol. Plant 2019, 166, 392–402. [Google Scholar] [CrossRef]
- Zhao, Q.; Suo, J.W.; Chen, S.X.; Jin, Y.D.; Ma, X.L.; Yin, Z.P.; Zhang, Y.H.; Wang, T.; Luo, J.; Jin, W.H.; et al. Na2CO3–responsive mechanisms in halophyte Puccinellia tenuiflora roots revealed by physiological and proteomic analyses. Sci. Rep. 2016, 6, 32717. [Google Scholar] [CrossRef]
- Schultz, C.J.; Hsu, M.; Miesak, B.; Coruzzi, G.M. Arabidopsis mutants: Define an in vivo role for isoenzymes of aspartate aminotransferase in plant nitrogen assimilation. Genetics 1998, 149, 491–499. [Google Scholar] [PubMed]
- Lea, P.J.; Miflin, B.J. Glutamate synthase and the synthesis of glutamate in plants. Plant Physiol. Bioch. 2003, 41, 555–564. [Google Scholar] [CrossRef]
- Sarry, J.E.; Kuhn, L.; Ducruix, C.; Lafaye, A.; Junot, C.; Hugouvieux, V.; Jourdain, A.; Bastien, O.; Fievet, J.B.; Vailhen, D.; et al. The early responses of Arabidopsis thaliana cells to cadmium exposure explored by protein and metabolite profiling analyses. Proteomics 2006, 6, 2180–2198. [Google Scholar] [CrossRef] [PubMed]
- Semane, B.; Dupae, J.; Cuyper, A.; Noben, J.P.; Tuomainen, M.; Tervahauta, A.; Kärenlampi, S.; Van Belleghem, F.; Smeets, K.; Vangronsveld, J. Leaf proteome responses of Arabidopsis thaliana exposed to mild cadmium stress. J. Plant Physiol. 2010, 167, 247–254. [Google Scholar] [CrossRef]
- Omar, S.A.; Fu, Q.T.; Chen, M.S.; Wang, G.J.; Song, S.Q.; Elsheery, N.I.; Xu, Z.F. Identification and expression analysis of two small heat shock protein cDNAs from developing seeds of biodiesel feedstock plant Jatropha curcas. Plant Sci. 2011, 181, 632–637. [Google Scholar] [CrossRef]
- Yasuda, R.; Noji, H.; Yoshida, M.; Kinosita, J.K.; Itoh, H. Resolution of distinct rotational substeps by submillisecond kinetic analysis of F-1-ATPase. Nature 2001, 410, 898–904. [Google Scholar] [CrossRef]
- Houštěk, J.; Pícková, A.; Vojtíšková, A.; Mráček, T.; Pecina, P.; Ješina, P. Mitochondrial diseases and genetic defects of ATP synthase. BBA-Bioenergetics 2006, 1757, 1400–1405. [Google Scholar] [CrossRef]
- Bertini, L.; Palazzi, L.; Proietti, S.; Arrigoni, G.; Polverino de Laureto, P.; Caruso, C. Proteomic Analysis of MeJa-Induced Defense Responses in Rice against Wounding. Int. J. Mol. Sci. 2019, 20, 2525. [Google Scholar] [CrossRef]
- Dorion, S.; Rivoal, J. Clues to the functions of plant NDPK isoforms. N-S Arch. Pharmacol. 2015, 388, 119–132. [Google Scholar] [CrossRef]
- Li, D.; Limwachiranon, J.; Li, L.; Du, R.; Luo, Z. Involvement of energy metabolism to chilling tolerance induced by hydrogen sulfide in cold-stored banana fruit. Food Chem. 2016, 208, 272–278. [Google Scholar] [CrossRef]
- Hernandez, J.A.; Almansa, M.S. Short-term effects of salt stress on antioxidant systems and leaf water relations of pea leaves. Physiol. Plant 2002, 115, 251–257. [Google Scholar] [CrossRef] [PubMed]
- Demiral, T.; Turkan, I. Comparative lipid peroxidation, antioxidant defense systems and proline content in roots of two rice cultivars differing in salt tolerance. Environ. Exp. Bot. 2005, 53, 247–257. [Google Scholar] [CrossRef]
- Shi, H.; Ye, T.; Chan, Z. Exogenous application of hydrogen sulfide donor sodium hydrosulfide enhanced multiple abiotic stress tolerance in bermudagrass (Cynodon dactylon (L). Pers.). Plant Physiol. Bioch. 2013, 71, 226–234. [Google Scholar]
- Geitmann, A.; Nebenfuhr, A. Navigating the plant cell: Intracellular transport logistics in the green kingdom. Mol. Biol. Cell 2015, 26, 3373–3378. [Google Scholar] [CrossRef] [PubMed]
- Thomas, S.G.; Huang, S.J.; Li, S.T.; Staiger, C.J.; Franklin-Tong, V.E. Actin depolymerization is sufficient to induce programmed cell death in self-incompatible pollen. J. Cell Biol. 2006, 174, 221–229. [Google Scholar] [CrossRef]
- Yin, Z.P.; Zhang, H.; Zhao, Q.; Yoo, M.J.; Zhu, N.; Yu, J.L.; Yu, J.J.; Guo, S.Y.; Miao, Y.C.; Chen, S.X.; et al. Physiological and comparative proteomic analyses of saline-alkali NaHCO3-responses in leaves of halophyte Puccinellia tenuiflora. Plant Soil. 2019, 437, 137–158. [Google Scholar] [CrossRef]
- Suo, J.W.; Zhao, Q.; Zhang, Z.X.; Chen, S.X.; Cao, J.G.; Liu, G.J.; Wei, X.; Wang, T.; Chuan, P.; Dai, S.J. Cytological and proteomic analyses of osmunda cinnamomea germinating spores reveal characteristics of fern spore germination and rhizoid tip growth. Mol. Cell Proteomics 2015, 14, 2510–2534. [Google Scholar] [CrossRef]
- Abreu, I.A.; Cabelli, D.E. Superoxide dismutases-a review of the metal-associated mechanistic variations. BBA-Proteins Proteom 2010, 1804, 263–274. [Google Scholar] [CrossRef]
- Buono, R.A.; Hudecek, R.; Nowack, M.K. Plant proteases during developmental programmed cell death. J. Exp. Bot. 2019, 70, 2097–2112. [Google Scholar] [CrossRef]
- Prins, A.; Van Heerden, P.D.; Olmos, E.; Kunert, K.J.; Foyer, C.H. Cysteine proteinases regulate chloroplast protein content and composition in tobacco leaves: A model for dynamic interactions with ribulose-1,5-bisphosphate carboxylase/oxygenase (Rubisco) vesicular bodies. J. Exp. Bot. 2008, 59, 1935–1950. [Google Scholar] [CrossRef]
- Szewińska, J.; Simińska, J.; Bielawski, W. The roles of cysteine proteases and phytocystatins in development and germination of cereal seeds. J. Plant Physiol. 2016, 207, 10–21. [Google Scholar] [CrossRef]
- Komatsu, S.; Kamal, A.H.; Hossain, Z. Wheat proteomics: Proteome modulation and abiotic stress acclimation. Front Plant Sci. 2014, 5, 684. [Google Scholar] [CrossRef] [PubMed]
- Youssefian, S.; Nakamura, M.; Sano, H. Tobacco plants transformed with the O-acetylserine (thiol) lyase gene of wheat are resistant to toxic levels of hydrogen sulphide gas. Plant J. 1993, 4, 759–769. [Google Scholar] [CrossRef] [PubMed]
- Huang, Y.; Picha, D.H.; Kilili, A.W. Atmospheric oxygen level influences alcohol dehydrogenase and pyruvate decarboxylase activities in sweet potato roots. J. Plant Physiol. 2002, 159, 129–136. [Google Scholar] [CrossRef]
- Shkolnik, D.; Bar-Zvi, D. Tomato ASR1 abrogates the response to abscisic acid and glucose in Arabidopsis by competing with AB14 for DNA binding. Plant Biotechnol. J. 2008, 6, 368–378. [Google Scholar] [CrossRef]
- Zheng, K.; Wang, Y.; Wang, S. The non-DNA binding bHLH transcription factor Paclobutrazol Resistances are involved in the regulation of ABA and salt responses in Arabidopsis. Plant Physiol. Bioch. 2019, 139, 239–245. [Google Scholar] [CrossRef]
- Joo, J.; Lee, Y.H.; Kim, Y.K.; Nahm, B.H.; Song, S.I. Abiotic stress responsive rice ASR1 and ASR3 exhibit different tissue-dependent sugar and hormone-sensitivities. Mol. Cells 2013, 35, 421–435. [Google Scholar] [CrossRef]
- Sen, S.; Chakraborty, J.; Ghosh, P.; Basu, D.; Das, S. Chickpea WRKY70 regulates the expression of a homeodomain-leucine zipper (HD-Zip) I rranscription factor CaHDZ12, which confers abiotic stress tolerance in transgenic tobacco and chickpea. Plant Cell Physiol. 2017, 58, 1934–1952. [Google Scholar] [CrossRef]
- Pérez, A.; Gutiérrez, D.; Saldarriaga, M.S.; Sanders, C.J. Tidally driven sulfidic conditions in Peruvian mangrove sediments. Geo-Mar. Lett. 2018, 38, 457–465. [Google Scholar]
- Lichtenthaler, H.K. Chlorophylls and carotenoids: Pigments of photosynthetic biomembranes. Method Enzymol. 1987, 148, 350–382. [Google Scholar]
- Neves, L.H.; Santos, R.I.N.; dos Santos Teixeira, G.I.; de Araujo, D.G.; Silvestre, W.V.D.; Pinheiro, H.A. Leaf gas exchange, photochemical responses and oxidative damages in assai (Euterpe oleracea Mart.) seedlings subjected to high temperature stress. Sci. Hortic. 2019, 257, 108733. [Google Scholar] [CrossRef]
- Zhang, H.; Hu, L.Y.; Hu, K.D.; He, Y.D.; Wang, S.H.; Luo, J.P. Hydrogen sulfide promotes wheat seed germination and alleviates oxidative damage against copper stress. J. Integr. Plant Biol. 2008, 50, 1518–1529. [Google Scholar] [CrossRef] [PubMed]
- Chen, J.; Liu, T.W.; Hu, W.J.; Simon, M.; Wang, W.H.; Chen, J.; Liu, X.; Zheng, H.L. Comparative proteomic analysis of differentially expressed proteins induced by hydrogen sulfide in Spinacia oleracea leaves. PLoS ONE 2014, 9, e105400. [Google Scholar] [CrossRef] [PubMed][Green Version]
- Hung, K.T.; Kao, C.H. Hydrogen peroxide is necessary for abscisic acid-induced senescence of rice leaves. J. Plant Physiol. 2004, 161, 1347–1357. [Google Scholar] [CrossRef] [PubMed]
- Yan, K.; Chen, W.; Zhang, G.; Xu, S.; Liu, Z.; He, X.; Wang, L. Elevated CO2 ameliorated oxidative stress induced by elevated O3 in Quercus mongolica. Acta Physiol. Plant 2010, 32, 375–385. [Google Scholar] [CrossRef]
- Beauchamp, C.; Fridovich, I. Superoxide dismutase: Improved assays and an assay applicable to acrylamide gels. Anal. Biochem. 1971, 44, 276–287. [Google Scholar] [CrossRef]
- Chen, G.X.; Asada, K. Ascorbate peroxidase in tea leaves: Occurrence of two isozymes and the differences in their enzymatic and molecular properties. Plant Cell Physiol. 1989, 30, 987–998. [Google Scholar]
- Devi, S.R.; Prasad, M.N.V. Copper toxicity in Ceratophyllum demersum L. (Coontail), a free floating macrophyte: Response of antioxidant enzymes and antioxidants. Plant Sci. 1998, 138, 157–165. [Google Scholar] [CrossRef]
- Delaplace, P.; van der Wal, F.; Dierick, J.F.; Cordewener, J.H.G.; Fauconnier, M.L.; du Jardin, P.; America, A.H.R. Potato tuber proteomics: Comparison of two complementary extraction methods designed for 2-DE of acidic proteins. Proteomics 2006, 6, 6494–6497. [Google Scholar] [CrossRef]
- Shen, Z.J.; Chen, J.; Ghoto, K.; Hu, W.J.; Gao, G.F.; Luo, M.R.; Li, Z.; Simon, M.; Zhu, X.Y.; Zheng, H.L. Proteomic analysis on mangrove plant Avicennia marina leaves reveals nitric oxide enhances the salt tolerance by up-regulating photosynthetic and energy metabolic protein expression. Tree Physiol. 2018, 38, 1605–1622. [Google Scholar] [CrossRef]
- Hu, W.J.; Chen, J.; Liu, T.W.; Wu, Q.; Wang, W.H.; Liu, X.; Shen, Z.J.; Simon, M.; Chen, J.; Wu, F.H.; et al. Proteome and calcium-related gene expression in Pinus massoniana needles in response to acid rain under different calcium levels. Plant Soil 2014, 380, 285–303. [Google Scholar] [CrossRef]
- Szklarczyk, D.; Franceschini, A.; Wyder, S.; Forslund, K.; Heller, D.; Huerta-Cepas, J.; Simonovic, M.; Roth, A.; Santos, A.; Tsafou, K.P.; et al. STRING v10: Protein-protein interaction networks, integrated over the tree of life. Nucleic Acids Res. 2015, 43, D447–D452. [Google Scholar] [CrossRef] [PubMed]
- Bader, G.D.; Hogue, C.W. An automated method for finding molecular complexes in large protein interaction networks. BMC Bioinform. 2003, 4, 2. [Google Scholar] [CrossRef] [PubMed]
- Livak, K.J.; Schmittgen, T.D. Analysis of relative gene expression data using real-time quantitative PCR and the 2-ΔΔCT method. Methods 2001, 25, 402–408. [Google Scholar] [CrossRef] [PubMed]


| Ratio 9 | |||||||||
|---|---|---|---|---|---|---|---|---|---|
| Spot 1 | Accession (gb) 2 | Protein Name 3 | Theoretical (Mr/pI) 4 | Observed (Mr/pI) 5 | Score 6 | MP 7 | Species 8 | NaCl vs. CK | NaCl and H2S vs. CK |
| Photosynthesis | |||||||||
| 1 | gi|502131189 | PREDICTED: plastocyanin, chloroplastic-like | 17.13/5.04 | 14.05/4.37 | 118 | 1 | Cicer arietinum | 2.257 ± 0.193 | 0.841 ± 0.068 |
| 2 | gi|226497434 | Ferredoxin-NADP reductase, leaf isozyme | 40.98/8.53 | 37.32/6.74 | 311 | 4 | Zea mays | 0.287 ± 0.055 | 0.686 ± 0.153 |
| 8 | gi|363981020 | Ribulose-1,5-bisphosphate carboxylase/oxygenase large subunit, partial (chloroplast) | 50.67/5.87 | 19.87/5.19 | 116 | 7 | Cercidiphyllum japonicum | 0.086 ± 0.014 | 0.736 ± 0.084 |
| 10 | gi|508707371 | Photosynthetic electron transfer C | 24.67/8.15 | 19.14/4.79 | 103 | 5 | Theobroma cacao | 0.100 ± 0.005 | 0.483 ± 0.068 |
| 12 | gi|222853091 | O2 evolving complex 33kD family protein | 35.41/5.85 | 36.80/5.22 | 405 | 4 | Populus trichocarpa | 0.067 ± 0.006 | 0.518 ± 0.065 |
| 14 | gi|527190719 | Oxygen-evolving enhancer protein 1, chloroplastic | 34.80/6.48 | 34.78/5.47 | 493 | 8 | Genlisea aurea | 1.213 ± 0.061 | 0.068 ± 0.012 |
| 36 | gi|62733297 | RuBisCO activase small isoform precursor | 52.39/5.59 | 42.29/5.03 | 276 | 7 | Oryza sativa Japonica Group | 0.741 ± 0.157 | 0.079 ± 0.033 |
| Carbohydrate and energy metabolism | |||||||||
| 6 | gi|508785499 | Glycosyl hydrolase superfamily protein, putative | 37.45/8.39 | 34.33/4.66 | 68 | 1 | Theobroma cacao | 2.072 ± 0.431 | 1.279 ± 0.188 |
| 7 | gi|336041766 | ATP synthase CF1 epsilon subunit | 13.69/5.43 | 14.89/5.03 | 97 | 2 | Justicia americana | 0.323 ± 0.098 | 0.528 ± 0.060 |
| 9 | gi|460411739 | PREDICTED: ATP synthase subunit d, mitochondrial-like | 19.78/5.33 | 18.95/5.04 | 119 | 4 | Solanum lycopersicum | 0.704 ± 0.059 | 3.630 ± 0.341 |
| 16 | gi|508786769 | Triosephosphate isomerase | 27.50/5.54 | 23.96/6.35 | 164 | 7 | Theobroma cacao | 0.142 ± 0.038 | 0.605 ± 0.061 |
| 20 | gi|223535342 | Alcohol dehydrogenase, putative | 41.61/8.61 | 37.23/5.88 | 513 | 6 | Ricinus communis | 0.643 ± 0.158 | 0.311 ± 0.064 |
| 22 | gi|226503019 | Malate dehydrogenase, cytoplasmic | 35.85/5.76 | 40.48/6.78 | 250 | 7 | Zea mays | 3.659 ± 0.520 | 2.997 ± 0.469 |
| 24 | gi|508715598 | NAD(P)-binding Rossmann-fold superfamily protein isoform 1 | 36.50/9.29 | 28.24/5.53 | 268 | 4 | Theobroma cacao | 0.663 ± 0.131 | 0.469 ± 0.079 |
| 25 | gi|502105712 | Phosphoglycolate phosphatase | 40.78/6.89 | 37.32/6.74 | 226 | 10 | Cicer arietinum | 2.400 ± 0.373 | 1.927 ± 0.395 |
| 29 | gi|335059237 | ATP synthase beta subunit | 52.29/5.09 | 57.59/4.97 | 453 | 11 | Clerodendrum trichotomum | 1.591 ± 0.062 | 2.706 ± 0.178 |
| 30 | gi|475549973 | Nucleoside diphosphate kinase 1 | 17.03/6.85 | 16.16/6.40 | 107 | 5 | Aegilops tauschii | 0.419 ± 0.040 | 9.366 ± 1.258 |
| 35 | gi|223547261 | Phosphoglycerate kinase, putative | 50.11/8.74 | 51.05/5.99 | 294 | 6 | Ricinus communis | 1.115 ± 0.256 | 3.040 ± 0.592 |
| Amino acid and protein metabolism | |||||||||
| 4 | gi|355492134 | Cysteine proteinase | 53.52/8.12 | 40.03/4.48 | 96 | 5 | Medicago truncatula | 1.512 ± 0.206 | 0.162 ± 0.012 |
| 19 | gi|223544592 | Heat-shock protein, putative | 17.81/5.93 | 16.81/5.69 | 129 | 6 | Ricinus communis | 0.734 ± 0.071 | 2.172 ± 0.799 |
| 26 | gi|550336292 | 20 kDa chaperonin family protein | 26.89/8.75 | 23.19/5.62 | 245 | 5 | Populus trichocarpa | 0.196 ± 0.092 | 2.934 ± 0.618 |
| 28 | gi|508779629 | TCP-1/cpn60 chaperonin family protein | 65.05/5.57 | 56.09/5.27 | 714 | 15 | Theobroma cacao | 2.301 ± 0.319 | 1.562 ± 0.134 |
| 32 | gi|508713595 | Glutamine synthetase 2 | 61.64/8.38 | 44.25/5.98 | 63 | 3 | Theobroma cacao | 0.208 ± 0.032 | 1.068 ± 0.160 |
| 33 | gi|332006826 | Glutamine synthetase 1;1 | 39.32/5.28 | 40.86/5.71 | 241 | 7 | Arabidopsis thaliana | 1.294 ± 0.280 | 1.807 ± 0.246 |
| Hormone biosynthesis and transcription factor | |||||||||
| 13 | gi|332008500 | Transcription factor bHLH145 | 35.26/5.08 | 40.10/5.52 | 64 | 11 | Arabidopsis thaliana | 4.254 ± 0.498 | 1.032 ± 0.079 |
| 21 | gi|508712975 | Mitochondrial transcription termination factor family protein, putative isoform 1 | 51.01/9.32 | 44.71/6.38 | 56 | 11 | Theobroma cacao | 0.252 ± 0.032 | 0.393 ± 0.063 |
| 27 | gi|355514936 | BZIP transcription factor | 24.12/8.65 | 23.37/5.88 | 60 | 9 | Medicago truncatula | 2.478 ± 0.158 | 3.198 ± 0.157 |
| 31 | gi|355481146 | Abscisic acid stress ripening protein | 27.33/5.15 | 39.71/5.9 | 207 | 2 | Medicago truncatula | 2.024 ± 0.207 | 1.567 ± 0.182 |
| Stress response proteins | |||||||||
| 5 | gi|502112102 | PREDICTED: 2-Cys peroxiredoxin BAS1-like, chloroplastic-like isoform X2 | 29.14/6.12 | 21.46/4.96 | 361 | 6 | Cucumis sativus | 2.446 ± 0.616 | 2.257 ± 0.502 |
| 11 | gi|222867611 | Pyridoxin biosynthesis PDX1-like protein 3 | 33.31/6.55 | 15.98/5.29 | 60 | 8 | Populus trichocarpa | 0.886 ± 0.266 | 2.230 ± 0.521 |
| 17 | gi|409900374 | Copper/zinc superoxide dismutase CSD2A-1 | 23.29/6.12 | 19.07/5.74 | 393 | 4 | Musa acuminata | 1.184 ± 0.167 | 2.006 ± 0.334 |
| 18 | gi|414866828 | Superoxide dismutase 4 | 15.65/5.10 | 15.02/5.80 | 77 | 3 | Zea mays | 2.510 ± 0.688 | 0.988 ± 0.100 |
| 23 | gi|508776520 | Actin 7 isoform 1 | 41.80/5.31 | 43.65/5.52 | 342 | 9 | Theobroma cacao | 0.827 ± 0.210 | 3.400 ± 0.725 |
| 34 | gi|508723241 | Chloroplastic drought-induced stress protein of 32 kD | 40.91/7.66 | 27.45/5.77 | 213 | 6 | Theobroma cacao | 0.237 ± 0.078 | 0.210 ± 0.058 |
| 37 | gi|498923199 | Cytosolic ascorbate peroxidase | 27.09/5.52 | 32.52/6.66 | 234 | 3 | Arachis hypogaea | 0.734 ± 0.235 | 2.172 ± 0.334 |
| Unknown protein | |||||||||
| 3 | gi|548848586 | Hypothetical protein AMTR_s00157p00064680 | 54.99/6.91 | 28.30/4.86 | 68 | 1 | Amborella trichopoda | 0.120 ± 0.011 | 0.759 ± 0.362 |
| 15 | gi|462410037 | Hypothetical protein PRUPE_ppa019045mg | 25.73/5.65 | 29.45/6.01 | 150 | 5 | Prunus persica | 0.488 ± 0.109 | 0.669 ± 0.116 |
© 2019 by the authors. Licensee MDPI, Basel, Switzerland. This article is an open access article distributed under the terms and conditions of the Creative Commons Attribution (CC BY) license (http://creativecommons.org/licenses/by/4.0/).
Share and Cite
Liu, Y.-L.; Shen, Z.-J.; Simon, M.; Li, H.; Ma, D.-N.; Zhu, X.-Y.; Zheng, H.-L. Comparative Proteomic Analysis Reveals the Regulatory Effects of H2S on Salt Tolerance of Mangrove Plant Kandelia obovata. Int. J. Mol. Sci. 2020, 21, 118. https://doi.org/10.3390/ijms21010118
Liu Y-L, Shen Z-J, Simon M, Li H, Ma D-N, Zhu X-Y, Zheng H-L. Comparative Proteomic Analysis Reveals the Regulatory Effects of H2S on Salt Tolerance of Mangrove Plant Kandelia obovata. International Journal of Molecular Sciences. 2020; 21(1):118. https://doi.org/10.3390/ijms21010118
Chicago/Turabian StyleLiu, Yi-Ling, Zhi-Jun Shen, Martin Simon, Huan Li, Dong-Na Ma, Xue-Yi Zhu, and Hai-Lei Zheng. 2020. "Comparative Proteomic Analysis Reveals the Regulatory Effects of H2S on Salt Tolerance of Mangrove Plant Kandelia obovata" International Journal of Molecular Sciences 21, no. 1: 118. https://doi.org/10.3390/ijms21010118
APA StyleLiu, Y.-L., Shen, Z.-J., Simon, M., Li, H., Ma, D.-N., Zhu, X.-Y., & Zheng, H.-L. (2020). Comparative Proteomic Analysis Reveals the Regulatory Effects of H2S on Salt Tolerance of Mangrove Plant Kandelia obovata. International Journal of Molecular Sciences, 21(1), 118. https://doi.org/10.3390/ijms21010118