Using Thermography to Confirm Genotypic Variation for Drought Response in Maize

 ,
,  , , , and
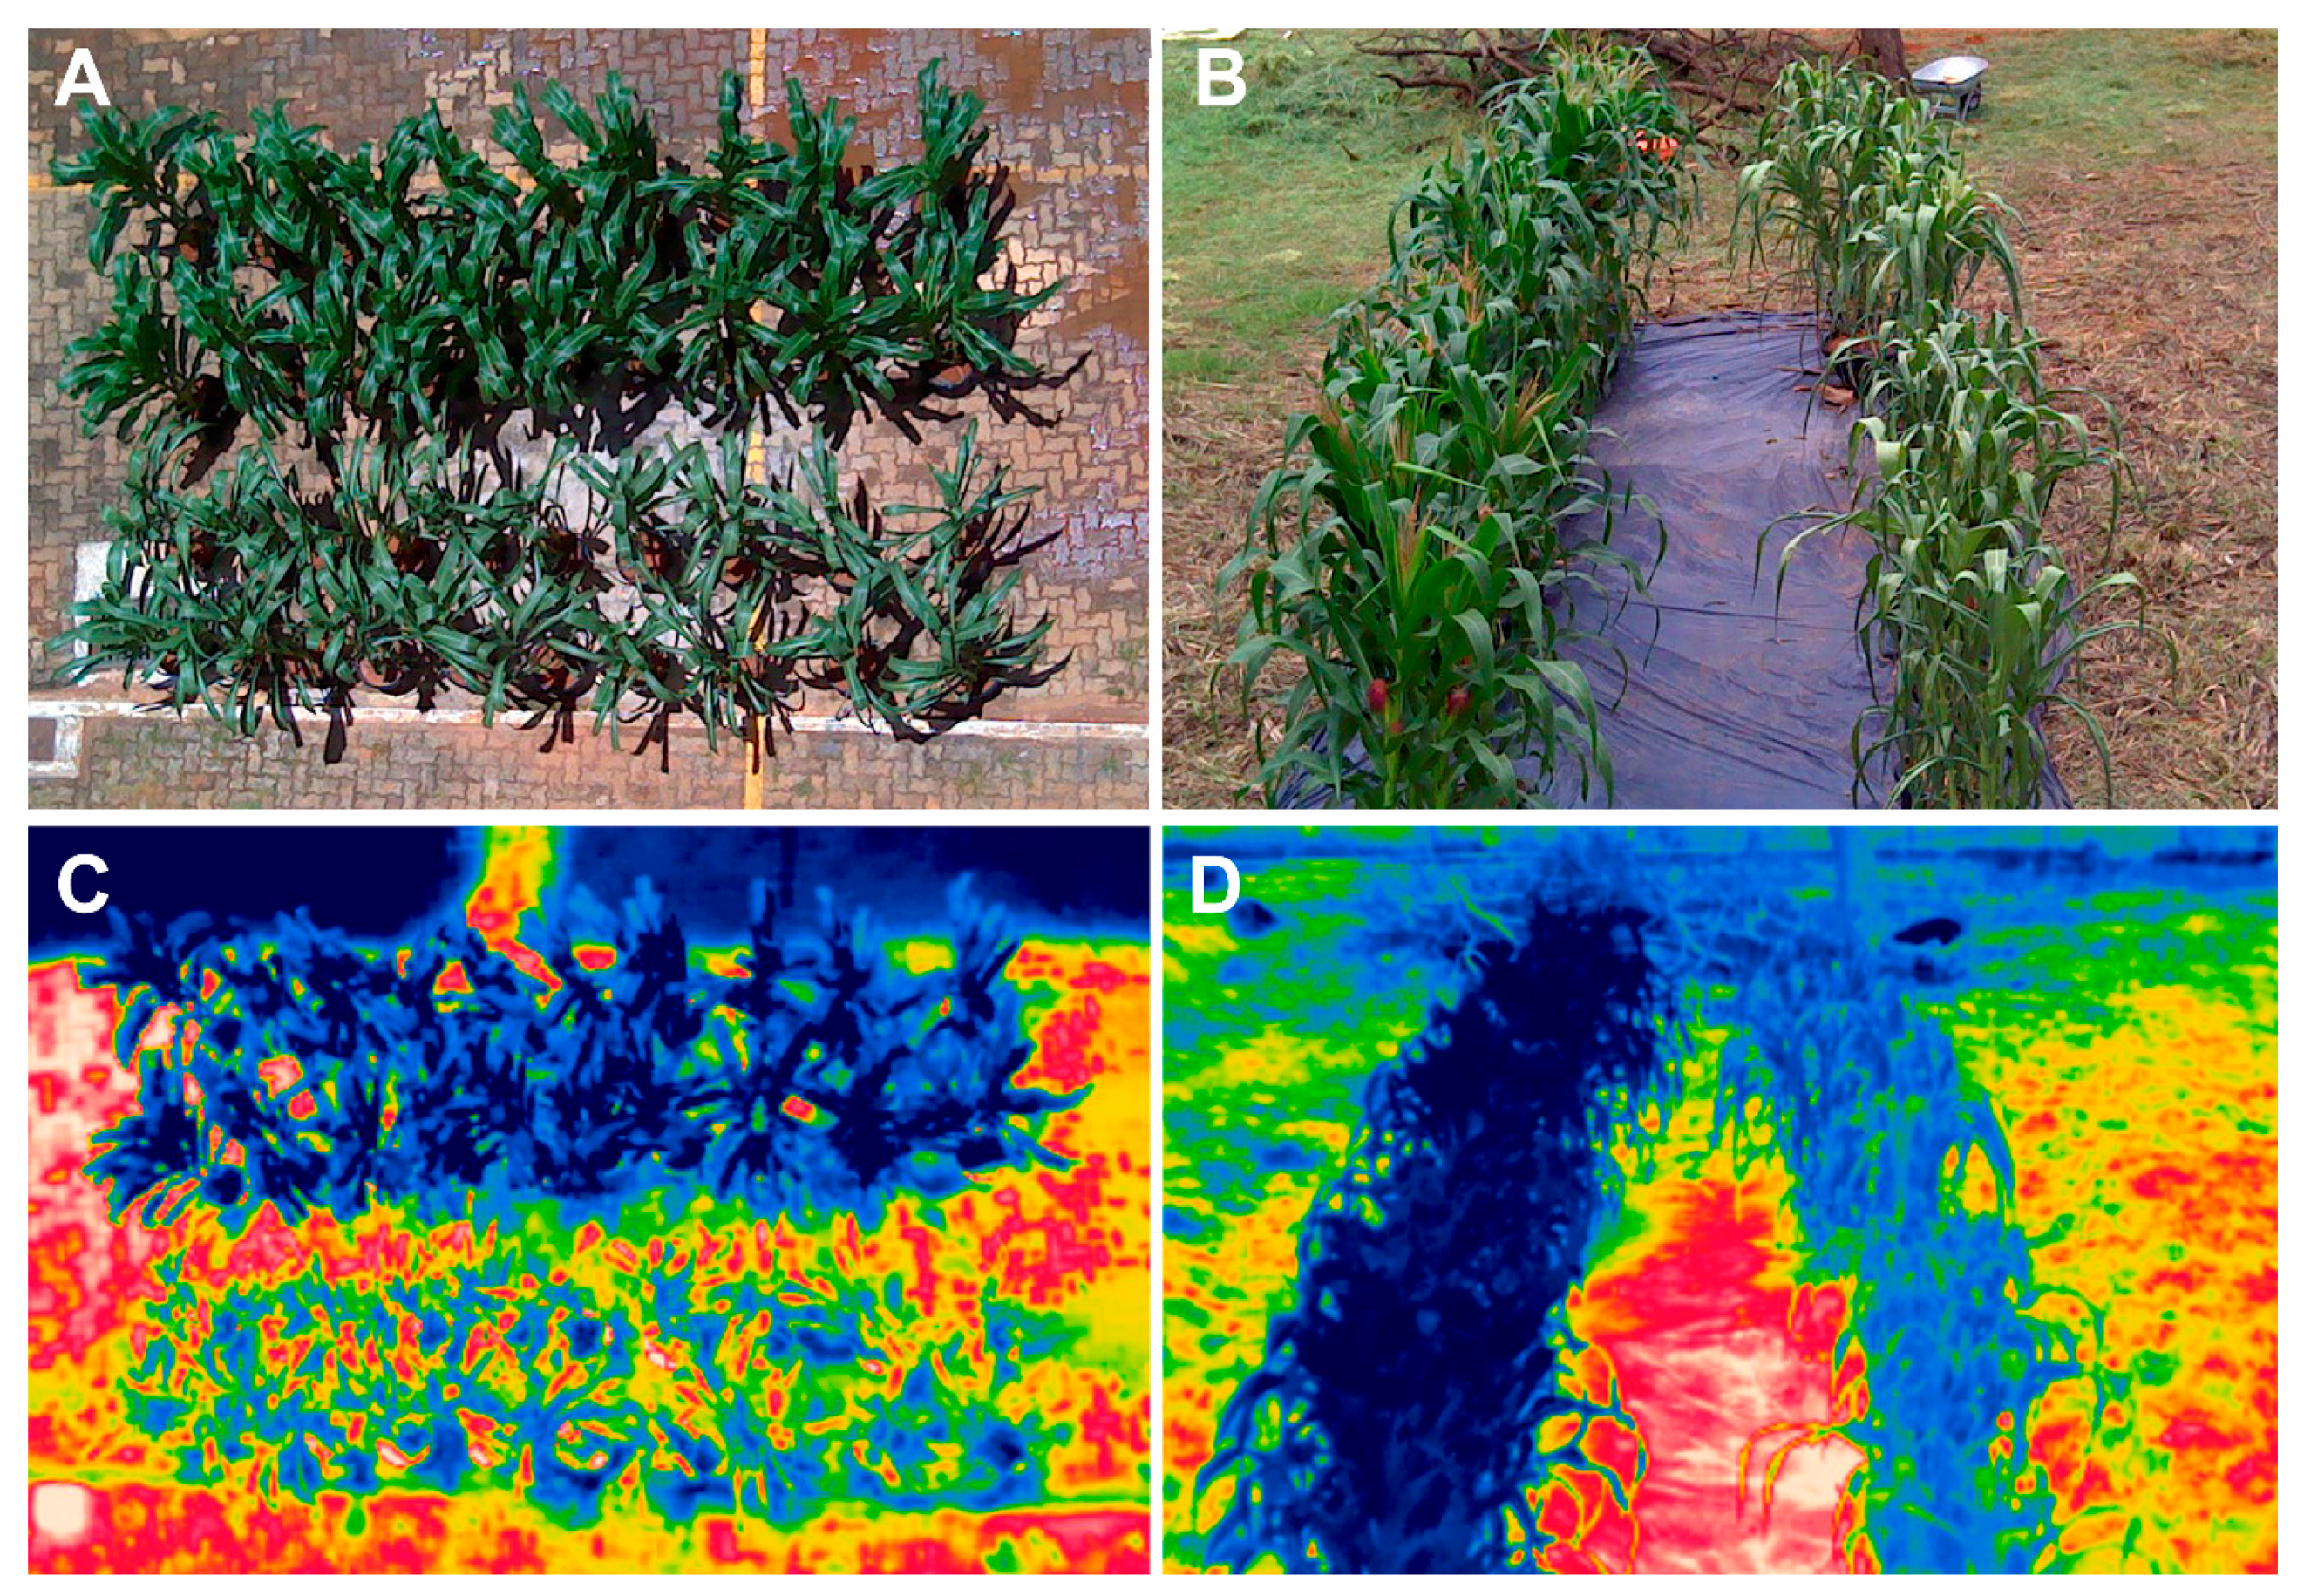
Abstract
1. Introduction
2. Results
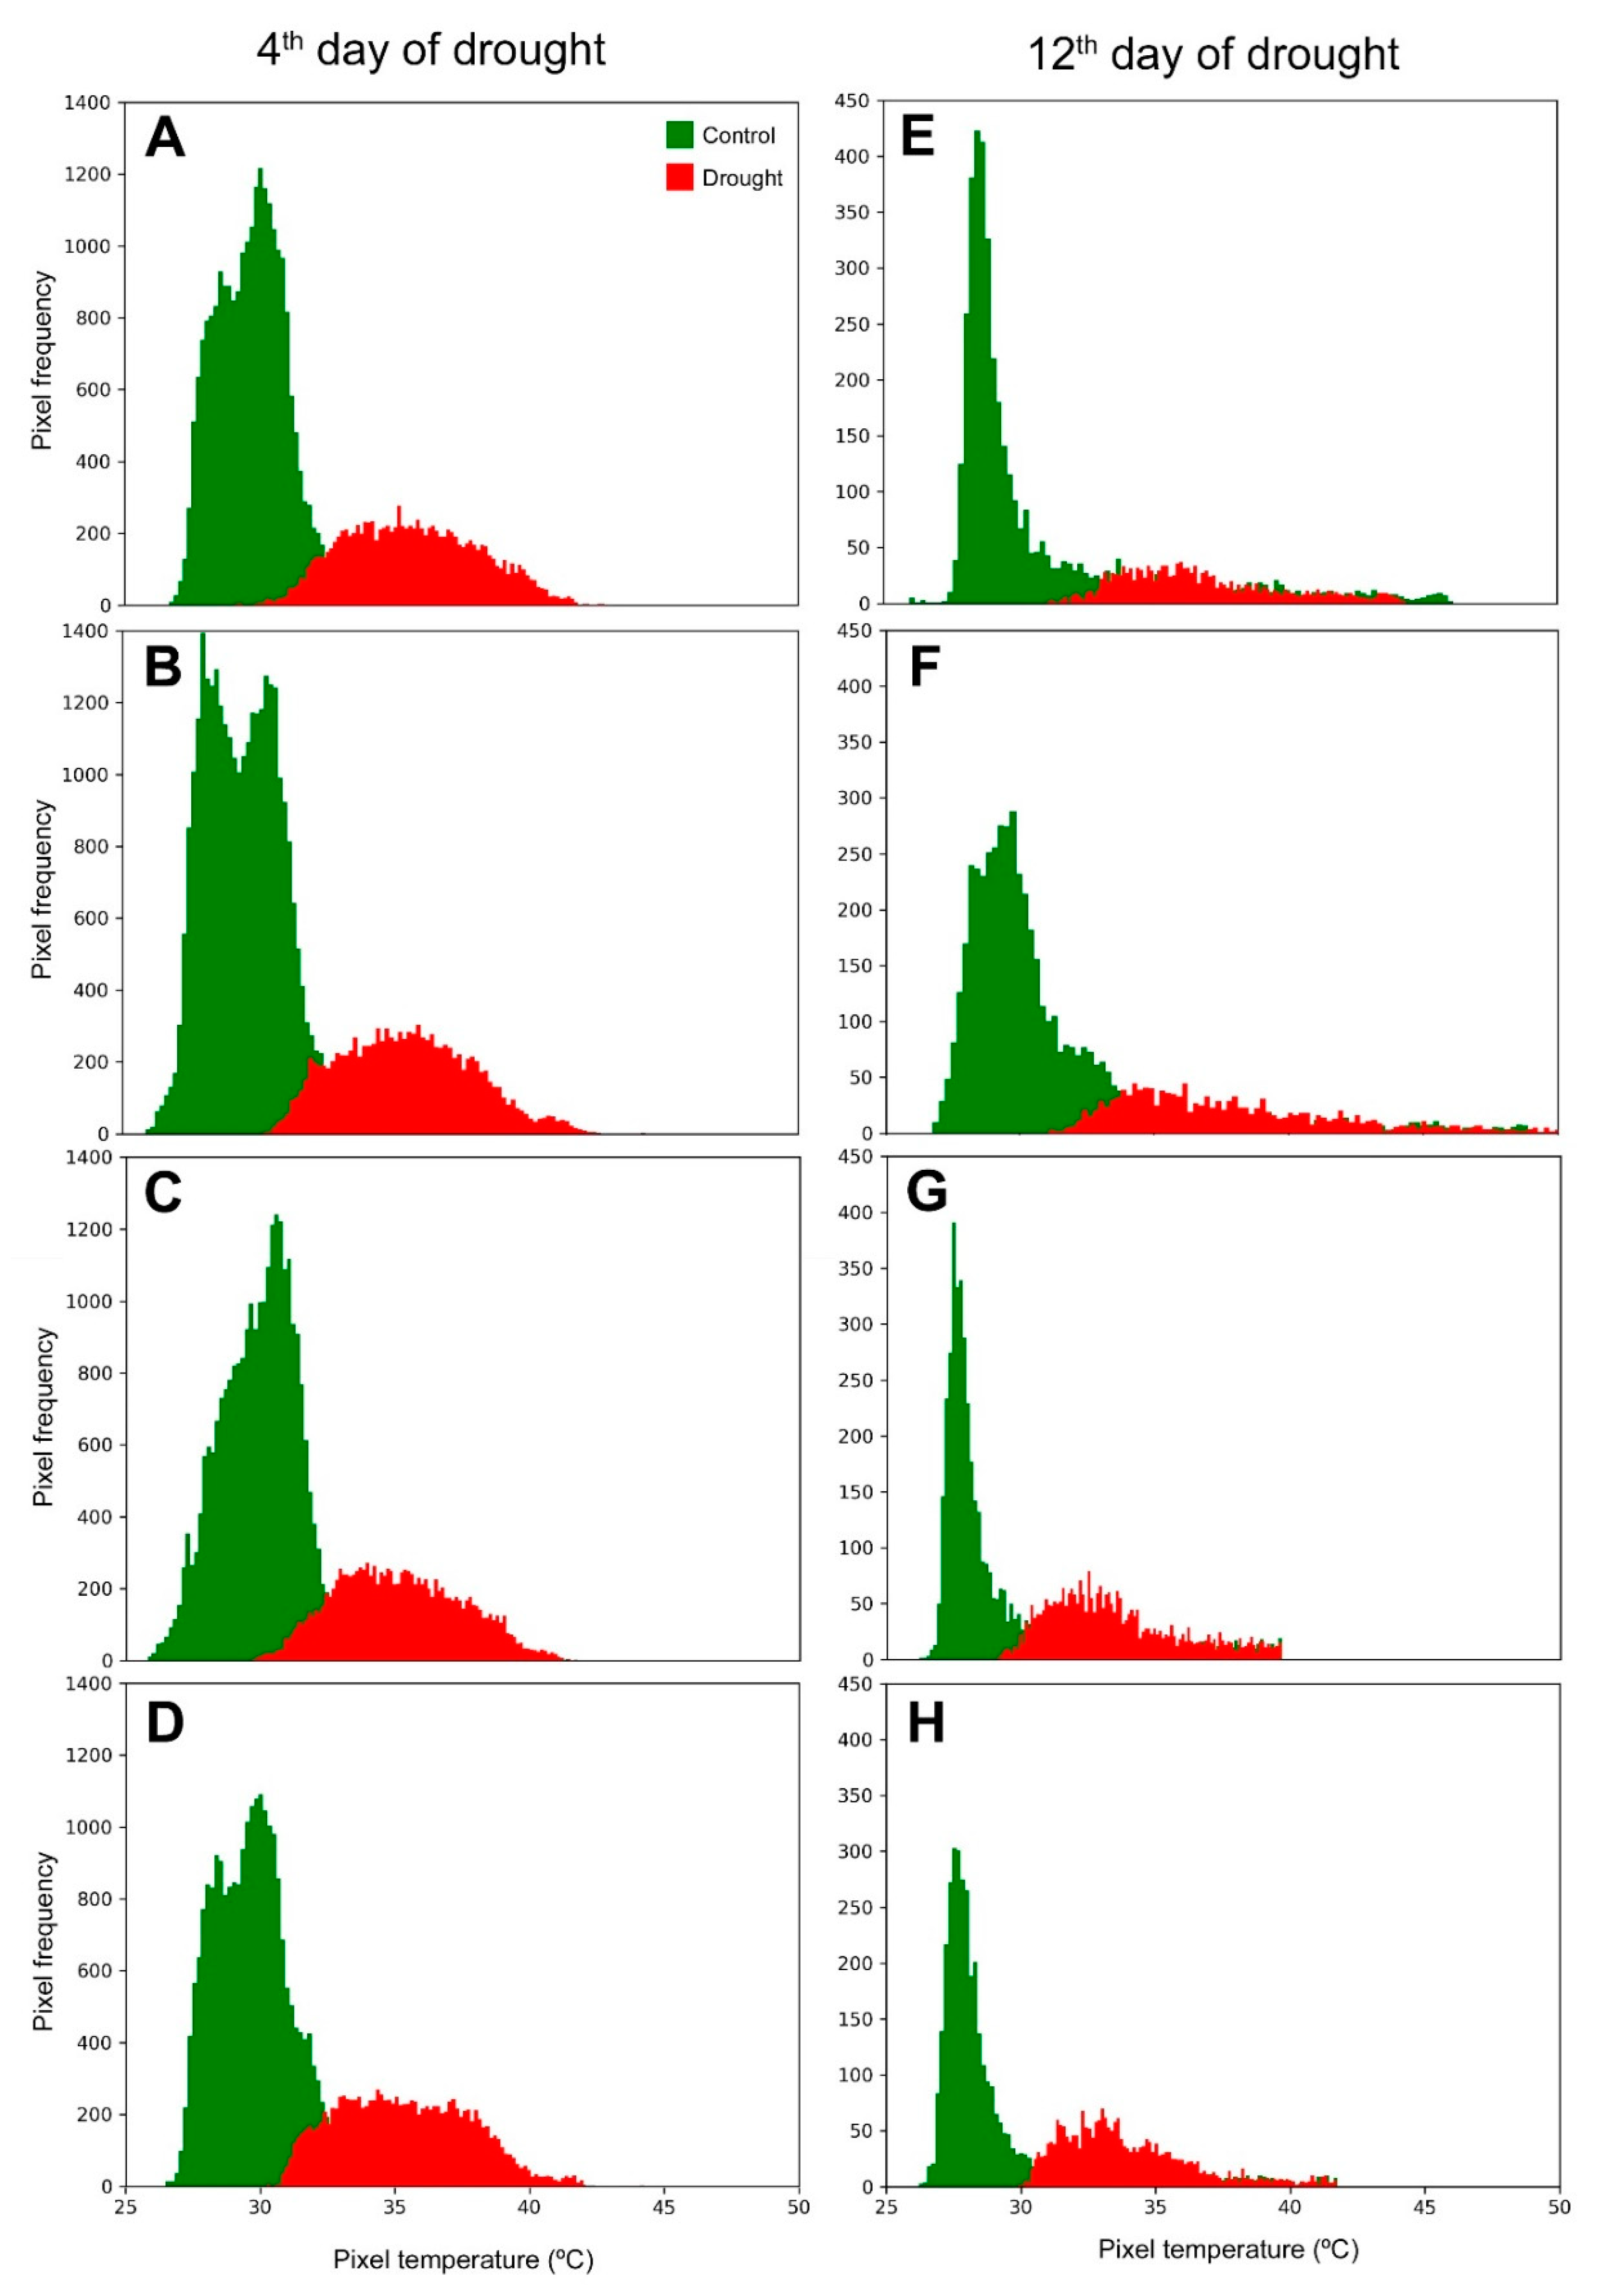
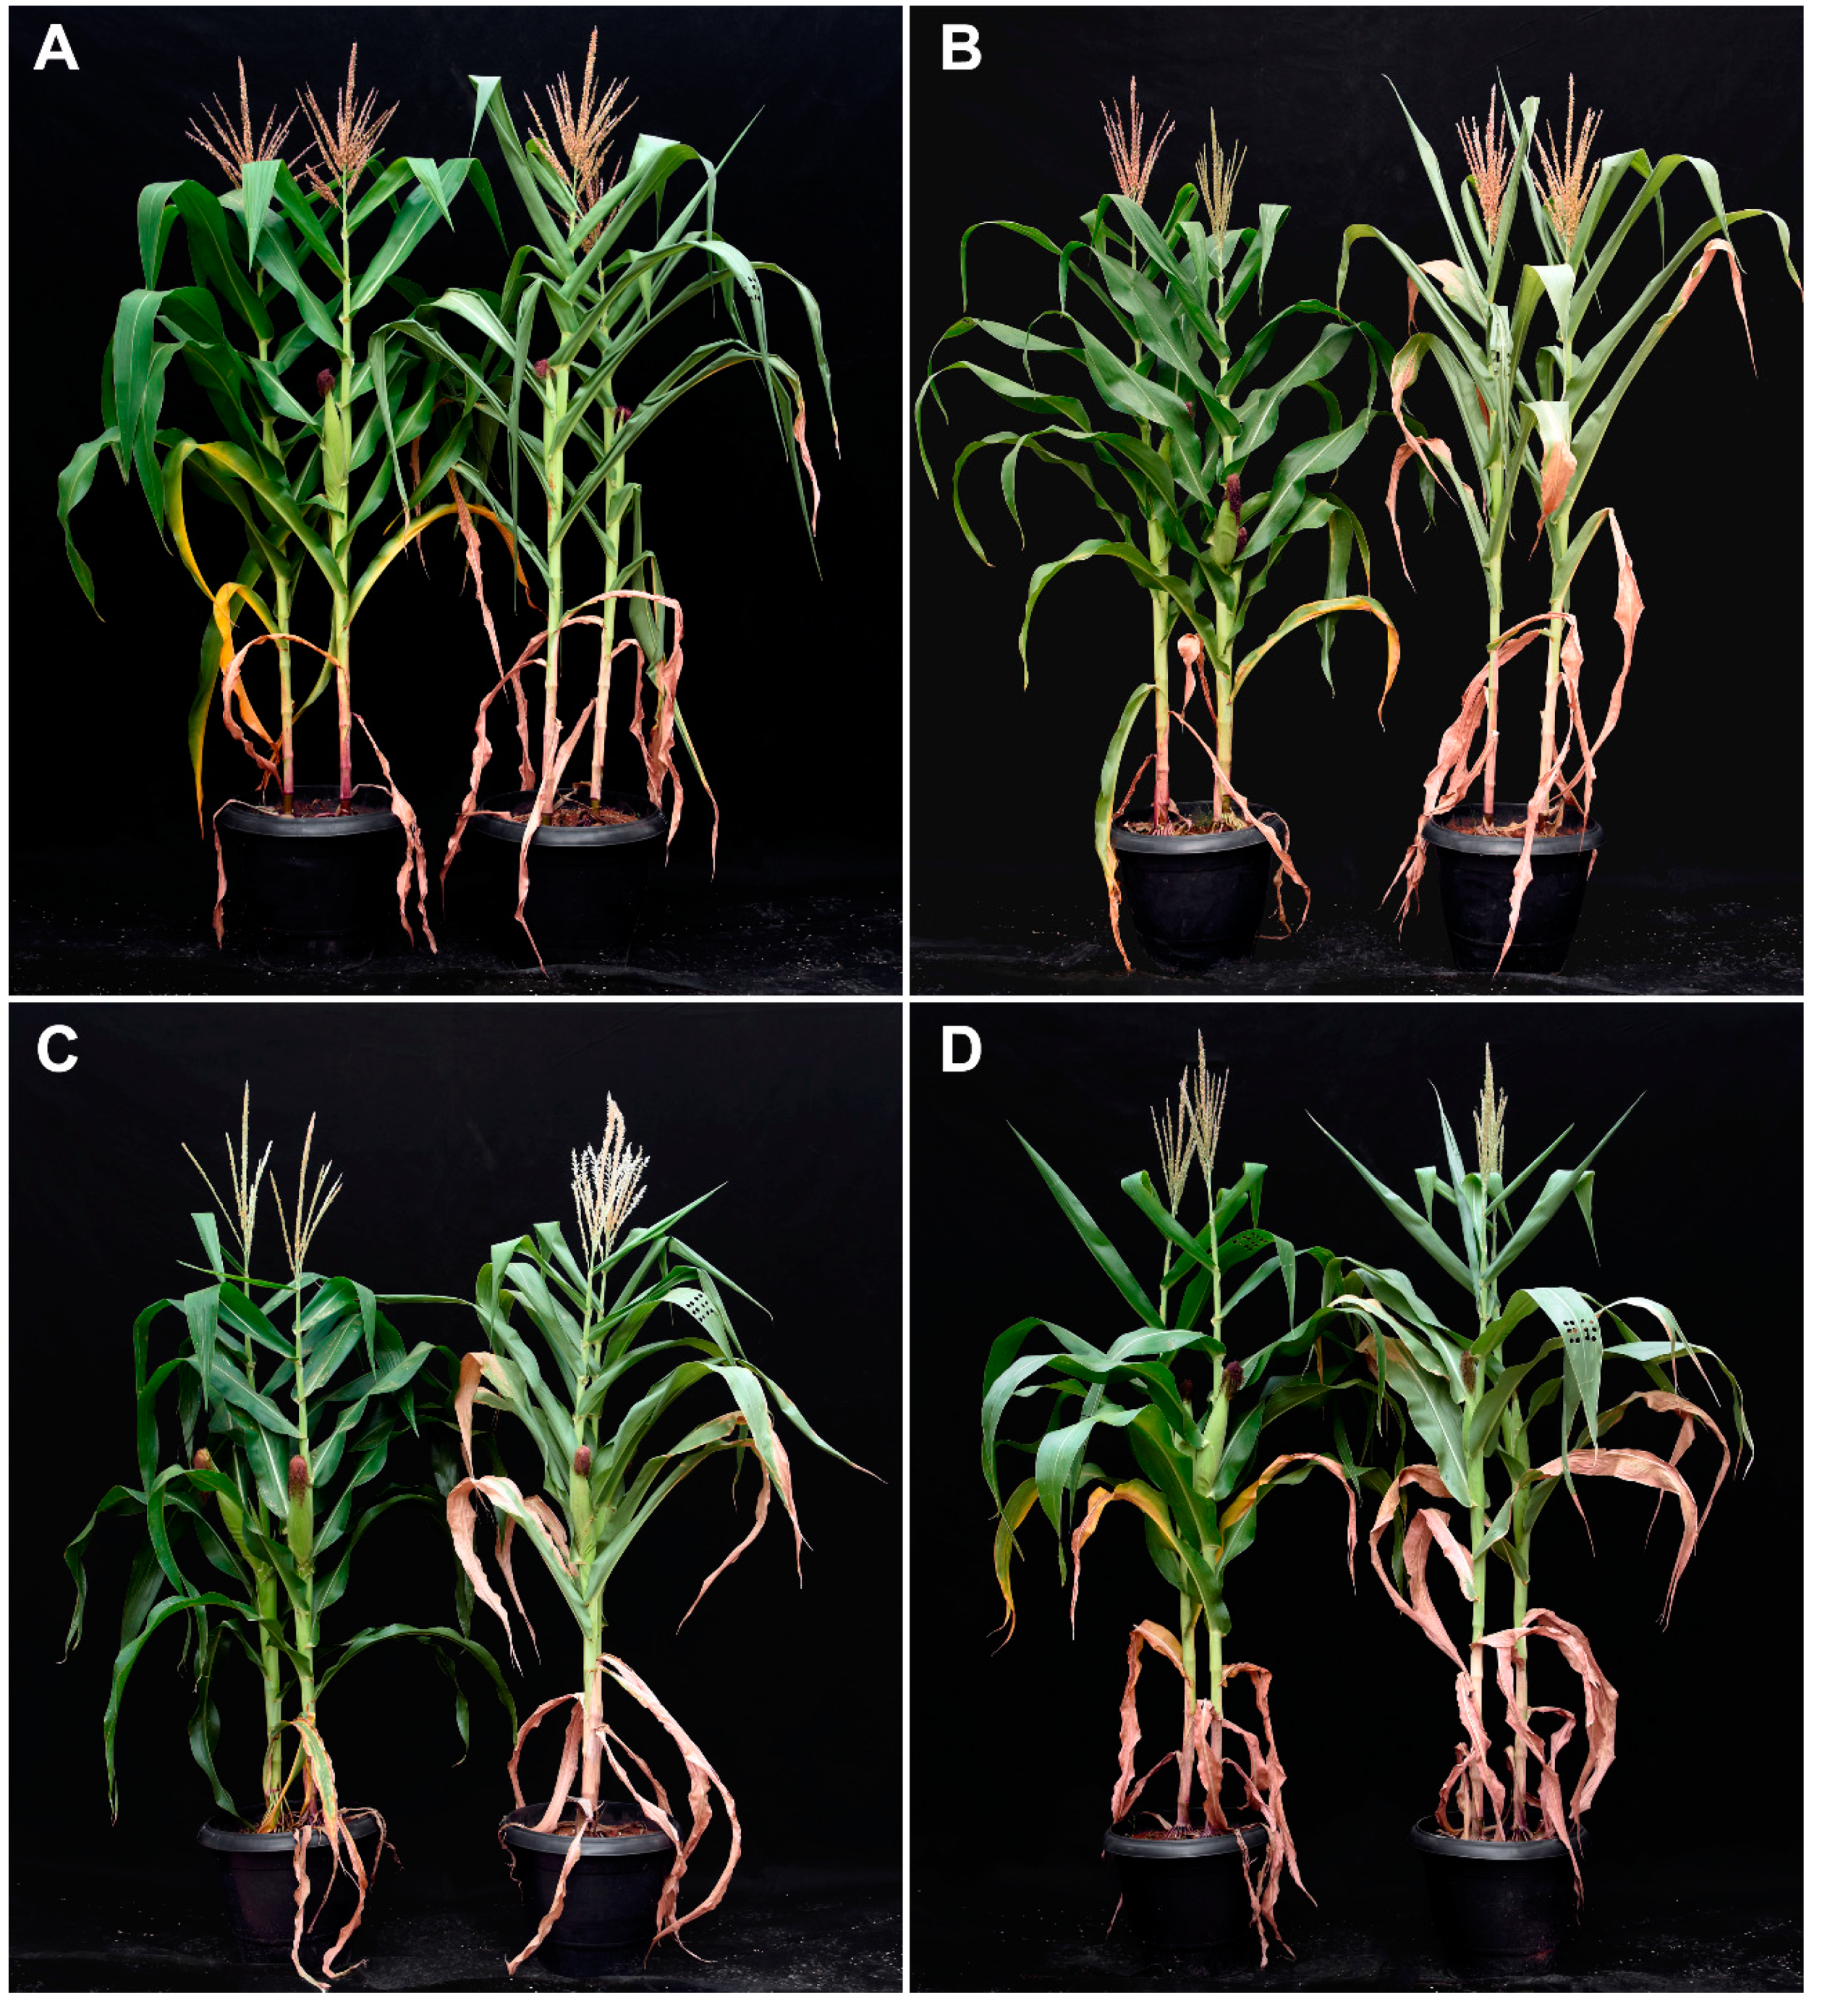
2.1. Drought Effect on Visual Aspect, Leaf Thermal Pixels and Canopy Temperature of Maize Plants
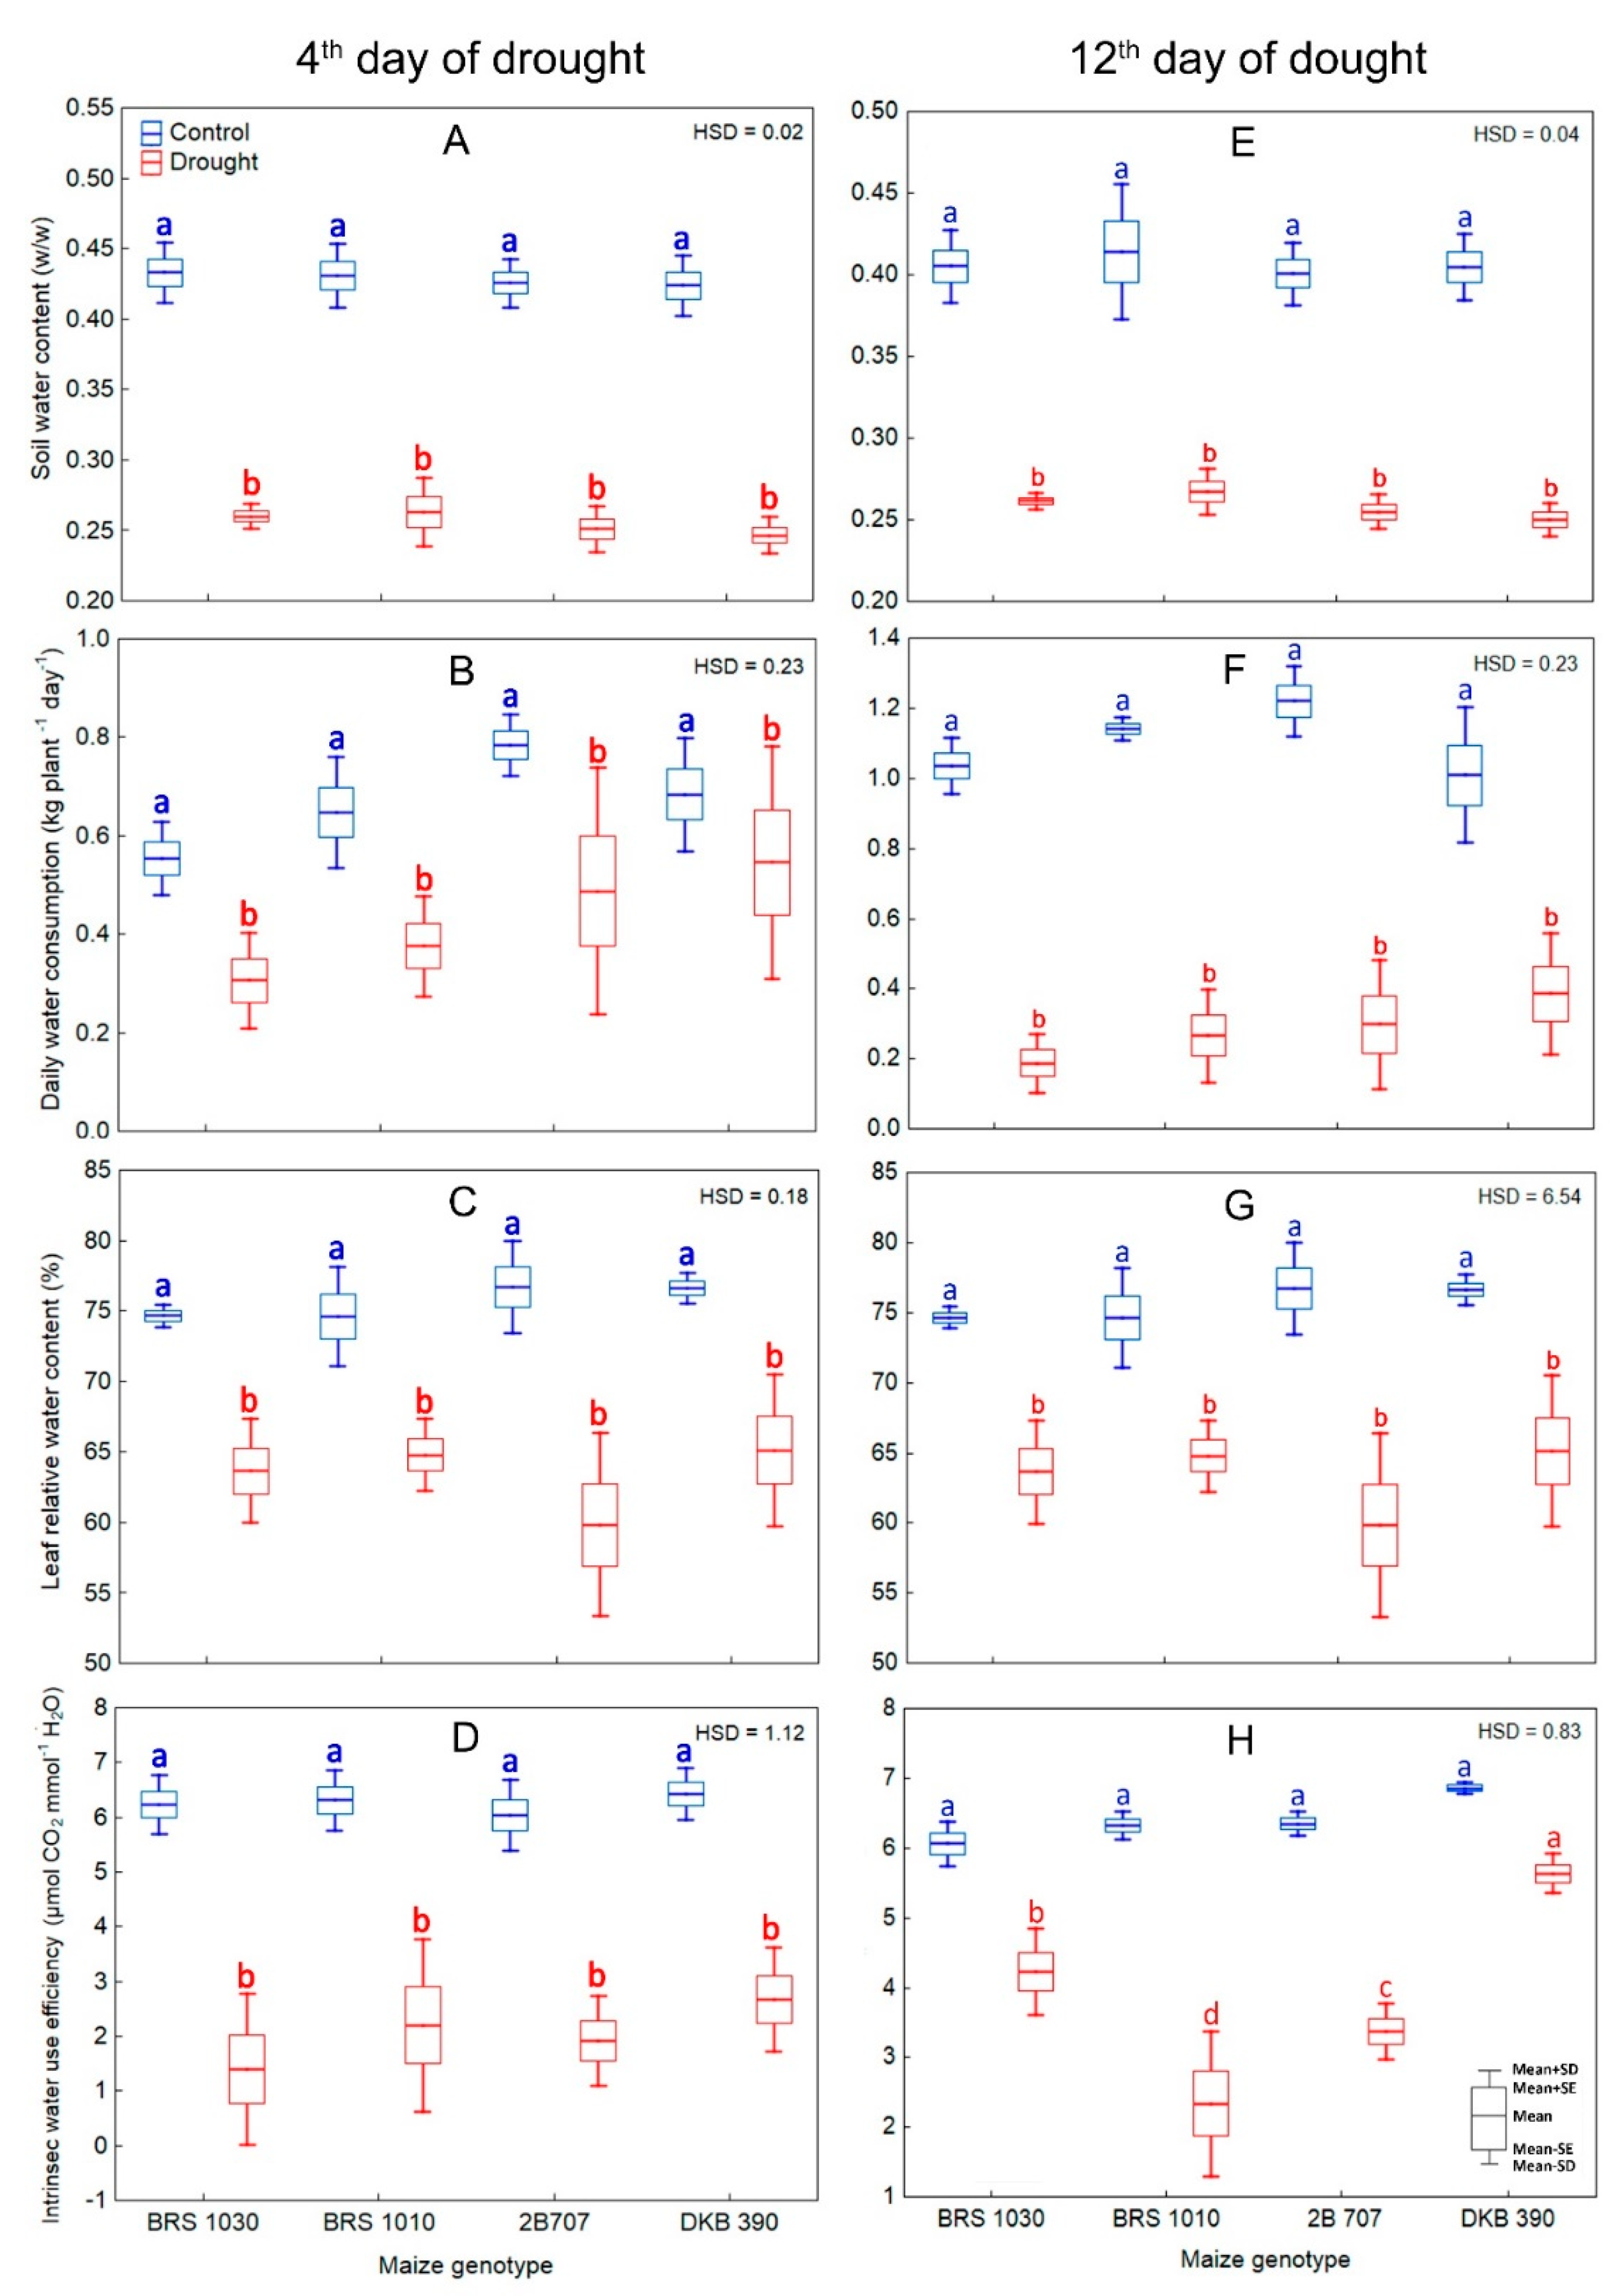
2.2. Restriction on Water Supply in the Soil and Its Effects on Soil and Leaf Water Content, Plant Water Consumption, Canopy Temperature, and Gas Exchange
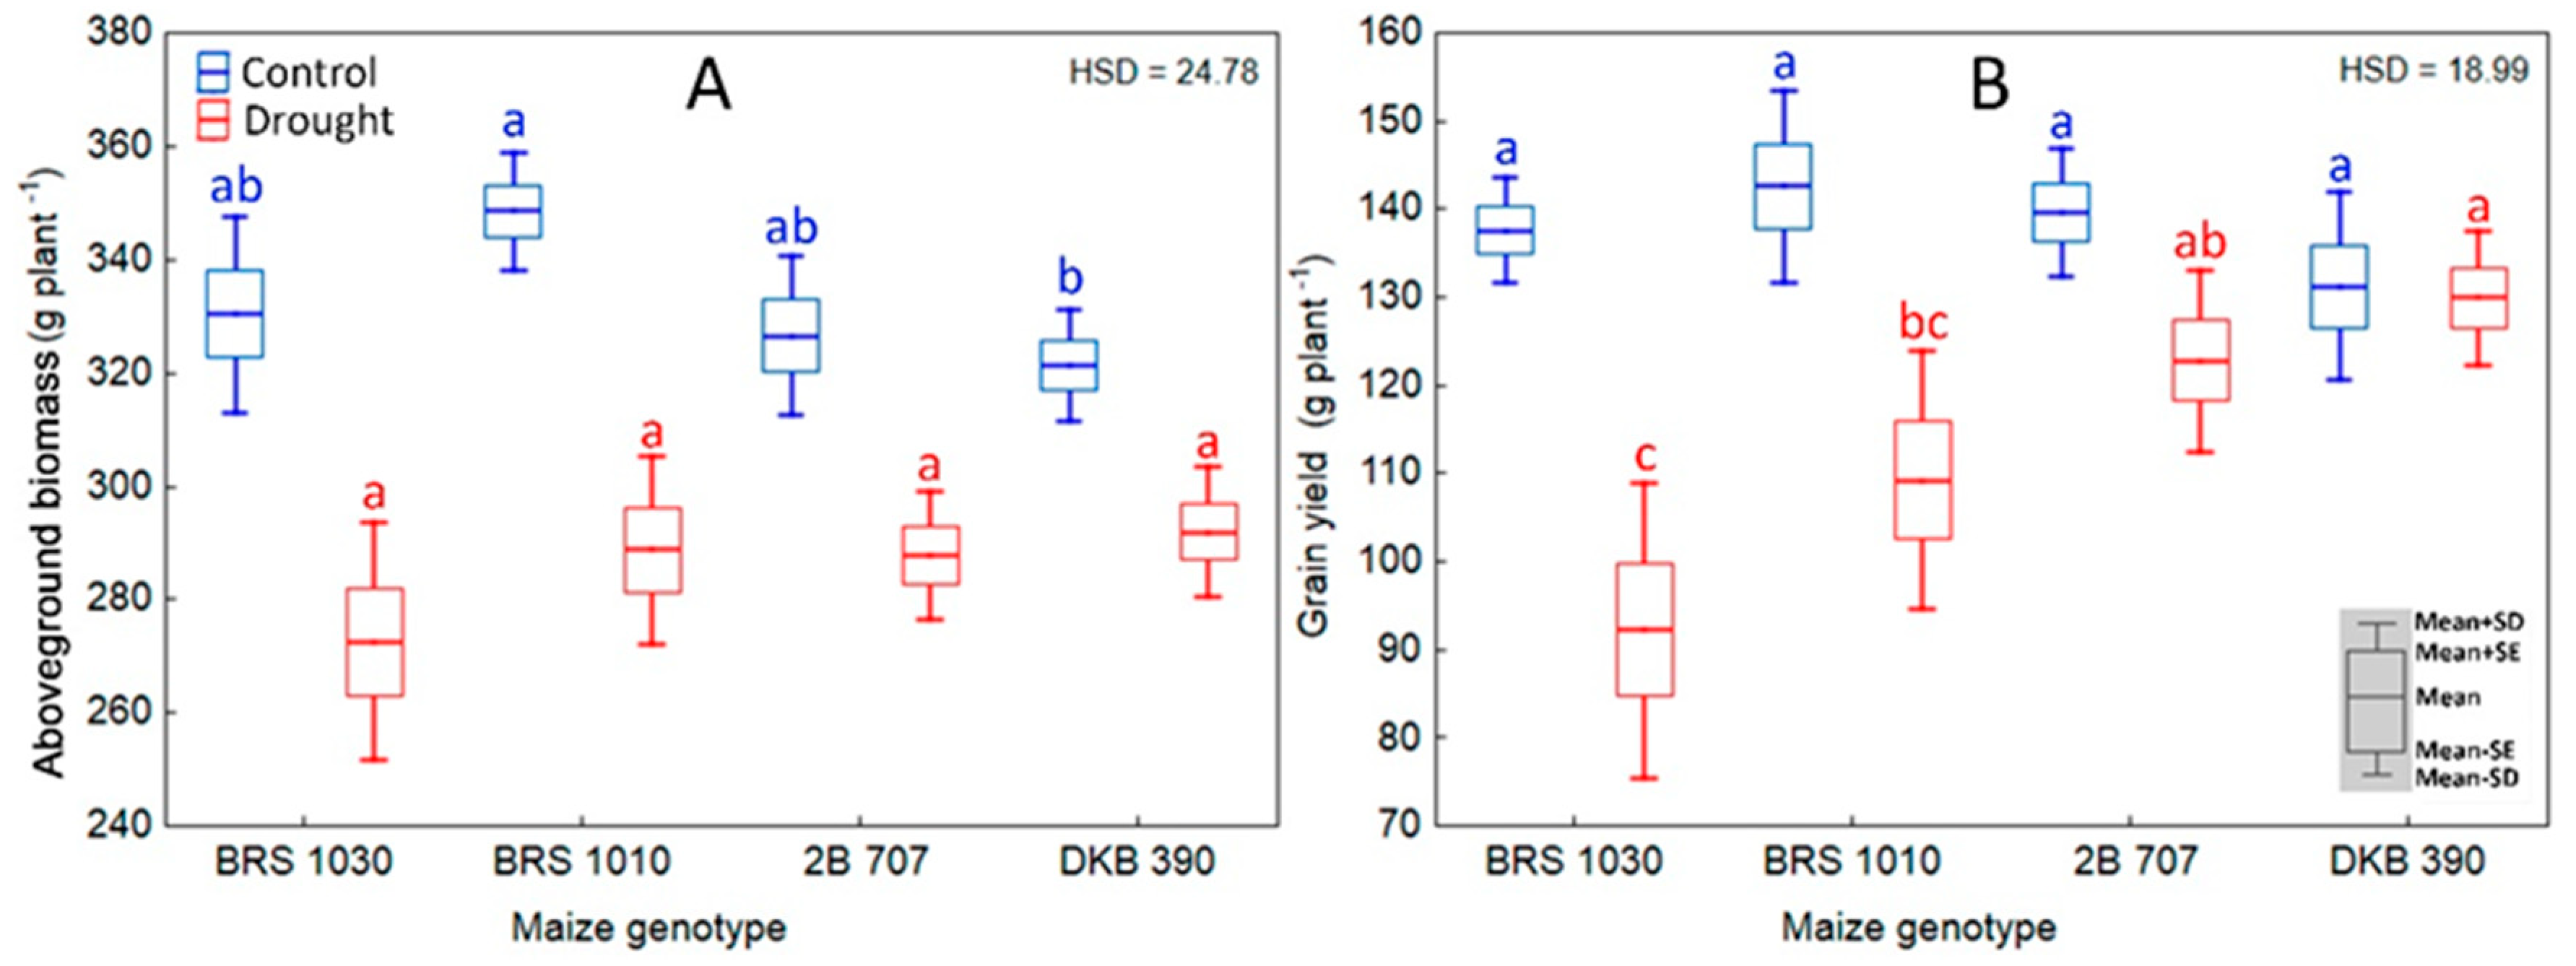
2.3. Effect of Drought on Biomass, Grain Yield and Main Yield-Correlated Variables
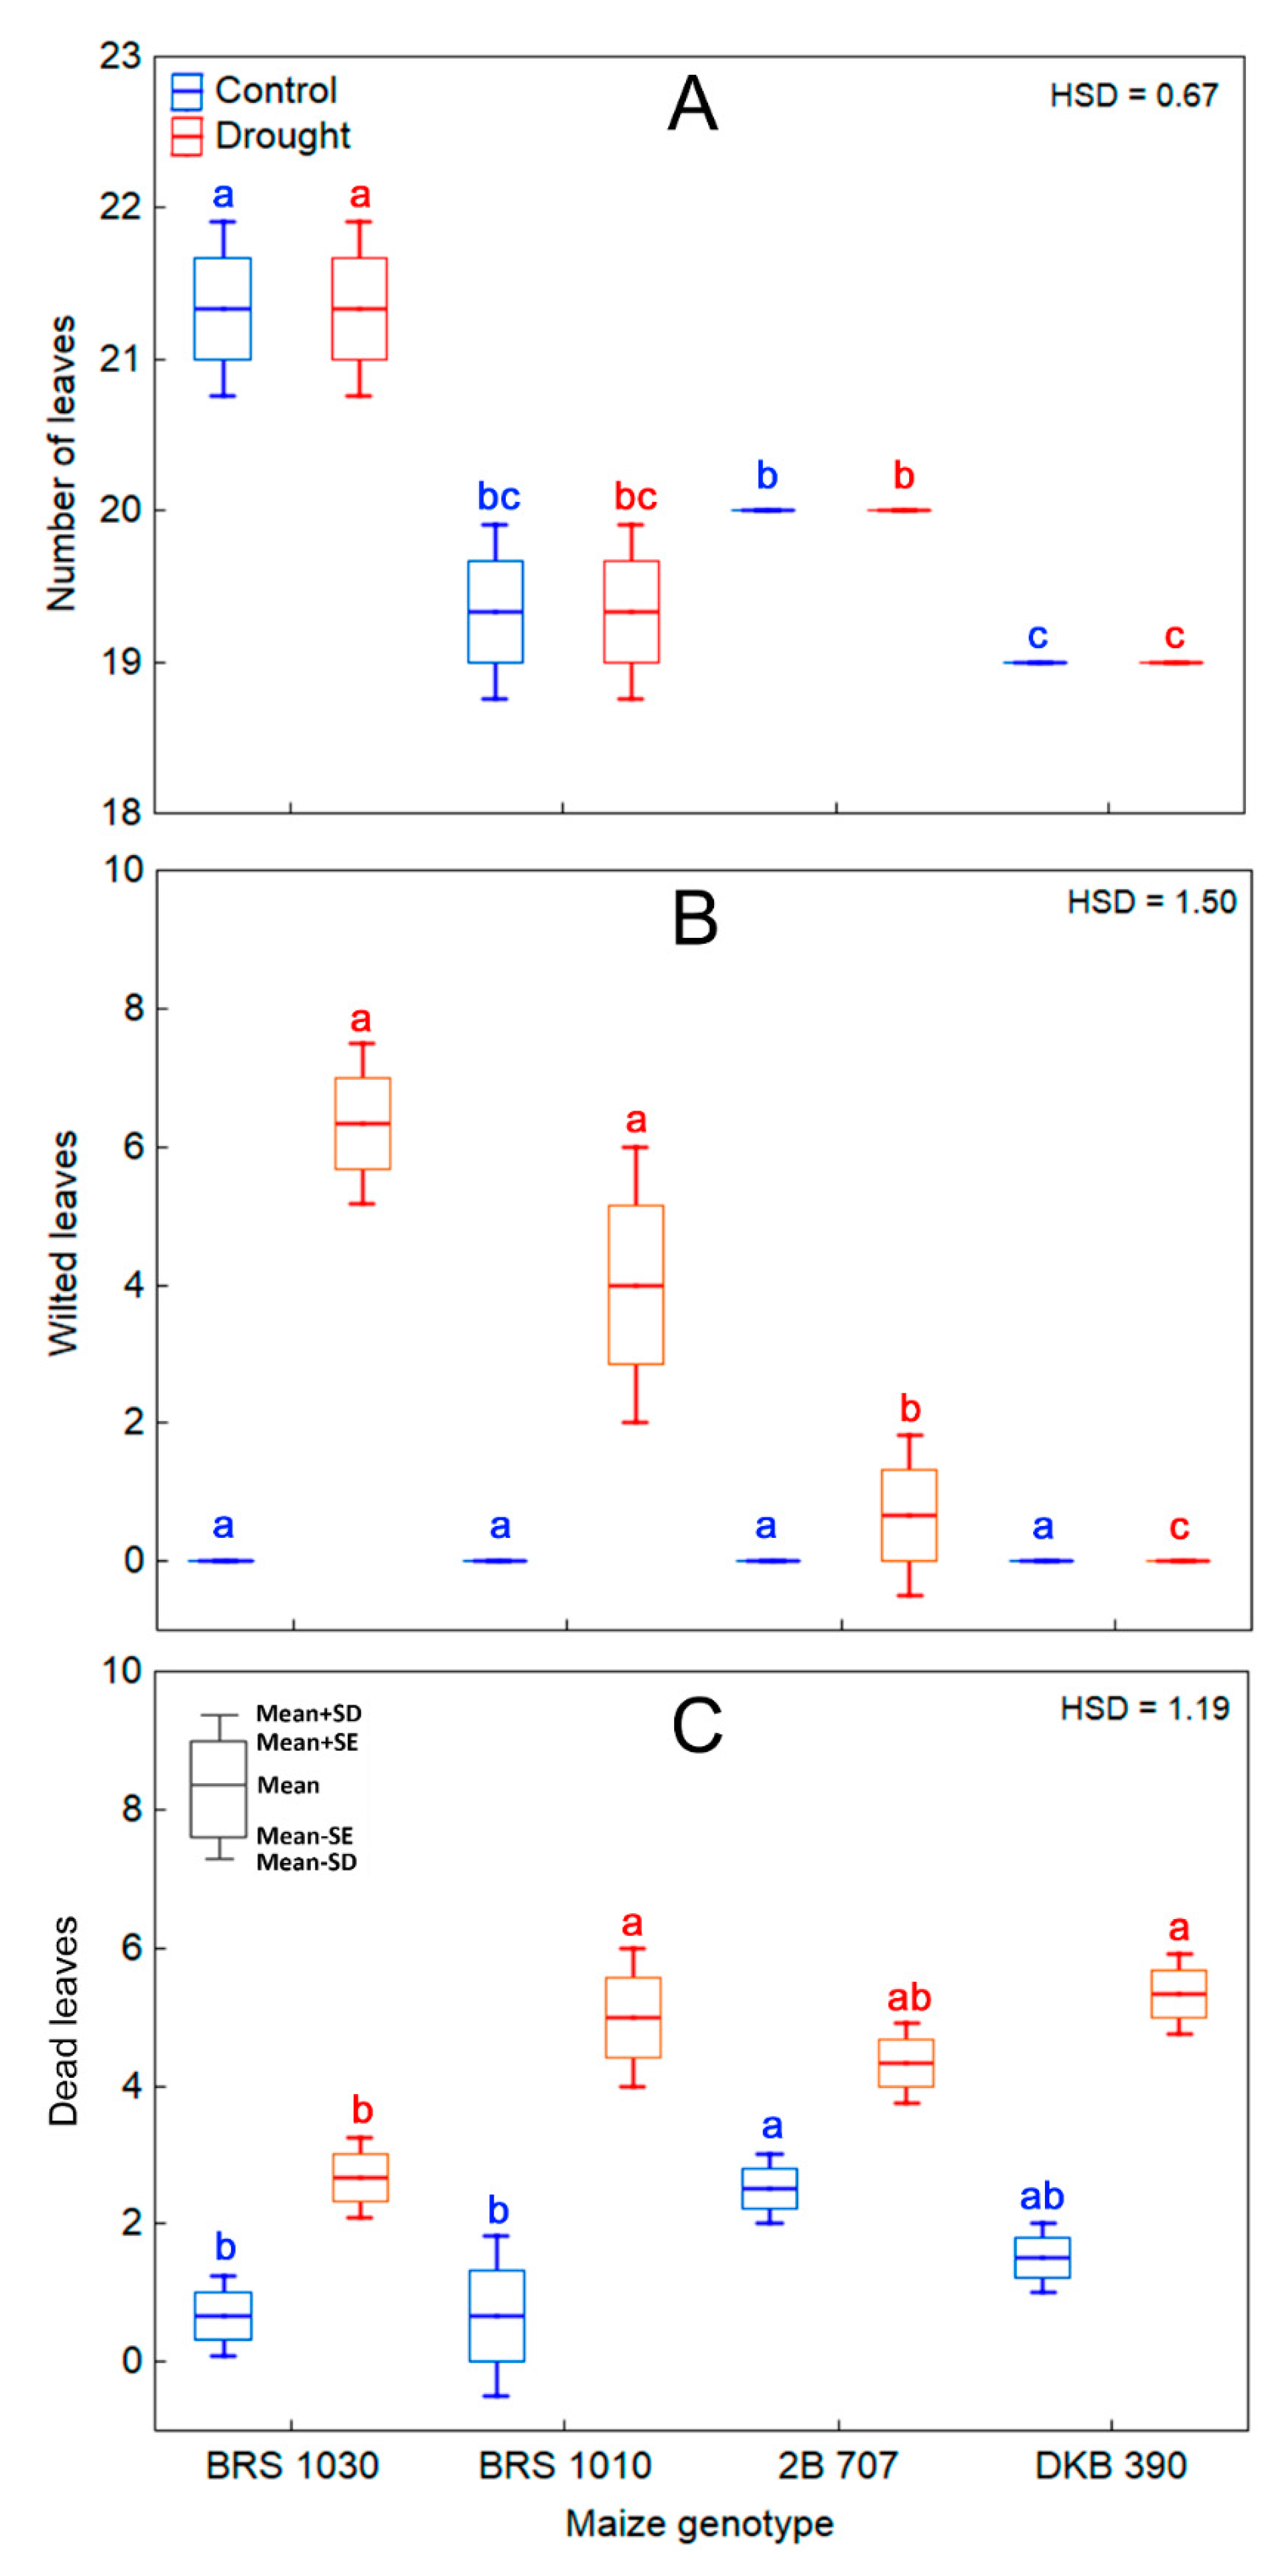
2.4. Water Deficit Stress and Its Effects on Maize Plant Leaf and Canopy Architecture
3. Discussion
3.1. Relationship Among Canopy Temperature, Gas Exchange, Leaf Water Content, Water Consumption, and Yield for Maize Plants under Water Restriction
3.2. Implications of Water Deficit Stress in the Plant Leaves and Canopy Architecture
4. Materials and Methods
4.1. Plant Material and Growth Conditions
4.2. Measured Variables
4.2.1. Soil and Leaf Water Content for Control and Drought Stress Maize Plants
4.2.2. Schedule for Gas Exchange and Thermal Imaging Measurement
4.2.3. Gas Exchange Measurements
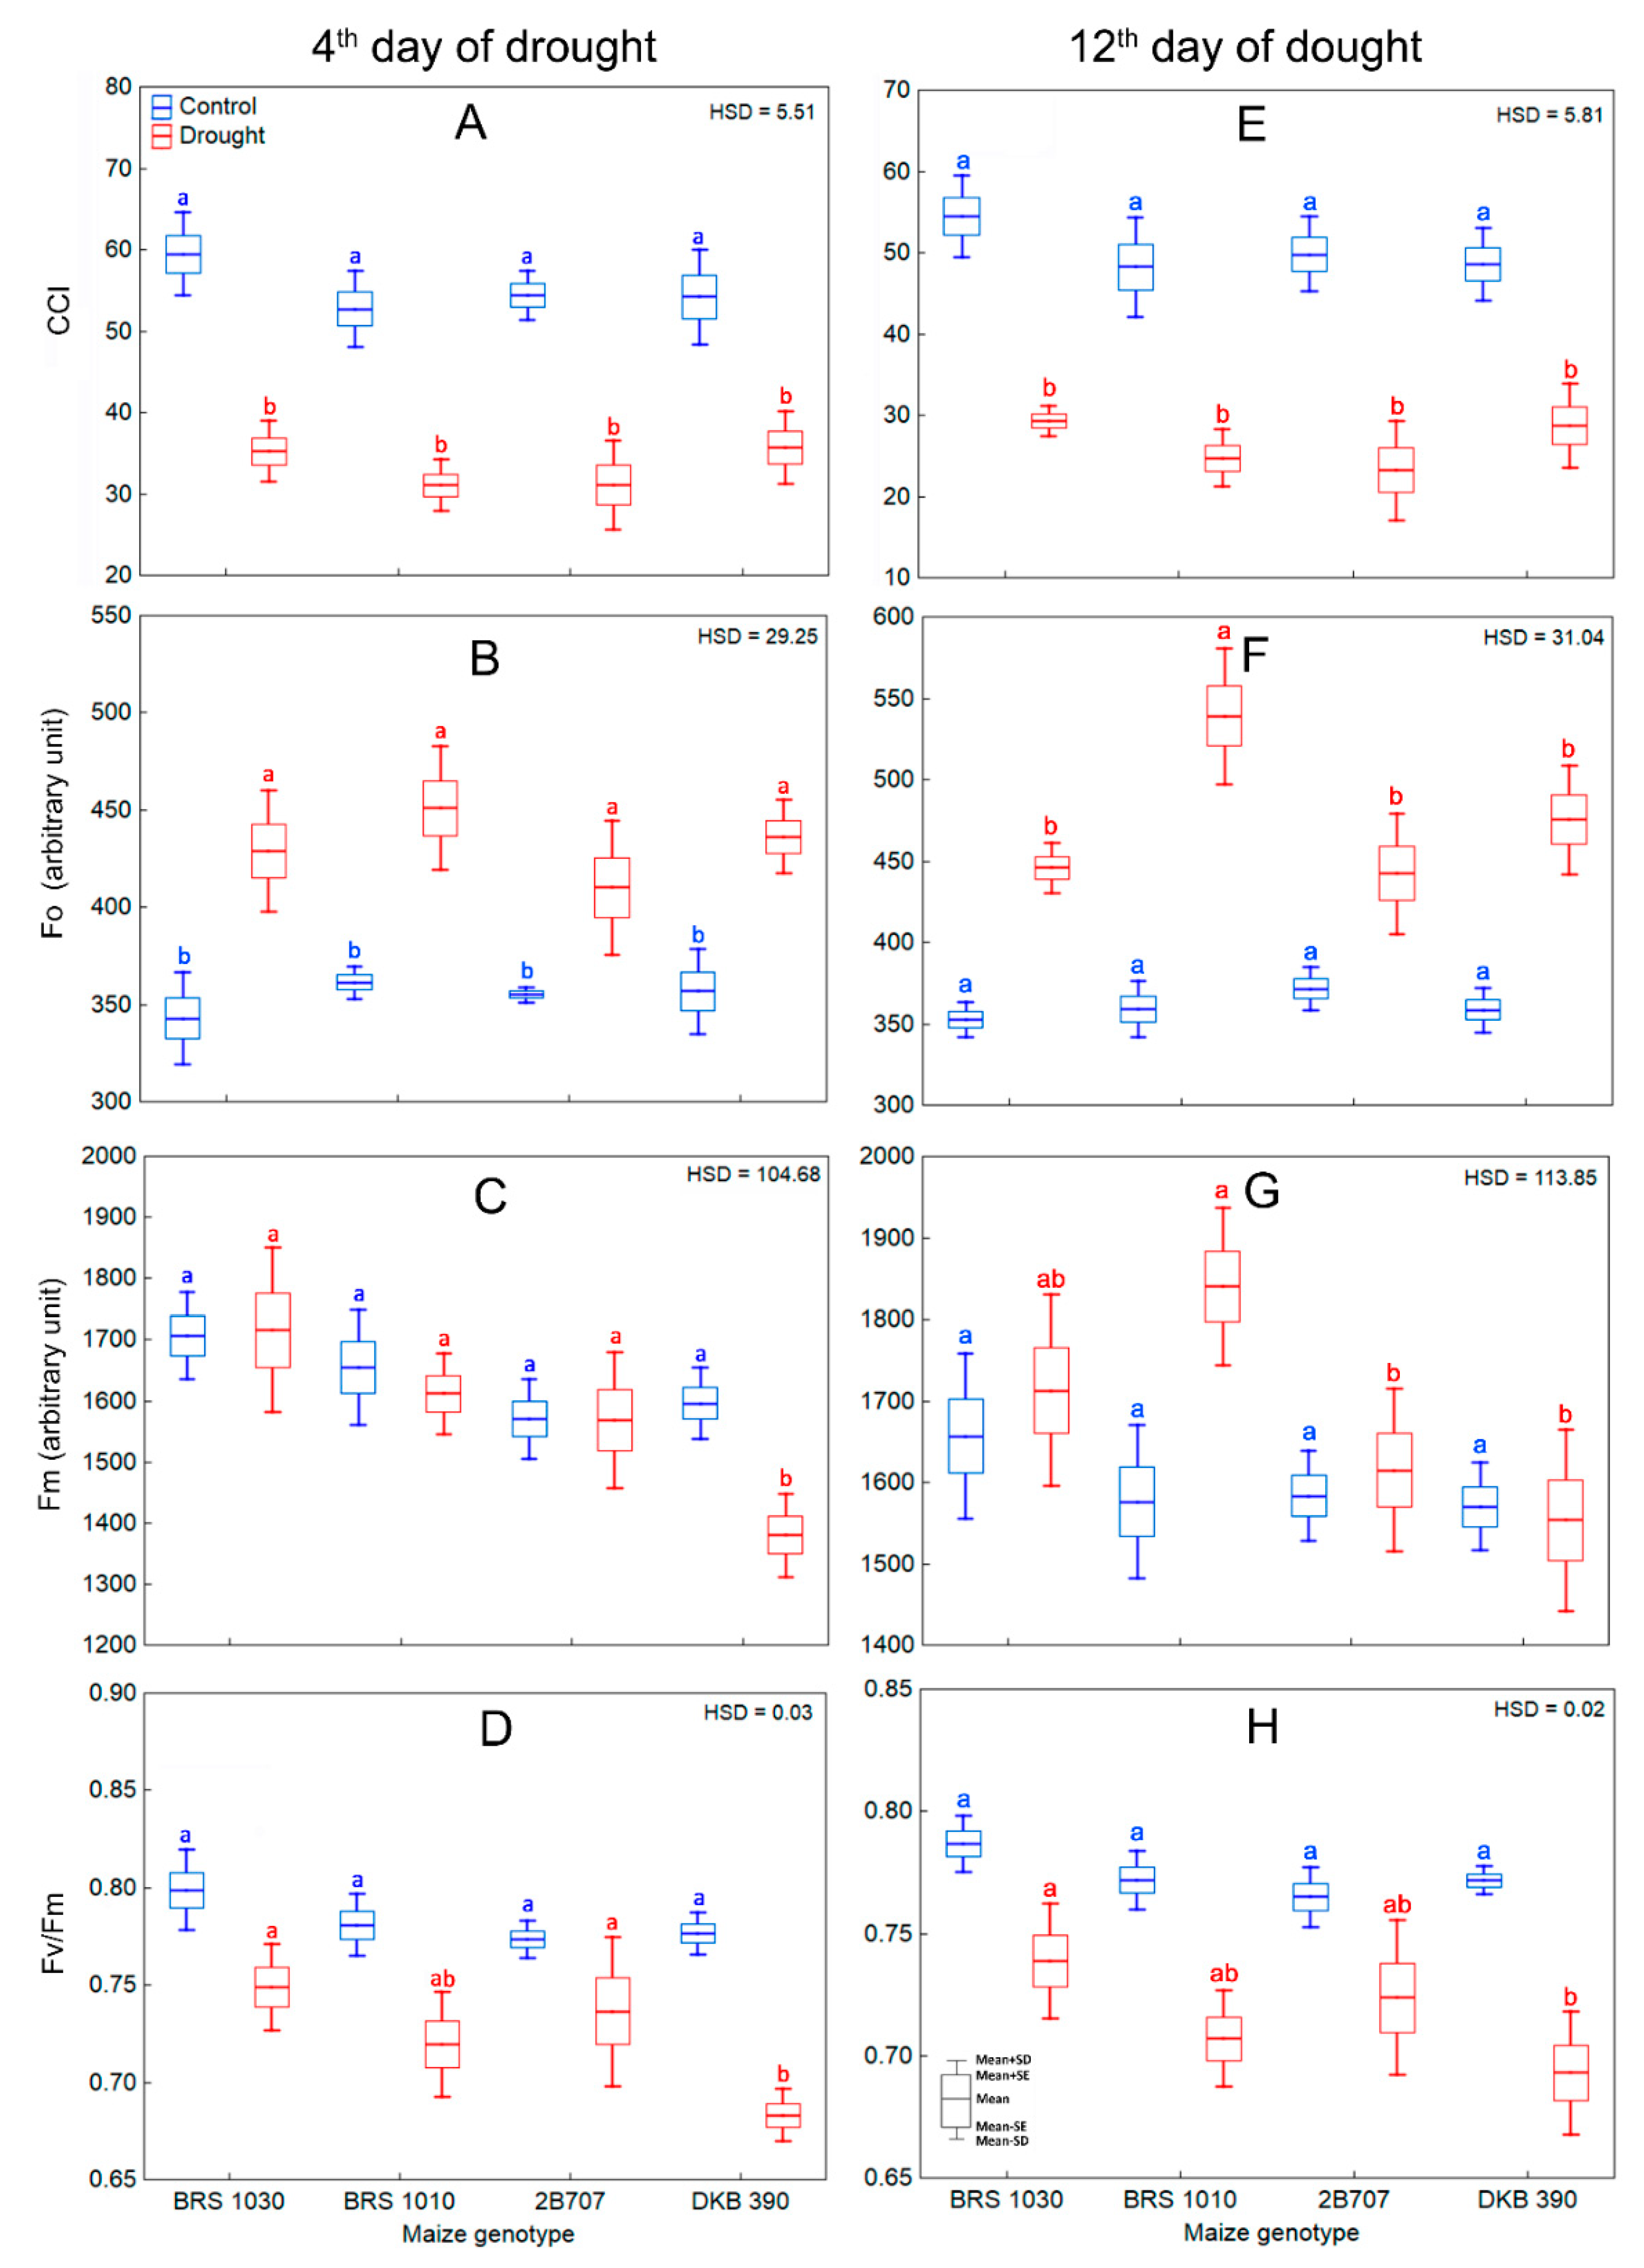
4.2.4. Chlorophyll Content Index and Chlorophyll Fluorescence Measures
4.2.5. Total, Wilted, and Dead Leaves
4.2.6. Thermal Image Capturing and Processing
4.2.7. Aboveground Biomass and Grain Yield
4.3. Experimental Design and Statistical Analysis
5. Conclusions
Supplementary Materials
Author Contributions
Funding
Acknowledgments
Conflicts of Interest
Abbreviations
| A | Net CO2 Assimilation Rate |
| AGB | Aboveground Biomass |
| AGL | Aboveground Level |
| BRS | An acronym that identifies materials from the breeding program led by Embrapa |
| CCI | Chlorophyll Content Index |
| Ci | Intercellular CO2 concentration |
| CNPMS | The National Maize and Sorghum Research Center |
| CT | Canopy Temperature |
| DKB | An acronym that identifies materials from the breeding program led by DEKALB |
| DWC | Daily Water Consumption |
| E | Transpiration rate |
| Embrapa | Brazilian Agricultural Research Corporation |
| Fm | Maximum quantum yield of dark-adapted leaf |
| F0 | Minimum quantum yield of dark-adapted leaf |
| Fv/Fm | Maximum quantum yield of photosystem II |
| gs | Stomatal conductance to water vapor |
| GY | Grain Yield |
| iWUE | Intrinsic Water Use Efficiency |
| LRWC | Leaf Relative Water Content |
| PSII | Photosystem II |
| RGB | Red, Green and Blue color model |
| SWC | Soil Water Content |
| UAV | Unmanned Aerial Vehicle |
References
- Araus, J.L.; Serret, M.D.; Edmeades, G.O. Phenotyping maize for adaptation to drought. Front. Physiol. 2012, 3, 305. [Google Scholar] [CrossRef]
- Tardieu, F. Any trait or trait-related allele can confer drought tolerance: Just design the right drought scenario. J. Exp. Bot. 2012, 63, 25–31. [Google Scholar] [CrossRef]
- Tuberosa, R. Phenotyping for drought tolerance of crops in the genomics era. Front. Physiol. 2012, 3, 347. [Google Scholar] [CrossRef]
- Harrison, M.T.; Tardieu, F.; Dong, Z.; Messina, C.D.; Hammer, G.L. Characterizing drought stress and trait influence on maize yield under current and future conditions. Glob. Chang. Biol. 2014, 20, 867–878. [Google Scholar] [CrossRef]
- Abberton, M.; Batley, J.; Bentley, A.; Bryant, J.; Cai, H.; Cockram, J.; Costa de Oliveira, A.; Cseke, L.J.; Dempewolf, H.; De Pace, C.; et al. Global agricultural intensification during climate change: A role for genomics. Plant Biotechnol. J. 2016, 14, 1095–1098. [Google Scholar] [CrossRef]
- Khan, A.; Sovero, V.; Gemenet, D. Genome-assisted breeding for drought resistance. Curr. Genom. 2016, 17, 330–342. [Google Scholar] [CrossRef]
- Anjum, S.A.; Ashraf, U.; Tanveer, M.; Khan, I.; Hussain, S.; Shahzad, B.; Zohaib, A.; Abbas, F.; Saleem, M.F.; Ali, I.; et al. Drought induced changes in growth, osmolyte accumulation and antioxidant metabolism of three maize hybrids. Front. Plant Sci. 2017, 8, 69. [Google Scholar] [CrossRef]
- Prasanna, B.M. Maize research-for-development scenario: Challenges and opportunities for Asia. In Proceedings of the 12th Asian Maize Conference and Expert Consultation on Maize for Food, Feed, Nutrition and Environmental Security, Bangkok, Thailand, 30 October–1 November 2014; Prasanna, B.M., Vivek, B.S., Sadananda, A.R., Jeffers, D.P., Zaidi, P.H., Boeber, C., Erenstein, O., Babu, R., Nair, S.K., Gerard, B., et al., Eds.; APAARI: Bangkok, Thailand; CIMMYT: Bangkok, Thailand; FAO: Bangkok, Thailand; Thailand Department of Agriculture: Bangkok, Thailand, 2014; pp. 2–11. [Google Scholar]
- Searchinger, T.; Heimlich, R.; Houghton, R.A.; Dong, F.; Elobeid, A.; Fabiosa, J.; Tokgoz, S.; Hayes, D.; Yu, T.H. Use of U.S. croplands for biofuels increases greenhouse gases through emissions from land-use change. Science 2008, 319, 1238–1240. [Google Scholar] [CrossRef]
- Goldemberg, J. The Brazilian biofuels industry. Biotechnol. Biofuels 2008, 1, 6. [Google Scholar] [CrossRef]
- Masuka, B.; Araus, J.L.; Das, B.; Sonder, K.; Cairns, J.E. Phenotyping for abiotic stress tolerance in maize. J. Integr. Plant Biol. 2012, 54, 238–249. [Google Scholar] [CrossRef]
- Almeida, G.D.; Makumbi, D.; Magorokosho, C.; Nair, S.; Borém, A.; Ribaut, J.-M.; Bänziger, M.; Prasanna, B.M.; Crossa, J.; Babu, R. QTL mapping in three tropical maize populations reveals a set of constitutive and adaptive genomic regions for drought tolerance. Theor. Appl. Genet. 2013, 126, 583–600. [Google Scholar] [CrossRef]
- Adee, E.; Roozeboom, K.; Balboa, G.R.; Schlegel, A.; Ciampitti, I.A. Drought-tolerant corn hybrids yield more in drought-stressed environments with no penalty in non-stressed environments. Front. Plant Sci. 2016, 7, 1534. [Google Scholar] [CrossRef] [PubMed]
- Tesfaye, K.; Kruseman, G.; Cairns, J.E.; Zaman-Allah, M.; Wegary, D.; Zaidi, P.H.; Boote, K.J.; Rahut, D.; Erenstein, O. Potential benefits of drought and heat tolerance for adapting maize to climate change in tropical environments. Clim. Risk Manag. 2018, 19, 106–109. [Google Scholar] [CrossRef]
- Sirault, X.R.R.; James, R.A.; Furbank, R.T. A new screening method for osmotic component of salinity tolerance in cereals using infrared thermography. Funct. Plant Biol. 2009, 36, 970–977. [Google Scholar] [CrossRef]
- Romano, G.; Zia, S.; Spreer, W.; Sanchez, C.; Cairns, J.; Araus, J.L.; Müller, J. Use of thermography for high throughput phenotyping of tropical maize adaptation in water stress. Comput. Electron. Agric. 2011, 79, 67–74. [Google Scholar] [CrossRef]
- Prashar, A.; Yildiz, J.; McNicol, J.W.; Bryan, G.J.; Jones, H.G. Infra-red thermography for high throughput field phenotyping in Solanum tuberosum. PLoS ONE 2013, 8, 6. [Google Scholar] [CrossRef]
- Liu, Y.; Subhash, C.; Yan, J.; Song, C.; Zhao, J.; Li, J. Maize leaf temperature responses to drought: Thermal imaging and quantitative trait loci (QTL) mapping. Environ. Exp. Bot. 2011, 71, 158–165. [Google Scholar] [CrossRef]
- Rebetzke, G.J.; Rattey, A.R.; Farquhar, G.D.; Richards, R.A.; Condon, A.G. Genomic regions for canopy temperature and their genetic association with stomatal conductance and grain yield in wheat. Funct. Plant Biol. 2013, 40, 14–33. [Google Scholar] [CrossRef]
- Zia, S.; Romano, G.; Spreer, W.; Sanchez, C.; Cairns, J.; Araus, J.L.; Müller, J. Infrared thermal imaging as a rapid tool for identifying water-stress tolerant maize genotypes of different phenology. J. Agron. Crop Sci. 2013, 199, 75–84. [Google Scholar] [CrossRef]
- Liebisch, F.; Kirchgessner, N.; Schneider, D.; Walter, A.; Hund, A. Remote, aerial phenotyping of maize traits with a mobile multi-sensor approach. Plant Methods 2015, 11, 9. [Google Scholar] [CrossRef]
- Deery, D.M.; Rebetzke, G.J.; Jimenez-Berni, J.A.; James, R.A.; Condon, A.G.; Bovill, W.D.; Hutchinson, P.; Scarrow, J.; Davy, R.; Furbank, R.T. Methodology for high-throughput field phenotyping of canopy temperature using airborne thermography. Front. Plant Sci. 2016, 7, 1808. [Google Scholar] [CrossRef]
- Merlot, S.; Mustilli, A.-C.; Genty, B.; North, H.; Lefebvre, V.; Sotta, B.; Vavasseur, A.; Giraudat, J. Use of infrared thermal imaging to isolate Arabidopsis mutants defective in stomatal regulation. Plant J. 2002, 30, 601–609. [Google Scholar] [CrossRef] [PubMed]
- García-Tejero, I.F.; Hernández-Cotán, A.; Apolo, O.E.; Durán-Zuazo, V.H.; Portero, M.A.; Rubio-Casal, A.E. Infrared thermography to select commercial varieties of maize in relation to drought adaptation. Quant. InfraRed Thermogr. J. 2017, 14, 54–67. [Google Scholar] [CrossRef]
- Chaves, M.M.; Pereira, J.S.; Maroco, J.; Rodrigues, M.L.; Ricardo, C.P.P.; Osorio, M.L.; Carvalho, I.; Faria, T.; Pinheiro, C. How plants cope with water stress in the field. Photosynthesis and growth. Ann. Bot. 2002, 89, 907–916. [Google Scholar] [CrossRef]
- Xu, Z.; Zhou, G. Responses of leaf stomatal density to water status and its relationship with photosynthesis in a grass. J. Exp. Bot. 2008, 59, 3317–3325. [Google Scholar] [CrossRef] [PubMed]
- Fraire-Velázquez, S.; Balderas-Hernández, V.E. Abiotic stress in plants and metabolic responses. In Abiotic Stress—Plant Responses and Applications in Agriculture; Vahdati, K., Leslie, C., Eds.; INTech: Rijeka, Croatia, 2013; pp. 25–48. [Google Scholar]
- Costa, J.M.; Grant, O.M.; Chaves, M.M. Thermography to explore plant–environment interactions. J. Exp. Bot. 2013, 64, 3937–3949. [Google Scholar] [CrossRef]
- Jones, H.G.; Serraj, R.; Loveys, B.R.; Xiong, L.; Wheaton, A.; Price, A.H. Thermal infrared image of crop canopies for the remote diagnosis and quantification of plant responses to water stress in the field. Funct. Plant Biol. 2009, 36, 978–989. [Google Scholar] [CrossRef]
- Jones, H.G.; Stoll, M.; Santos, T.; Sousa, C.; Chaves, M.M.; Grant, O.M. Use of infrared thermography for monitoring stomatal closure in the field: Application to grapevine. J. Exp. Bot. 2002, 53, 2249–2260. [Google Scholar] [CrossRef]
- Leinonen, I.; Jones, H.G. Combining thermal and visible imagery for estimating canopy temperature and identifying plant stress. J. Exp. Bot. 2004, 55, 1423–1431. [Google Scholar] [CrossRef]
- Munns, R.; James, R.A.; Sirault, X.R.R.; Furbank, R.T.; Jones, H.G. New phenotyping methods for screening wheat and barley for beneficial responses to water deficit. J. Exp. Bot. 2010, 61, 3499–3507. [Google Scholar] [CrossRef]
- Prashar, A.; Jones, H.G. Infra-red thermography as a high-throughput tool for field phenotyping. Agronomy 2014, 4, 397–417. [Google Scholar] [CrossRef]
- McClendon, J.H. The micro-optics of leaves. I. Patterns of reflection from the epidermis. Am. J. Bot. 1984, 71, 1391–1397. [Google Scholar] [CrossRef]
- Zia, S.; Sophrer, K.; Wenyong, D.; Spreer, W.; Romano, G.; He, X.; Joachim, M. Monitoring physiological responses to water stress in two maize varieties by infrared thermography. Int. J. Agric. Biol. Eng. 2011, 4, 7–15. [Google Scholar]
- Kadioglu, A.; Terzi, R.; Saruhan, N.; Saglam, A. Current advances in the investigation of leaf rolling caused by biotic and abiotic stress factors. Plant Sci. 2012, 182, 42–48. [Google Scholar] [CrossRef] [PubMed]
- Saglam, A.; Kadioglu, A.; Demiralay, M.; Terzi, R. Leaf rolling reduces photosynthetic loss in maize under severe drought. Acta Bot. Croat. 2014, 73, 315–323. [Google Scholar] [CrossRef]
- Kothari, S.; Cavender-Bares, J.; Bitan, K.; Verhoeven, A.S.; Wang, R.; Montgomery, R.A.; Gamon, J. Community-wide consequences of variation in photoprotective physiology among prairie plants. Photosynthetica 2018, 56, 455–467. [Google Scholar] [CrossRef]
- Medrano, H.; Tomás, M.; Martorell, S.; Flexas, J.; Hernández, E.; Rosselló, J.; Pou, A.; Escalona, J.-M.; Bota, J. From leaf to whole-plant water use efficiency (WUE) in complex canopies: Limitations of leaf WUE as a selection target. Crop J. 2015, 3, 220–228. [Google Scholar] [CrossRef]
- Shareef, M.; Gui, D.; Zeng, F.; Ahmed, Z.; Waqas, M.; Zhang, B.; Iqbal, H.; Fiaz, M. Impact of drought on assimilates partitioning associated fruiting physiognomies and yield quality attributes of desert grown cotton. Acta Physiol. Plant. 2018, 40, 71. [Google Scholar] [CrossRef]
- Souza, T.C.; Castro, E.M.; Magalhães, P.C.; Lino, L.O.; Alves, E.T.; Albuquerque, P.E.P. Morphophysiology, morpho-anatomy and grain yield under field conditions for two maize hybrids with contrasting response to drought stress. Acta Physiol. Plant. 2013, 35, 3201–3211. [Google Scholar] [CrossRef]
- Ávila, R.G.; Magalhães, P.C.; Alvarenga, A.A.; Lavinski, A.O.; Campos, C.N.; Souza, T.C.; Gomes Júnior, C.C. Drought-tolerant maize genotypes invest in root system and maintain high harvest index during water stress. Braz. J. Maize Sorghum 2016, 15, 451–461. [Google Scholar]
- Woo, N.S.; Badger, M.R.; Pogson, B.J. A rapid, non-invasive procedure for quantitative assessment of drought survival using chlorophyll fluorescence. Plant Methods 2008, 4, 27. [Google Scholar] [CrossRef]
- Blum, A.; Shpiler, L.; Golan, G.; Mayer, J. Yield stability and canopy temperature of wheat genotypes under drought-stress. Field Crops Res. 1989, 22, 289–296. [Google Scholar] [CrossRef]
- DeJonge, K.C.; Taghvaeian, S.; Trout, T.J.; Comas, L.H. Comparison of canopy temperature-based water stress indices for maize. Agric. Water Manag. 2015, 156, 51–62. [Google Scholar] [CrossRef]
- Vadez, V.; Kholova, J.; Medina, S.; Kakkera, A.; Anderberg, H. Transpiration efficiency: New insights into an old story. J. Exp. Bot. 2014, 65, 6141–6153. [Google Scholar] [CrossRef]
- Usamentiaga, R.; Venegas, P.; Guerediaga, J.; Vega, L.; Molleda, J.; Bulnes, F.G. Infrared thermography for temperature measurement and non-destructive testing. Sensors 2014, 14, 12305–12348. [Google Scholar] [CrossRef]
- Lagouarde, J.P.; Kerr, Y.H.; Bruneta, Y. An experimental study of angular effects on surface temperature for various plant canopies and bare soils. Agric. For. Meteorol. 1995, 77, 167–190. [Google Scholar] [CrossRef]
- Schanda, J. Colorimetry: Understanding the CIE System; John Wiley & Sons: Hoboken, NJ, USA, 2007; 467p. [Google Scholar]
- Comaniciu, D.; Meer, P. Mean shift: A robust approach toward feature space analysis. IEEE Trans. Pattern Anal. 2002, 24, 603–619. [Google Scholar] [CrossRef]
- Dougherty, E.R. Mathematical Morphology in Image Processing; Marcel Dekker: New York, NY, USA, 1992. [Google Scholar]
- Hartley, R.; Zisserman, A. Multiple View Geometry in Computer Vision, 2nd ed.; Cambridge University Press: Cambridge, UK, 2003; 655p. [Google Scholar]
- Pedregosa, F.; Varoquaux, G.; Gramfort, A.; Michel, V.; Thirion, B.; Grisel, O.; Blondel, M.; Prettenhofer, P.; Weiss, R.; Dubourg, V.; et al. Scikit-learn: Machine learning in Python. J. Mach. Learn. Res. 2011, 12, 2825–2830. [Google Scholar]
- Mukaka, M.M. Statistics Corner: A guide to appropriate use of Correlation coefficient in medical research. Malawi Med. J. 2012, 24, 69–71. [Google Scholar]


© 2019 by the authors. Licensee MDPI, Basel, Switzerland. This article is an open access article distributed under the terms and conditions of the Creative Commons Attribution (CC BY) license (http://creativecommons.org/licenses/by/4.0/).
Share and Cite
Casari, R.A.C.N.; Paiva, D.S.; Silva, V.N.B.; Ferreira, T.M.M.; Souza, Junior, M.T.; Oliveira, N.G.; Kobayashi, A.K.; Molinari, H.B.C.; Santos, T.T.; Gomide, R.L.; et al. Using Thermography to Confirm Genotypic Variation for Drought Response in Maize. Int. J. Mol. Sci. 2019, 20, 2273. https://doi.org/10.3390/ijms20092273
Casari RACN, Paiva DS, Silva VNB, Ferreira TMM, Souza, Junior MT, Oliveira NG, Kobayashi AK, Molinari HBC, Santos TT, Gomide RL, et al. Using Thermography to Confirm Genotypic Variation for Drought Response in Maize. International Journal of Molecular Sciences. 2019; 20(9):2273. https://doi.org/10.3390/ijms20092273
Chicago/Turabian StyleCasari, Raphael A. C. N., Dayane S. Paiva, Vivianny N. B. Silva, Thalita M. M. Ferreira, Manoel T. Souza, Junior, Nelson G. Oliveira, Adilson K. Kobayashi, Hugo B. C. Molinari, Thiago T. Santos, Reinaldo L. Gomide, and et al. 2019. "Using Thermography to Confirm Genotypic Variation for Drought Response in Maize" International Journal of Molecular Sciences 20, no. 9: 2273. https://doi.org/10.3390/ijms20092273
APA StyleCasari, R. A. C. N., Paiva, D. S., Silva, V. N. B., Ferreira, T. M. M., Souza, Junior, M. T., Oliveira, N. G., Kobayashi, A. K., Molinari, H. B. C., Santos, T. T., Gomide, R. L., Magalhães, P. C., & Sousa, C. A. F. (2019). Using Thermography to Confirm Genotypic Variation for Drought Response in Maize. International Journal of Molecular Sciences, 20(9), 2273. https://doi.org/10.3390/ijms20092273