Monocyte Chemoattractant Protein-1, a Possible Biomarker of Multiorgan Failure and Mortality in Ventilator-Associated Pneumonia


Abstract
1. Introduction
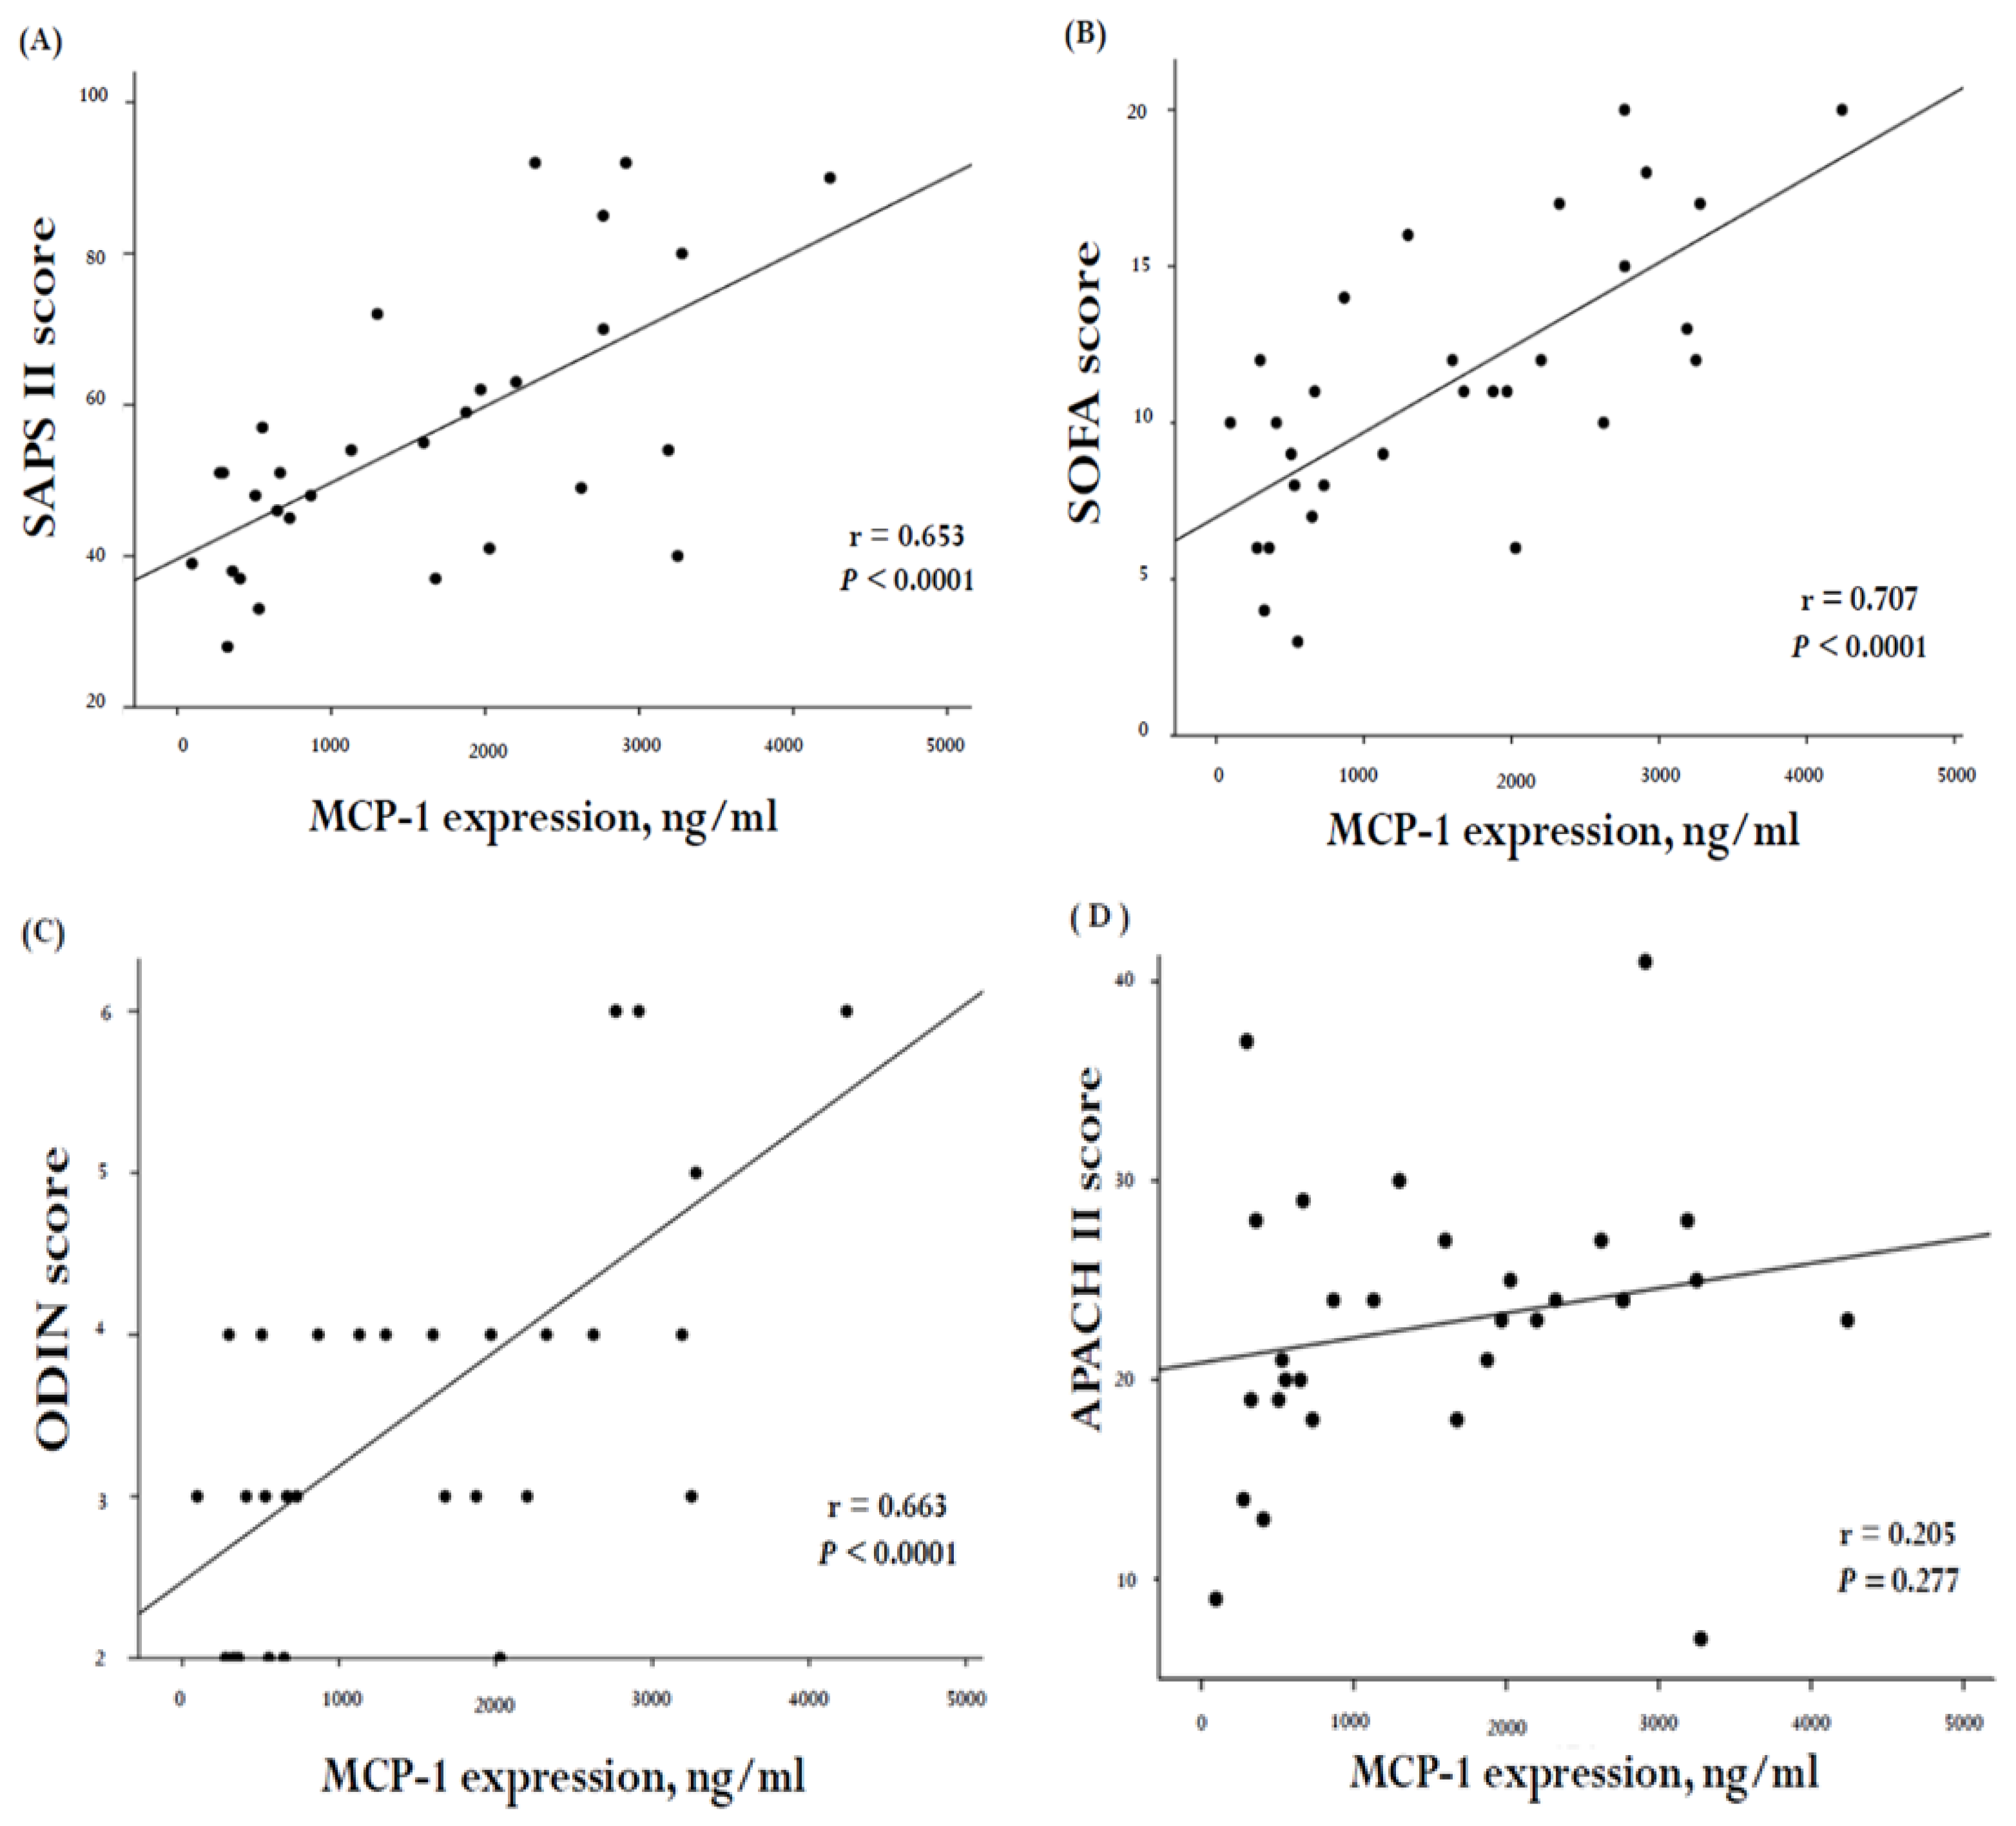
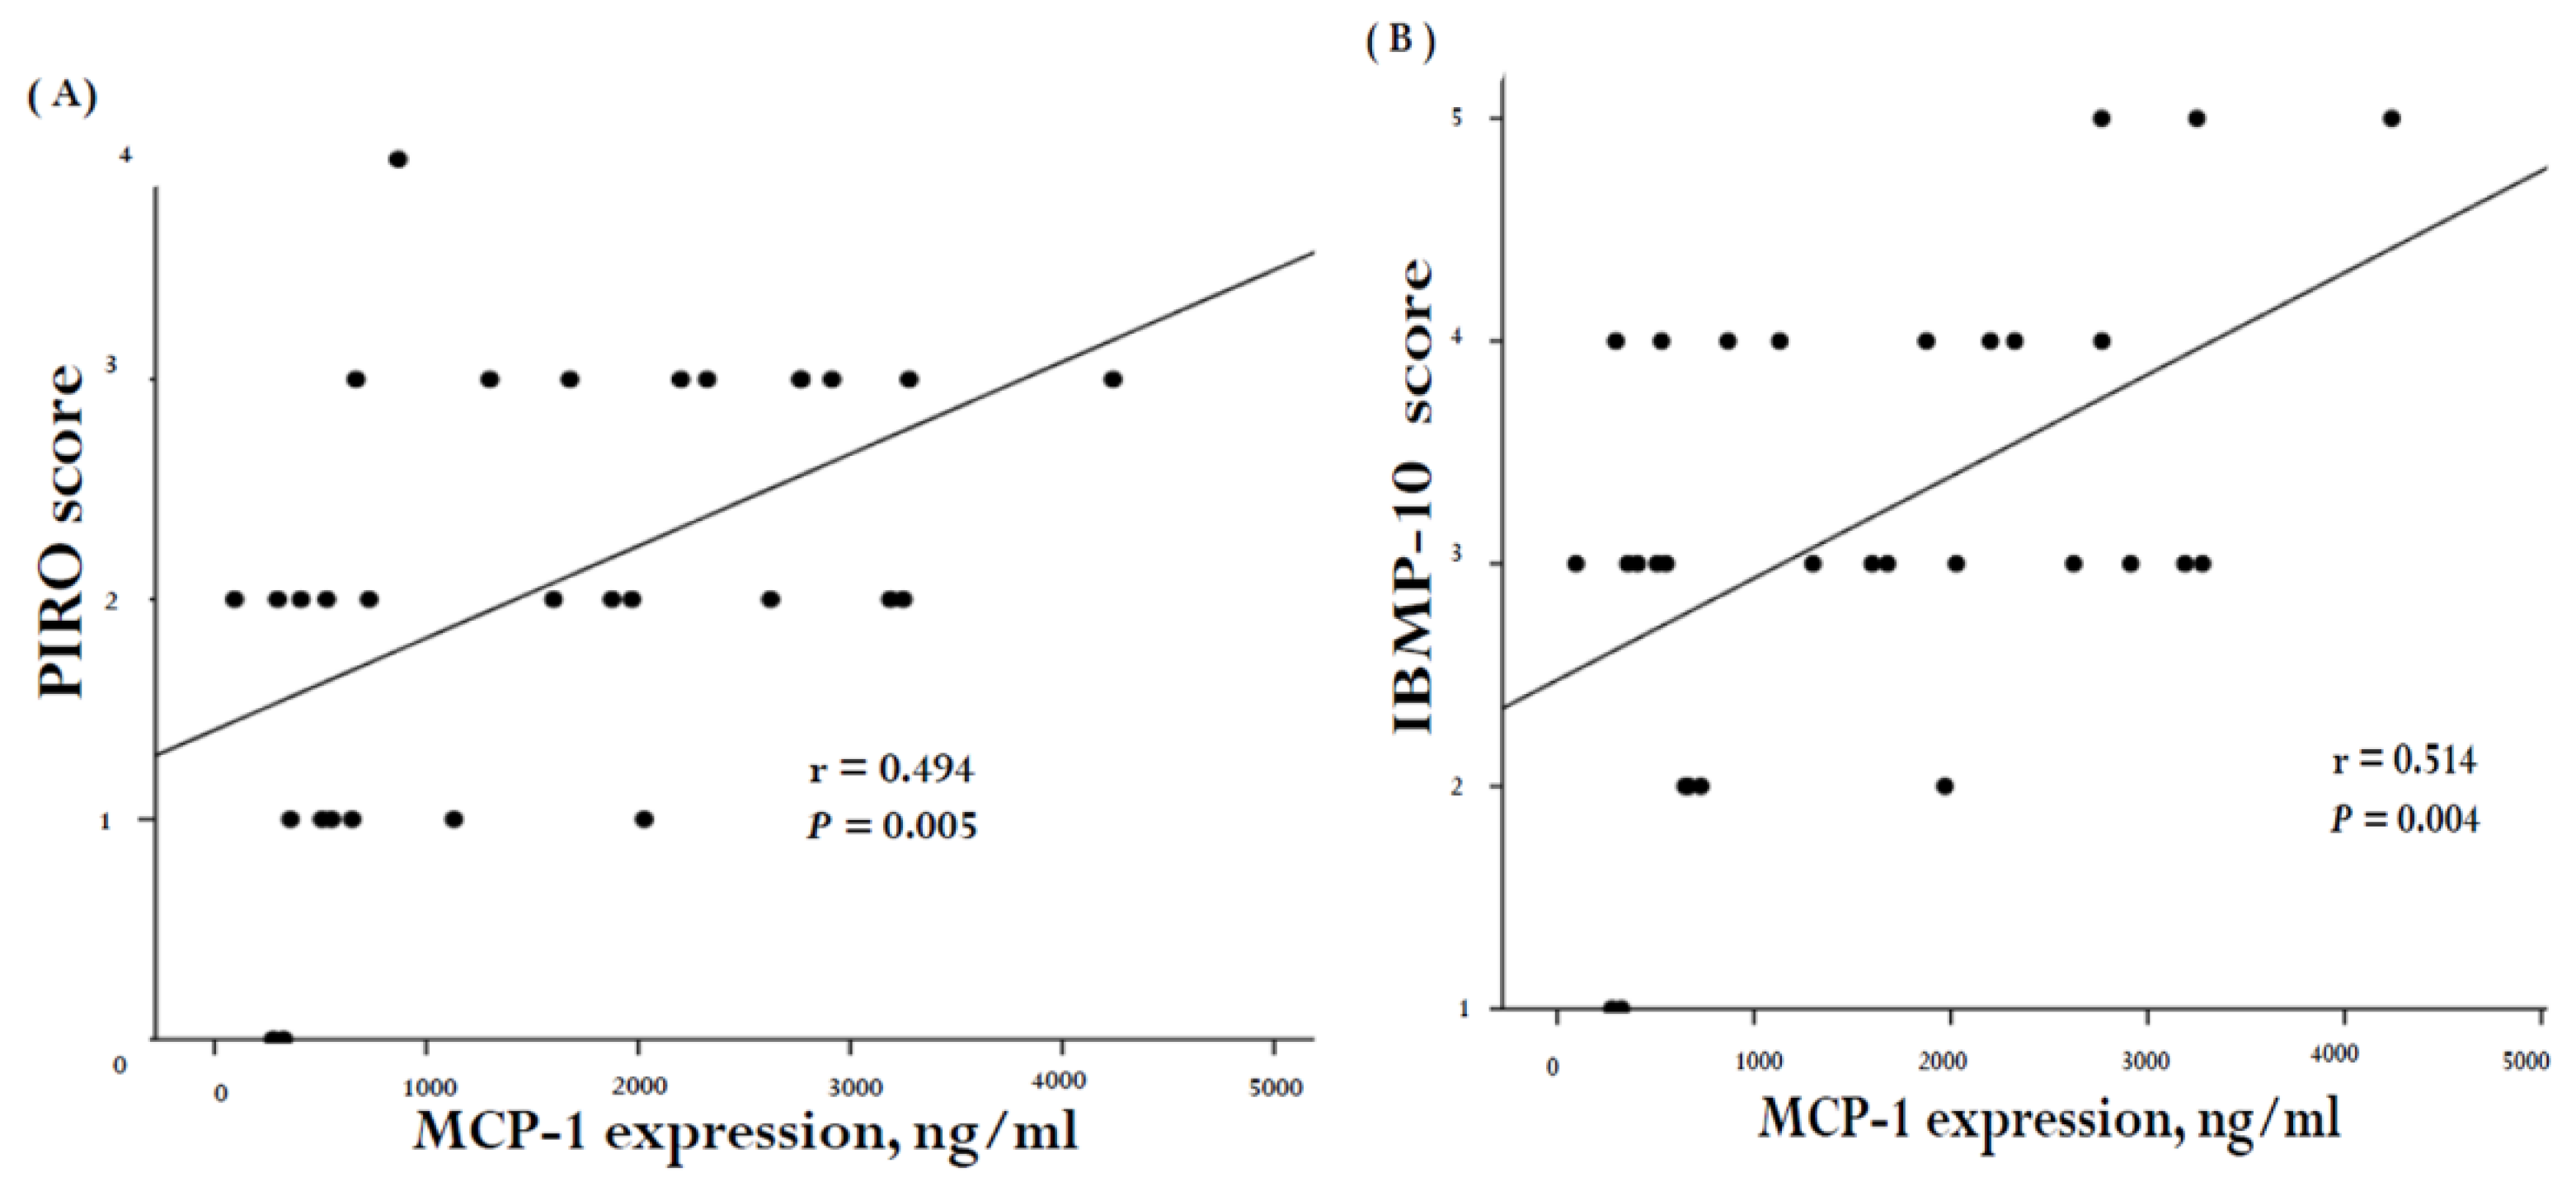
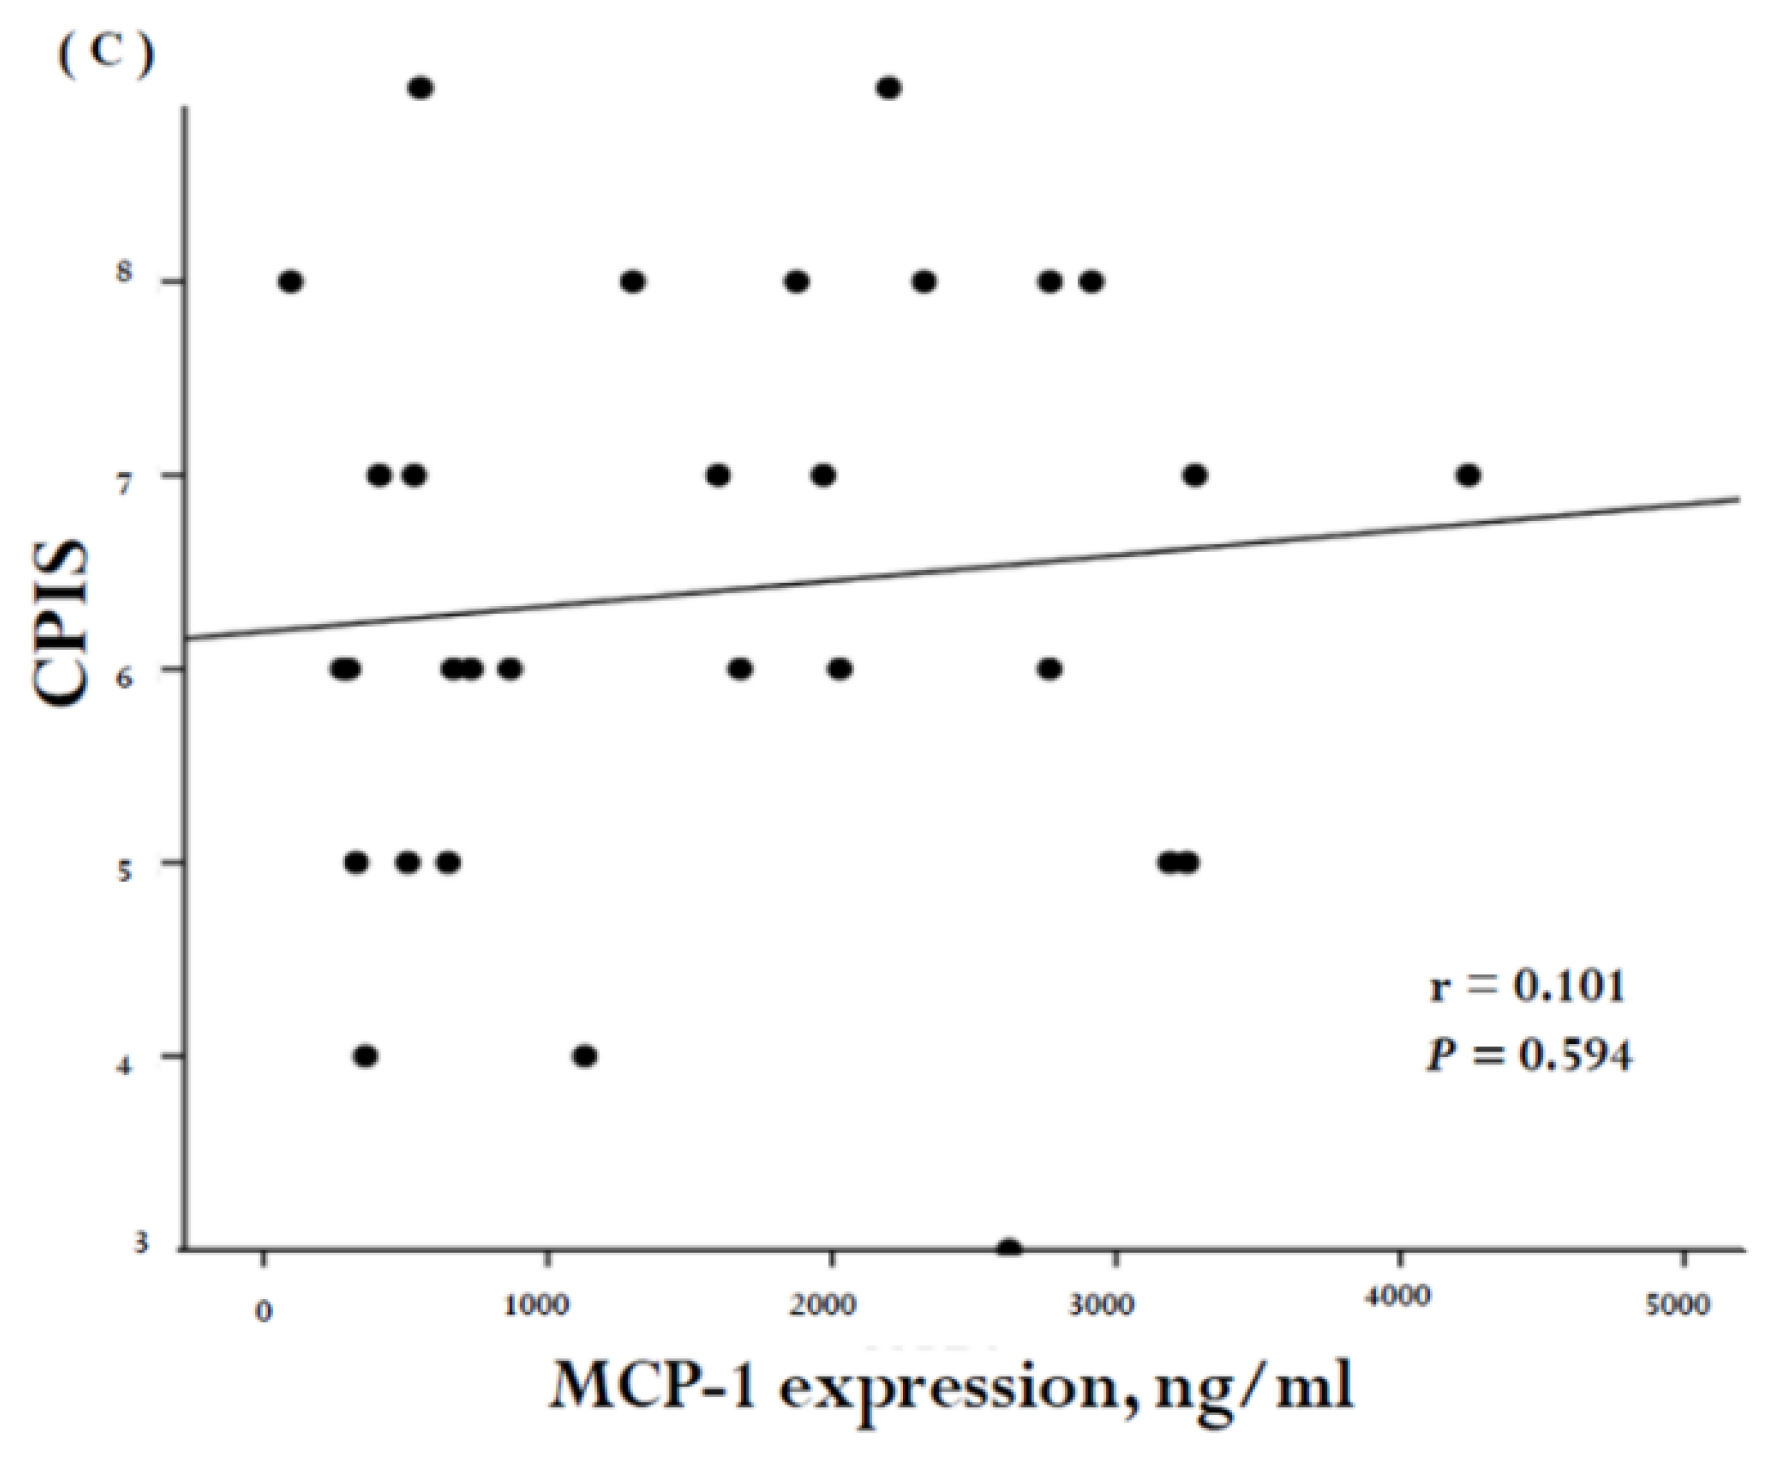
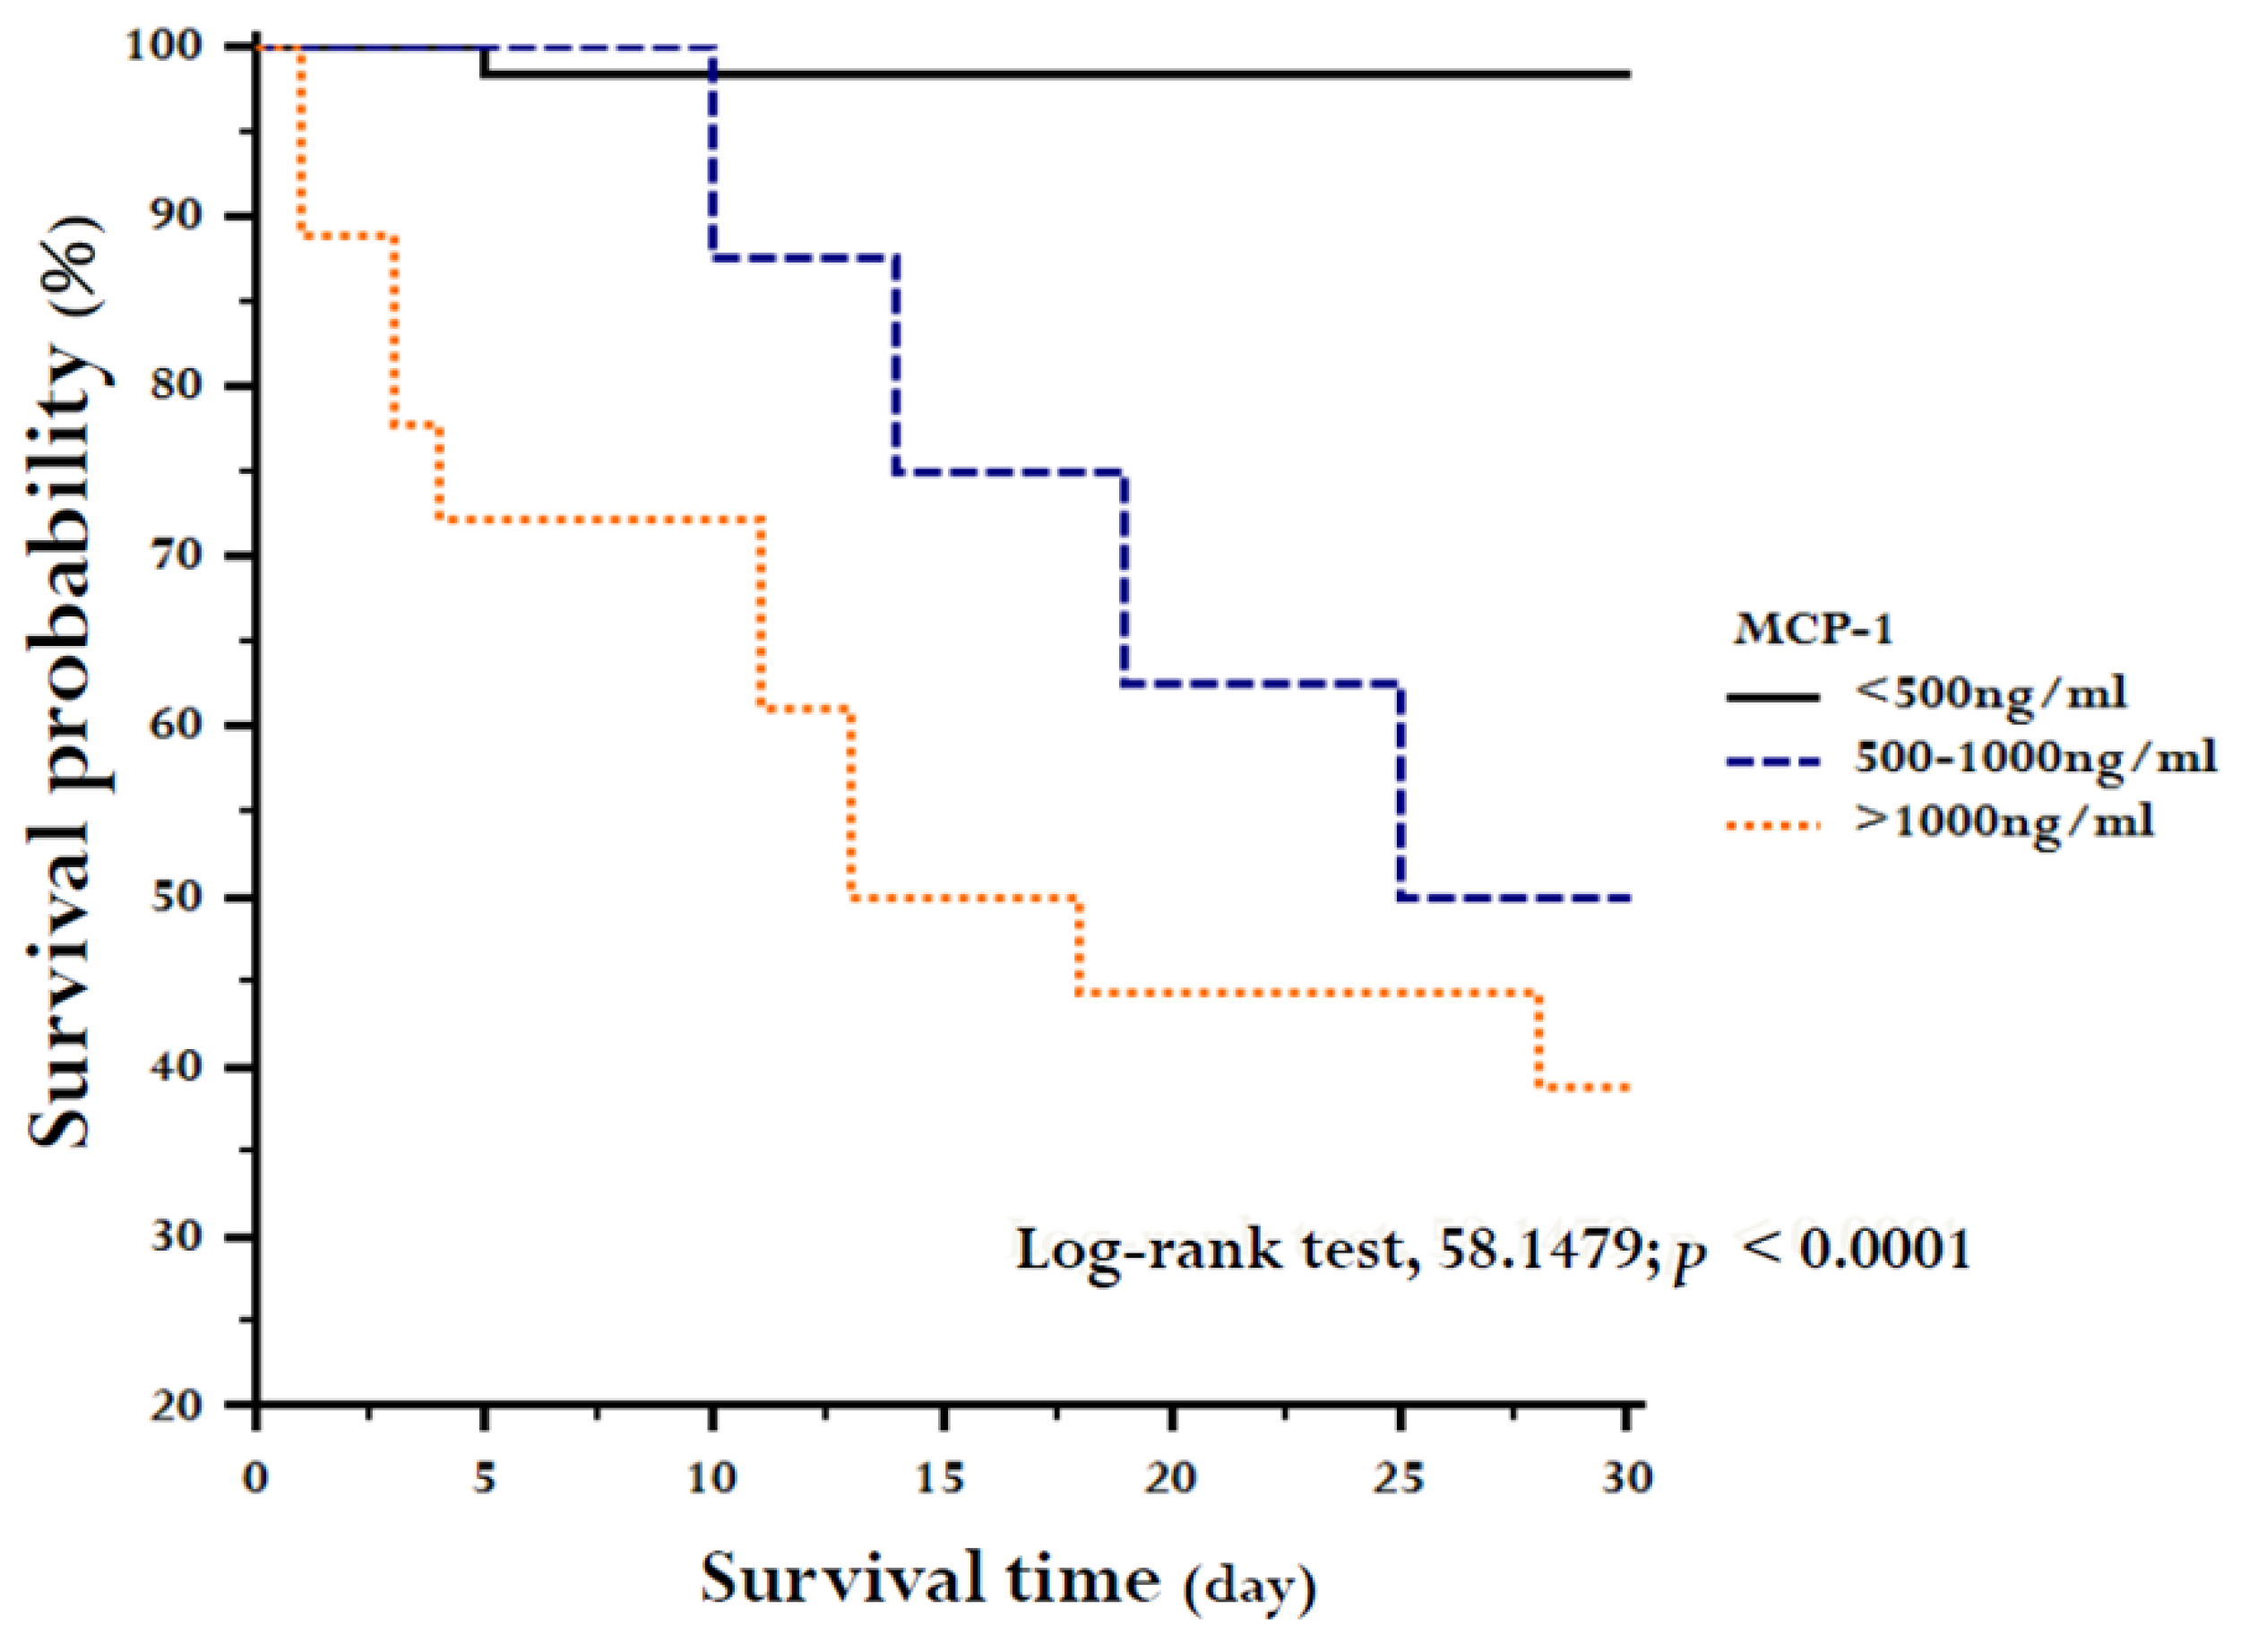
2. Results
3. Discussion
4. Materials and Methods
4.1. Study Design and Definition
4.2. Data and Blood Sample Collection
4.3. Measurement of Plasma MCP-1 Levels
4.4. Statistical Analysis
5. Conclusions
Author Contributions
Conflicts of Interest
Abbreviations
| APACH II | Acute Physiology and Chronic Health Evaluation II |
| ARDS | adult respiratory distress syndrome |
| AUC | area under the ROC curve |
| CCL2 | chemokine C–C motif ligand-2 |
| CCR2 | chemokine C–C motif receptor-2 |
| CPIS | clinical pulmonary infection score |
| CRP | C-reactive protein |
| CVA | cerebral vascular accident |
| ELISA | enzyme-linked immunosorbent assay |
| ICU | intensive care unit |
| LIS | lung injury scores |
| MCP-1 | monocyte chemoattractant protein-1 |
| MMP | matrix metalloproteinase |
| ODIN | organ dysfunctions and/or infection |
| OI | oxygenation index |
| PEEP | positive end-expiratory pressure |
| P/F ration | PaO2/FiO2 ration |
| ROC | receiver operating characteristic |
| SAPS II | simplified acute physiology score II |
| SOFA | Sequential Organ Failure Assessment score |
| SQ-EA | semiquantitative endotracheal aspirates |
| VAP | ventilator-associated pneumonia |
| WBC | white blood cells |
References
- Kalil, A.C.; Metersky, M.L.; Klompas, M.; Muscedere, J.; Sweeney, D.A.; Palmer, L.B.; Napolitano, L.M.; O’Grady, N.P.; Bartlett, J.G.; Carratalà, J.; et al. Management of adults with hospital-acquired and ventilator-associated pneumonia: 2016 clinical practice guidelines by the infectious diseases society of america and the american thoracic society. Clin. Infect. Dis. 2016, 63, e61–e111. [Google Scholar] [CrossRef]
- Li, Y.-T.; Wang, Y.-C.; Lee, H.-L.; Lu, M.-C.; Yang, S.-F. Elevated plasma matrix metalloproteinase-9 and its correlations with severity of disease in patients with ventilator-associated pneumonia. Int. J. Med. Sci. 2016, 13, 638–645. [Google Scholar] [CrossRef]
- Bassetti, M.; Taramasso, L.; Giacobbe, D.R.; Pelosi, P. Management of ventilator-associated pneumonia: Epidemiology, diagnosis and antimicrobial therapy. Expert Rev. Anti-Infect. Ther. 2012, 10, 585–596. [Google Scholar] [CrossRef] [PubMed]
- Asehnoune, K.; Seguin, P.; Allary, J.; Feuillet, F.; Lasocki, S.; Cook, F.; Floch, H.; Chabanne, R.; Geeraerts, T.; Roger, C.; et al. Hydrocortisone and fludrocortisone for prevention of hospital-acquired pneumonia in patients with severe traumatic brain injury (corti-tc): A double-blind, multicentre phase 3, randomised placebo-controlled trial. Lancet. Respir. Med. 2014, 2, 706–716. [Google Scholar] [CrossRef]
- Warren, D.K.; Shukla, S.J.; Olsen, M.A.; Kollef, M.H.; Hollenbeak, C.S.; Cox, M.J.; Cohen, M.M.; Fraser, V.J. Outcome and attributable cost of ventilator-associated pneumonia among intensive care unit patients in a suburban medical center. Crit. Care Med. 2003, 31, 1312–1317. [Google Scholar] [CrossRef] [PubMed]
- Torres, A.; Niederman, M.S.; Chastre, J.; Ewig, S.; Fernandez-Vandellos, P.; Hanberger, H.; Kollef, M.; Li Bassi, G.; Luna, C.M.; Martin-Loeches, I.; et al. International ers/esicm/escmid/alat guidelines for the management of hospital-acquired pneumonia and ventilator-associated pneumonia. Eur. Respir. J. 2017, 50, 1700582. [Google Scholar] [CrossRef]
- Póvoa, P.; Martin-Loeches, I.; Artigas, A. Biomarker kinetics in vap. Clin. Pulm. Med. 2015, 22, 185–191. [Google Scholar] [CrossRef]
- Wiskirchen, D.E.; Kuti, J.L.; Nicolau, D.P. The use of scoring systems to predict prognosis in patients with ventilator-associated pneumonia. Clin. Pulm. Med. 2011, 18, 181–185. [Google Scholar] [CrossRef]
- Huang, K.T.; Tseng, C.C.; Fang, W.F.; Lin, M.C. An early predictor of the outcome of patients with ventilator-associated pneumonia. Chang Gung Med J. 2010, 33, 274–282. [Google Scholar]
- Napolitano, L.M. Use of severity scoring and stratification factors in clinical trials of hospital-acquired and ventilator-associated pneumonia. Clin. Infect. Dis.: Off. Publ. Infect. Dis. Soc. Am. 2010, 51 (Suppl. 1), S67–S80. [Google Scholar] [CrossRef]
- Combes, A.; Luyt, C.E.; Fagon, J.Y.; Wollf, M.; Trouillet, J.L.; Gibert, C.; Chastre, J.; Group, P.T. Impact of methicillin resistance on outcome of staphylococcus aureus ventilator-associated pneumonia. Am. J. Respir. Crit. Care Med. 2004, 170, 786–792. [Google Scholar] [CrossRef]
- Vincent, J.L.; Moreno, R.; Takala, J.; Willatts, S.; De Mendonca, A.; Bruining, H.; Reinhart, C.K.; Suter, P.M.; Thijs, L.G. The sofa (sepsis-related organ failure assessment) score to describe organ dysfunction/failure. On behalf of the working group on sepsis-related problems of the european society of intensive care medicine. Intensive Care Med. 1996, 22, 707–710. [Google Scholar] [CrossRef]
- Le Gall, J.R.; Klar, J.; Lemeshow, S.; Saulnier, F.; Alberti, C.; Artigas, A.; Teres, D. The logistic organ dysfunction system. A new way to assess organ dysfunction in the intensive care unit. Icu scoring group. JAMA 1996, 276, 802–810. [Google Scholar] [CrossRef]
- Fagon, J.Y.; Chastre, J.; Novara, A.; Medioni, P.; Gibert, C. Characterization of intensive care unit patients using a model based on the presence or absence of organ dysfunctions and/or infection: The odin model. Intensive Care Med. 1993, 19, 137–144. [Google Scholar] [CrossRef]
- Knaus, W.A.; Draper, E.A.; Wagner, D.P.; Zimmerman, J.E. Apache ii: A severity of disease classification system. Crit. Care Med. 1985, 13, 818–829. [Google Scholar] [CrossRef]
- Rapsang, A.G.; Shyam, D.C. Scoring systems in the intensive care unit: A compendium. Indian J. Crit Care Med. 2014, 18, 220–228. [Google Scholar] [CrossRef] [PubMed]
- Rosbolt, M.B.; Sterling, E.S.; Fahy, B.G. The utility of the clinical pulmonary infection score. J. Intensive Care Med. 2009, 24, 26–34. [Google Scholar] [CrossRef] [PubMed]
- Gursel, G.; Demirtas, S. Value of apache ii, sofa and cpis scores in predicting prognosis in patients with ventilator-associated pneumonia. Respir. Int. Rev. Thorac. Dis. 2006, 73, 503–508. [Google Scholar] [CrossRef]
- Chen, C.; Yan, M.; Hu, C.; Lv, X.; Zhang, H.; Chen, S. Diagnostic efficacy of serum procalcitonin, c-reactive protein concentration and clinical pulmonary infection score in ventilator-associated pneumonia. Med. Sci.: M/S 2018, 34, 26–32. [Google Scholar] [CrossRef]
- Wongsurakiat, P.; Tulatamakit, S. Clinical pulmonary infection score and a spot serum procalcitonin level to guide discontinuation of antibiotics in ventilator-associated pneumonia: A study in a single institution with high prevalence of nonfermentative gram-negative bacilli infection. Ther. Adv. Respir. Dis. 2018, 12. [Google Scholar] [CrossRef]
- Furtado, G.H.; Wiskirchen, D.E.; Kuti, J.L.; Nicolau, D.P. Performance of the piro score for predicting mortality in patients with ventilator-associated pneumonia. Anaesth. Intensive Care 2012, 40, 285–291. [Google Scholar] [CrossRef]
- Deshmane, S.L.; Kremlev, S.; Amini, S.; Sawaya, B.E. Monocyte chemoattractant protein-1 (mcp-1): An overview. J. Interferon Cytokine Res.: Off. J. Int. Soc. Interferon Cytokine Res. 2009, 29, 313–326. [Google Scholar] [CrossRef] [PubMed]
- Endeman, H.; Meijvis, S.C.; Rijkers, G.T.; van Velzen-Blad, H.; van Moorsel, C.H.; Grutters, J.C.; Biesma, D.H. Systemic cytokine response in patients with community-acquired pneumonia. Eur. Respir. J. 2011, 37, 1431–1438. [Google Scholar] [CrossRef]
- Ramnath, R.D.; Ng, S.W.; Guglielmotti, A.; Bhatia, M. Role of mcp-1 in endotoxemia and sepsis. Int. Immunopharmacol. 2008, 8, 810–818. [Google Scholar] [CrossRef] [PubMed]
- Dessing, M.C.; van der Sluijs, K.F.; Florquin, S.; van der Poll, T. Monocyte chemoattractant protein 1 contributes to an adequate immune response in influenza pneumonia. Clin. Immunol. 2007, 125, 328–336. [Google Scholar] [CrossRef]
- Daly, C.; Rollins, B.J. Monocyte chemoattractant protein-1 (ccl2) in inflammatory disease and adaptive immunity: Therapeutic opportunities and controversies. Microcirculation 2003, 10, 247–257. [Google Scholar] [CrossRef]
- Cushing, S.D.; Berliner, J.A.; Valente, A.J.; Territo, M.C.; Navab, M.; Parhami, F.; Gerrity, R.; Schwartz, C.J.; Fogelman, A.M. Minimally modified low density lipoprotein induces monocyte chemotactic protein 1 in human endothelial cells and smooth muscle cells. Proc. Natl. Acad. Sci. USA 1990, 87, 5134–5138. [Google Scholar] [CrossRef] [PubMed]
- Standiford, T.J.; Kunkel, S.L.; Phan, S.H.; Rollins, B.J.; Strieter, R.M. Alveolar macrophage-derived cytokines induce monocyte chemoattractant protein-1 expression from human pulmonary type ii-like epithelial cells. J. Biol. Chem. 1991, 266, 9912–9918. [Google Scholar] [PubMed]
- Brown, Z.; Strieter, R.M.; Neild, G.H.; Thompson, R.C.; Kunkel, S.L.; Westwick, J. Il-1 receptor antagonist inhibits monocyte chemotactic peptide 1 generation by human mesangial cells. Kidney Int. 1992, 42, 95–101. [Google Scholar] [CrossRef] [PubMed]
- Barna, B.P.; Pettay, J.; Barnett, G.H.; Zhou, P.; Iwasaki, K.; Estes, M.L. Regulation of monocyte chemoattractant protein-1 expression in adult human non-neoplastic astrocytes is sensitive to tumor necrosis factor (tnf) or antibody to the 55-kda tnf receptor. J. Neuroimmunol. 1994, 50, 101–107. [Google Scholar] [CrossRef]
- Nandi, A.; Bishayi, B. Murine macrophage response from peritoneal cavity requires signals mediated by chemokine receptor ccr-2 during staphylococcus aureus infection. Immunol. Res. 2016, 64, 213–232. [Google Scholar] [CrossRef]
- Myers, S.J.; Wong, L.M.; Charo, I.F. Signal transduction and ligand specificity of the human monocyte chemoattractant protein-1 receptor in transfected embryonic kidney cells. J. Biol. Chem. 1995, 270, 5786–5792. [Google Scholar] [CrossRef] [PubMed]
- Balamayooran, G.; Batra, S.; Theivanthiran, B.; Cai, S.; Pacher, P.; Jeyaseelan, S. Intrapulmonary g-csf rescues neutrophil recruitment to the lung and neutrophil release to blood in gram-negative bacterial infection in mcp-1-/- mice. J. Immunol. 2012, 189, 5849–5859. [Google Scholar] [CrossRef]
- Mehrad, B.; Standiford, T.J. Role of cytokines in pulmonary antimicrobial host defense. Immunol. Res. 1999, 20, 15–27. [Google Scholar] [CrossRef]
- Carr, M.W.; Roth, S.J.; Luther, E.; Rose, S.S.; Springer, T.A. Monocyte chemoattractant protein 1 acts as a t-lymphocyte chemoattractant. Proc. Natl. Acad. Sci. USA. 1994, 91, 3652–3656. [Google Scholar] [CrossRef]
- Nakano, Y.; Kasahara, T.; Mukaida, N.; Ko, Y.C.; Nakano, M.; Matsushima, K. Protection against lethal bacterial infection in mice by monocyte-chemotactic and -activating factor. Infect. Immun. 1994, 62, 377–383. [Google Scholar]
- Zisman, D.A.; Kunkel, S.L.; Strieter, R.M.; Tsai, W.C.; Bucknell, K.; Wilkowski, J.; Standiford, T.J. Mcp-1 protects mice in lethal endotoxemia. J. Clin. Investig. 1997, 99, 2832–2836. [Google Scholar] [CrossRef] [PubMed]
- Potera, R.M.; Cao, M.; Jordan, L.F.; Hogg, R.T.; Hook, J.S.; Moreland, J.G. Alveolar macrophage chemokine secretion mediates neutrophilic lung injury in nox2-deficient mice. Inflammation 2019, 42, 185–198. [Google Scholar] [CrossRef]
- Winter, C.; Herbold, W.; Maus, R.; Langer, F.; Briles, D.E.; Paton, J.C.; Welte, T.; Maus, U.A. Important role for cc chemokine ligand 2-dependent lung mononuclear phagocyte recruitment to inhibit sepsis in mice infected with streptococcus pneumoniae. J. Immunol. 2009, 182, 4931–4937. [Google Scholar] [CrossRef] [PubMed]
- Amano, H.; Morimoto, K.; Senba, M.; Wang, H.; Ishida, Y.; Kumatori, A.; Yoshimine, H.; Oishi, K.; Mukaida, N.; Nagatake, T. Essential contribution of monocyte chemoattractant protein-1/c-c chemokine ligand-2 to resolution and repair processes in acute bacterial pneumonia. J. Immunol. 2004, 172, 398–409. [Google Scholar] [CrossRef]
- Narasaraju, T.; Ng, H.H.; Phoon, M.C.; Chow, V.T. Mcp-1 antibody treatment enhances damage and impedes repair of the alveolar epithelium in influenza pneumonitis. Am. J. Respir. Cell Mol. Biol. 2010, 42, 732–743. [Google Scholar] [CrossRef]
- Schaaf, B.; Liebau, C.; Kurowski, V.; Droemann, D.; Dalhoff, K. Hospital acquired pneumonia with high-risk bacteria is associated with increased pulmonary matrix metalloproteinase activity. BMC Pulm. Med. 2008, 8, 12. [Google Scholar] [CrossRef]
- Lisboa, T.; Diaz, E.; Sa-Borges, M.; Socias, A.; Sole-Violan, J.; Rodriguez, A.; Rello, J. The ventilator-associated pneumonia piro score: A tool for predicting icu mortality and health-care resources use in ventilator-associated pneumonia. Chest 2008, 134, 1208–1216. [Google Scholar] [CrossRef]
- Kumar, D.; Super, D.M.; Fajardo, R.A.; Stork, E.E.; Moore, J.J.; Saker, F.A. Predicting outcome in neonatal hypoxic respiratory failure with the score for neonatal acute physiology (snap) and highest oxygen index (oi) in the first 24 h of admission. J. Perinatol. 2004, 24, 376–381. [Google Scholar] [CrossRef]
- Rice, T.W.; Wheeler, A.P.; Bernard, G.R.; Hayden, D.L.; Schoenfeld, D.A.; Ware, L.B.; National Institutes of Health, National Heart, Lung, and Blood Institute ARDS Network. Comparison of the spo2/fio2 ratio and the pao2/fio2 ratio in patients with acute lung injury or ards. Chest 2007, 132, 410–417. [Google Scholar] [CrossRef]
- Kangelaris, K.N.; Calfee, C.S.; May, A.K.; Zhuo, H.; Matthay, M.A.; Ware, L.B. Is there still a role for the lung injury score in the era of the berlin definition ards? Ann. Intensive Care 2014, 4, 4. [Google Scholar] [CrossRef]
- Force, A.D.T.; Ranieri, V.M.; Rubenfeld, G.D.; Thompson, B.T.; Ferguson, N.D.; Caldwell, E.; Fan, E.; Camporota, L.; Slutsky, A.S. Acute respiratory distress syndrome: The berlin definition. JAMA 2012, 307, 2526–2533. [Google Scholar]
- Villar, J.; Perez-Mendez, L.; Lopez, J.; Belda, J.; Blanco, J.; Saralegui, I.; Suarez-Sipmann, F.; Lopez, J.; Lubillo, S.; Kacmarek, R.M.; et al. An early peep/fio2 trial identifies different degrees of lung injury in patients with acute respiratory distress syndrome. Am. J. Respir. Crit. Care Med. 2007, 176, 795–804. [Google Scholar] [CrossRef]
- Ferguson, N.D.; Kacmarek, R.M.; Chiche, J.D.; Singh, J.M.; Hallett, D.C.; Mehta, S.; Stewart, T.E. Screening of ards patients using standardized ventilator settings: Influence on enrollment in a clinical trial. Intensive Care Med. 2004, 30, 1111–1116. [Google Scholar] [CrossRef]
- Rau, B.; Baumgart, K.; Kruger, C.M.; Schilling, M.; Beger, H.G. Cc-chemokine activation in acute pancreatitis: Enhanced release of monocyte chemoattractant protein-1 in patients with local and systemic complications. Intensive Care Med. 2003, 29, 622–629. [Google Scholar] [CrossRef]
- Vermont, C.L.; Hazelzet, J.A.; de Kleijn, E.D.; van den Dobbelsteen, G.P.; de Groot, R. Cc and cxc chemokine levels in children with meningococcal sepsis accurately predict mortality and disease severity. Crit. Care 2006, 10, R33. [Google Scholar] [CrossRef] [PubMed]
- Frink, M.; Lu, A.; Thobe, B.M.; Hsieh, Y.C.; Choudhry, M.A.; Schwacha, M.G.; Kunkel, S.L.; Chaudry, I.H. Monocyte chemoattractant protein-1 influences trauma-hemorrhage-induced distal organ damage via regulation of keratinocyte-derived chemokine production. Am. J. Physiol. Regul. Integr. Comp. Physiol. 2007, 292, R1110–R1116. [Google Scholar] [CrossRef]
- American Thoracic Society; Infectious Diseases Society of America. Guidelines for the management of adults with hospital-acquired, ventilator-associated, and healthcare-associated pneumonia. Am. J. Respir. Crit. Care Med. 2005, 171, 388–416. [Google Scholar] [CrossRef] [PubMed]
- Azoulay, E.; Lemiale, V.; Mokart, D.; Pène, F.; Kouatchet, A.; Perez, P.; Vincent, F.; Mayaux, J.; Benoit, D.; Bruneel, F.; et al. Acute respiratory distress syndrome in patients with malignancies. Intensive Care Med. 2014, 40, 1106–1114. [Google Scholar] [CrossRef]
- Hermon, M.M.; Golej, J.; Burda, G.; Boigner, H.; Stoll, E.; Vergesslich, K.; Strohmaier, W.; Pollak, A.; Trittenwein, G. Surfactant therapy in infants and children: Three years experience in a pediatric intensive care unit. Shock 2002, 17, 247–251. [Google Scholar] [CrossRef]
- Yong, K.K.; Chang, J.H.; Chien, M.H.; Tsao, S.M.; Yu, M.C.; Bai, K.J.; Tsao, T.C.; Yang, S.F. Plasma monocyte chemoattractant protein-1 level as a predictor of the severity of community-acquired pneumonia. Int. J. Mol. Sci. 2016, 17, 179. [Google Scholar] [CrossRef] [PubMed]


| Patients with Ventilation | Controls | ||
|---|---|---|---|
| Patients Developing VAP | Patients Not Developing VAP | ||
| (n = 30) | (n = 12) | (n = 45) | |
| Age (years) | 64.30 ± 3.19 | 52.67 ± 5.80 | 36.53 ± 1.78 a,b |
| Male gender | 25 (83.3%) | 8 (66.7%) | 39 (86.7%) |
| History | |||
| Cigarette smoking | 15 (50.0%) | 4 (33.3%) | 9 (20.0%) a |
| Drink | 7 (23.3%) | 4 (33.3%) | 8 (17.8%) |
| Betal | 4 (13.3%) | 5 (41.7%) | 4 (8.9%) b |
| Inflammation markers at study enrollment | |||
| WBC (/mm3) | 16,476.67 ± 1158.26 | 8350.00 ± 953.73 a | 7111.11 ± 315.67 a |
| Neutrophils (/mm3) | 13,285.40 ± 1088.20 | 5264.56 ± 898.17 a | 4188.40 ± 274.36 a |
| CRP (ng/dL) | 16.15 ± 1.69 | - | - |
| Reason for respiratory failure | |||
| Postoperative | 11 (36.7%) | 10 (83.3%) a | |
| Lung disease | 7 (23.3%) | 0 | |
| Neurologic failure | 6 (20.0%) | 0 | |
| Trauma | 1 (3.3%) | 1 (8.3%) | |
| Sepsis | 4 (13.3%) | 0 | |
| Shock | 3 (10.0%) | 0 | |
| Cardiovascular | 0 | 1 (8.3%) | |
| Miscellaneous | 1 (3.3%) | 0 | |
| Cormorbidities | |||
| CVA | 4 (13.3%) | 3 (25.0%) | |
| Cardiac | 8 (26.7%) | 3 (25.0%) | |
| Pulmonary | 4 (13.3%) | 1 (8.3%) | |
| Liver | 3 (10.0%) | 0 | |
| Renal | 4 (13.3%) | 0 | |
| Cancer | 10 (33.3%) | 7 (58.3%) | |
| Characteristics | VAP (n = 30) | Non-VAP (n = 12) | p Value |
|---|---|---|---|
| Non-specifically for VAP | |||
| APACH II | 22.83 ± 1.29 | 14.00 ± 1.35 | 0.00 |
| SAPS II | 55.57 ± 3.27 | 25.50 ± 2.34 | 0.00 |
| ODIN scores | 3.60 ± 0.23 | 1.17 ± 0.11 | 0.00 |
| SOFA scores | 11.27 ± 0.81 | 4.00 ± 0.33 | 0.00 |
| Comorbidity | 6.23 ± 0.48 | 3.92 ± 0.66 | 0.01 |
| Specifically for VAP | |||
| CPIS | 6.40 ± 0.27 | 1.58 ± 0.26 | 0.00 |
| PIRO scores | 2.07 ± 0.18 | 0.83 ± 0.11 | 0.00 |
| IBMP-10 scores | 3.20 ± 0.19 | 0.00 ± 0.00 | 0.00 |
| Bacteria | Number of Patients |
|---|---|
| High-risk bacteria | |
| Acinetobacter baumannii | 14 (46.7%) |
| Pseudomonas aeruginosa | 13 (43.3%) |
| Stenotrophomona maltophilia | 11 (36.7%) |
| Staphylococcus aureus | 3 (10.0%) |
| Low-risk bacteria | |
| Enterobacter aerogenes | 6 (20.0%) |
| Elizabethkingia meningoseptica | 5 (16.7%) |
| Klebsiella pneumoniae | 4 (13.3%) |
| Sphingomonas paucimobilis | 2 (6.7%) |
| Escherichia coli | 1 (3.3%) |
| Serratia marcescens | 1 (3.3%) |
| Citrobacter koseri | 1 (3.3%) |
| Proteus mirabilis | 1 (3.3%) |
| Morganella | 1 (3.3%) |
© 2019 by the authors. Licensee MDPI, Basel, Switzerland. This article is an open access article distributed under the terms and conditions of the Creative Commons Attribution (CC BY) license (http://creativecommons.org/licenses/by/4.0/).
Share and Cite
Li, Y.-T.; Wang, Y.-C.; Lee, H.-L.; Tsao, S.-C.; Lu, M.-C.; Yang, S.-F. Monocyte Chemoattractant Protein-1, a Possible Biomarker of Multiorgan Failure and Mortality in Ventilator-Associated Pneumonia. Int. J. Mol. Sci. 2019, 20, 2218. https://doi.org/10.3390/ijms20092218
Li Y-T, Wang Y-C, Lee H-L, Tsao S-C, Lu M-C, Yang S-F. Monocyte Chemoattractant Protein-1, a Possible Biomarker of Multiorgan Failure and Mortality in Ventilator-Associated Pneumonia. International Journal of Molecular Sciences. 2019; 20(9):2218. https://doi.org/10.3390/ijms20092218
Chicago/Turabian StyleLi, Yia-Ting, Yao-Chen Wang, Hsiang-Lin Lee, Su-Chin Tsao, Min-Chi Lu, and Shun-Fa Yang. 2019. "Monocyte Chemoattractant Protein-1, a Possible Biomarker of Multiorgan Failure and Mortality in Ventilator-Associated Pneumonia" International Journal of Molecular Sciences 20, no. 9: 2218. https://doi.org/10.3390/ijms20092218
APA StyleLi, Y.-T., Wang, Y.-C., Lee, H.-L., Tsao, S.-C., Lu, M.-C., & Yang, S.-F. (2019). Monocyte Chemoattractant Protein-1, a Possible Biomarker of Multiorgan Failure and Mortality in Ventilator-Associated Pneumonia. International Journal of Molecular Sciences, 20(9), 2218. https://doi.org/10.3390/ijms20092218