Targeting Tumor Markers with Antisense Peptides: An Example of Human Prostate Specific Antigen

 , , ,
, , ,
Abstract

1. Introduction
2. Results and Discussion
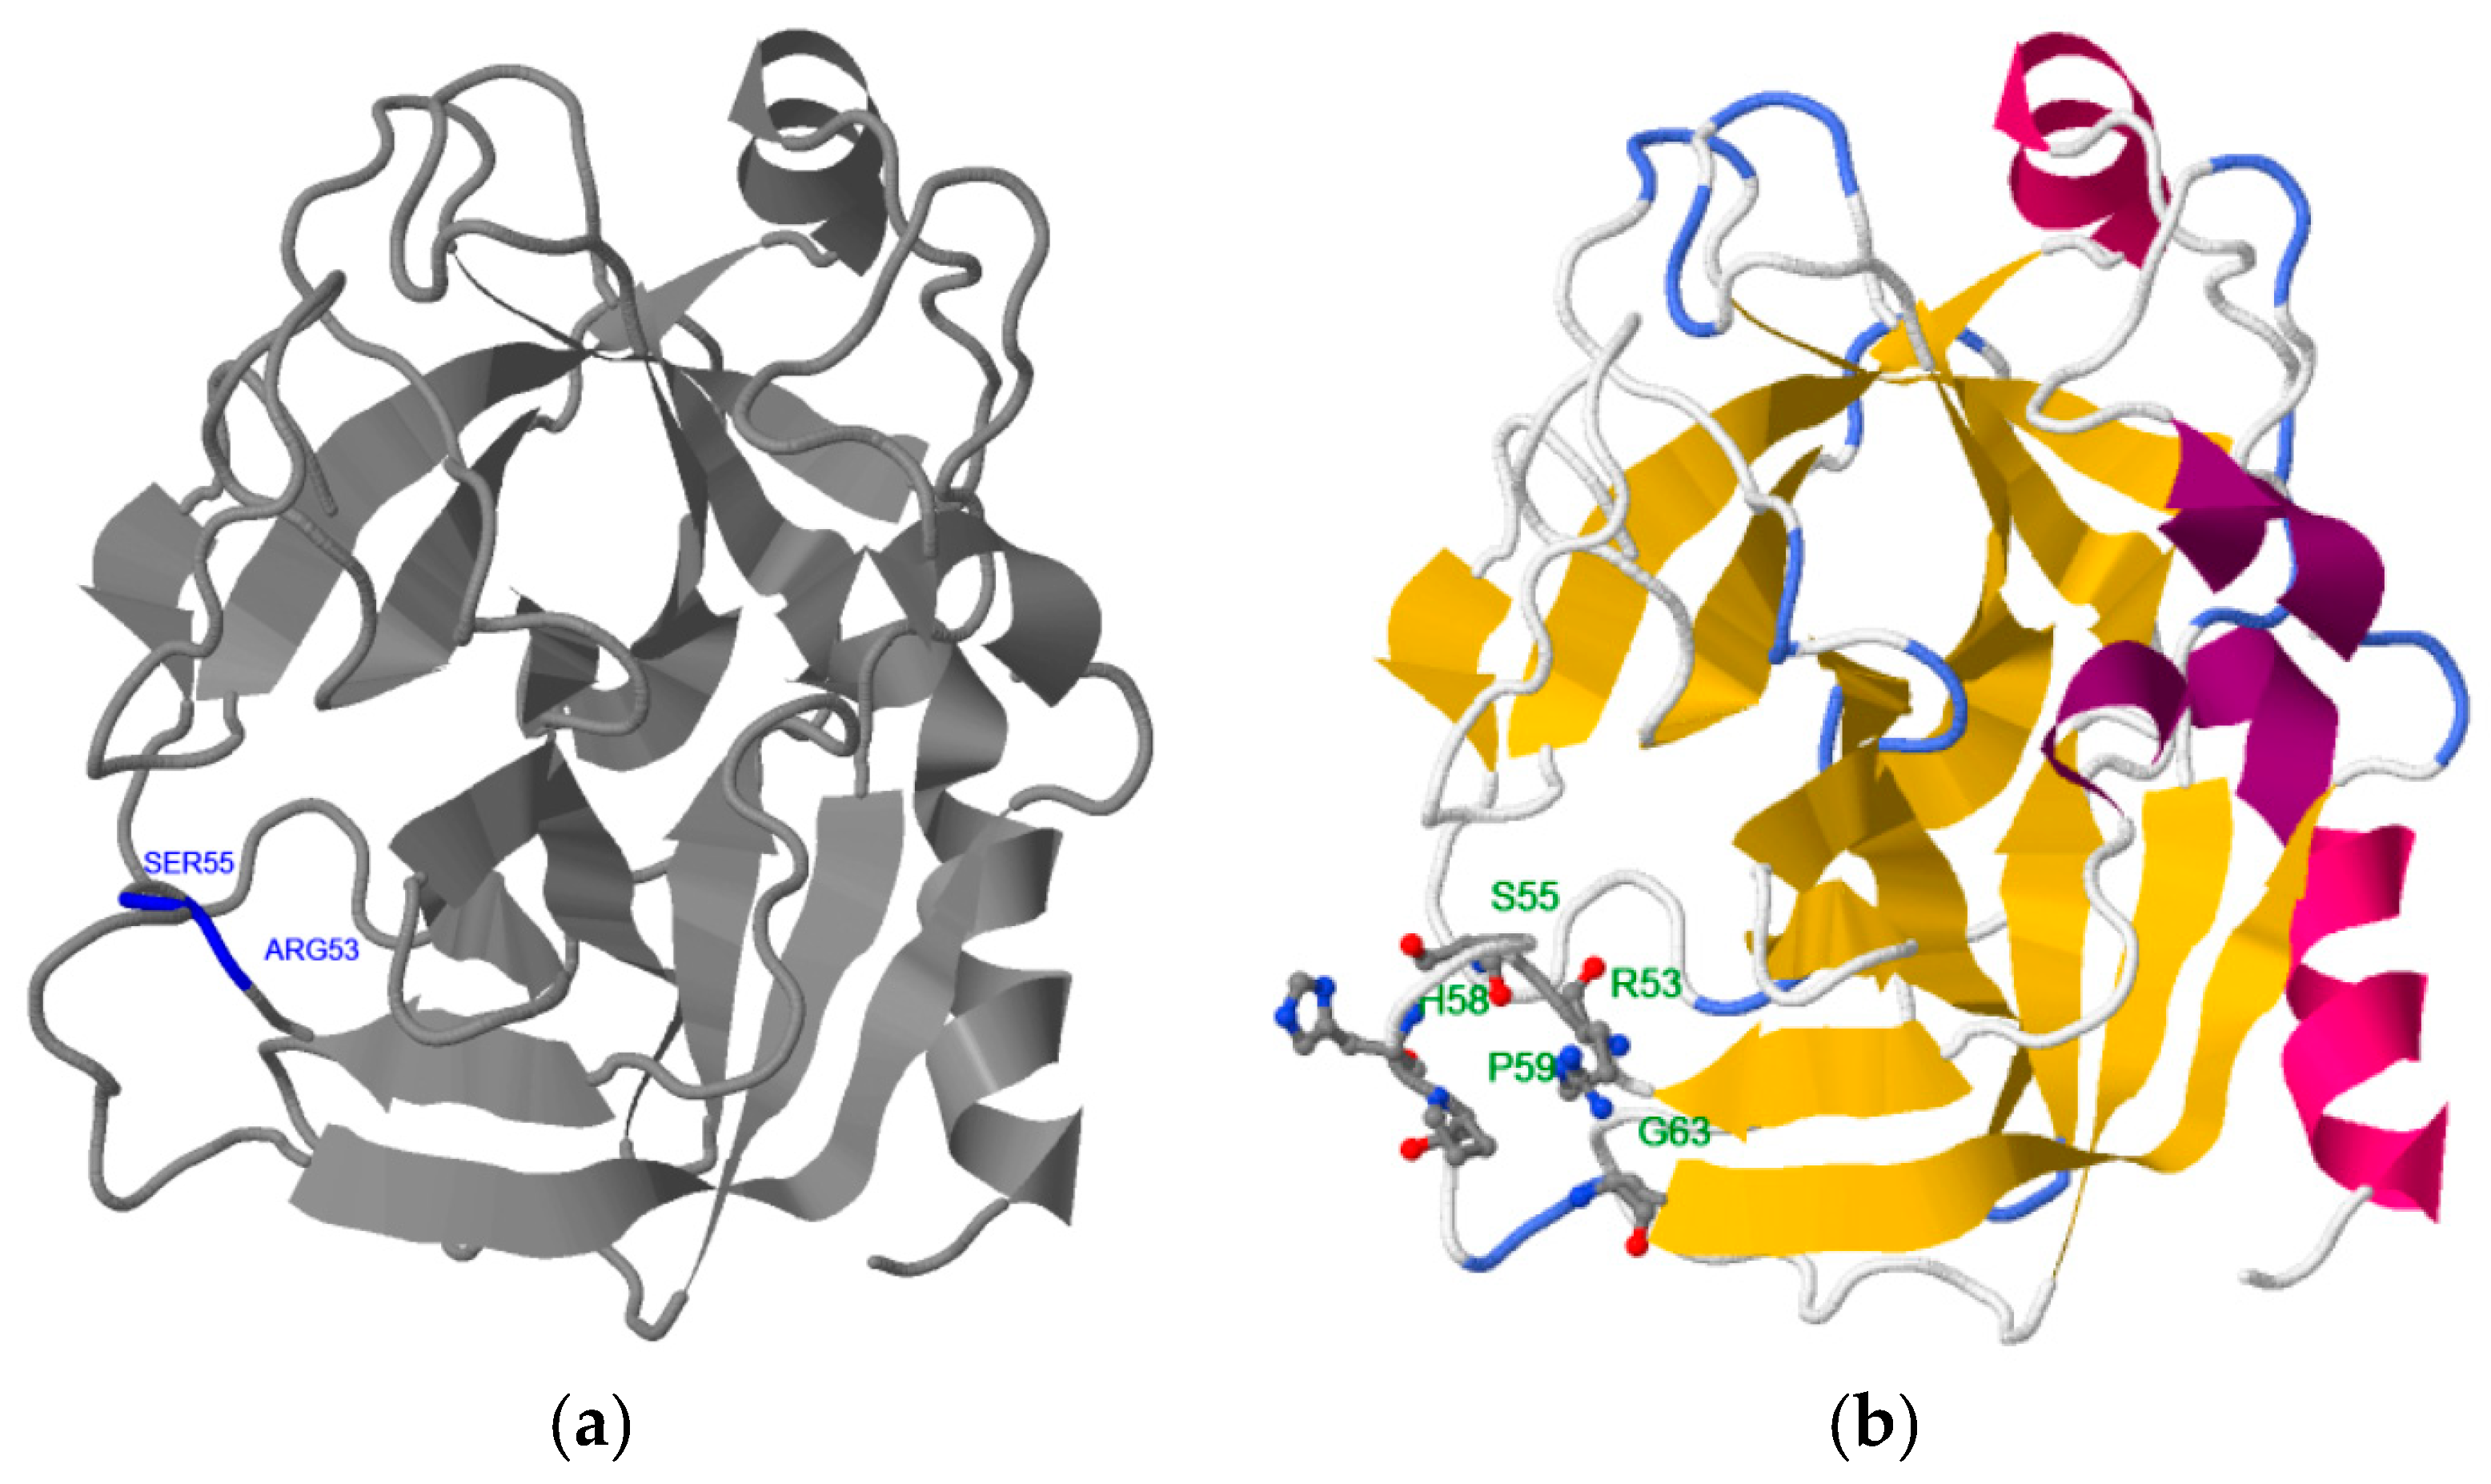
2.1. Step 1: Selection of Molecular Target (hPSA Epitope)
2.2. Step 2: Modeling of Antisense Peptide AVRDKVG (hPSA Paratope)
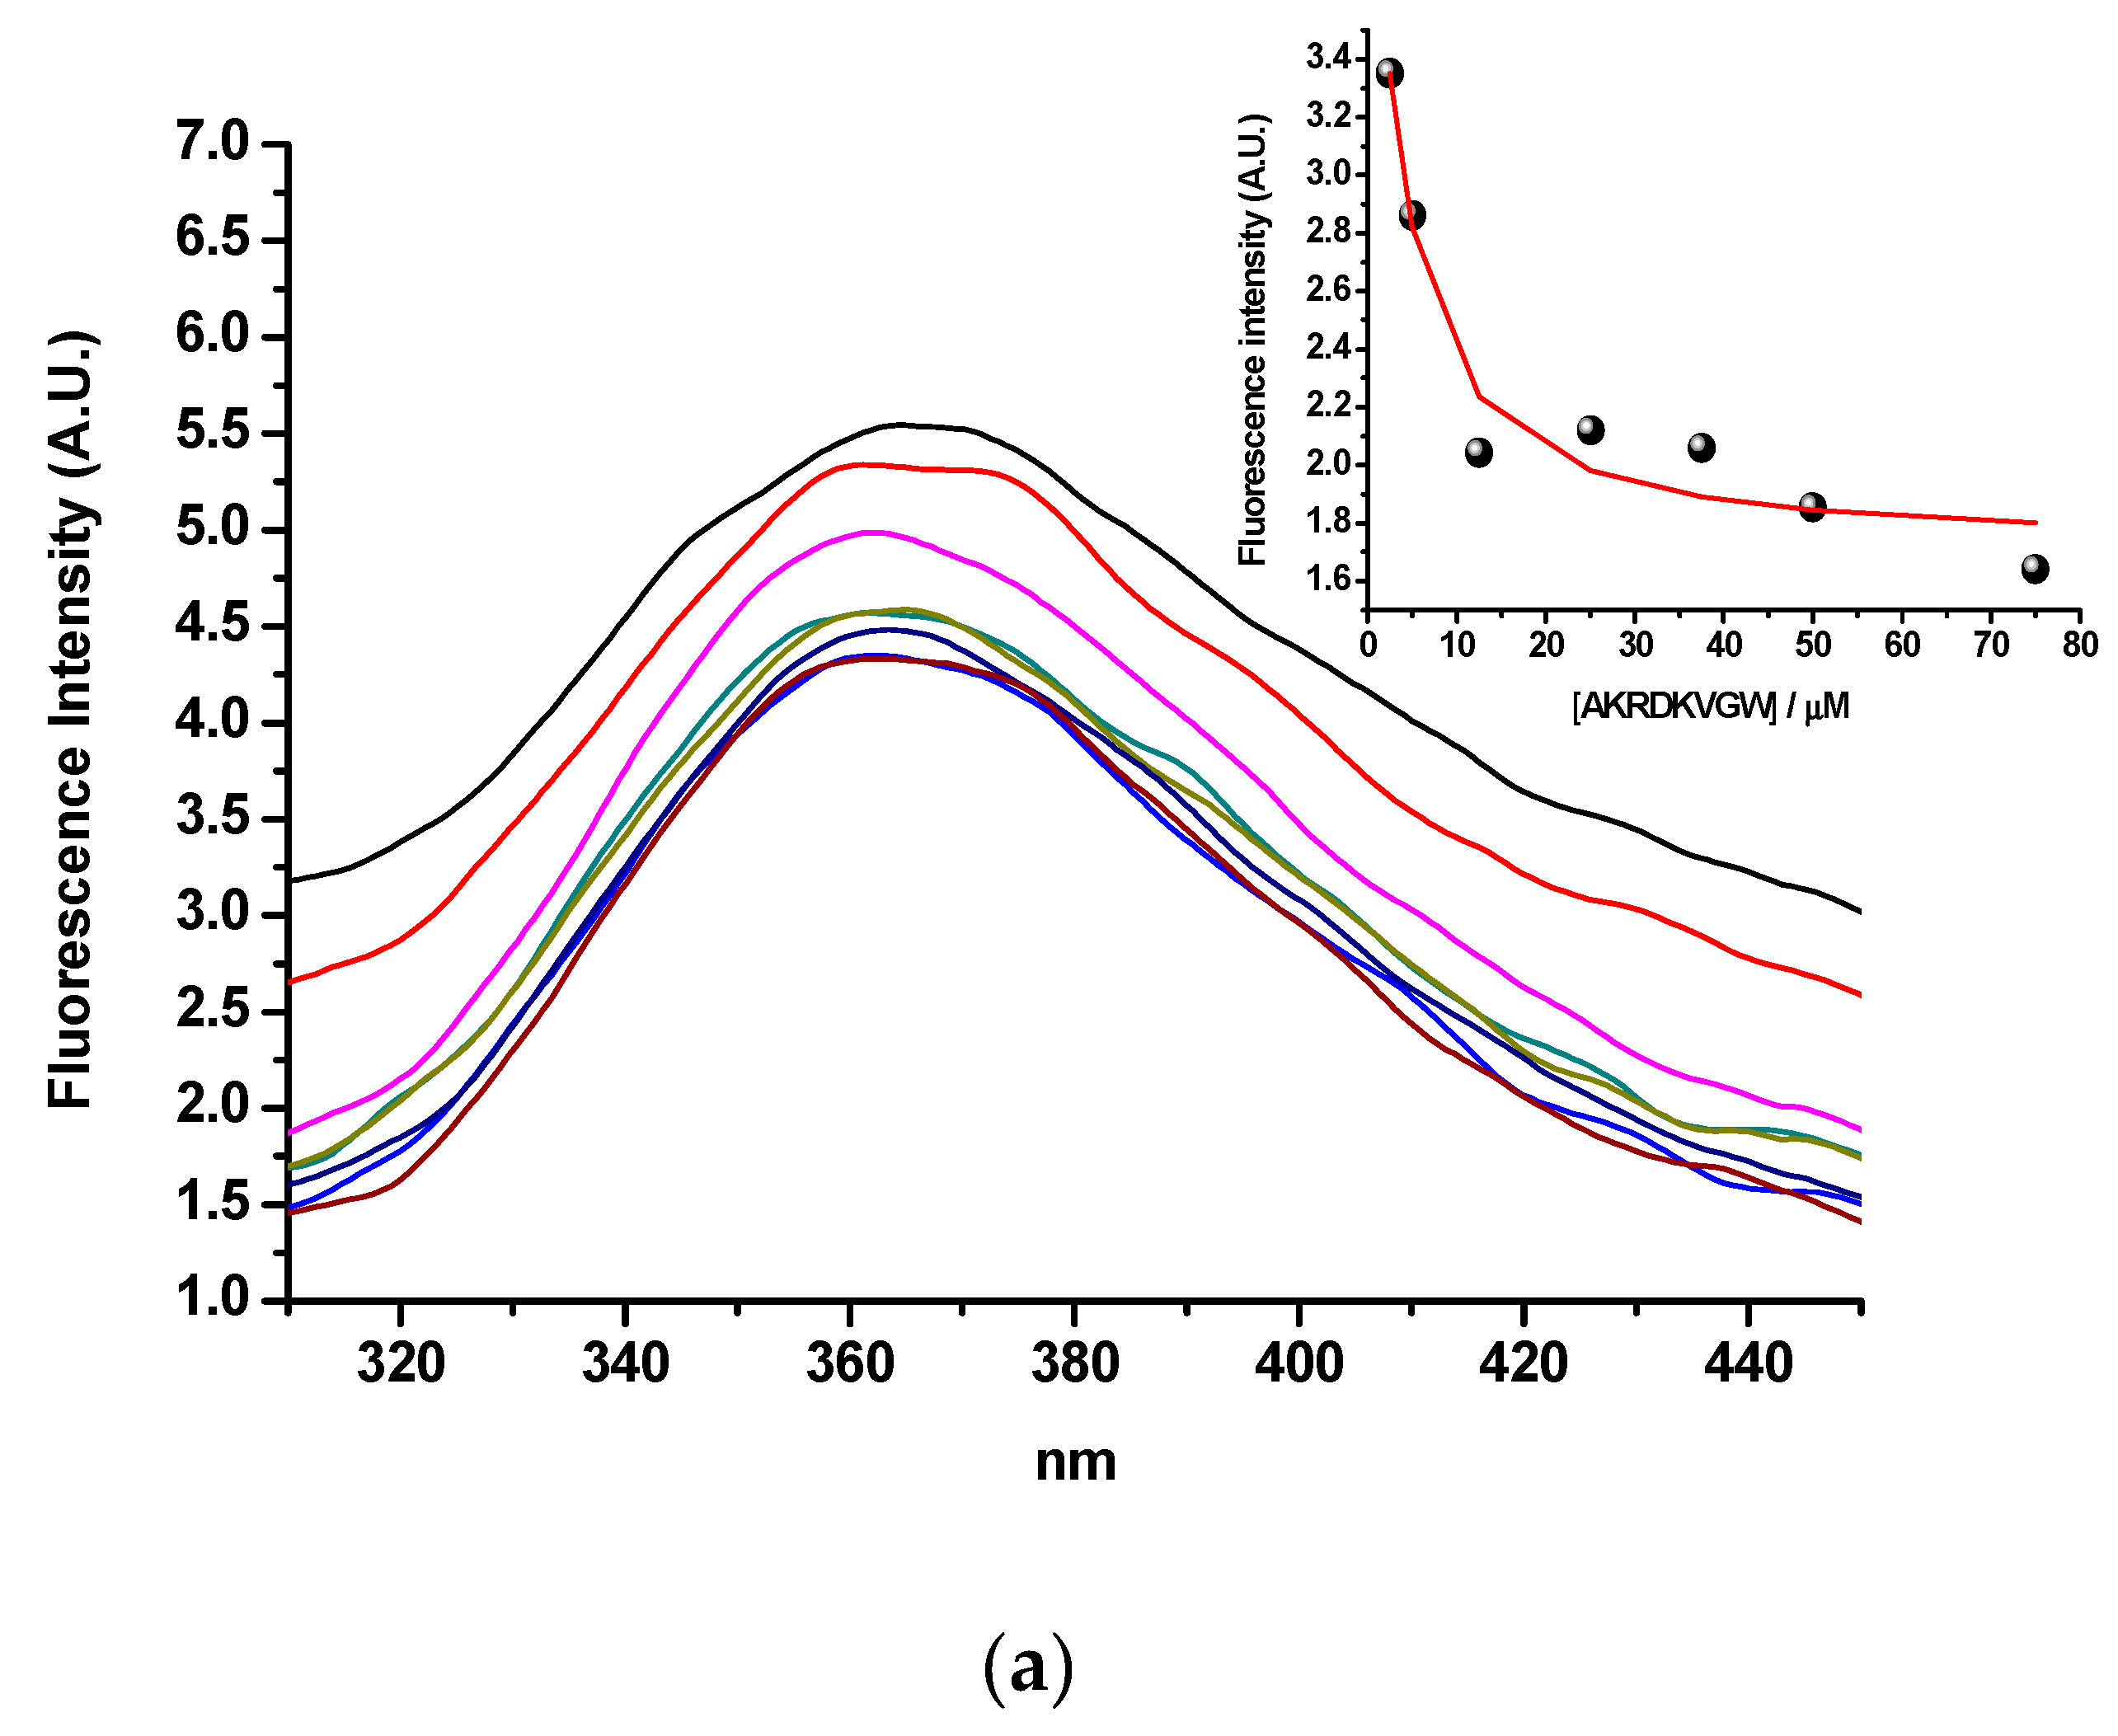
2.3. Step 3: Spectroscopic Evaluation of Binding between Sense and Antisense Peptide
2.3.1. Tryptophan Fluorescence Spectroscopy
2.3.2. Microscale Thermophoresis and Magnetic Particle Enzyme Immunoassay
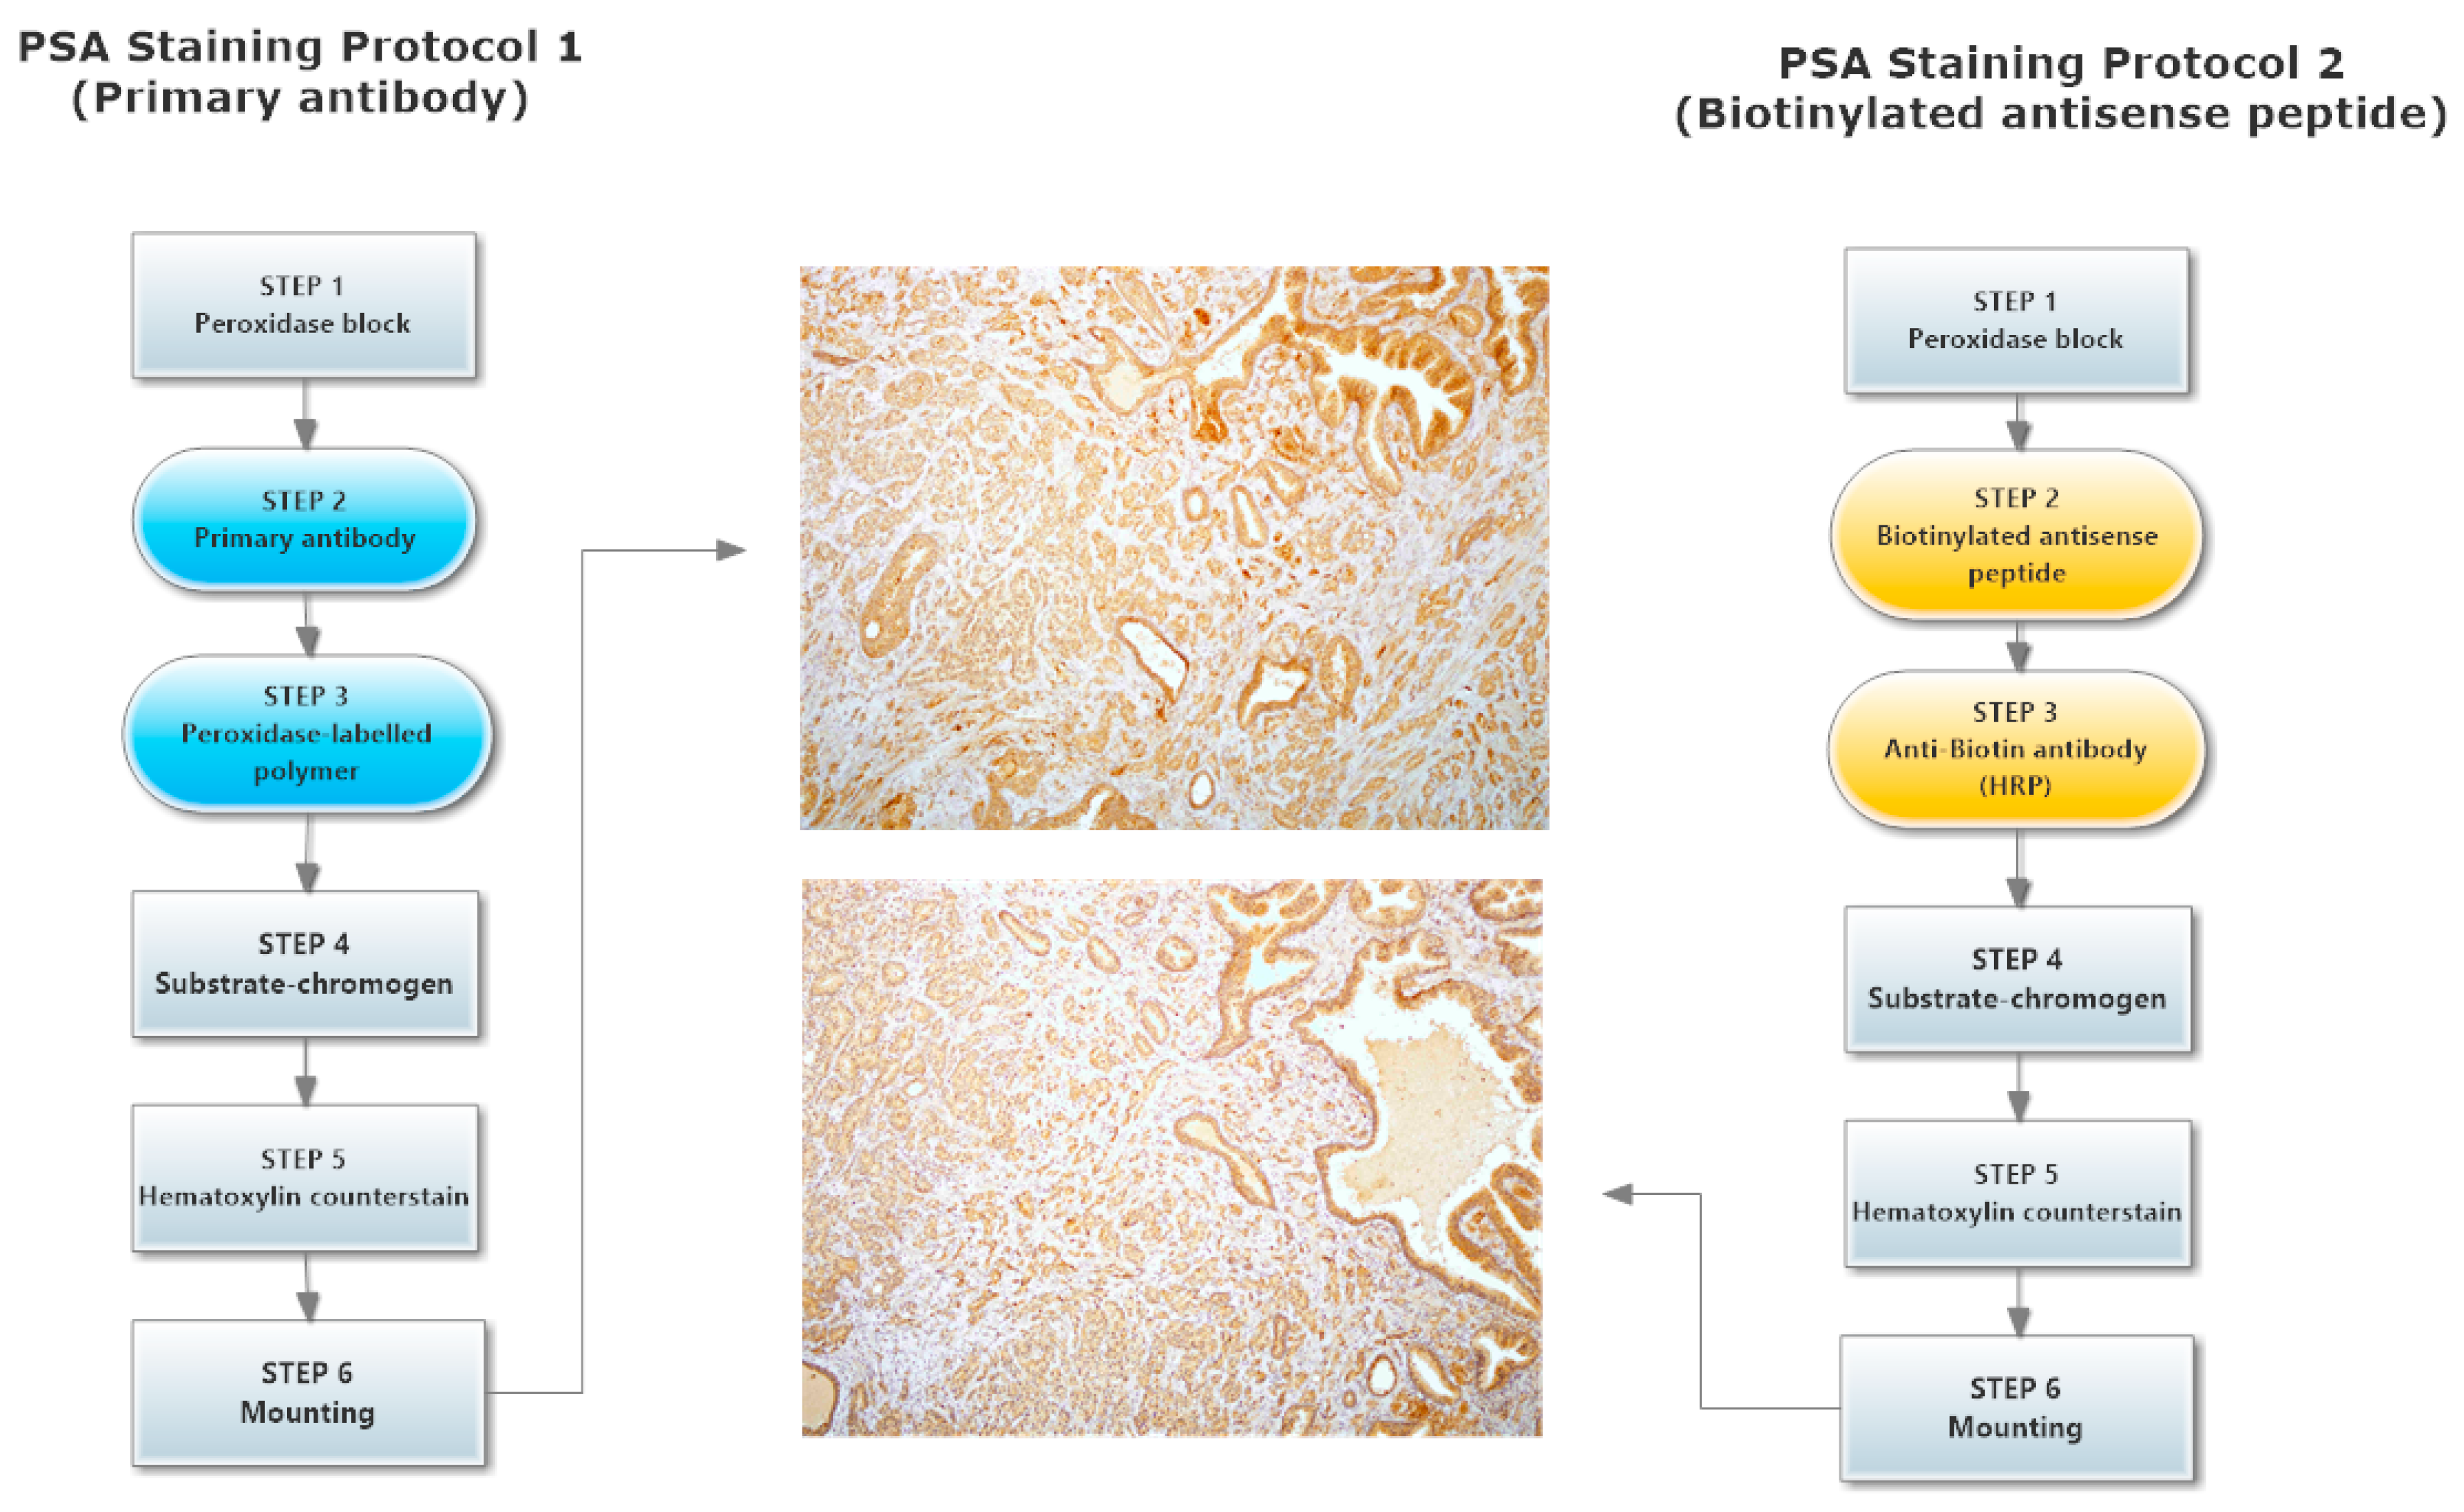
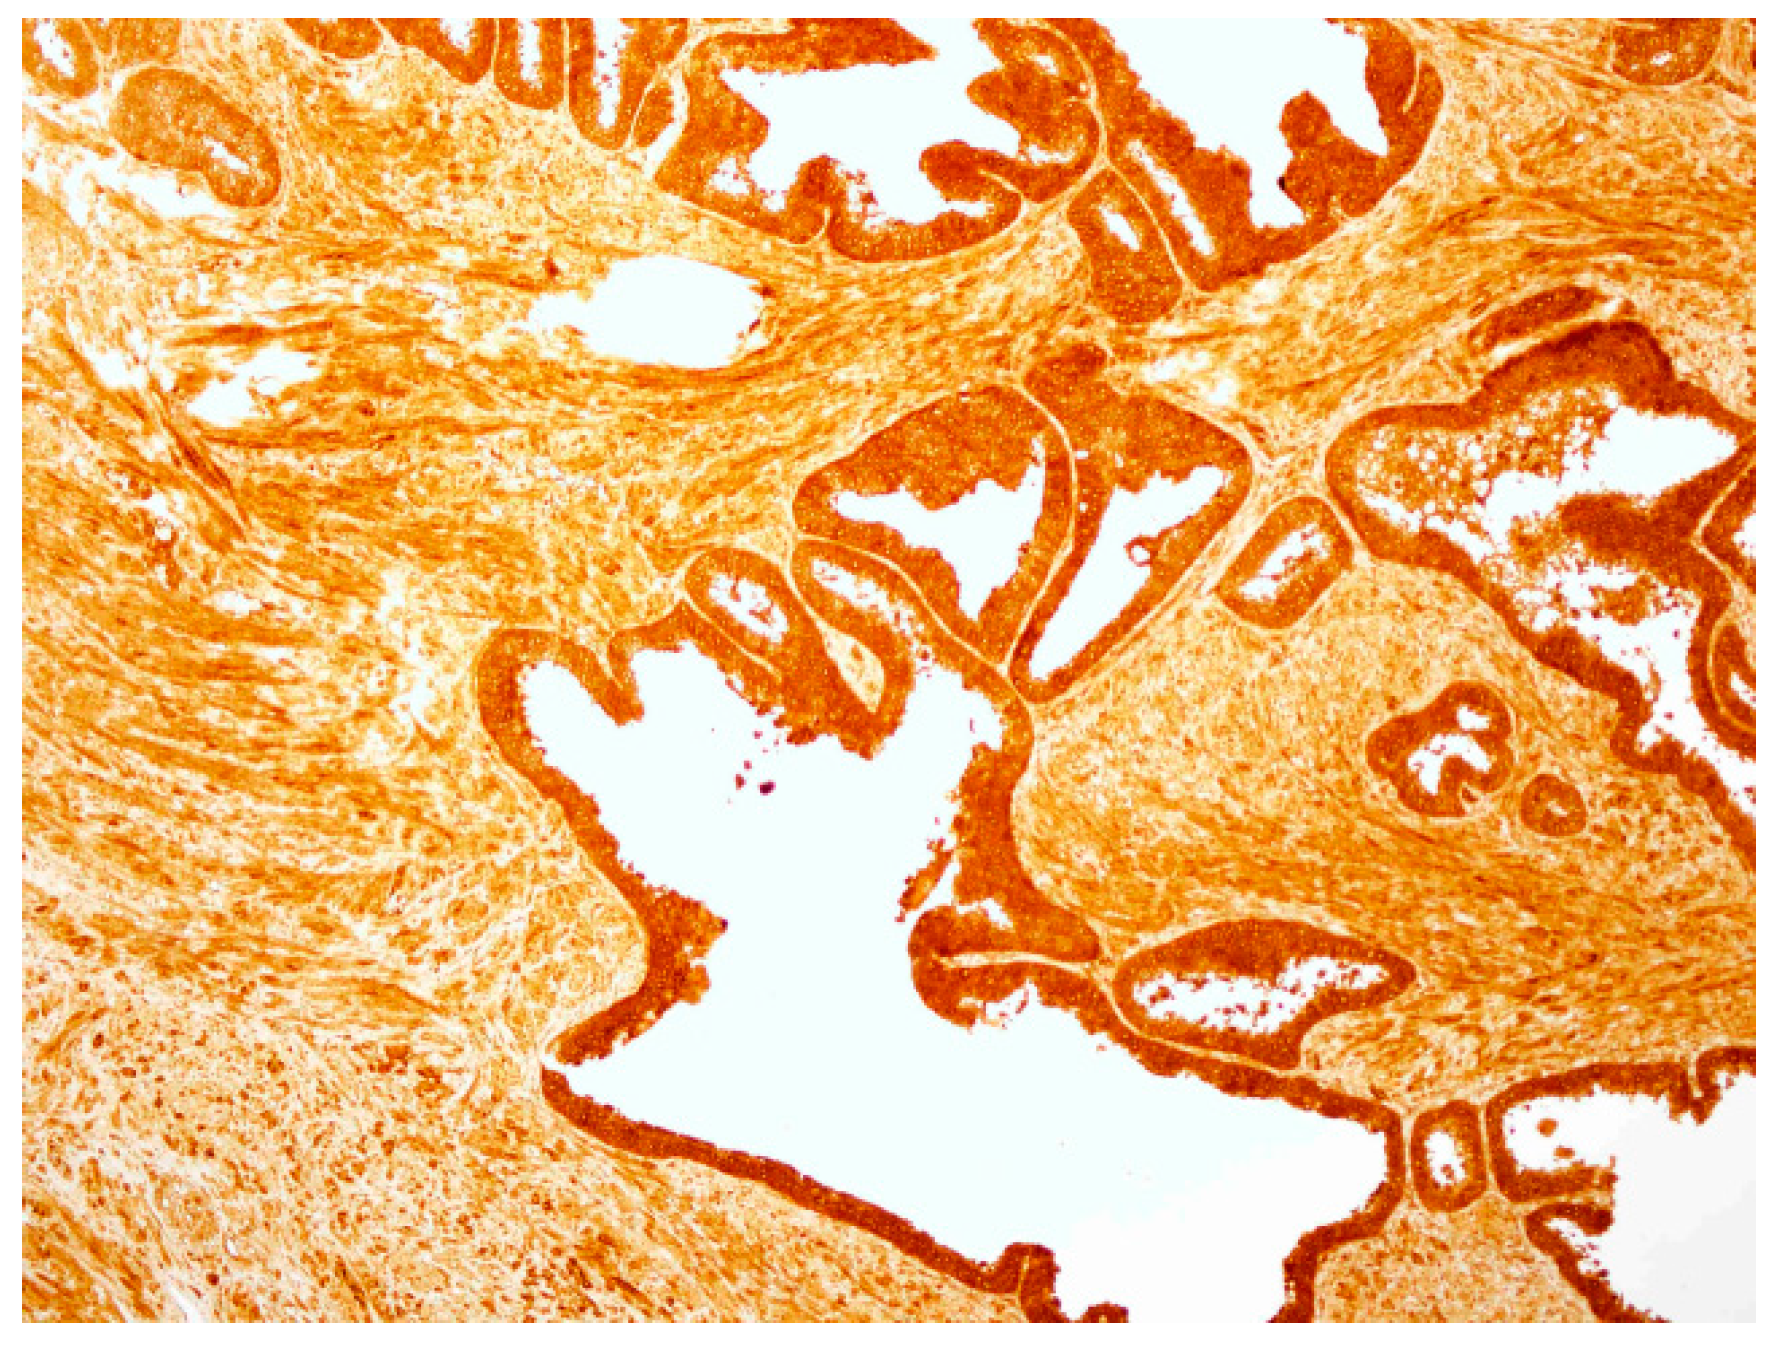
2.4. hPSA Immunohistochemistry with Biotynilated Antisense Peptide and Monoclonal Antibody
2.5. Concluding Remarks
3. Materials and Methods
3.1. Software Tools Used for Epitope and Ligand Binding Site Determination
3.2. Peptides Used in Experiments
- Human prostate specific antigen (hPSA) peptide 53–59: RHSLFHP (mw 893.02, >97% purity, GenScript, Piscataway, NJ, USA).
- C-terminal tryptophan antisense peptide: AVRDKVGW (mw 930.07, >97% purity, GenScript, Piscataway, NJ, USA).
- N-terminal biotin antisense peptide: Biotin-AVRDKVG (mw 970.15, >97% purity, GenScript, Piscataway, NJ, USA).
- N-terminal biotin peptide: Biotin-EHFRW (mw 1000.14, >97% purity, GenScript, Piscataway, NJ, USA).
3.3. Tryptophan Fluorescence (Binding of hPSA Epitope RHSLFHP and its Antisense Peptide)
3.4. Microscale Thermophoresis (Binding of hPSA Epitope RHSLFHP to its Antisense Peptide)
3.5. Magnetic Particle Enzyme Immunoassay (Binding of hPSA Epitope RHSLFHP and its Antisense Peptide)
3.6. Immunohistochemical Staining of hPSA: Protocol 1 and Protocol 2
3.6.1. Protocol 1 (Standard IHC Staining Technique)
- The specimen was covered with peroxidase block, i.e., 100 μL of 0.03% hydrogen peroxide containing sodium azide (Dako, Glostrup, Denmark), and incubated for four minutes. Following this procedure, the specimen was gently rinsed with phosphate buffered saline (PBS), and placed in a fresh buffer bath.
- Primary monoclonal mouse anti-human PSA antibody (Clone ER-PR8, Code M0750; Dako, Glostrup, Denmark) was diluted with standard diluent containing 0.05 mol/L TRIS-HCl buffer and a 1% bovine serum albumin (BSA). 100 μL of primary antibody diluted in the proportion 1:100 was used to cover the specimen. After 30 min of incubation at room temperature, the specimen was gently rinsed with PBS and placed in a fresh buffer bath.
- 100 μL of HRP-labelled polymer conjugated to goat anti-mouse immunoglobulins in Tris-HCl buffer containing stabilizing protein and an anti-microbial agent (Dako, Glostrup, Denmark) was applied to cover the specimen, followed by a 30 min incubation. After 30 min of incubation, the specimen was gently rinsed with PBS and placed in a fresh buffer bath.
- The specimen was covered with 100 μL of AEC + substrate-chromogen solution for 10 min, i.e., 3-amino-9-ethylcarbazole containing hydrogen peroxide, stabilizers, enhancers and anti-microbial agent (Dako, Glostrup, Denmark). After that period the specimen was again rinsed with PBS.
- The slides were immersed in a bath of aqueous hematoxylin (Mayerr’s hematoxylin), and rinsed gently in a distilled water bath. Slides were dipped 10 times into a bath of ammonia (0.037 mol/L), and rinsed in a bath of distilled water for four minutes.
- The specimens were mounted and coverslipped with the non-aqueous permanent mounting medium Ultramount.
3.6.2. Protocol 2 (Modified IHC Staining Using Antisense Peptide Instead of Primary Antibody)
- The specimen was covered with peroxidase block, i.e., 100 μL of 0.03% hydrogen peroxide containing sodium azide (Dako, Glostrup, Denmark), and incubated for four minutes. Following this, the specimen was gently rinsed with phosphate buffered saline (PBS), and placed in a fresh buffer bath.
- Biotinylated antisense peptide AVRDKVG (GenScript, Piscataway, NJ, USA) directed to PSA epitope 53–59 (RHSLFHP) was used to cover the specimen. Five milligrams of Biotin-AVRDKVG antisense was diluted in 2.5 mL PBS. Dilutions 1:10, 1:50, 1:100, 1:200 and 1:500 were applied to cover the specimen. A 100 μL volume was used per section. After 30 min of incubation, each specimen was gently rinsed with PBS and placed in a fresh buffer bath.
- Anti-biotin antibody conjugated to HRP (ab34645, Abcam, Cambridge, UK) was applied to cover the specimen. Of the antibody 10 mg/2 mL was diluted 1:100. One hundred microliters of the diluted antibody was applied to cover each specimen, followed by a 30 min incubation. After the incubation, the specimen was gently rinsed with PBS and placed in a fresh buffer bath.
- The specimen was covered with 100 μL of AEC + substrate-chromogen solution for 10 min, i.e., 3-amino-9-ethylcarbazole containing hydrogen peroxide, stabilizers, enhancers and an anti-microbial agent (Dako, Glostrup, Denmark). After that period the specimen was again rinsed with PBS.
- The slides were immersed in a bath of aqueous hematoxylin (Mayerr’s hematoxylin), and rinsed gently in a distilled water bath. The slides were dipped 10 times into a bath of ammonia (0.037 mol/L), and then rinsed in a bath of distilled water for four minutes.
- The specimens were mounted and coverslipped with non-aqueous permanent mounting medium Ultramount.
Supplementary Materials
Author Contributions
Acknowledgments
Conflicts of Interest
Abbreviations
| BLAST | Basic Local Alignment Search Tool |
| hPSA | Human Prostate Specific Antigen |
| HRP | Horseradish Peroxidase |
| IHC | Immunohistochemistry |
| Kd | Dissociation Constant |
| mAb | Monoclonal Antibody |
| MPEIA | Magnetic Particle Enzyme Immunoassay |
| MST | Microscale Thermophoresis |
| PDB | Protein Data Bank |
| PMT | Photomultiplier Tube |
| RMSD | Root-Mean-Square-Deviation |
| SEM | Standard Error of the Mean |
Appendix A


| hPSA Region 53–60 (RHSLFHPE) | Antisense Ligand (AVRDKVG) |
|---|---|
| L 56 | V6, G7 |
| H 58 | D4, V6, G7/R3 |
| E 60 | G7 |


| Score | Criteria |
|---|---|
| Optimal (3) | Staining reaction considered perfect or close to perfect. |
| Good (2) | Staining reaction considered fully acceptable. The protocol may be optimized to ensure the best staining intensity and signal-to-noise ratio. |
| Borderline (1) | Staining considered insufficient. |
| Poor (0) | Staining considered very insufficient. |
References
- Weber, G.F. Molecular Therapies of Cancer, 1st ed.; Springer: Cham, Switzerland, 2015; pp. 1–5. ISBN 978-3-319-13277-8. [Google Scholar]
- Padma, V.V. An overview of targeted cancer therapy. BioMedicine (Taipei) 2015, 5, 1–6. [Google Scholar] [CrossRef]
- Li, P.; Wong, Y.N.; Jahnke, J.; Pettit, A.R.; Doshi, J.A. Association of high cost sharing and targeted therapy initiation among elderly Medicare patients with metastatic renal cell carcinoma. Cancer Med. 2018, 7, 75–86. [Google Scholar] [CrossRef] [PubMed]
- Xiao, Y.F.; Jie, M.M.; Li, B.S.; Hu, C.J.; Xie, R.; Tang, B.; Yang, S.M. Peptide-based treatment: A promising cancer therapy. J. Immunol. Res. 2015, 761820. [Google Scholar] [CrossRef] [PubMed]
- Li, H.M.; Dong, Z.P.; Wang, Q.Y.; Liu, L.X.; Li, B.X.; Ma, X.N.; Lin, M.S.; Lu, T.; Wang, Y. De Novo computational design for development of a peptide ligand oriented to VEGFR-3 with high affinity and long circulation. Mol. Pharm. 2017, 14, 2236–2244. [Google Scholar] [CrossRef]
- Walsh, G. Proteins—Biochemistry and Biotechnology, 2nd ed.; Wiley Blackwell: Chichester, UK, 2014; pp. 205–220. ISBN 978-0-470-66985-3. [Google Scholar]
- Jeannin, P.; Delneste, Y.; Buisine, E.; Le Mao, J.; Didierlaurent, A.; Stewart, G.A.; Tartar, A.; Tonnel, A.B.; Pestel, J. Immunogenicity and antigenicity of synthetic peptides derived from the mite allergen Der p I. Mol. Immunol. 1993, 30, 511–518. [Google Scholar] [CrossRef]
- Trier, N.H.; Hansen, P.R.; Houen, G. Production and characterization of peptide antibodies. Methods 2012, 56, 136–144. [Google Scholar] [CrossRef]
- Leenaars, M.; Hendriksen, C.F. Critical steps in the production of polyclonal and monoclonal antibodies: Evaluation and recommendations. ILAR J. 2005, 46, 269–279. [Google Scholar] [CrossRef]
- Tropsha, A.; Kizert, J.S.; Chaiken, I.M. Making sense from antisense: A review of experimental data and developing ideas on sense-antisense peptide recognition. J. Mol. Recognit. 1992, 5, 43–54. [Google Scholar] [CrossRef]
- Heal, J.R.; Roberts, G.W.; Raynes, J.G.; Bhakoo, A.; Miller, A.D. Specific interactions between sense and complementary peptides: The basis for the proteomic code. ChemBioChem 2002, 3, 136–151. [Google Scholar] [CrossRef]
- Biro, J.C. The proteomic code: A molecular recognition code for proteins. Theor. Biol. Med. Model. 2007, 4, 1–45. [Google Scholar] [CrossRef] [PubMed]
- Blalock, J.E. Genetic origin of protein shape and interaction rules. Nat. Med. 1995, 1, 876–878. [Google Scholar] [CrossRef]
- Root-Bernstein, R.S. Amino acid pairing. J. Theor. Biol. 1982, 94, 885–894. [Google Scholar] [CrossRef]
- Siemion, I.Z.; Cebrat, M.; Kluczyk, A. The problem of amino acid complementarity and antisense peptides. Curr. Protein Peptide Sci. 2004, 5, 507–527. [Google Scholar] [CrossRef]
- Root-Bernstein, R.S. Peptide self-aggregation and peptide complementarity as bases for the evolution of peptide receptors: A review. J. Mol. Recognit. 2005, 18, 40–49. [Google Scholar] [CrossRef]
- Miller, A.D. Sense-antisense (complementary) peptide interactions and the proteomic code; potential opportunities in biology and pharmaceutical science. Expert Opin. Biol. Ther. 2015, 15, 245–267. [Google Scholar] [CrossRef]
- Štambuk, N.; Konjevoda, P.; Boban-Blagaić, A.; Pokrić, B. Molecular recognition theory of the complementary (antisense) peptide interactions. Theory Biosci. 2005, 123, 265–275. [Google Scholar] [CrossRef]
- Štambuk, N.; Manojlović, Z.; Turčić, P.; Martinić, R.; Konjevoda, P.; Weitner, T.; Wardega, P.; Gabričević, M. A simple three-step method for design and affinity testing of new antisense peptides: An Example of Erythropoietin. Int. J. Mol. Sci. 2014, 15, 9209–9223. [Google Scholar] [CrossRef]
- Štambuk, N.; Konjevoda, P.; Turčić, P.; Kövér, K.; Novak Kujundžić, R.; Manojlović, Z.; Gabričević, M. Genetic coding algorithm for sense and antisense peptide interactions. BioSystems 2018, 164, 199–216. [Google Scholar] [CrossRef]
- Root-Bernstein, R. How to make a non-antigenic protein (auto) antigenic: Molecular complementarity alters antigen processing and activates adaptive-innate immunity synergy. Anticancer Agents Med. Chem. 2015, 15, 1242–1259. [Google Scholar] [CrossRef]
- Dijkstra, S.; Hendriks, R.J.; Leyten, G.H.J.M.; Mulders, P.F.A.; Schalken, J.A. Biomarkers for Prostate Cancer. In Management of Prostate Cancer—A Multidicsiplinary Approach; Bolla, M., van Poppel, H., Eds.; Springer: Cham, Switzerland, 2017; pp. 77–96. ISBN 978-3-319-42768-3. [Google Scholar]
- Jette, D.C.; Kreutz, F.T.; Malcolm, B.A.; Wishart, D.S.; Noujaim, A.A.; Suresh, M.R. Epitope mapping of prostate-specific antigen with monoclonal antibodies. Clin. Chem. 1996, 42, 1961–1969. [Google Scholar]
- Corey, E.; Wegner, S.K.; Corey, M.J.; Vessella, R.L. Prostate-specific antigen: characterization of epitopes by synthetic peptide mapping and inhibition studies. Clin. Chem. 1997, 43, 575–584. [Google Scholar] [PubMed]
- Michel, S.; Deléage, G.; Charrier, J.P.; Passagot, J.; Battail-Poirot, N.; Sibai, G.; Jolivet, M.; Jolivet-Reynaud, C. Anti-free prostate-specific antigen monoclonal antibody epitopes defined by mimotopes and molecular modeling. Clin. Chem. 1999, 45, 638–650. [Google Scholar] [PubMed]
- Piironen, T.; Villoutreix, B.O.; Becker, C.; Hollingsworth, K.; Vihinen, M.; Bridon, D.; Qiu, X.; Rapp, J.; Dowell, B.; Lövgren, T.; et al. Determination and analysis of antigenic epitopes of prostate specific antigen (PSA) and human glandular kallikrein 2 (hK2) using synthetic peptides and computer modeling. Protein Sci. 1998, 7, 259–269. [Google Scholar] [CrossRef] [PubMed]
- Štambuk, N.; Konjevoda, P. Structural and functional modeling of artificial bioactive proteins. Information 2017, 8, 29. [Google Scholar] [CrossRef]
- Gasteiger, E.; Hoogland, C.; Gattiker, A.; Duvaud, S.; Wilkins, M.R.; Appel, R.D.; Bairoch, A. Protein identification and analysis tools on the ExPASy server. In The Proteomics Protocols Handbook; Walker, J.M., Ed.; Humana Press: Totowa, NJ, USA, 2005; pp. 571–607. ISBN 978-1-58829-343-5. [Google Scholar]
- Saha, S.; Raghava, G.P.S. BcePred: Prediction of Continuous B-Cell Epitopes in Antigenic Sequences Using Physico-chemical Properties. In ICARIS 2004; Nicosia, G., Cutello, V., Bentley, P.J., Timis, J., Eds.; Springer: Berlin, Germany, 2004; LNCS 3239; pp. 197–204. ISBN 978-3-540-23097-7. [Google Scholar]
- Jespersen, M.C.; Peters, B.; Nielsen, M.; Marcatili, P. BepiPred-2.0: Improving sequence-based B-cell epitope prediction using conformational epitopes. Nucleic Acids Res. 2017, 45, W24–W29. [Google Scholar] [CrossRef]
- Singh, H.; Ansari, H.R.; Raghava, P.S.G. Improved method for linear B-cell epitope prediction using antigen’s primary sequence. PLoS ONE 2013, 8, e62216. [Google Scholar] [CrossRef] [PubMed]
- Sweredoski, M.J.; Pierre Baldi, P. COBEpro: A novel system for predicting continuous B-cell epitopes. Protein Eng. Des. Sel. 2009, 22, 113–120. [Google Scholar] [CrossRef]
- Joo, K.; Lee, S.J.; Lee, J. Sann: Solvent accessibility prediction of proteins by nearest neighbor method. Proteins 2012, 80, 1791–1797. [Google Scholar] [CrossRef]
- Ahmad, S.; Gromiha, M.M.; Sarai, A. RVP-net: online prediction of real valued accessible surface area of proteins from single sequences. Bioinformatics 2003, 19, 1849–1851. [Google Scholar] [CrossRef]
- Petersen, B.; Lundegaard, C.; Petersen, T.N. NetTurnP—Neural network prediction of beta-turns by use of evolutionary information and predicted protein sequence features. PLoS ONE 2010, 5, e15079. [Google Scholar] [CrossRef]
- Wang, H.W.; Lin, Y.C.; Pai, T.W.; Chang, H.T. Prediction of B-cell linear epitopes with a combination of support vector machine classification and amino acid propensity identification. J. Biomed. Biotechnol. 2011, 2011, 1–12. [Google Scholar] [CrossRef] [PubMed]
- Veljkovic, N.; Glisic, S.; Prljic, J.; Perovic, V.; Botta, M.; Veljkovic, V. Discovery of new therapeutic targets by the informational spectrum method. Curr. Protein Pept. Sci. 2008, 9, 493–506. [Google Scholar] [CrossRef] [PubMed]
- Tintori, C.; Manetti, F.; Veljkovic, N.; Perovic, V.; Vercammen, J.; Hayes, S.; Massa, S.; Witvrouw, M.; Debyser, Z.; Veljkovic, V.; et al. Novel virtual screening protocol based on the combined use of molecular modeling and electron-ion interaction potential techniques to design HIV-1 integrase inhibitors. J. Chem. Inf. Model. 2007, 47, 1536–1544. [Google Scholar] [CrossRef]
- Cosic, I. The Resonant Recognition Model of Macromolecular Bioactivity: Theory and Applications; Birkhäuser: Basel, Switzerland, 1997; pp. 1–87. ISBN 978-3-0348-7475-5. [Google Scholar]
- Veljkovic, V.; Veljkovic, N.; Esté, J.A.; Hüther, A.; Dietrich, U. Application of the EIIP/ISM bioinformatics concept in development of new drugs. Curr. Med. Chem. 2007, 14, 441–453. [Google Scholar] [CrossRef] [PubMed]
- Kelley, L.A.; Mezulis, S.; Yates, C.M.; Wass, M.N.; Sternberg, M.J. The Phyre2 web portal for protein modeling, prediction and analysis. Nat. Protoc. 2015, 10, 845–858. [Google Scholar] [CrossRef] [PubMed]
- Wass, M.N.; Kelley, L.A.; Sternberg, M.J. 3DLigandSite: predicting ligand-binding sites using similar structures. Nucleic Acids Res. 2010, 38, W469–W473. [Google Scholar] [CrossRef]
- Wass, M.N.; Sternberg, M.J. Prediction of ligand binding sites using homologous structures and conservation at CASP8. Proteins 2009, 77, 147–151. [Google Scholar] [CrossRef] [PubMed]
- Källberg, M.; Wang, H.; Wang, S.; Peng, J.; Wang, Z.; Lu, H.; Xu, J. Template-based protein structure modeling using the RaptorX web server. Nat. Protoc. 2012, 7, 1511–1522. [Google Scholar] [CrossRef]
- Altschul, S.F.; Madden, T.L.; Schäffer, A.A.; Zhang, J.; Zhang, Z.; Miller, W.; Lipman, D.J. Gapped BLAST and PSI-BLAST: A new generation of protein database search programs. Nucleic Acids Res. 1997, 25, 3389–3402. [Google Scholar] [CrossRef]
- Singh, S.; Singh, H.; Tuknait, A.; Chaudhary, K.; Singh, B.; Kumaran, S.; Raghava, G.P. PEPstrMOD: structure prediction of peptides containing natural, non-natural and modified residues. Biol. Direct. 2015, 10, 73. [Google Scholar] [CrossRef]
- De Vries, S.J.; Rey, J.; Schindler, C.E.M.; Zacharias, M.; Tuffery, P. The pepATTRACT web server for blind, large-scale peptide-protein docking. Nucleic Acids Res. 2017, 45, W361–W364. [Google Scholar] [CrossRef]
- Kurcinski, M.; Jamroz, M.; Blaszczyk, M.; Kolinski, A.; Kmiecik, S. CABS-dock web server for the flexible docking of peptides to proteins without prior knowledge of the binding site. Nucleic Acids Res. 2015, 43, W419–W424. [Google Scholar] [CrossRef]
- Turčić, P.; Štambuk, N.; Konjevoda, P.; Kelava, T.; Gabričević, M.; Stojković, R.; Aralica, G. Modulation of γ2-MSH hepatoprotection by antisense peptides and melanocortin subtype 3 and 4 receptor antagonists. Med. Chem. 2015, 11, 286–925. [Google Scholar] [CrossRef]
- Štambuk, N.; Konjevoda, P.; Manojlović, Z.; Novak Kujundžić, R. The use of the Miyazawa-Jernigan residue contact potential in analyses of molecular interaction and recognition with complementary peptides. In Bioinformatics and Biomedical Engineering, IWBBIO 2016; Ortuno, F., Rojas, I., Eds.; Springer: Cham, Switzerland, 2016; LNCS 9656; pp. 91–102. ISBN 978-3-319-31744-1. [Google Scholar]
- Jerabek-Willemsen, M.; Wienken, C.J.; Braun, D.; Baaske, P.; Duhr, S. Molecular interaction studies using microscale thermophoresis. Assay Drug Dev. Technol. 2011, 9, 342–353. [Google Scholar] [CrossRef]
- Wienken, C.J.; Baaske, P.; Rothbauer, U.; Braun, D.; Duhr, S. Protein-binding assays in biological liquids using microscale thermophoresis. Nat. Commun. 2010, 1. [Google Scholar] [CrossRef]
- Ohlson, S.; Strandh, M.; Nilshans, H. Detection and characterization of weak affinity antibody antigen recognition with biomolecular interaction analysis. J. Mol. Recognit. 1997, 10, 135–138. [Google Scholar] [CrossRef]
- Strandh, M.; Persson, B.; Roos, H.; Ohlson, S. Studies of interactions with weak affinities and low-molecular-weight compounds using surface plasmon resonance technology. J. Mol. Recognit. 1998, 11, 188–190. [Google Scholar] [CrossRef]
- Strandh, M. Insights into weak affinity antibody-antigen interactions: Studies using affinity chromatography and optical biosensor. Ph.D. Thesis, Lund University, Lund, Sweden, 17 November 2000. [Google Scholar]
- Lin, F.; Chen, Z. Standardization of diagnostic immunohistochemistry: Literature review and geisinger experience. Arch. Pathol. Lab. Med. 2014, 138, 1564–1577. [Google Scholar] [CrossRef]
- Vyberg, M.; Nielsen, S. Proficiency testing in immunohistochemistry–experiences from Nordic Immunohistochemical Quality Control (NordiQC). Virchows Arch. 2016, 468, 19–29. [Google Scholar] [CrossRef]
- Dako. 0843 Monoclonal Mouse Anti-Human Prostate-Specific Antigen, Clone ER-PR8. Code M0750. Available online: https://www.agilent.com/cs/library/packageinsert/public/SSM0750CEEFG_01.pdf/ (accessed on 8 March 2019).
- Stenman, U.-H.; Paus, E.; Allard, W.J.; Andersson, I.; Andrès, C.; Barnett, T.R.; Becker, C.; Belenky, A.; Bellanger, L.; Pellegrino, C.M.; et al. Summary report of the TD-3 workshop: characterization of 83 antibodies against prostate-specific antigen. Tumor Biol. 1999, 20, 1–12. [Google Scholar] [CrossRef]
- Torlaković, E.E.; Nielsen, S.; Francis, G.; Garratt, J.; Gilks, B.; Goldsmith, J.D.; Hornick, J.L.; Hyjek, E.; Ibrahim, M.; Miller, K.; et al. Standardization of positive controls in diagnostic immunohistochemistry: recommendations from the International Ad Hoc Expert Committee. Appl. Immunohistochem. Mol. Morphol. 2015, 23, 1–18. [Google Scholar] [CrossRef] [PubMed]
- Smith, M.R. Rituximab (monoclonal anti-CD20 antibody): Mechanisms of action and resistance. Oncogene 2003, 7359–7368. [Google Scholar] [CrossRef] [PubMed]
- Winn, M.D.; Ballard, C.C.; Cowtan, K.D.; Dodson, E.J.; Emsley, P.; Evans, P.R.; Keegan, R.M.; Krissinel, E.B.; Leslie, A.G.; McCoy, A.; et al. Overview of the CCP4 suite and current developments. Acta. Cryst. 2011, D67, 235–242. [Google Scholar] [CrossRef]


| Targeted Sequence | Epitope Scanning | Phage Library | Antibody | Study |
|---|---|---|---|---|
| GRHSLFHP | 6mer | 10mer | B80 | Jette et al. [23] |
| LLGRHSLFHPEDTGQV | 15mer | 17-1A2 | Corey et al. [24] | |
| RHSLFHP | 15mer | 6C8DS | Michel et al. [25] | |
| RHSLFHPEDTGQ | 15mer, 8mer | H164, 2Cl | Piironen et al. [26] |
| Server | Epitope Prediction Method | hPSA Epitope |
|---|---|---|
| 1 | Kyte and Doolittle (Hydrophobicity) | RHSLFHPED |
| 2 | BcePred (Antigenic propensity) | NKSVILLGRHSL |
| 3 | BepiPred-2 (Random forest detection) | FHPED |
| 4 | LBtope (SVM & κ-NN detection) | LGRHSLFHP |
| 5 | COBEpro (Epitopic propensity) | PEDTGQV |
| 7 | Sann (Solvent accessibility) | FHP |
| 6 | RVP-net (Solvent accessibility) | RHS––HP |
| 8 | NetTurnP (β-turn) | RHSL |
| 9 | LEPS (β-turn) | RHSLFH |
| 10 | Informational spectrum (ISM—EIIP) | LFHPE |
| Frequency Consensus (>5) | 111111226666677431111 NKSVILLGRHSLFHPEDTGQV |
| hPSA Epitope (aa 53–59) | RHSLFHP | Antibody Motifs (BLAST) |
|---|---|---|
| Paratope scan | AVRD | 8 |
| VRDK | 17 | |
| RDKV | 10 | |
| DKVG | 73 | |
| Antisense paratope (total) | AVRDKVG | 108 |
| Patient No.\Dilutions * | 1:10 | 1:50 | 1:100 | 1:200 | 1:500 |
|---|---|---|---|---|---|
| 1 | 0 | 1 | 2 | 0 | 0 |
| 2 | 0 | 1 | 2 | 1 | 0 |
| 3 | 0 | 2 | 3 | 1 | 0 |
| 4 | 0 | 1 | 2 | 1 | 0 |
| 5 | 0 | 1 | 3 | 1 | 0 |
| 6 | 0 | 1 | 2 | 1 | 0 |
| 7 | 0 | 1 | 2 | 1 | 0 |
| Sum of scores | 0 | 8 | 16 | 6 | 0 |
© 2019 by the authors. Licensee MDPI, Basel, Switzerland. This article is an open access article distributed under the terms and conditions of the Creative Commons Attribution (CC BY) license (http://creativecommons.org/licenses/by/4.0/).
Share and Cite
Štambuk, N.; Konjevoda, P.; Turčić, P.; Šošić, H.; Aralica, G.; Babić, D.; Seiwerth, S.; Kaštelan, Ž.; Kujundžić, R.N.; Wardega, P.; et al. Targeting Tumor Markers with Antisense Peptides: An Example of Human Prostate Specific Antigen. Int. J. Mol. Sci. 2019, 20, 2090. https://doi.org/10.3390/ijms20092090
Štambuk N, Konjevoda P, Turčić P, Šošić H, Aralica G, Babić D, Seiwerth S, Kaštelan Ž, Kujundžić RN, Wardega P, et al. Targeting Tumor Markers with Antisense Peptides: An Example of Human Prostate Specific Antigen. International Journal of Molecular Sciences. 2019; 20(9):2090. https://doi.org/10.3390/ijms20092090
Chicago/Turabian StyleŠtambuk, Nikola, Paško Konjevoda, Petra Turčić, Hrvoje Šošić, Gorana Aralica, Damir Babić, Sven Seiwerth, Željko Kaštelan, Renata Novak Kujundžić, Piotr Wardega, and et al. 2019. "Targeting Tumor Markers with Antisense Peptides: An Example of Human Prostate Specific Antigen" International Journal of Molecular Sciences 20, no. 9: 2090. https://doi.org/10.3390/ijms20092090
APA StyleŠtambuk, N., Konjevoda, P., Turčić, P., Šošić, H., Aralica, G., Babić, D., Seiwerth, S., Kaštelan, Ž., Kujundžić, R. N., Wardega, P., Žutelija, J. B., Gračanin, A. G., & Gabričević, M. (2019). Targeting Tumor Markers with Antisense Peptides: An Example of Human Prostate Specific Antigen. International Journal of Molecular Sciences, 20(9), 2090. https://doi.org/10.3390/ijms20092090