Developmental Transformation and Reduction of Connective Cavities within the Subchondral Bone

 , ,
, , 
Abstract
1. Introduction
2. Results
2.1. Layer Thickness
2.2. Transsectional Micro-CT-Analysis of the Subchondral Trabecular Bone
2.3. Microarchitecture
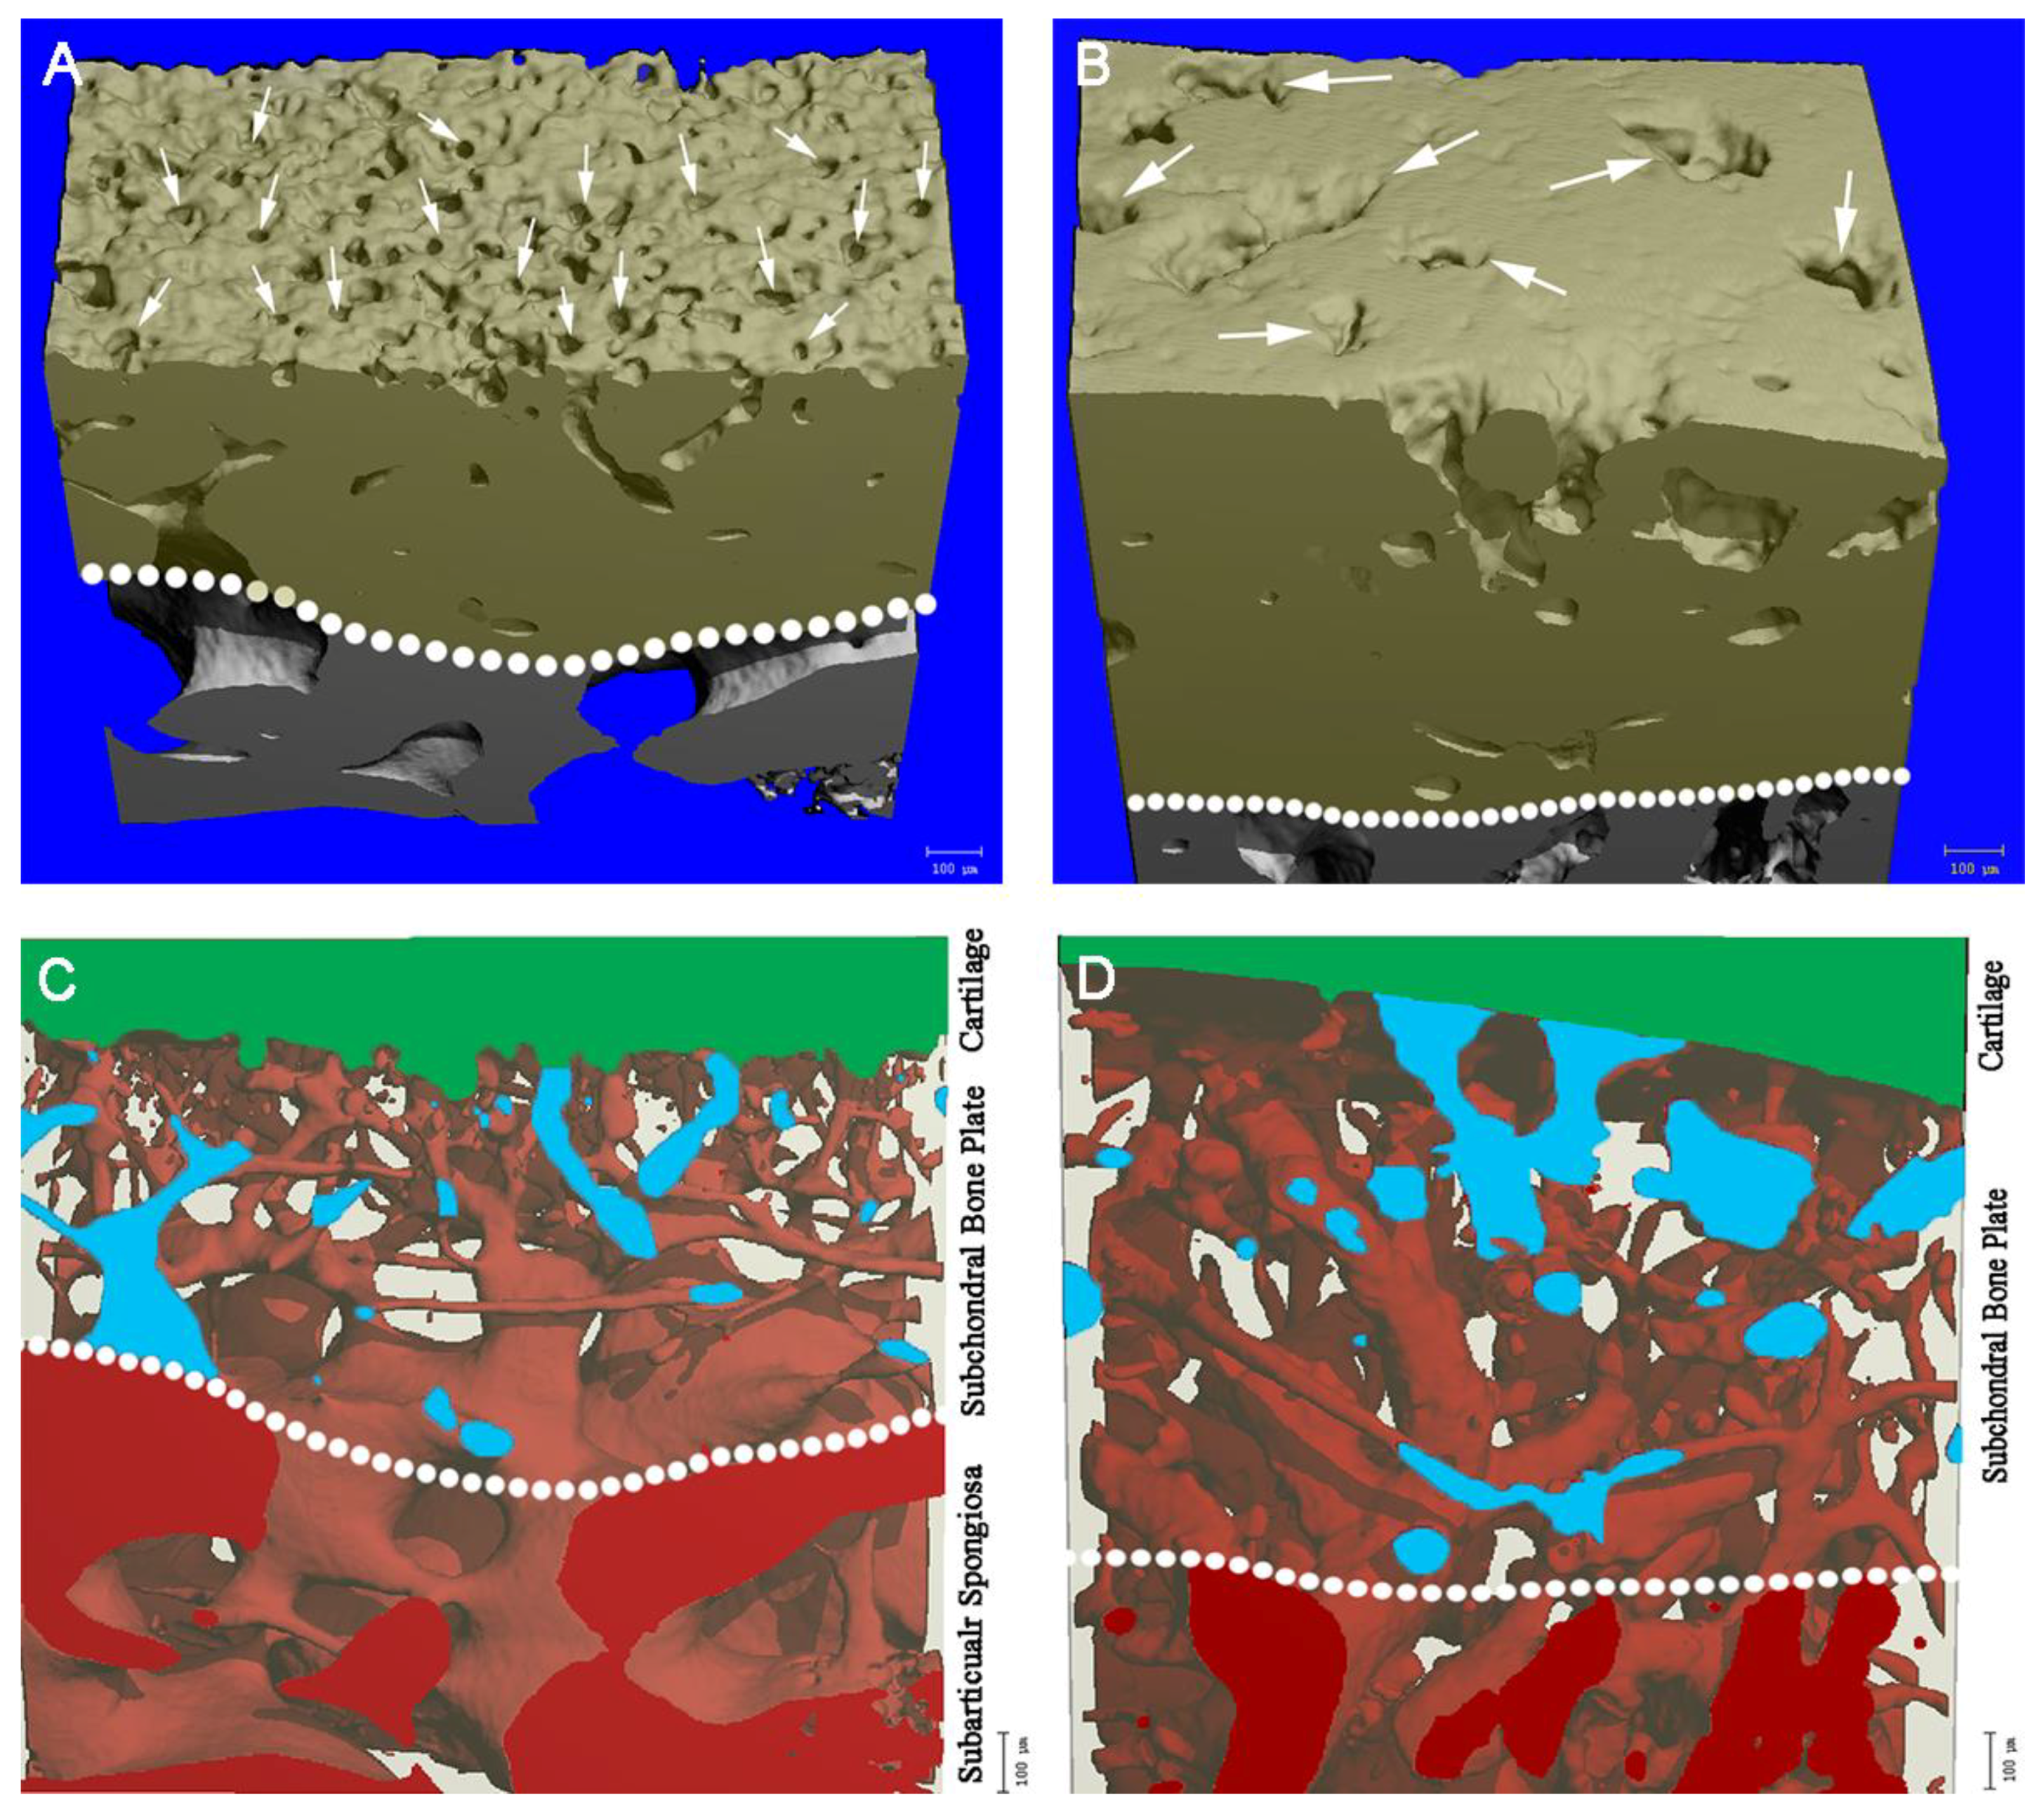
2.4. Microchannels
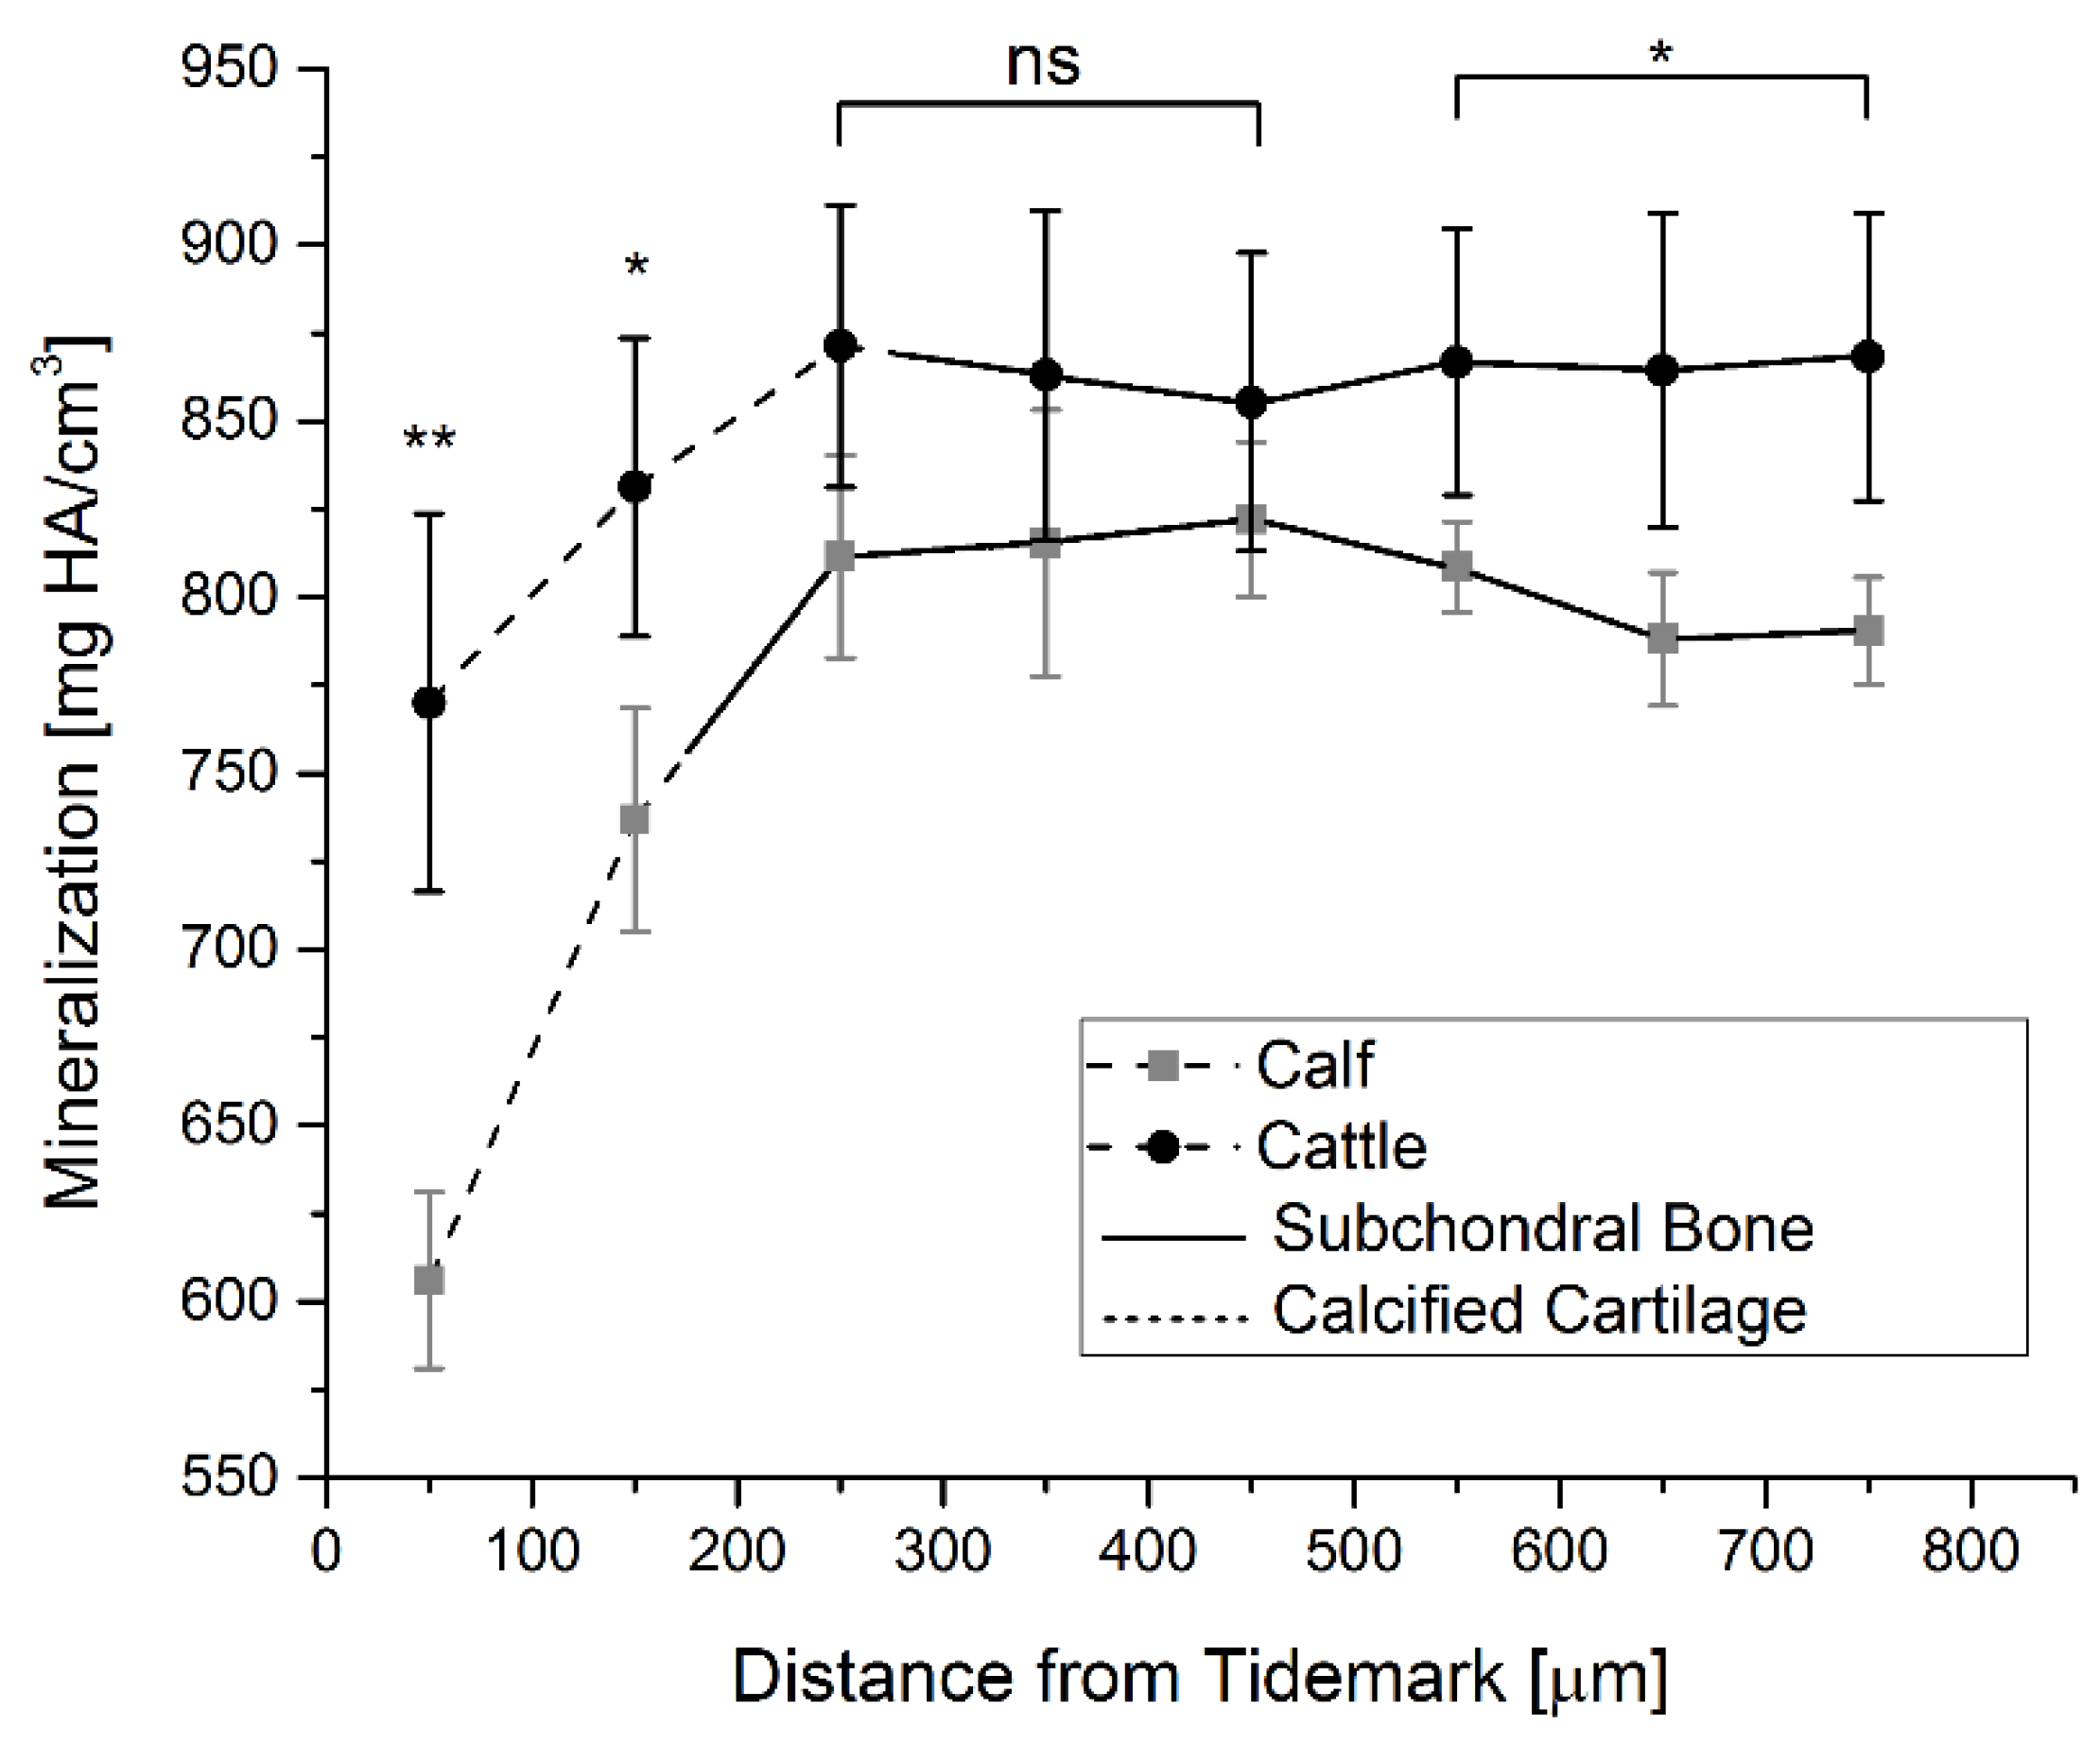
2.5. Mineralization
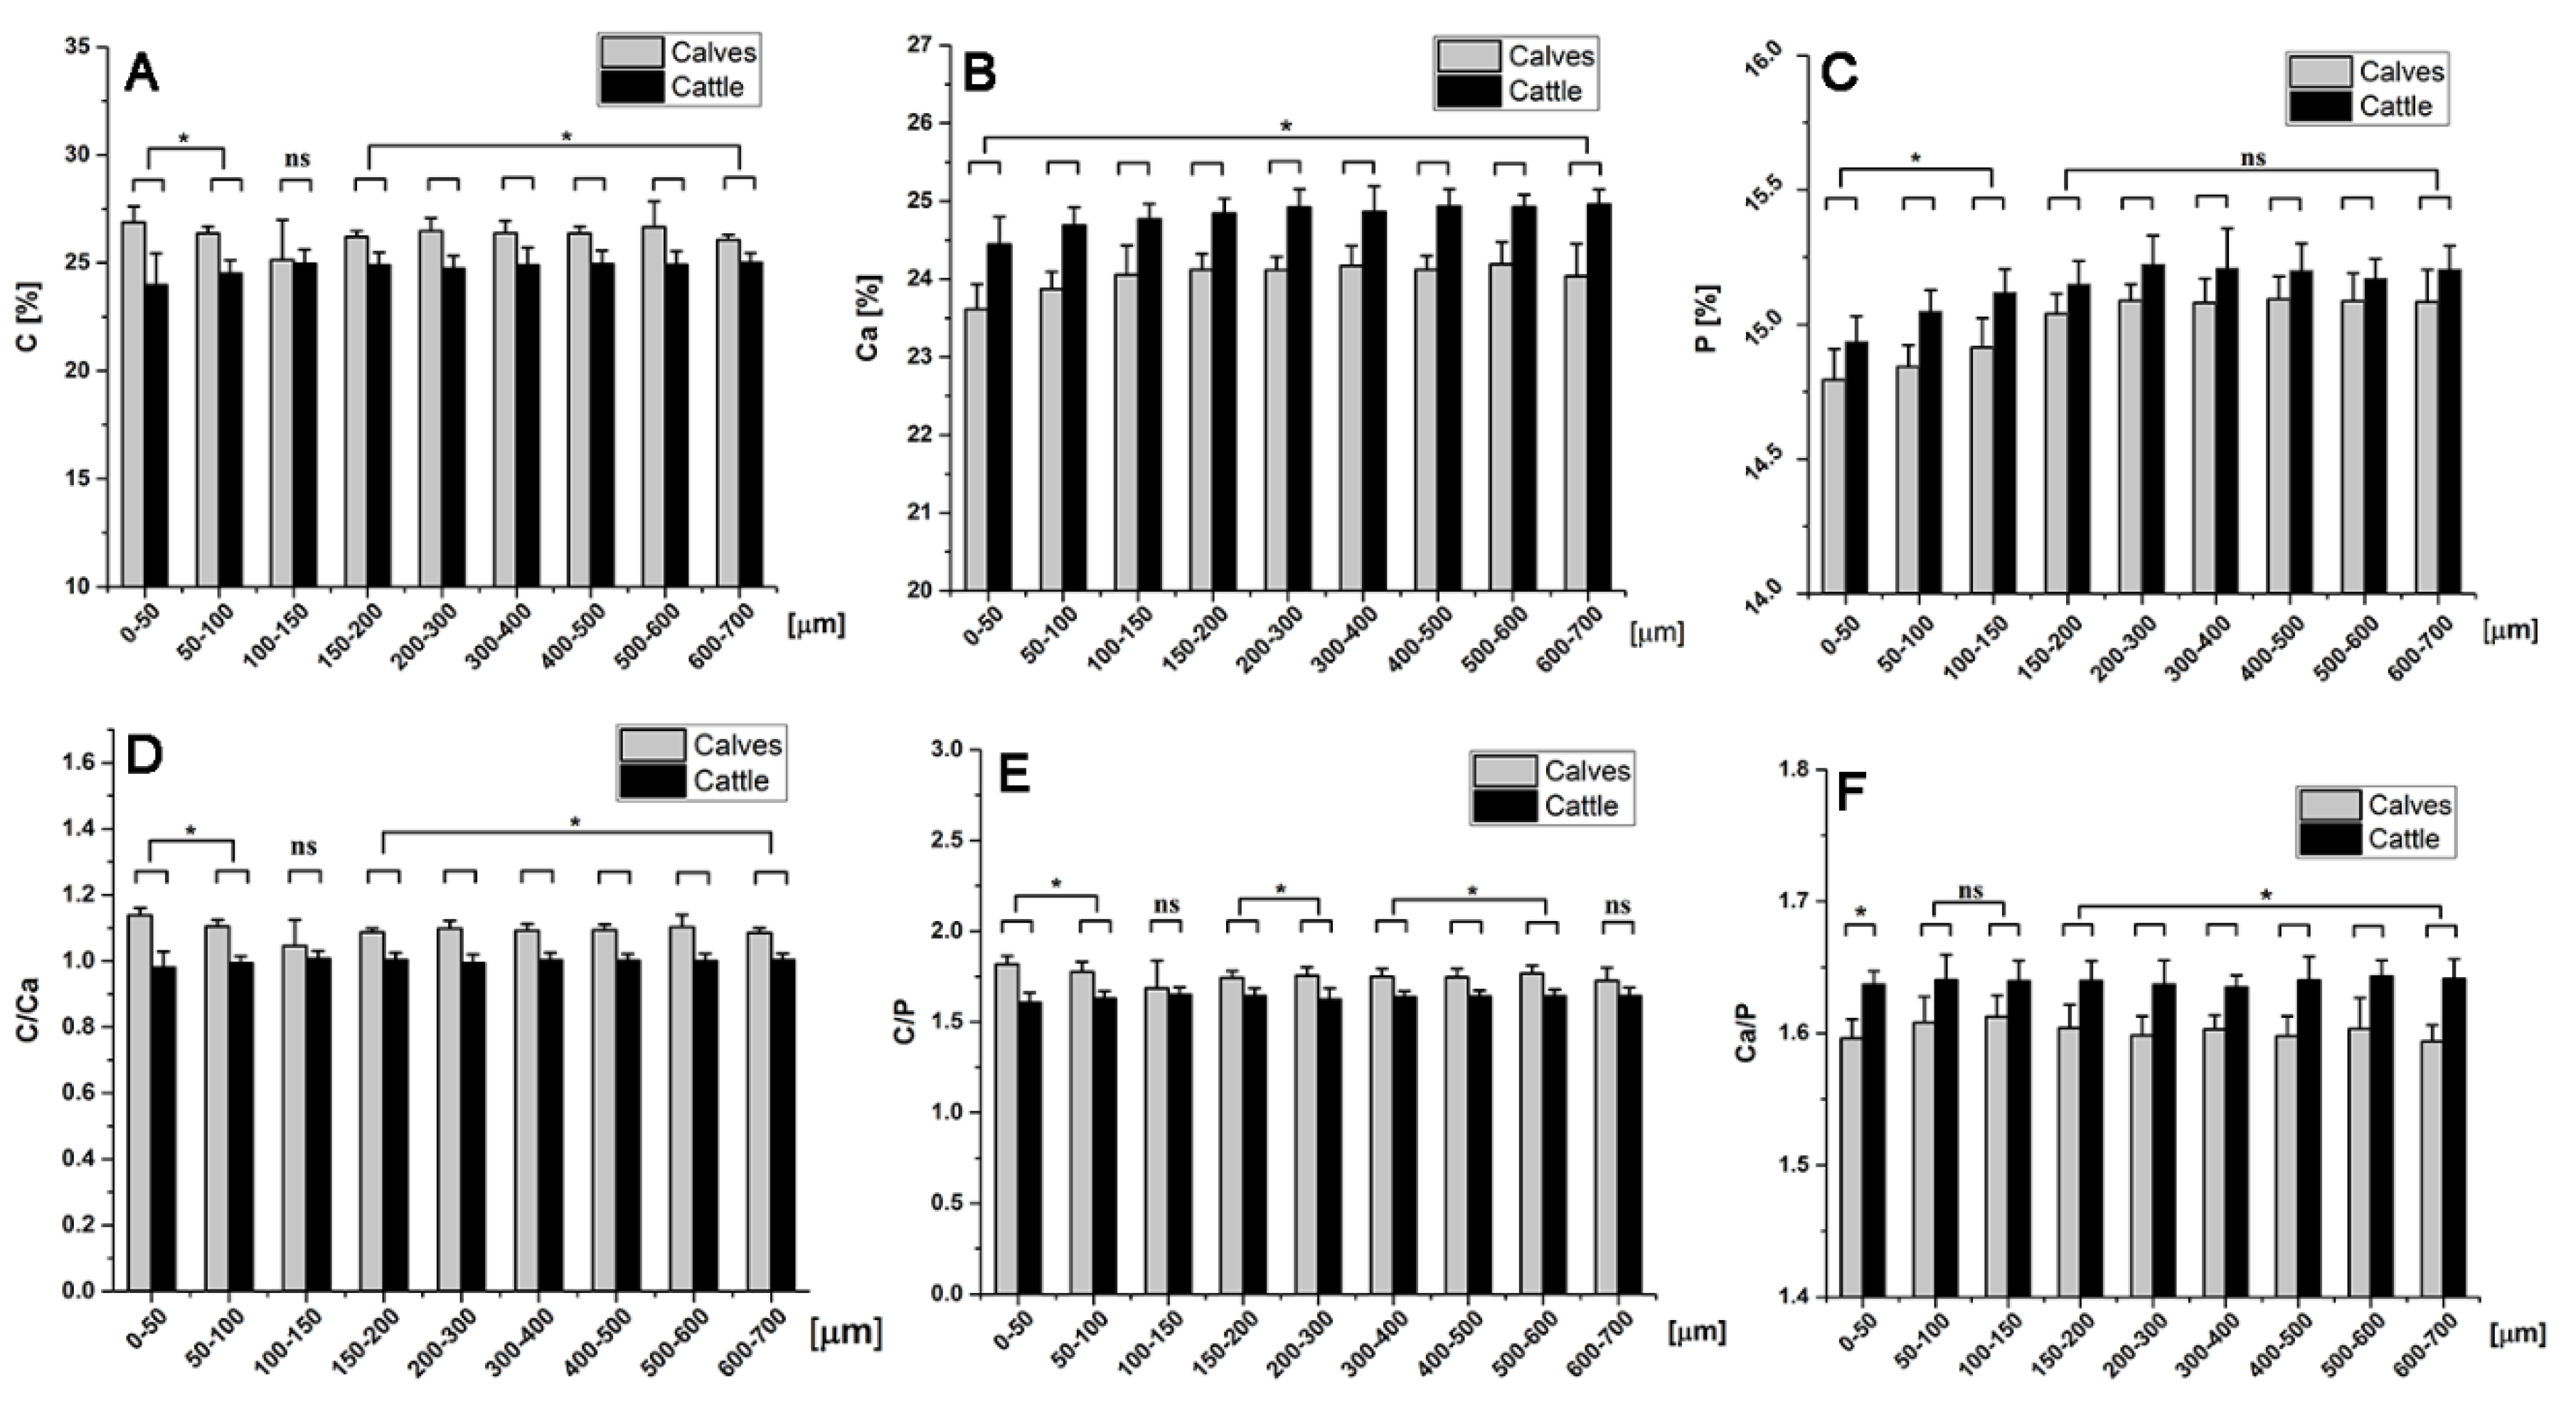
2.6. Chemical Element Analysis
3. Discussion
4. Materials and Methods
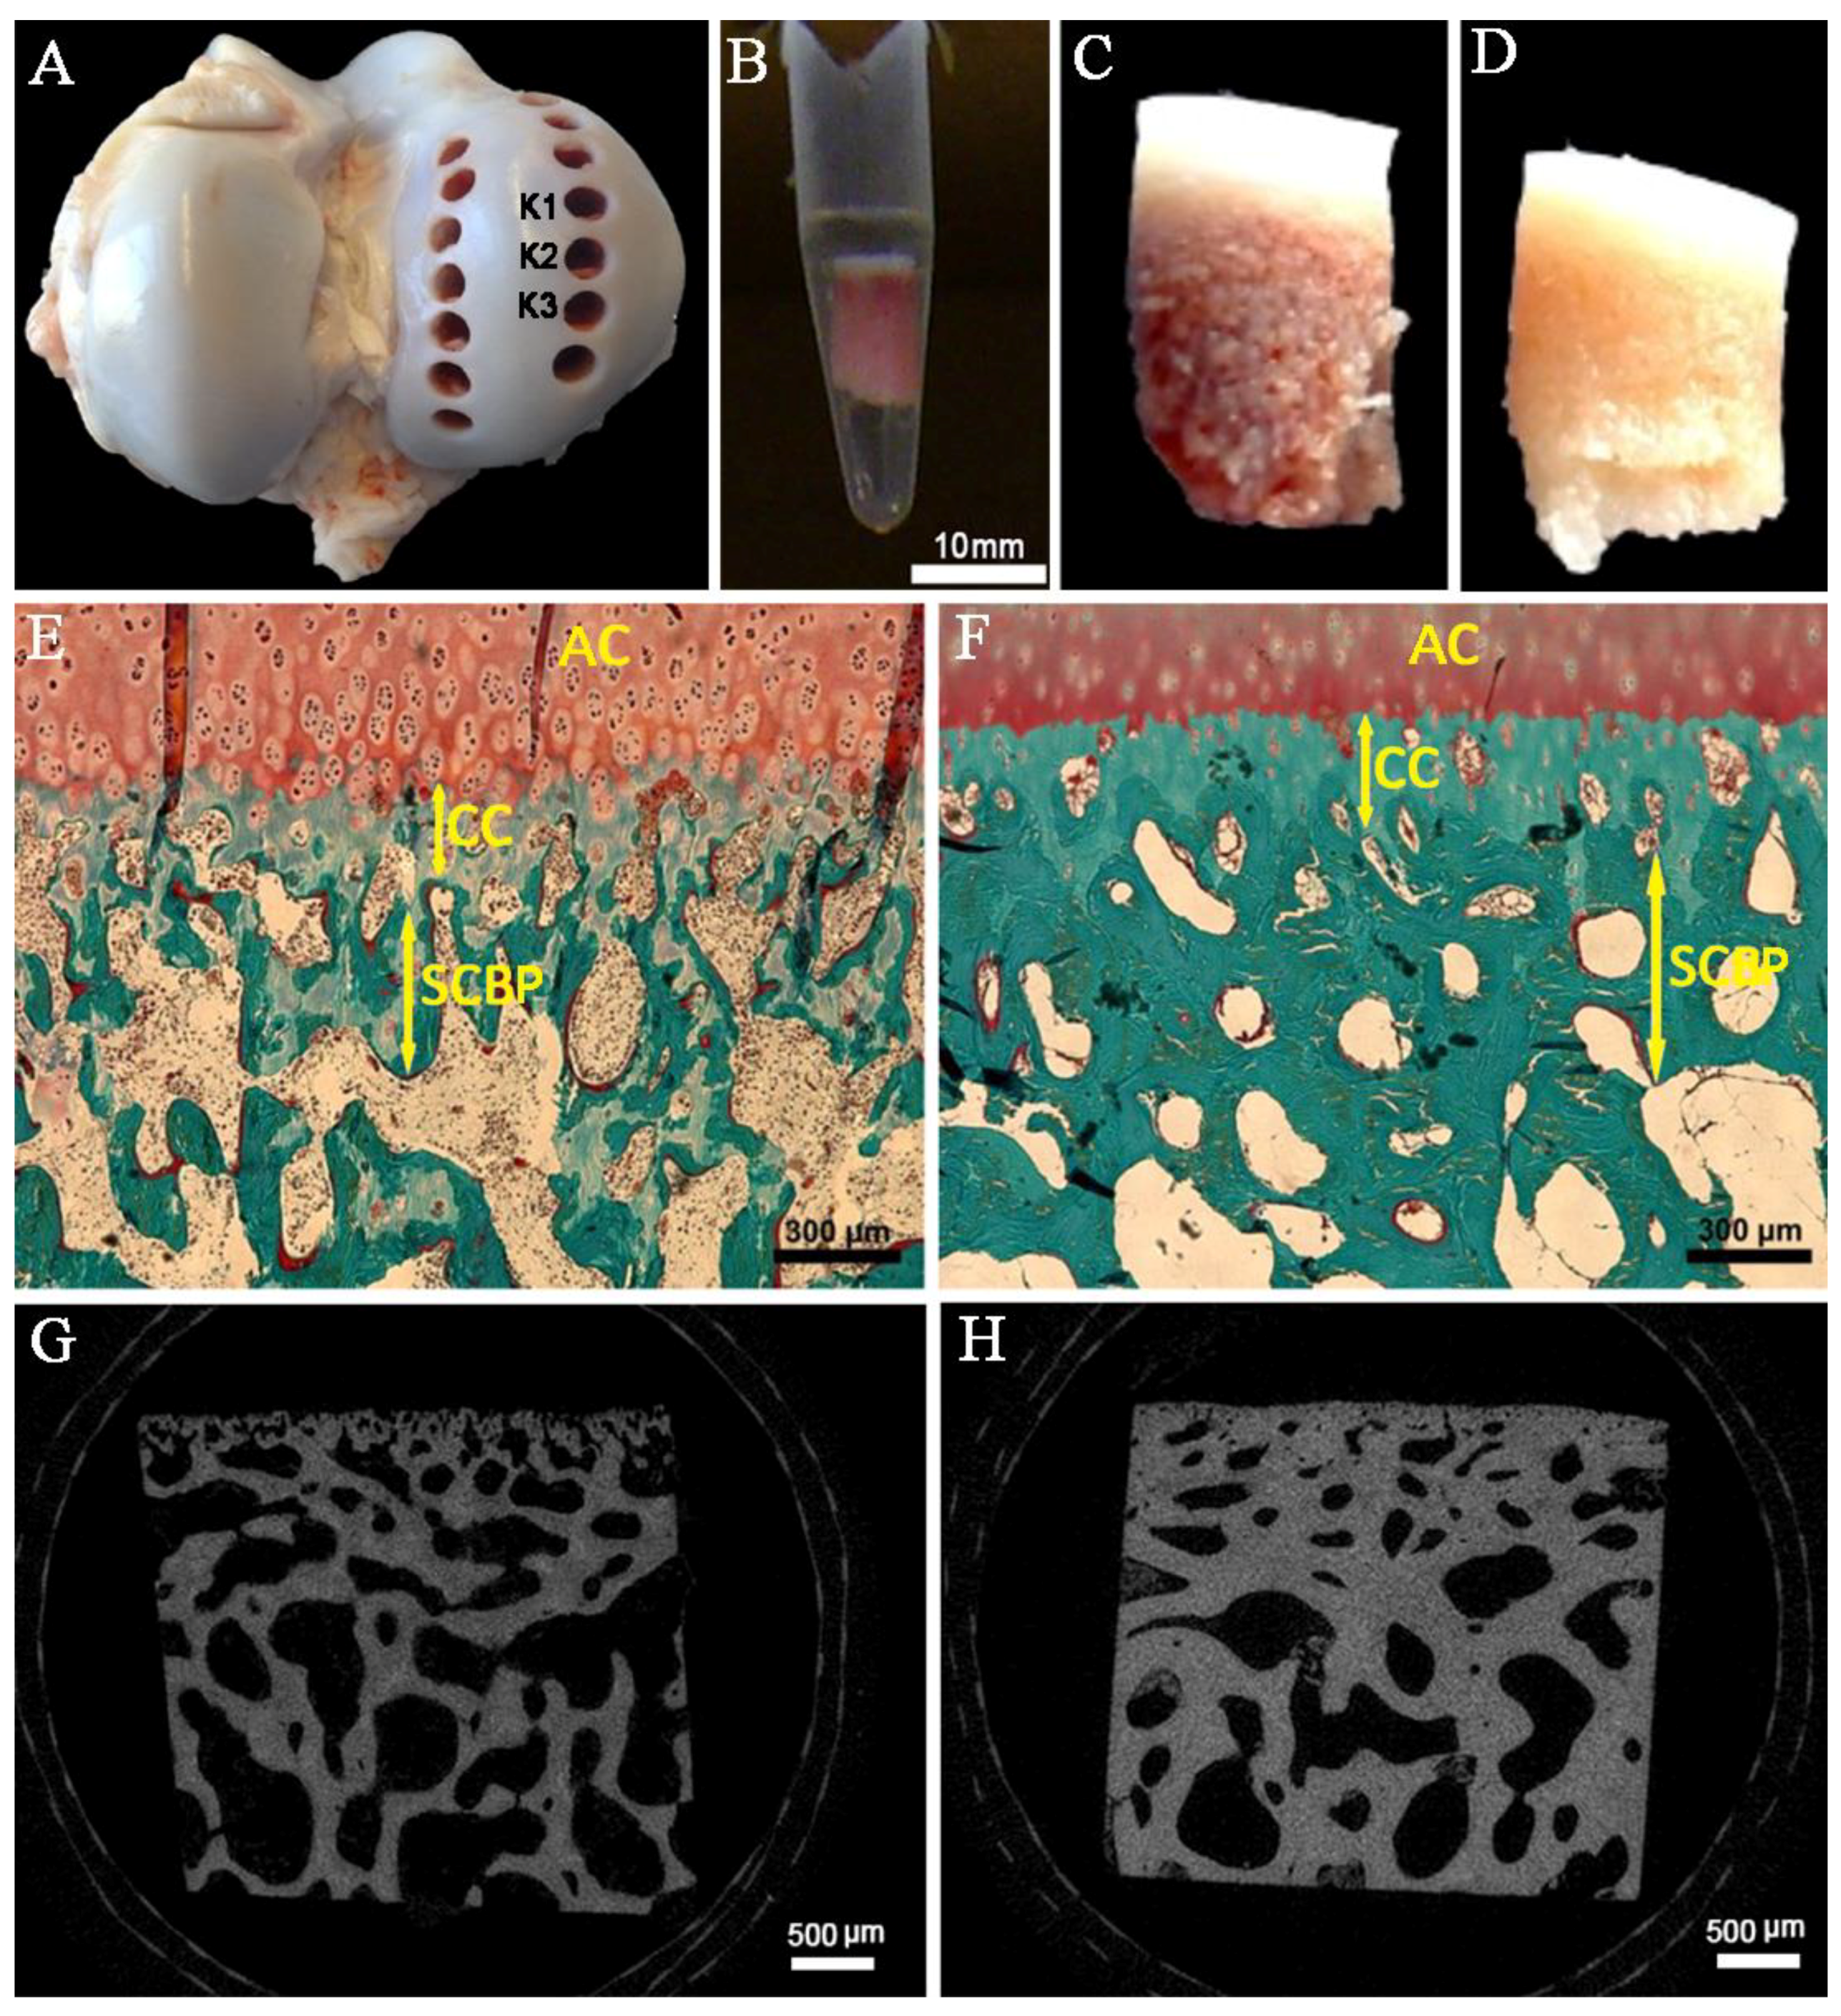
4.1. Biopsy and Preparation of Bovine Bone Specimens
4.2. Histomorphometry Analysis
4.3. Micro-Computed Tomography (Micro-CT)
4.4. Representation of Microchannels
4.5. Mineralization Measurements
4.6. Energy Dispersive X-ray Spectroscopy (EDX)
4.7. Statistical Analysis
5. Conclusions
Supplementary Materials
Author Contributions
Funding
Acknowledgments
Conflicts of Interest
Abbreviations
| BV/TV | Bone volume fraction |
| CC | Calcified cartilage |
| Conn.D | Connectivity density |
| DA | Degree of anisotropy |
| DMM | Destabilization of the medial meniscus |
| EDX | Energy-dispersive X-ray spectroscopy |
| Micro-CT | Micro-computed tomography |
| OA | Osteoarthritis |
| OP | Osteoporotic |
| SCB | Subchondral bone |
| SCBP | Subchondral bone plate |
| SCZ | Subchondral zone |
| Tb.N. | Trabecular number |
| Tb.Sp. | Trabecular spacing |
| Tb.Th. | Trabecular thickness |
References
- Cooper, C.; Snow, S.; McAlindon, T.E.; Kellingray, S.; Stuart, B.; Coggon, D.; Dieppe, P. A Risk factors for the incidence and progression of radiographic knee osteoarthritis. Arthritis Rheum. 2000, 43, 995–1000. [Google Scholar] [CrossRef]
- Bora, F.W.; Miller, G. Joint physiology, cartilage metabolism, and the etiology of osteoarthritis. Hand Clin. 1987, 3, 325–336. [Google Scholar] [PubMed]
- Oliveria, S.A.; Felson, D.T.; Reed, J.I.; Cirillo, P.A.; Walker, A.M. Incidence of symptomatic hand, hip, and knee osteoarthritis among patients in a health maintenance organization. Arthritis Rheum. 1995, 38, 1134–1141. [Google Scholar] [CrossRef] [PubMed]
- Martin, J.A.; Buckwalter, J.A. Roles of articular cartilage aging and chondrocyte senescence in the pathogenesis of osteoarthritis. Iowa Orthop. J. 2001, 21, 1–7. [Google Scholar] [PubMed]
- Edwards, D.J.; Whittle, S.L.; Nissen, M.J.; Cohen, B.; Oakeshott, R.D.; Keene, G.C.R. Radiographic changes in the knee after meniscal transplantation: An experimental study in a sheep model. Am. J. Sports Med. 1996, 24, 222–226. [Google Scholar] [CrossRef]
- Radin, E.L. The physiology and degeneration of joints. Semin. Arthritis Rheum. 1972, 2, 245–257. [Google Scholar] [CrossRef]
- Moon, K.-H. New view on the initial development site and radiographic classification system of osteoarthritis of the knee based on radiographic analysis. Int. J. Biomed. Sci. 2012, 8, 233–243. [Google Scholar]
- Madry, H.; van Dijk, C.N.; Mueller-Gerbl, M. The basic science of the subchondral bone. Knee Surgery Sport. Traumatol. Arthrosc. 2010, 18, 419–433. [Google Scholar] [CrossRef]
- Martinelli, M.J.; Eurell, J.; Les, C.M.; Fyhrie, D.; Bennett, D. Age-related morphometry of equine calcified cartilage. Equine Vet. J. 2002, 34, 274–278. [Google Scholar] [CrossRef]
- Green, W.T.; Martin, G.N.; Eanes, E.D.; Sokoloff, L. Microradiographic study of the calcified layer of articular cartilage. Arch. Pathol. 1970, 90, 151–158. [Google Scholar]
- Huang, H.; Skelly, J.D.; Ayers, D.C.; Song, J. Age-dependent Changes in the Articular Cartilage and Subchondral Bone of C57BL/6 Mice after Surgical Destabilization of Medial Meniscus. Sci. Rep. 2017, 7, 42294. [Google Scholar] [CrossRef] [PubMed]
- Chevrier, A.; Kouao, A.S.M.; Picard, G.; Hurtig, M.B.; Buschmann, M.D. Interspecies comparison of subchondral bone properties important for cartilage repair. J. Orthop. Res. 2015, 33, 63–70. [Google Scholar] [CrossRef] [PubMed]
- Yan, J.-Y.; Tian, F.-M.; Wang, W.-Y.; Cheng, Y.; Xu, H.-F.; Song, H.-P.; Zhang, Y.-Z.; Zhang, L. Age Dependent Changes in Cartilage Matrix, Subchondral Bone Mass, and Estradiol Levels in Blood Serum, in Naturally Occurring Osteoarthritis in Guinea Pigs. Int. J. Mol. Sci. 2014, 15, 13578–13595. [Google Scholar] [CrossRef] [PubMed]
- Kamibayashi, L.; Wyss, U.P.; Cooke, T.D.; Zee, B. Trabecular microstructure in the medial condyle of the proximal tibia of patients with knee osteoarthritis. Bone 1995, 17, 27–35. [Google Scholar] [CrossRef]
- Bobinac, D.; Spanjol, J.; Zoricic, S.; Maric, I. Changes in articular cartilage and subchondral bone histomorphometry in osteoarthritic knee joints in humans. Bone 2003, 32, 284–290. [Google Scholar] [CrossRef]
- Dingemanse, W.; Müller-Gerbl, M.; Jonkers, I.; Vander Sloten, J.; van Bree, H.; Gielen, I. A prospective follow up of age related changes in the subchondral bone density of the talus of healthy Labrador Retrievers. BMC Vet. Res. 2017, 13, 57. [Google Scholar] [CrossRef] [PubMed]
- Chiba, K.; Ito, M.; Osaki, M.; Uetani, M.; Shindo, H. In vivo structural analysis of subchondral trabecular bone in osteoarthritis of the hip using multi-detector row CT. Osteoarthr. Cartil. 2011, 19, 180–185. [Google Scholar] [CrossRef]
- Band, M.R.; Larson, J.H.; Rebeiz, M.; Green, C.A.; Heyen, D.W.; Donovan, J.; Windish, R.; Steining, C.; Mahyuddin, P.; Womack, J.E.; et al. An ordered comparative map of the cattle and human genomes. Genome Res. 2000, 10, 1359–1368. [Google Scholar] [CrossRef]
- Mummed, Y.Y. Correlation between milk suckled and growth of calves of ogaden cattle at one, three and six months of age, east Ethiopia. Springerplus 2013, 2, 302. [Google Scholar] [CrossRef] [PubMed]
- Fall, A.; Diop, M.; Sandford, J.; Wissocq, Y.J.; Durkin, J.W.; Trail, J.C.M. Evaluation of the Productivities of Djallonke Sheep and N’Dama Cattle at the Centre de Recherches Zootechniques; International Livestock Centre for Africa: Kolda, Senegal, 1982. [Google Scholar]
- Ryan, T.M.; Shaw, C.N. Trabecular bone microstructure scales allometrically in the primate humerus and femur. Proc. R. Soc. B Biol. Sci. 2013, 280. [Google Scholar] [CrossRef]
- Burgstaller, J.P.; Brem, G. Aging of Cloned Animals: A Mini-Review. Gerontology 2017, 63, 417–425. [Google Scholar] [CrossRef] [PubMed]
- Costagliola, A.; Wojcik, S.; Pagano, T.B.; De Biase, D.; Russo, V.; Iovane, V.; Grieco, E.; Papparella, S.; Paciello, O. Age-Related Changes in Skeletal Muscle of Cattle. Vet. Pathol. 2016, 53, 436–446. [Google Scholar] [CrossRef] [PubMed]
- Dong, X.; Milholland, B.; Vijg, J. Evidence for a limit to human lifespan. Nature 2016, 538, 257–259. [Google Scholar] [CrossRef] [PubMed]
- Vorwerg, Y.; Petroff, D.; Kiess, W.; Blüher, S. Physical Activity in 3–6 Year Old Children Measured by SenseWear Pro®: Direct Accelerometry in the Course of the Week and Relation to Weight Status, Media Consumption, and Socioeconomic Factors. PLoS ONE 2013, 8, e60619. [Google Scholar] [CrossRef] [PubMed]
- Diehr, P.; O’Meara, E.S.; Fitzpatrick, A.; Newman, A.B.; Kuller, L.; Burke, G. Weight, mortality, years of healthy life, and active life expectancy in older adults. J. Am. Geriatr. Soc. 2008, 56, 76–83. [Google Scholar] [CrossRef] [PubMed]
- Chiu, H.-C.; Chang, H.-Y.; Mau, L.-W.; Lee, T.-K.; Liu, H.-W. Height, Weight, and Body Mass Index of Elderly Persons in Taiwan. J. Gerontol. Ser. A Biol. Sci. Med. Sci. 2000, 55, M684–M690. [Google Scholar] [CrossRef]
- Ding, M.; Odgaard, A.; Hvid, I. Changes in the three-dimensional microstructure of human tibial cancellous bone in early osteoarthritis. J. Bone Jt. Surg.—Ser. B 2003, 85, 906–912. [Google Scholar] [CrossRef]
- Chen, H.; Zhou, X.; Shoumura, S.; Emura, S.; Bunai, Y. Age- and gender-dependent changes in three-dimensional microstructure of cortical and trabecular bone at the human femoral neck. Osteoporos. Int. 2010, 21, 627–636. [Google Scholar] [CrossRef]
- Lee, J.H.; Chun, K.J.; Kim, H.S.; Kim, S.H.; Han, P.; Jun, Y.; Lim, D. Alteration patterns of trabecular bone microarchitectural characteristics induced by osteoarthritis over time. Clin. Interv. Aging 2012, 7, 303–312. [Google Scholar] [CrossRef]
- Glatt, V.; Canalis, E.; Stadmeyer, L.; Bouxsein, M.L. Age-Related Changes in Trabecular Architecture Differ in Female and Male C57BL/6J Mice. J. Bone Miner. Res. 2007, 22, 1197–1207. [Google Scholar] [CrossRef]
- Chen, H.; Zhou, X.; Fujita, H.; Onozuka, M.; Kubo, K.Y. Age-related changes in trabecular and cortical bone microstructure. Int. J. Endocrinol. 2013, 2013, 1–9. [Google Scholar] [CrossRef] [PubMed]
- Li, G.; Yin, J.; Gao, J.; Cheng, T.S.; Pavlos, N.J.; Zhang, C.; Zheng, M.H. Subchondral bone in osteoarthritis: Insight into risk factors and microstructural changes. Arthritis Res. Ther. 2013, 15, 223. [Google Scholar] [CrossRef] [PubMed]
- Milz, S.; Putz, R. Quantitative morphology of the subchondral plate of the tibial plateau. J. Anat. 1994, 185, 103–110. [Google Scholar] [PubMed]
- Berry, J.L.; Thaeler-Oberdoerster, D.A.; Greenwald, A.S. Subchondral pathways to the superior surface of the human talus. Foot Ankle 1986, 7, 2–9. [Google Scholar] [CrossRef] [PubMed]
- Li, B.; Marshall, D.; Roe, M.; Aspden, R.M. The electron microscope appearance of the subchondral bone plate in the human femoral head in osteoarthritis and osteoporosis. J. Anat. 1999, 195, 101–110. [Google Scholar] [CrossRef] [PubMed]
- Lane, L.B.; Bullough, P.G. Age-related changes in the thickness of the calcified zone and the number of tidemarks in adult human articular cartilage. J. Bone Joint Surg. Br. 1980, 62, 372–375. [Google Scholar] [CrossRef] [PubMed]
- Anderson, D.D.; Brown, T.D.; Radin, E.L. The influence of basal cartilage calcification on dynamic juxtaarticular stress transmission. Clin. Orthop. Relat. Res. 1993, 298–307. [Google Scholar] [CrossRef]
- Kourkoumelis, N.; Balatsoukas, I.; Tzaphlidou, M. Ca/P concentration ratio at different sites of normal and osteoporotic rabbit bones evaluated by Auger and energy dispersive X-ray spectroscopy. J. Biol. Phys. 2012, 38, 279–291. [Google Scholar] [CrossRef] [PubMed]
- Grynpas, M. Age and disease-related changes in the mineral of bone. Calcif. Tissue Int. 1993, 53, S57–S64. [Google Scholar] [CrossRef]
- Kuhn, L.T.; Grynpas, M.D.; Rey, C.C.; Wu, Y.; Ackerman, J.L.; Glimcher, M.J. A Comparison of the Physical and Chemical Differences Between Cancellous and Cortical Bovine Bone Mineral at Two Ages. Calcif. Tissue Int. 2008, 83, 146–154. [Google Scholar] [CrossRef] [PubMed]
- Bouxsein, M.L.; Boyd, S.K.; Christiansen, B.A.; Guldberg, R.E.; Jepsen, K.J.; Müller, R. Guidelines for assessment of bone microstructure in rodents using micro-computed tomography. J. Bone Miner. Res. 2010, 25, 1468–1486. [Google Scholar] [CrossRef] [PubMed]


| Microstructural Parameters of the Subchondral Trabecular Bone | Calves | Cattles | Kruskal–Wallis ANOVA |
|---|---|---|---|
| BV/TV (Bone volume fraction) (%) | 48 ± 4 | 74 ± 4 | p = 0.049 |
| Tb.Sp. (µm) | 45 ± 6 | 29 ± 2 | p = 0.046 |
| Tb.N. (1/mm) | 11.6 ± 0.8 | 9 ± 1.5 | p = 0.049 |
| Conn.D. (1/mm3) | 3835 ± 1641 | 1479 ± 292 | p = 0.049 |
| DA (Degree of anisotropy) | 1.14 ± 0.04 | 1.28 ± 0.12 | p = 0.275 |
| Tb.Th. (µm) | 41 ± 3 | 85 ± 20 | p = 0.049 |
| Sample Type (a) | Depth | BV/TV (%) Mean ± SD | Tb.Sp. (µm) Mean ± SD | Tb.N. (1/mm) Mean ± SD | Conn.D (1/mm3) Mean ± SD | DA Mean ± SD | Tb.Th. (µm) Mean ± SD |
|---|---|---|---|---|---|---|---|
| Calf | CC | 56 ± 4 | 24 ± 6 | 18.3 ± 2.2 | 5115 ± 1783 | 1.32 ± 0.05 | 32 ± 1 |
| Cattle | CC | 79 ± 11 | 10 ± 6 | 16.4 ± 3.0 | 3315 ± 265 | 2.17 ± 0.85 | 52 ± 17 |
| Calf | SCBP | 48 ± 3 | 41 ± 6 | 12.1 ± 0.9 | 1782 ± 1085 | 2.01 ± 0.12 | 41.5 ± 0 |
| Cattle | SCBP | 77 ± 11 | 15 ± 9 | 12.7 ± 0.5 | 995 ± 522 | 3.05 ± 0.6 | 64 ± 9 |
| Friedman’s 2-way ANOVA by ranks | p * | 0.042 * | 0.042 * | 0.042 * | 0.029 * | 0.042 * | 0.072 |
| One-Way ANOVA | page | 0.0002 *** | 0.0049 ** | 0.73 | 0.134 | 0.029 * | 0.006 |
| pdepth | 0.634 | 0.15 | 0.001 ** | 0.027 * | 0.08 | 0.24 |
© 2019 by the authors. Licensee MDPI, Basel, Switzerland. This article is an open access article distributed under the terms and conditions of the Creative Commons Attribution (CC BY) license (http://creativecommons.org/licenses/by/4.0/).
Share and Cite
Taheri, S.; Winkler, T.; Schenk, L.S.; Neuerburg, C.; Baumbach, S.F.; Zustin, J.; Lehmann, W.; Schilling, A.F. Developmental Transformation and Reduction of Connective Cavities within the Subchondral Bone. Int. J. Mol. Sci. 2019, 20, 770. https://doi.org/10.3390/ijms20030770
Taheri S, Winkler T, Schenk LS, Neuerburg C, Baumbach SF, Zustin J, Lehmann W, Schilling AF. Developmental Transformation and Reduction of Connective Cavities within the Subchondral Bone. International Journal of Molecular Sciences. 2019; 20(3):770. https://doi.org/10.3390/ijms20030770
Chicago/Turabian StyleTaheri, Shahed, Thomas Winkler, Lia Sabrina Schenk, Carl Neuerburg, Sebastian Felix Baumbach, Jozef Zustin, Wolfgang Lehmann, and Arndt F. Schilling. 2019. "Developmental Transformation and Reduction of Connective Cavities within the Subchondral Bone" International Journal of Molecular Sciences 20, no. 3: 770. https://doi.org/10.3390/ijms20030770
APA StyleTaheri, S., Winkler, T., Schenk, L. S., Neuerburg, C., Baumbach, S. F., Zustin, J., Lehmann, W., & Schilling, A. F. (2019). Developmental Transformation and Reduction of Connective Cavities within the Subchondral Bone. International Journal of Molecular Sciences, 20(3), 770. https://doi.org/10.3390/ijms20030770