Optical and Thermal Properties of Laser-Ablated Platinum Nanoparticles Graphene Oxide Composite


Abstract
1. Introduction
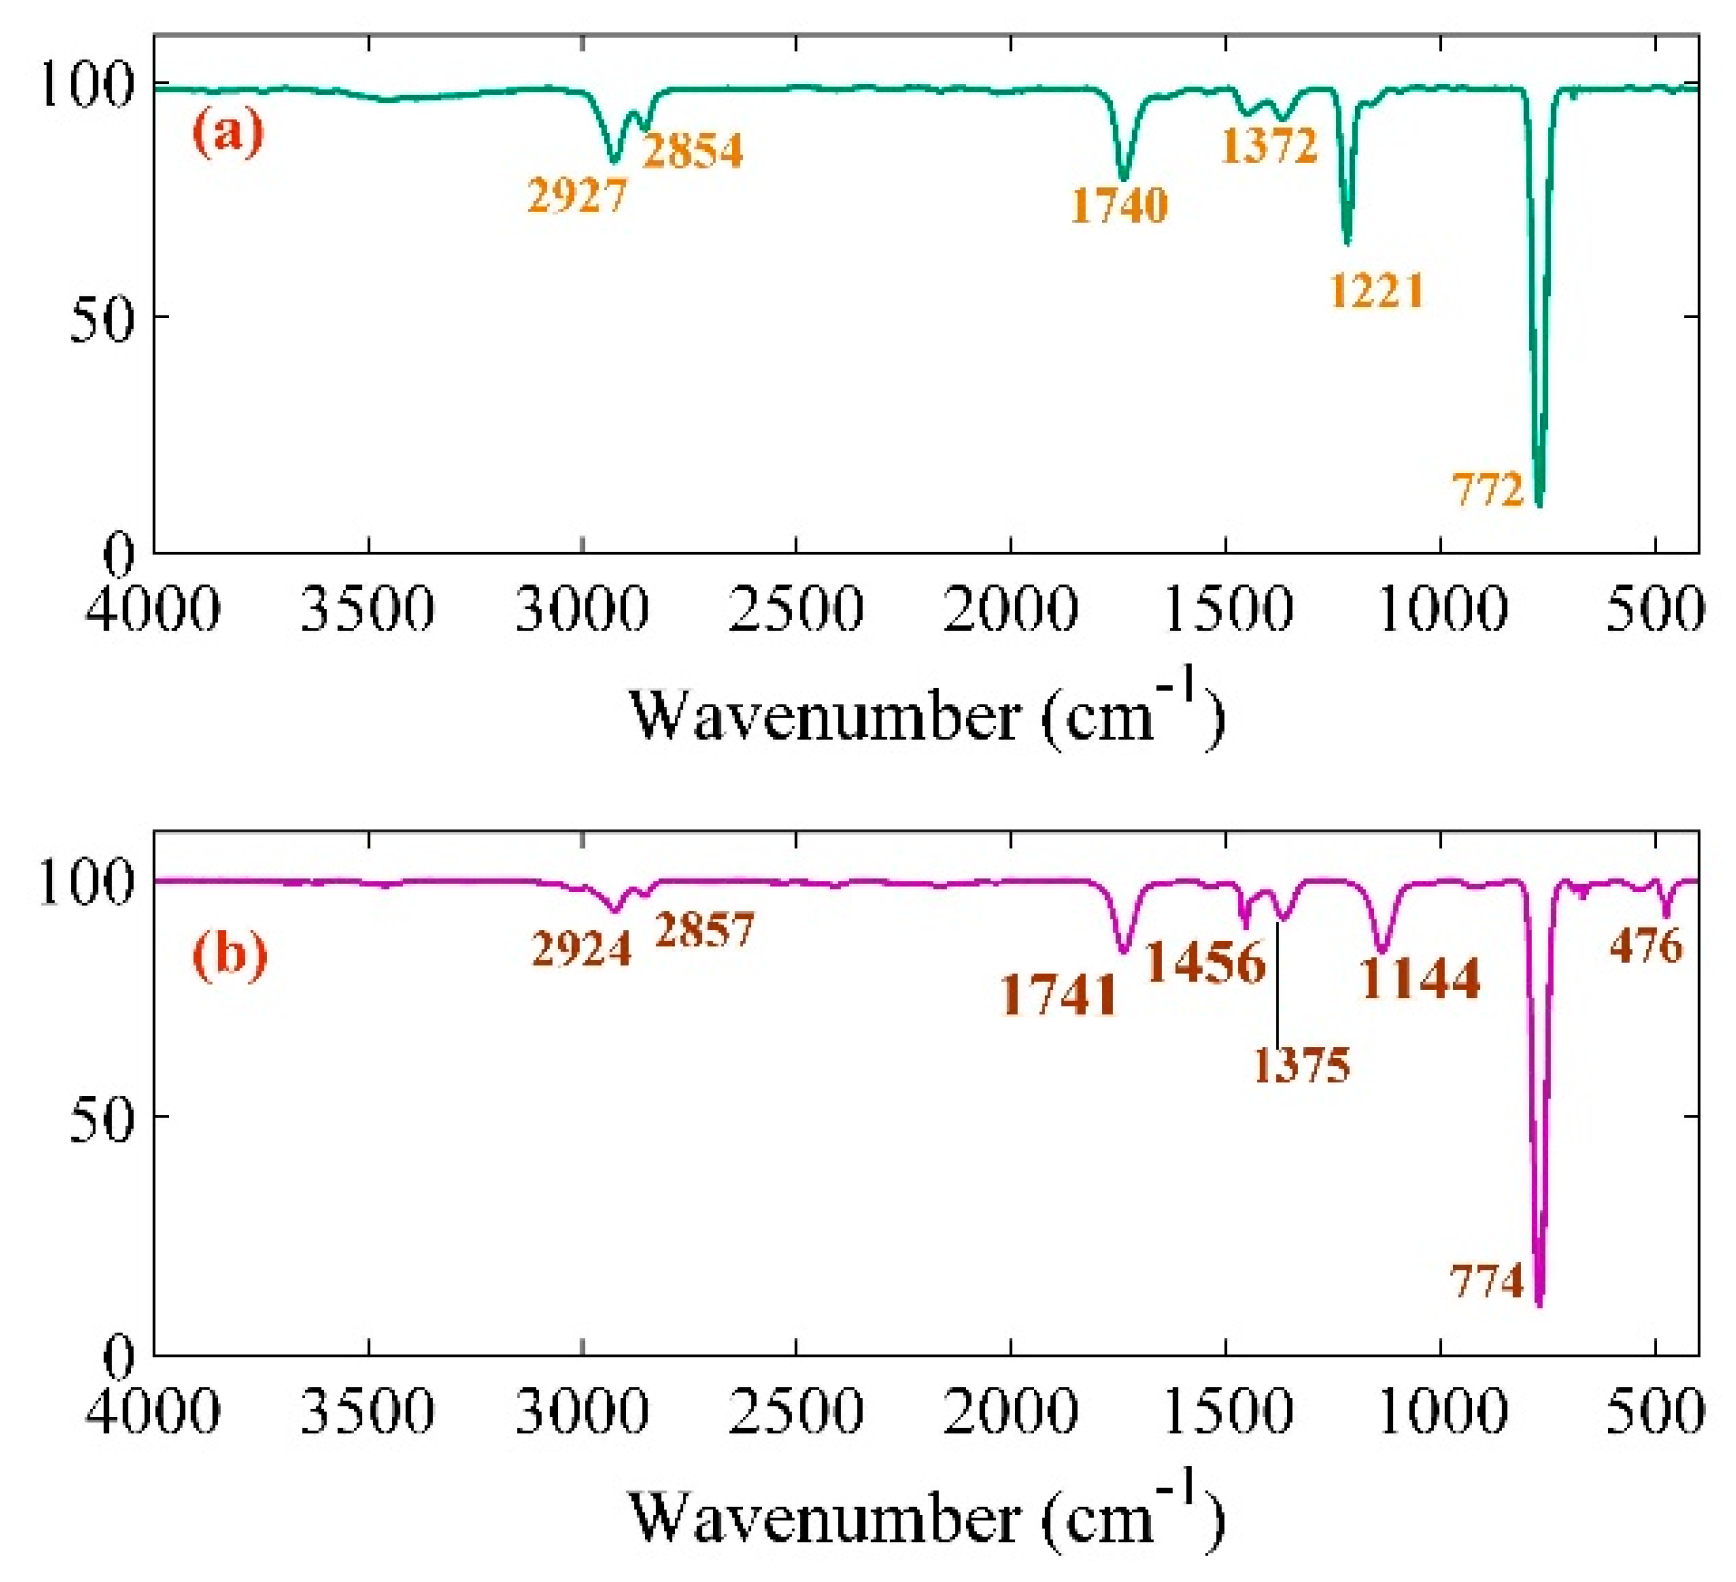
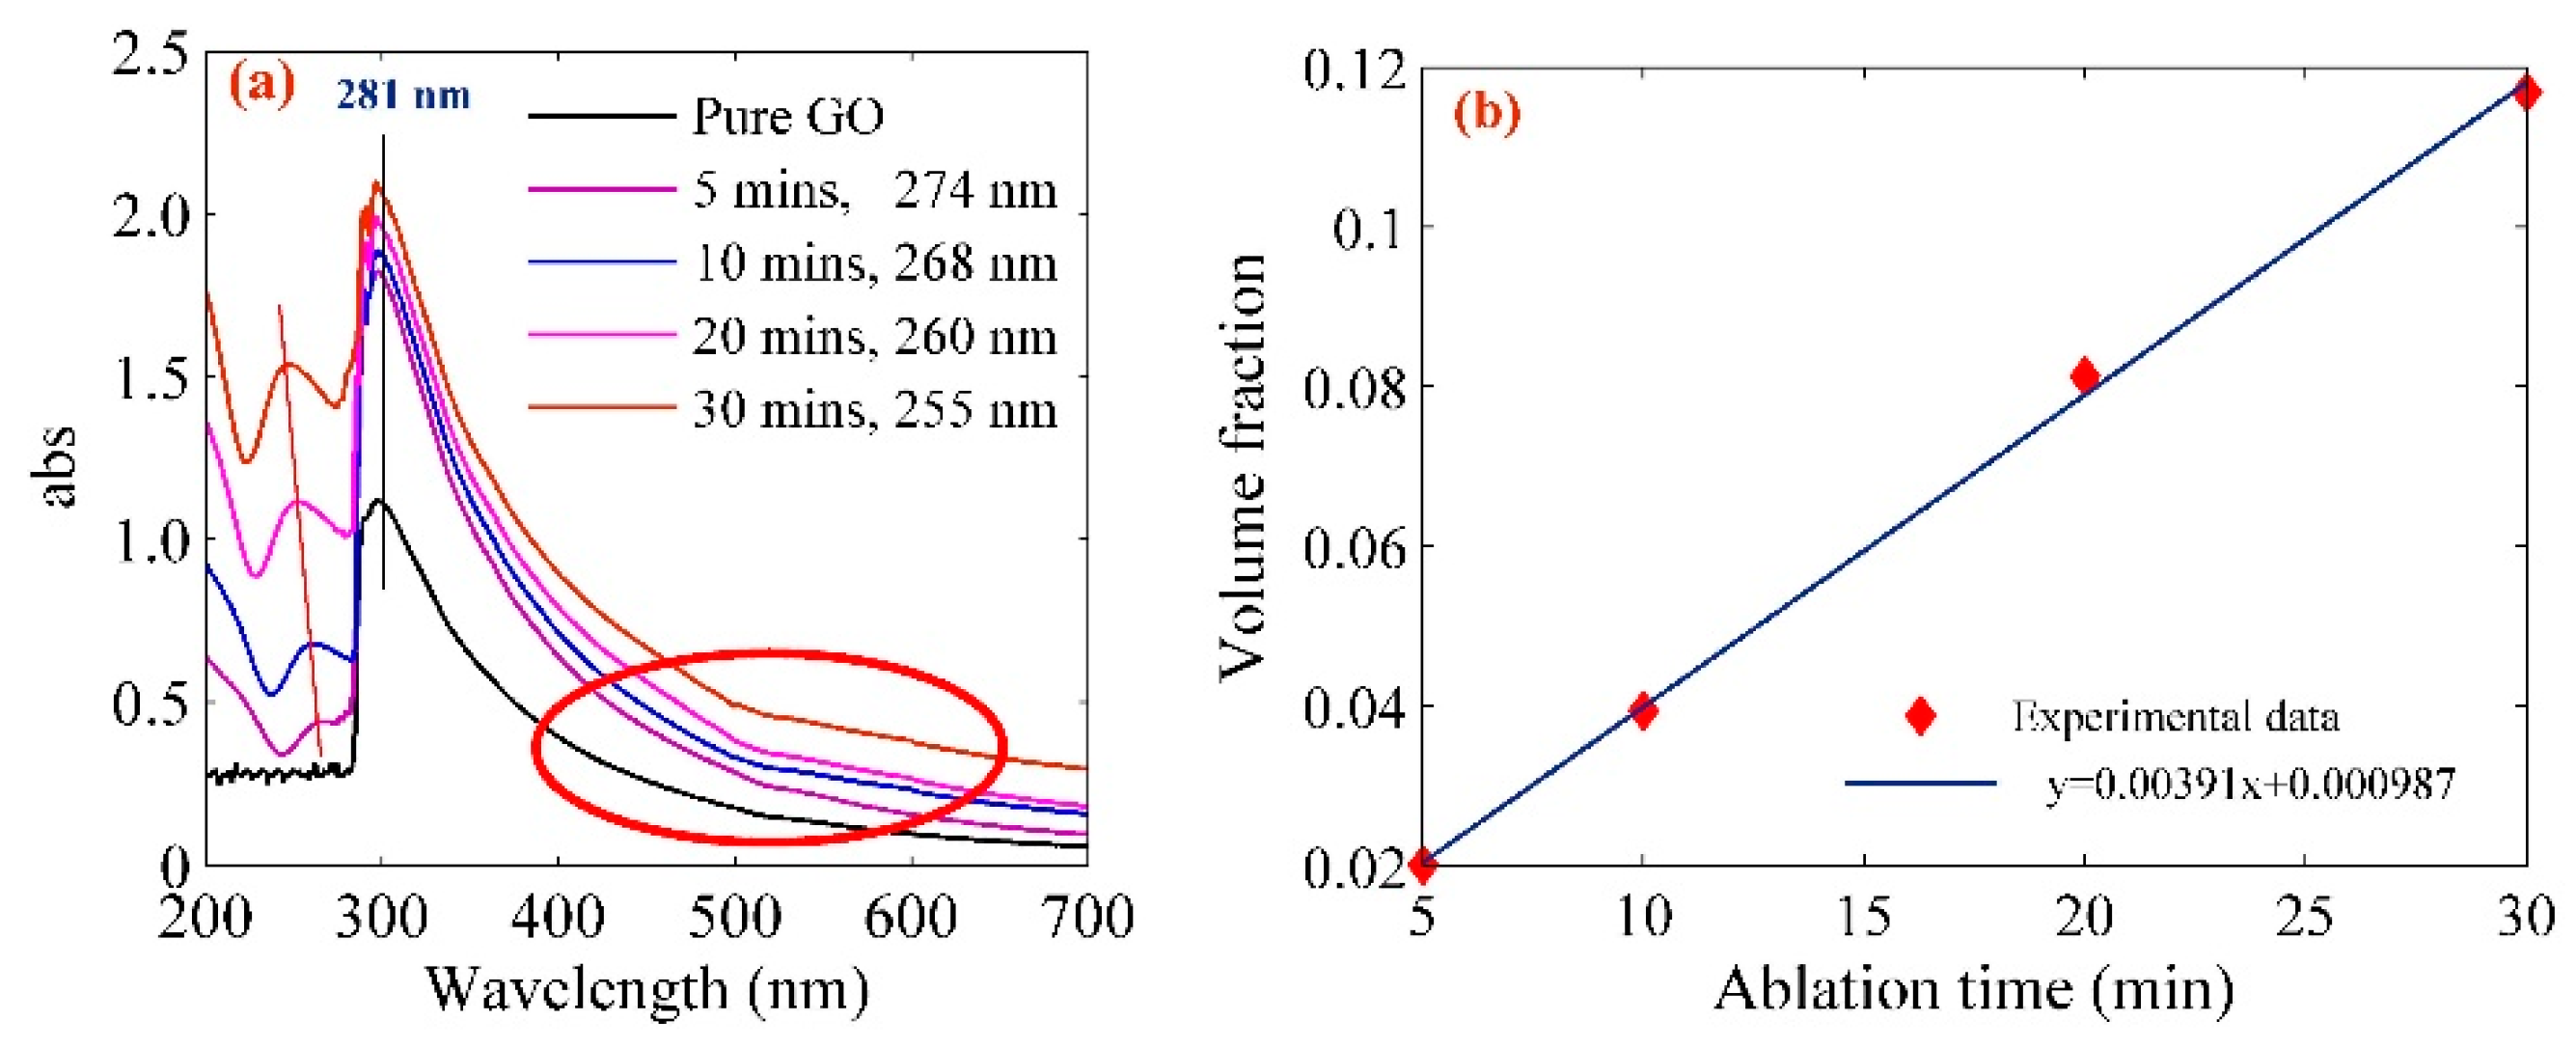
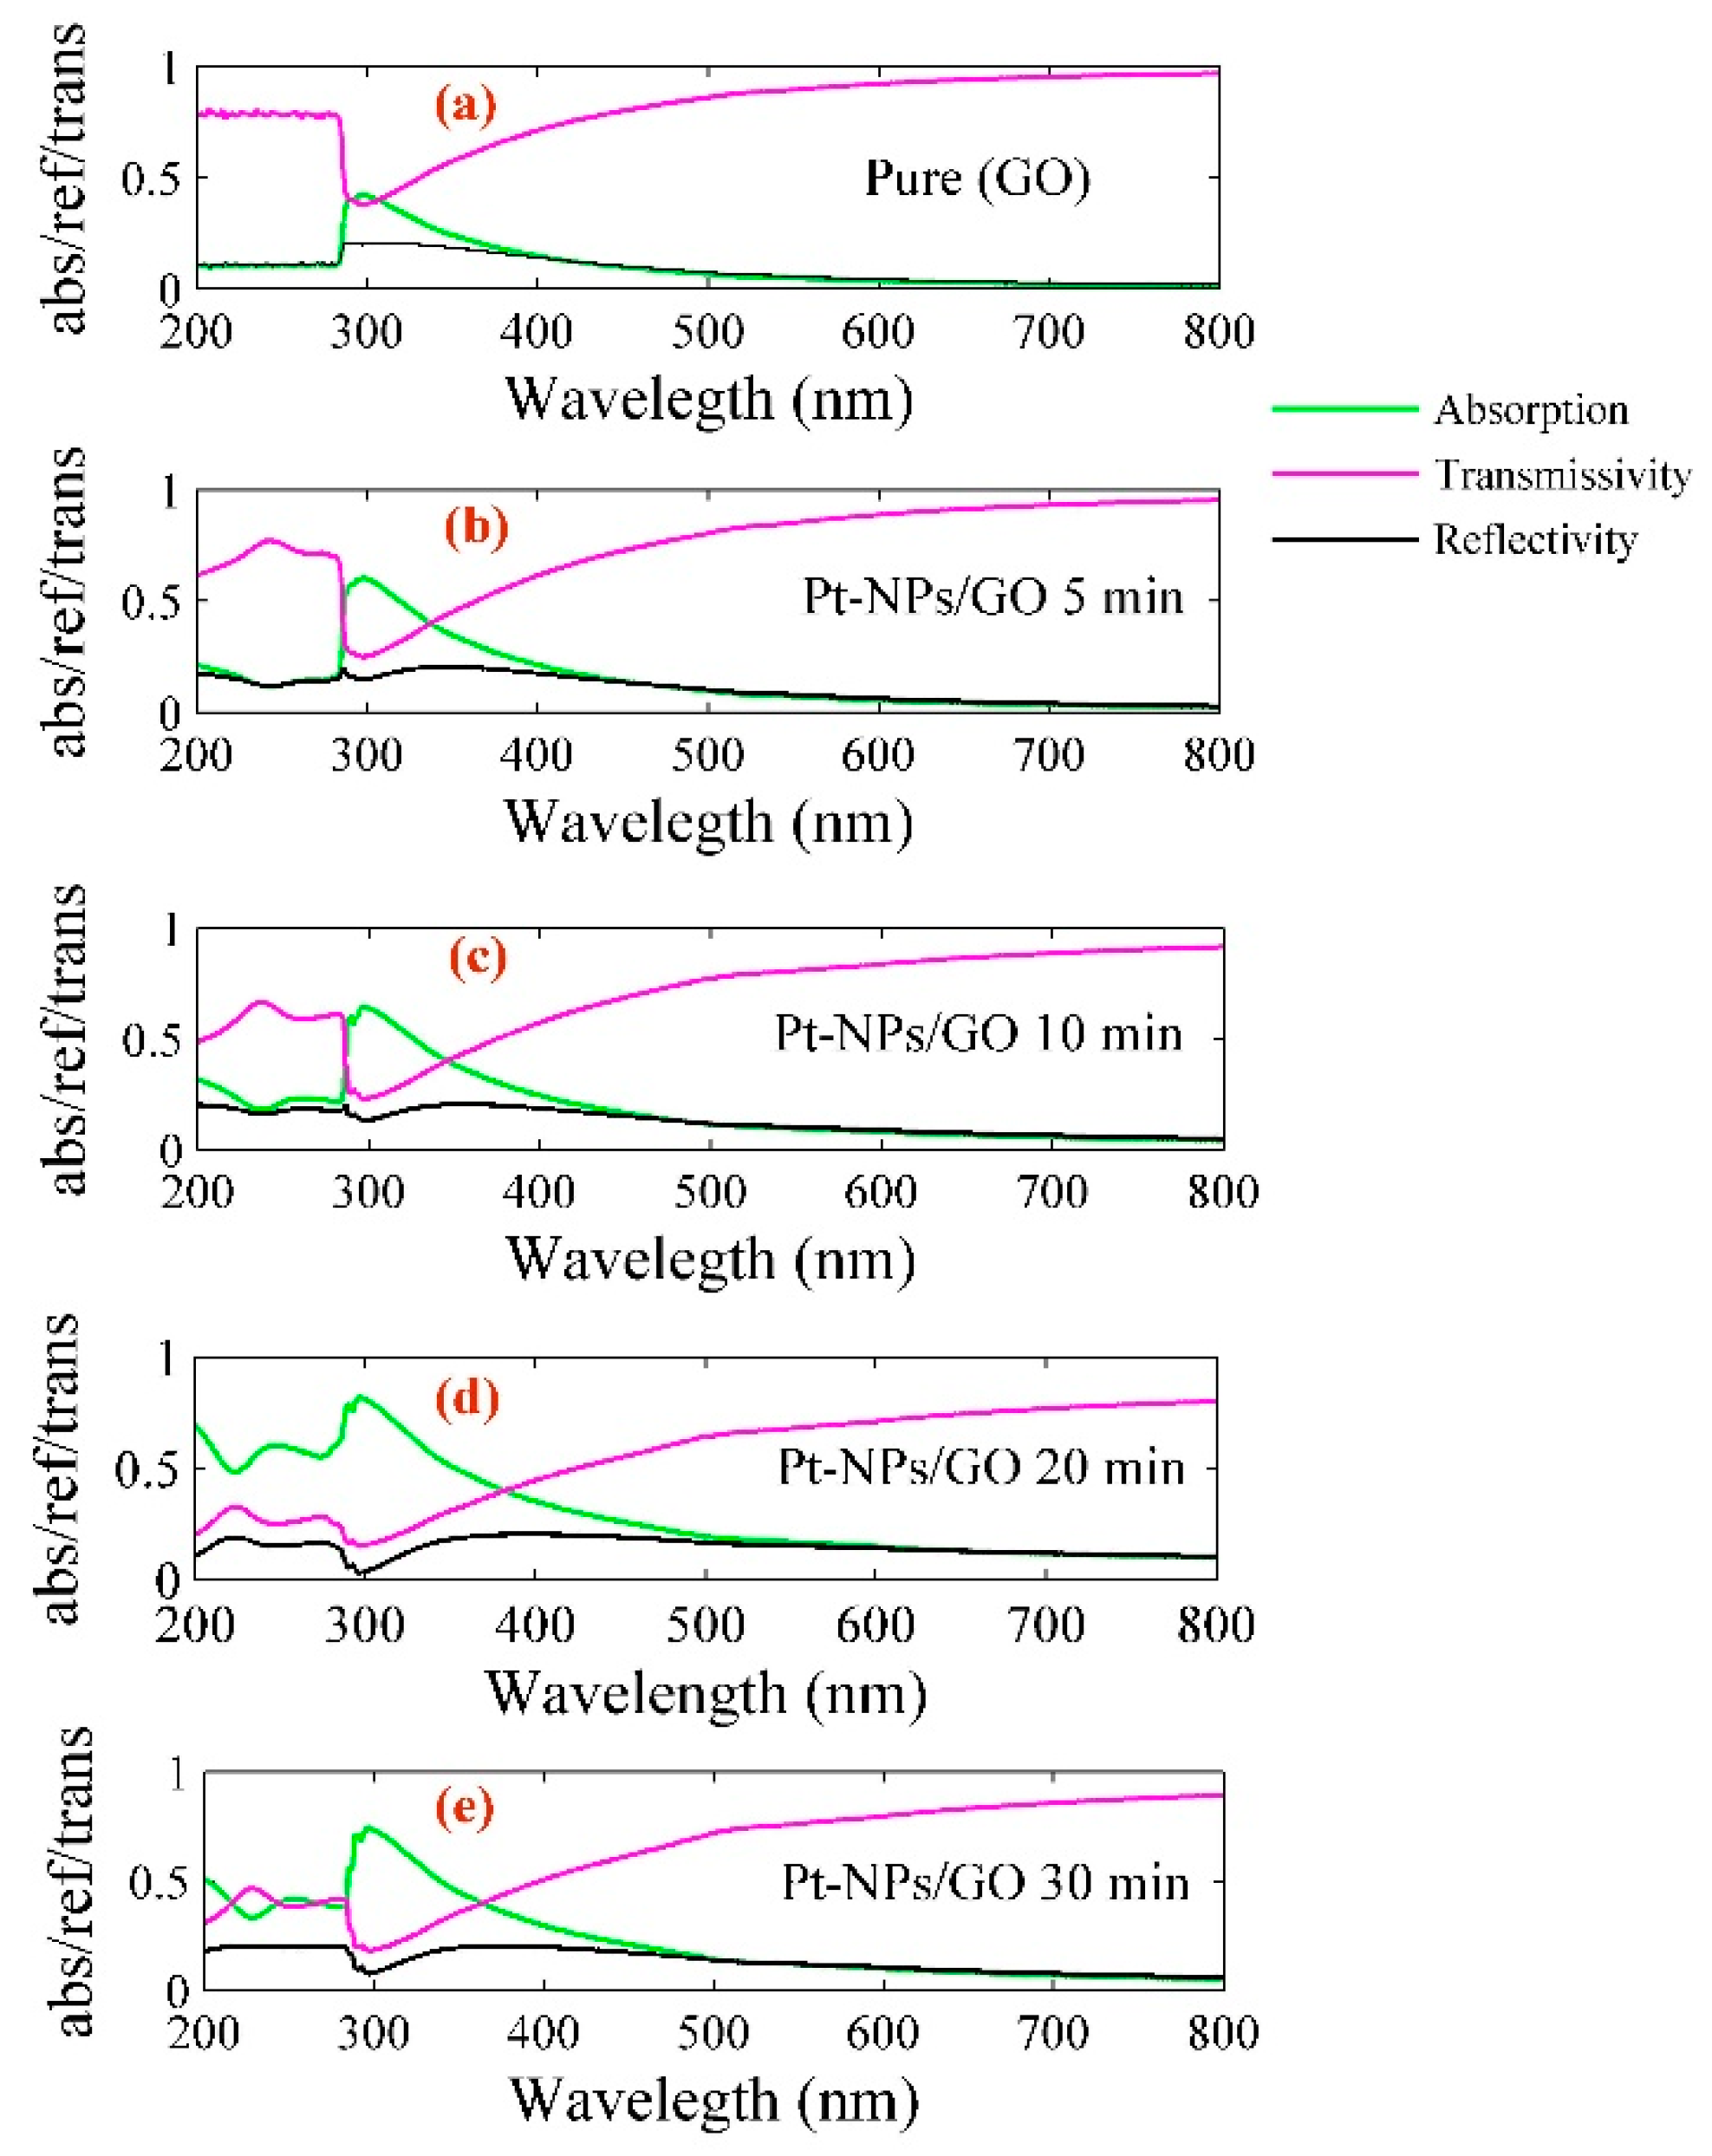
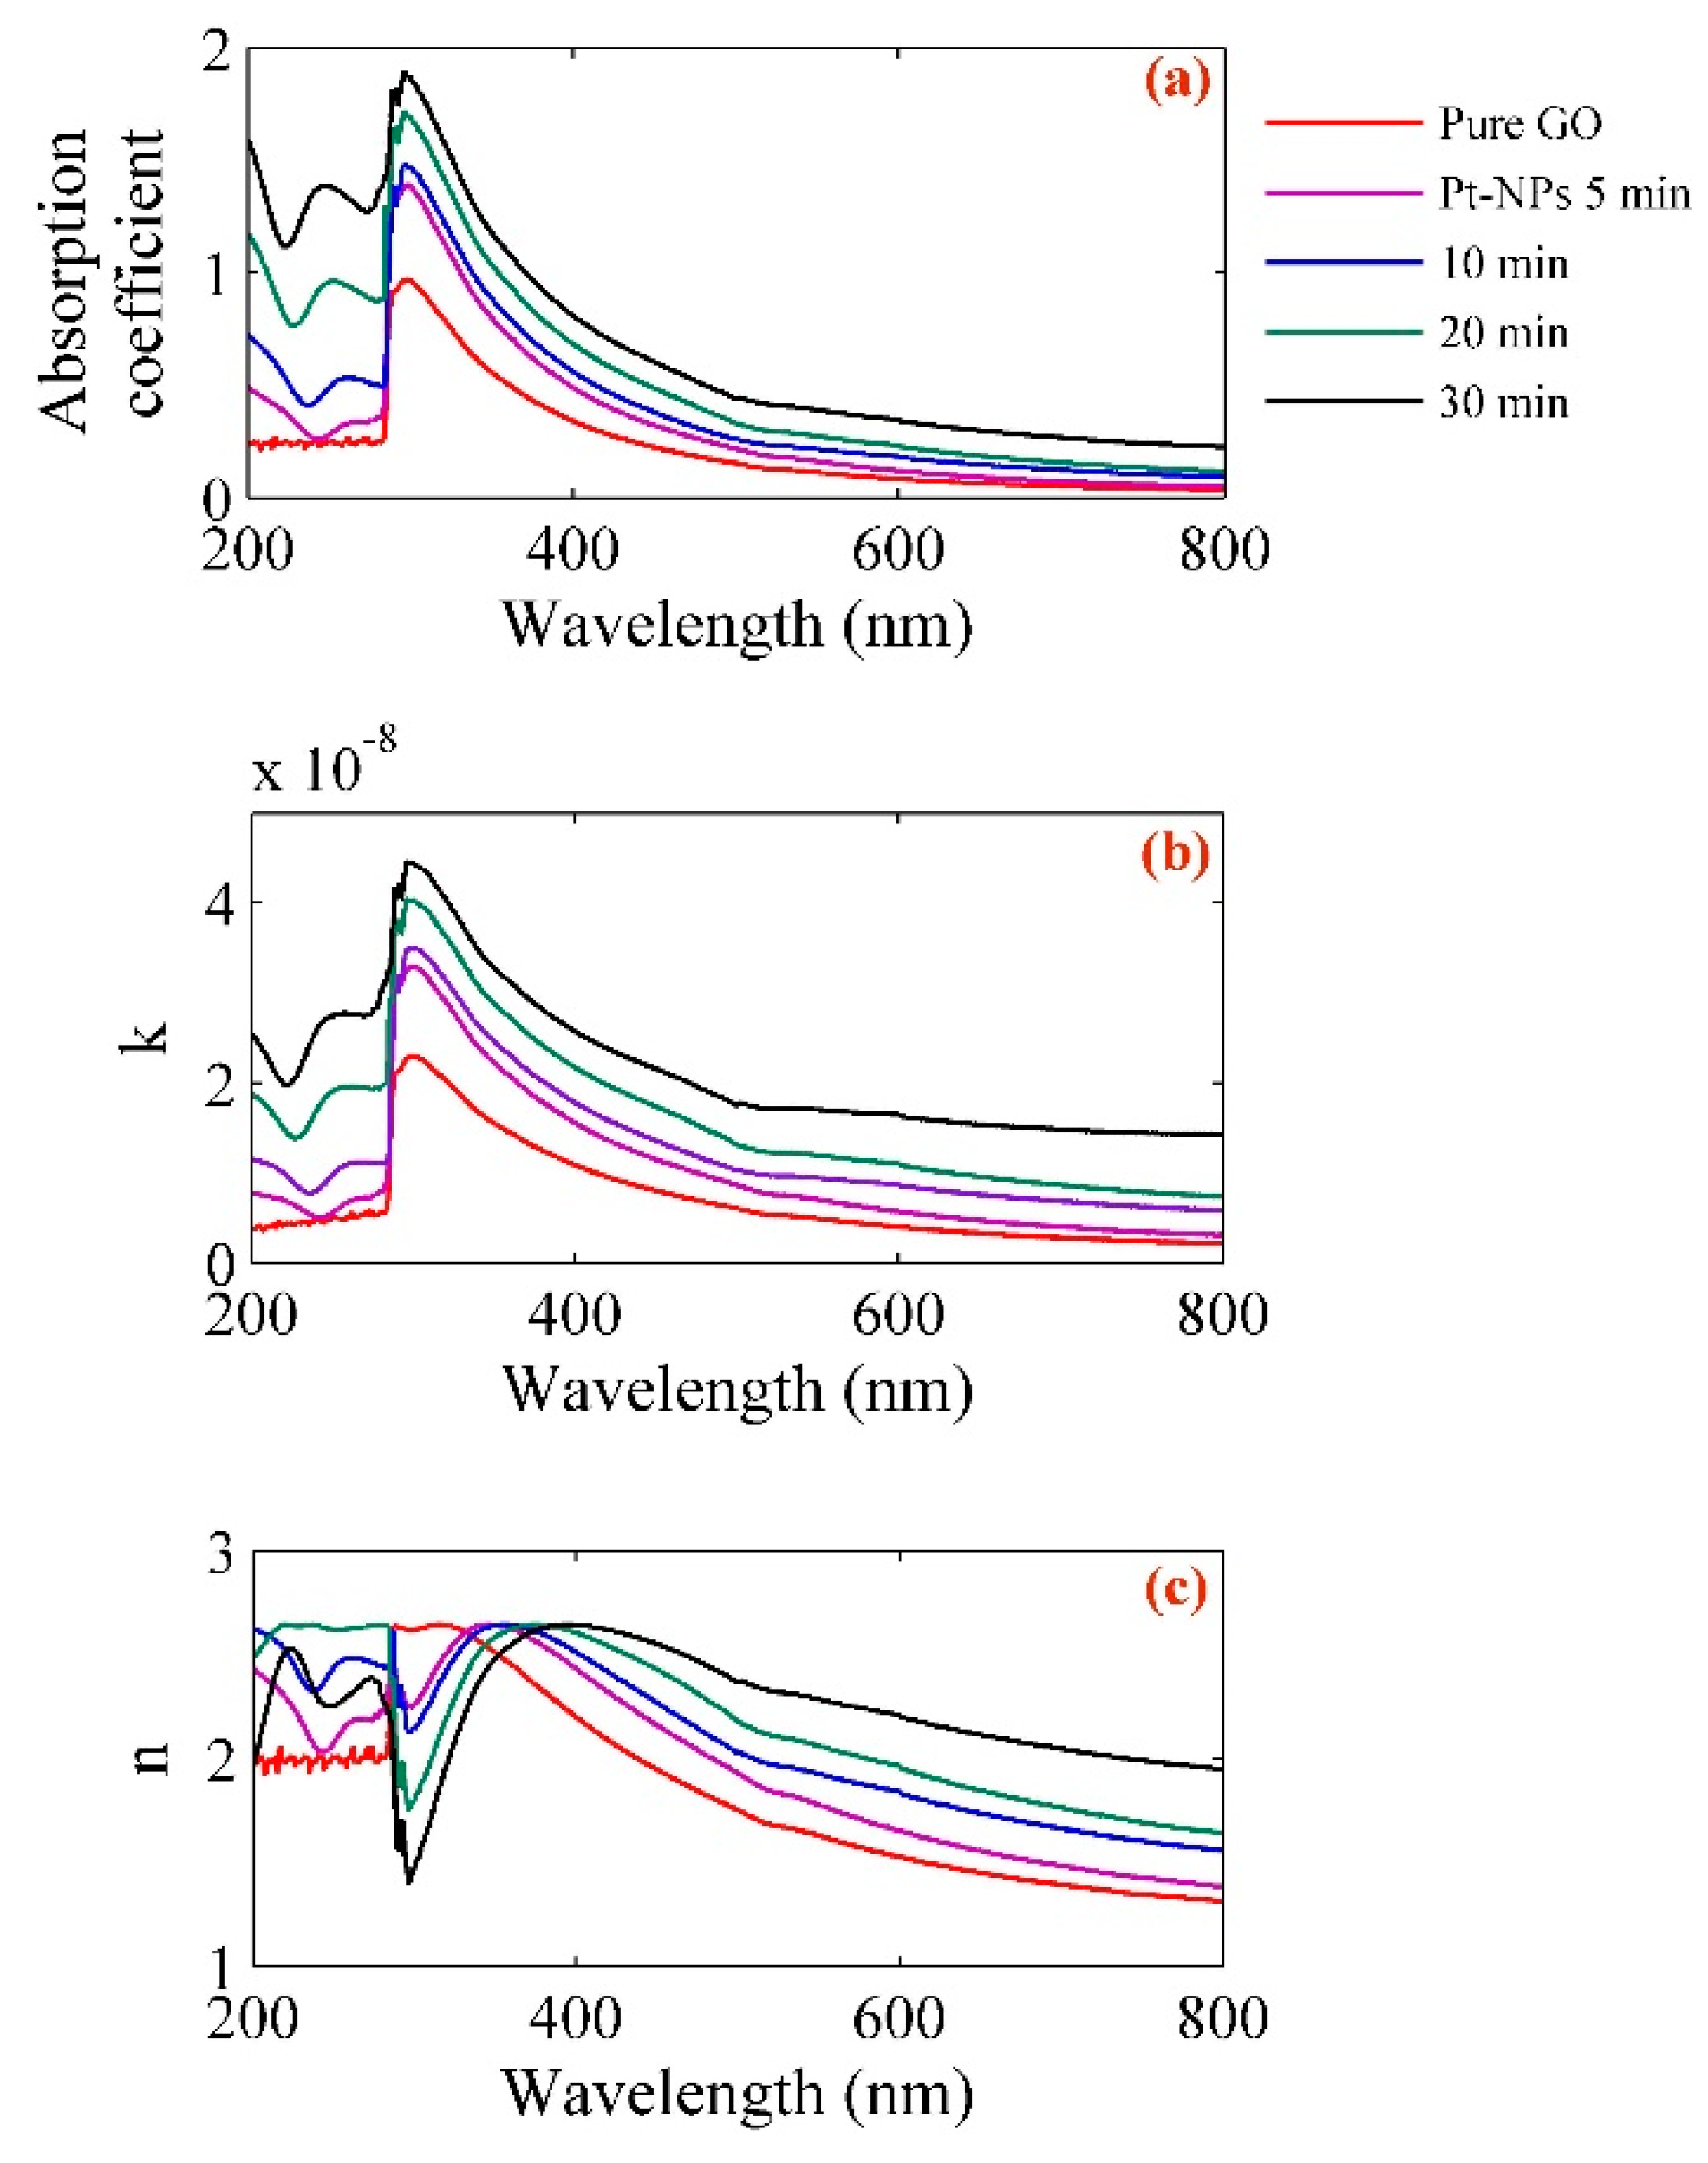
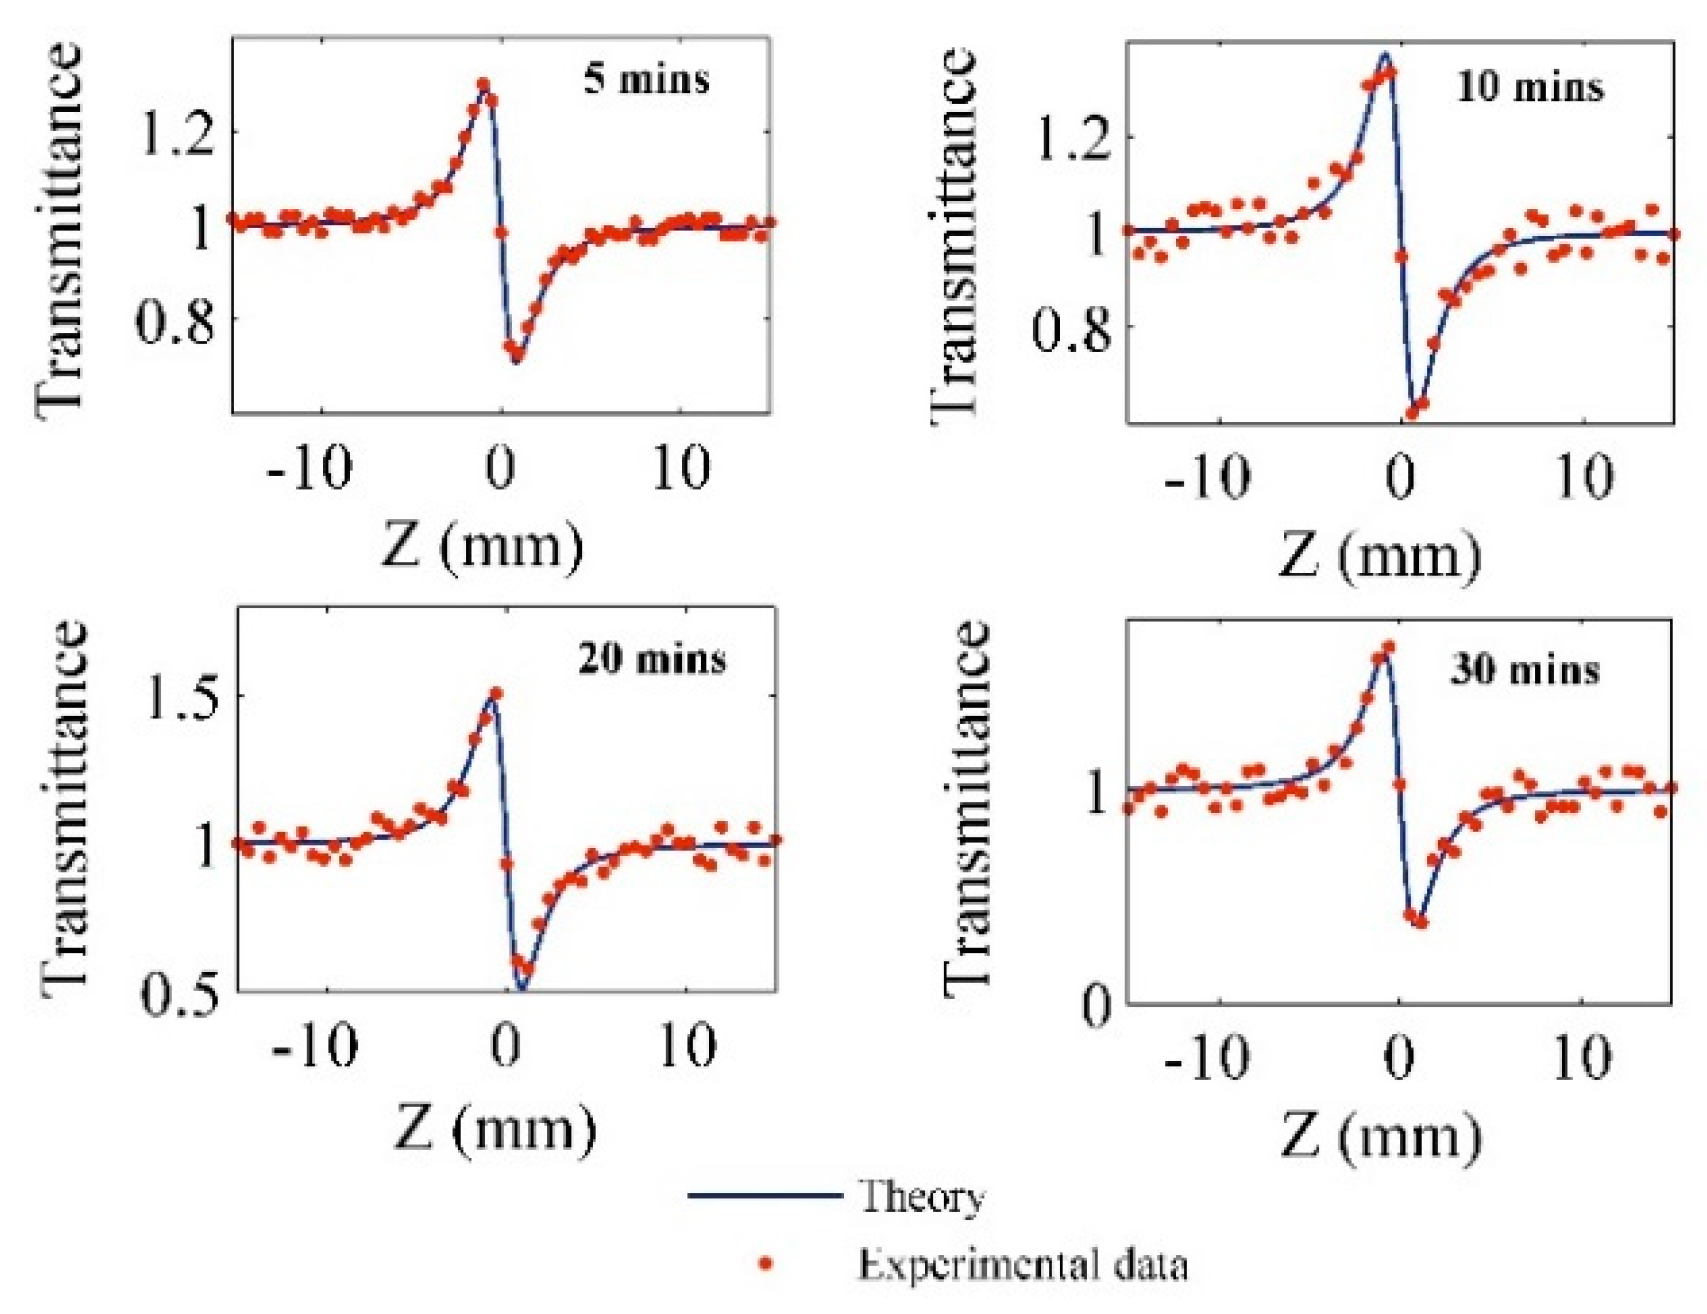
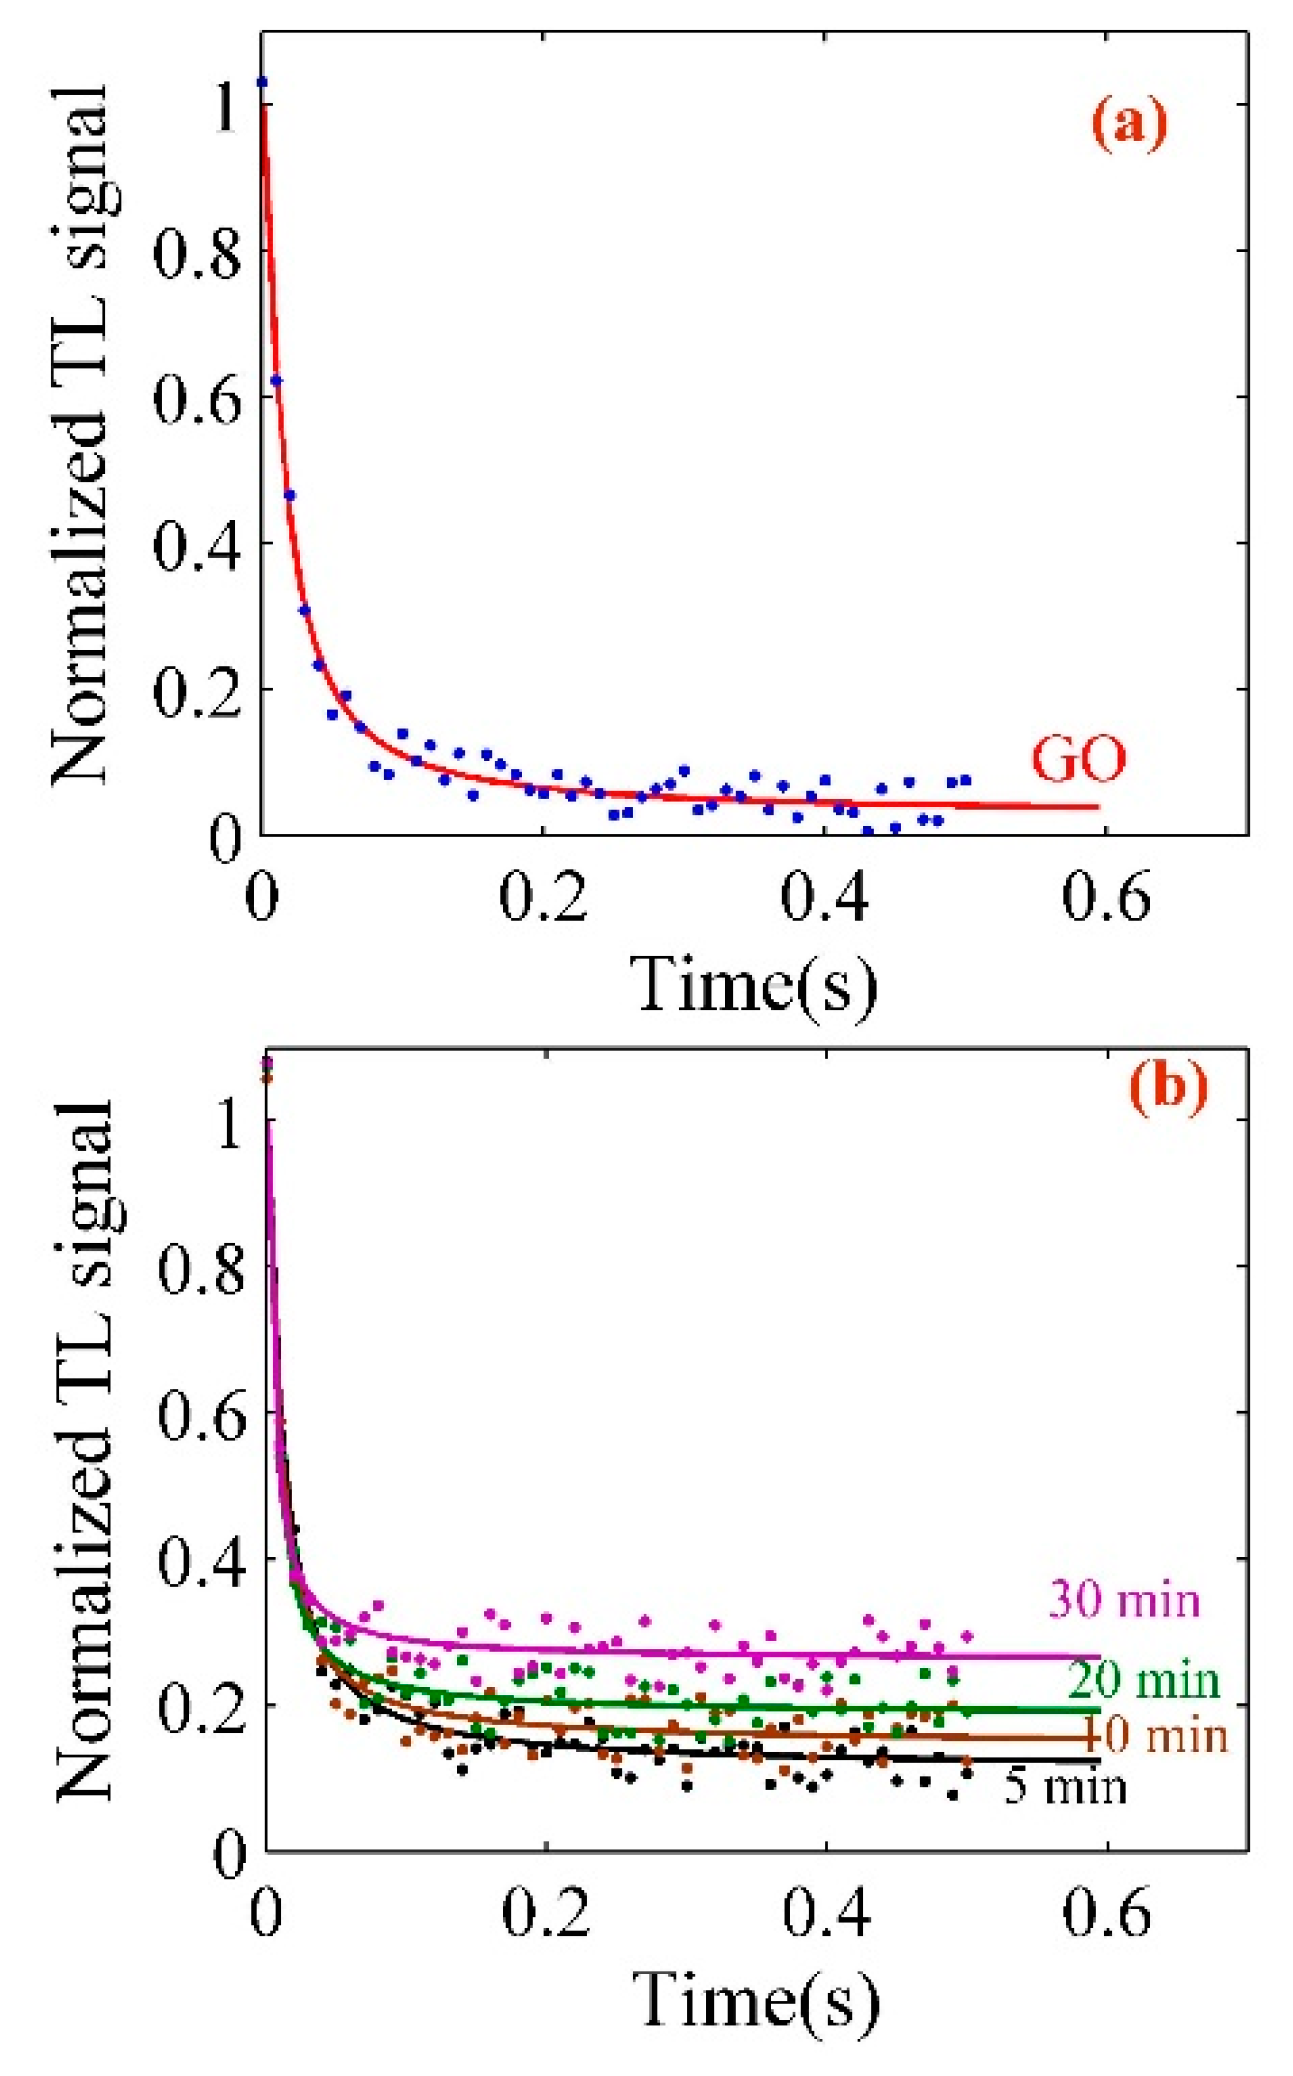
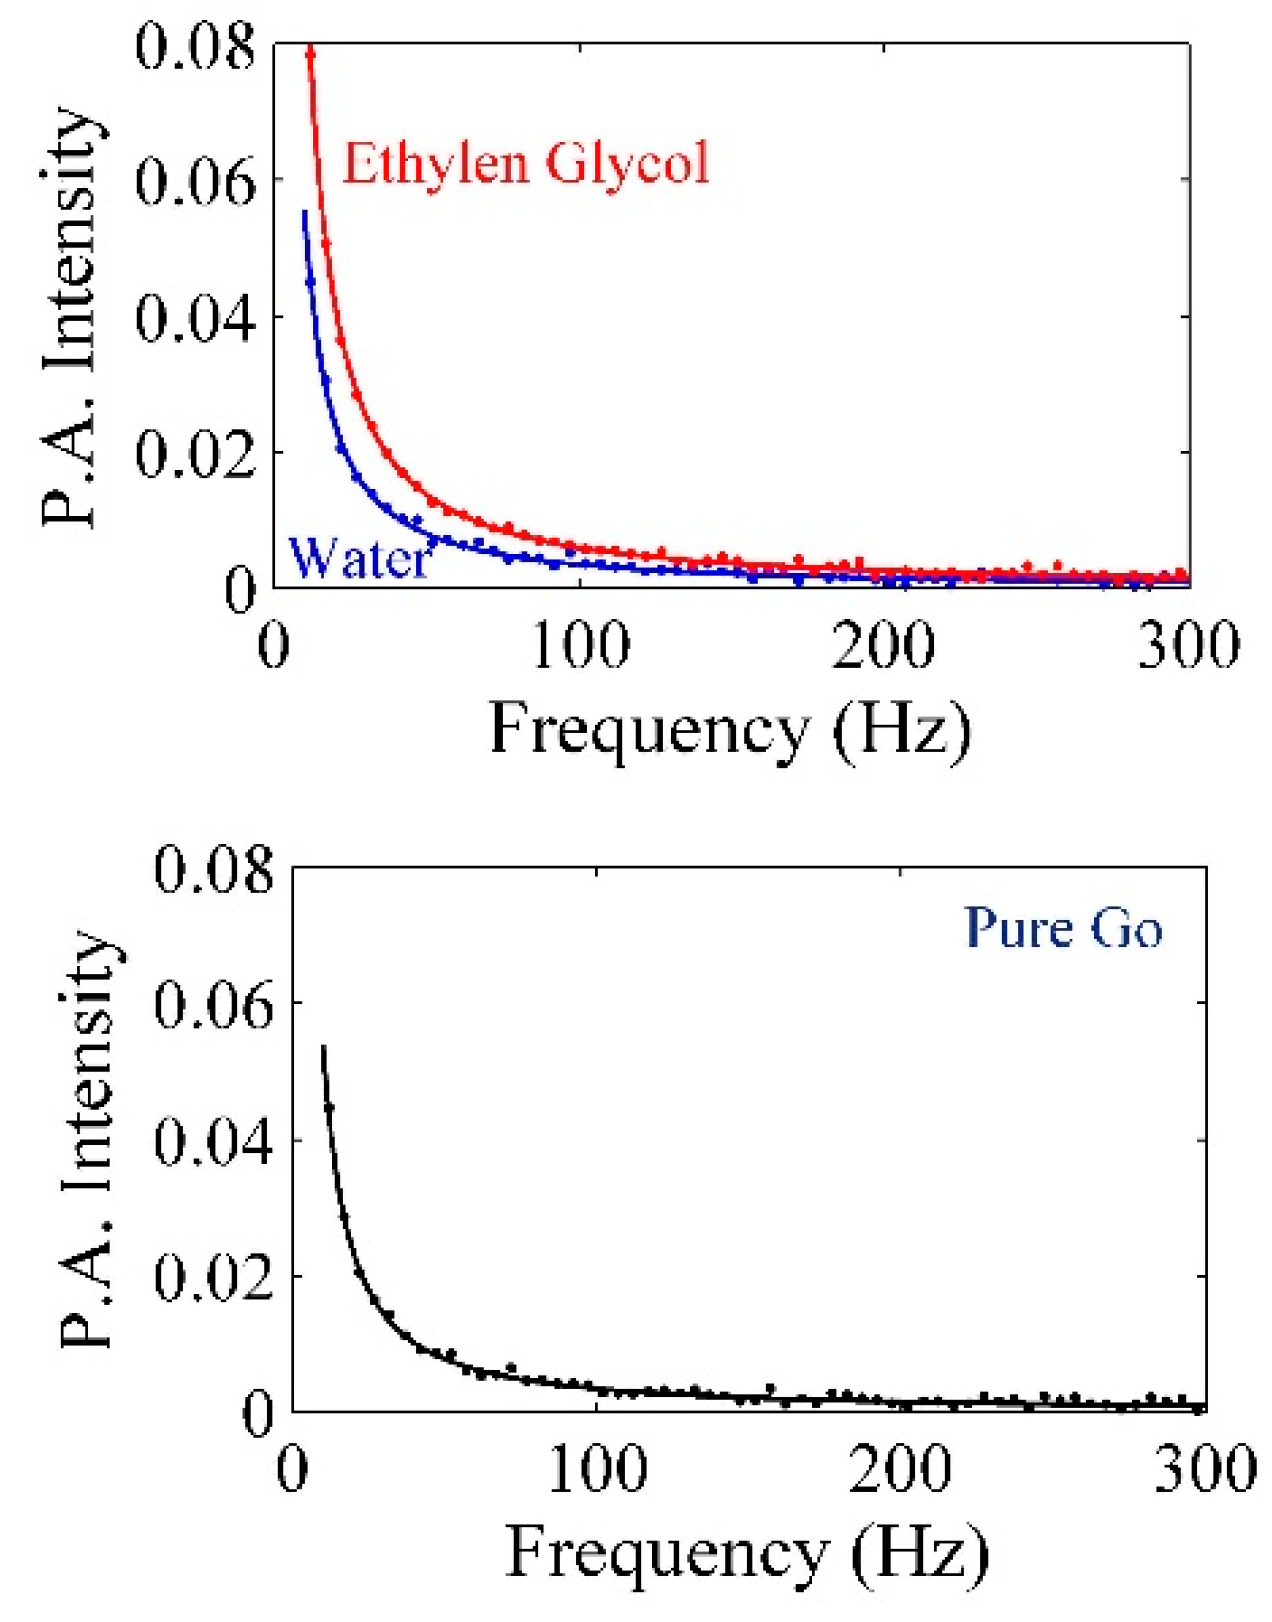
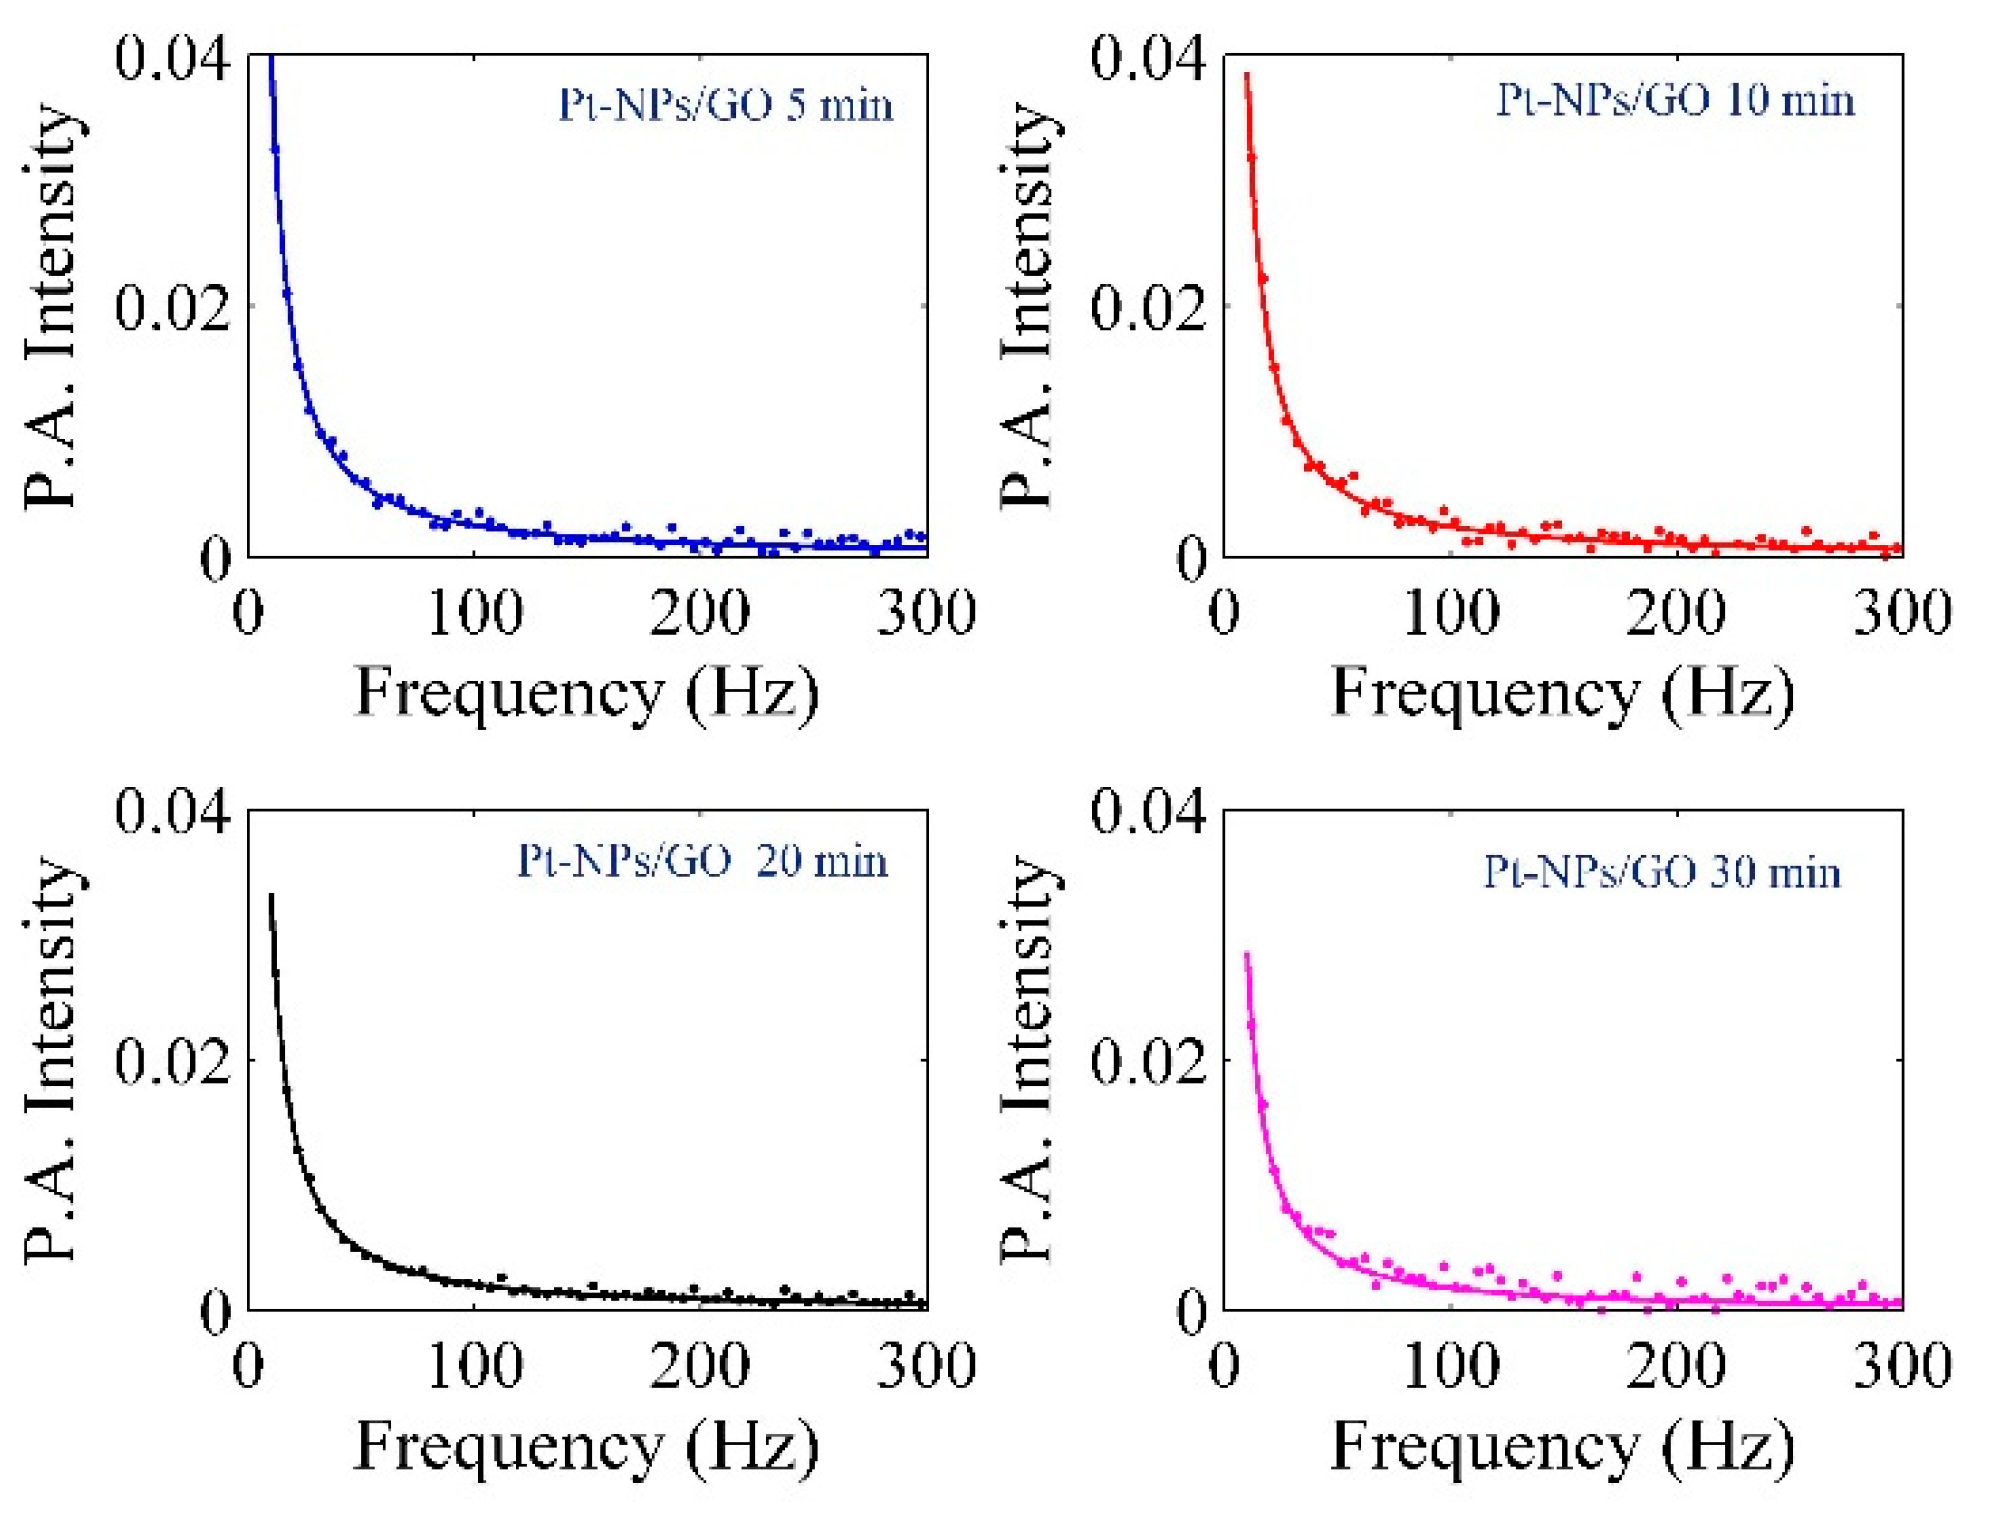
2. Results and Discussion
3. Materials and Methods
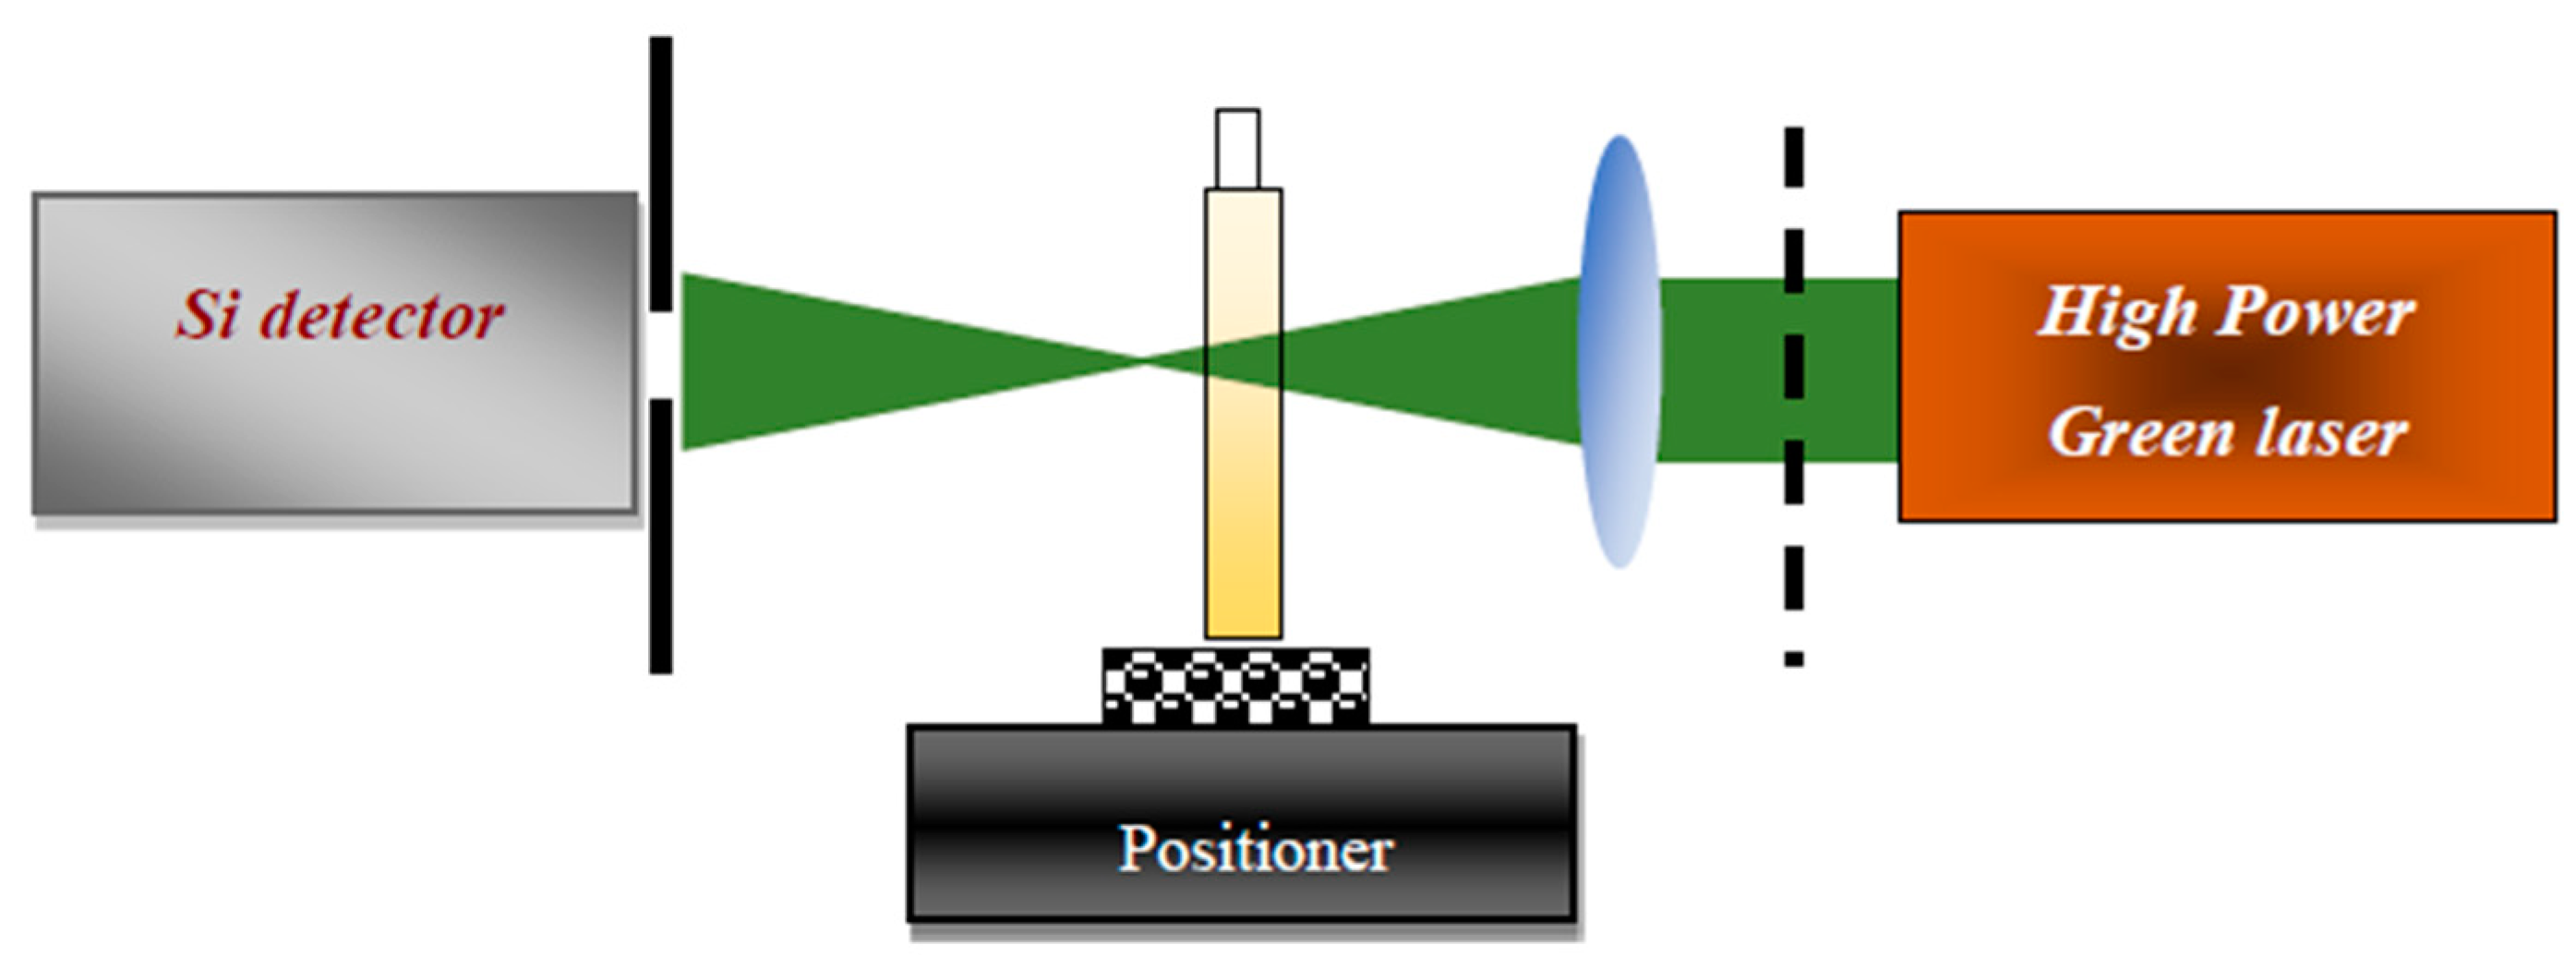
3.1. Laser Ablation
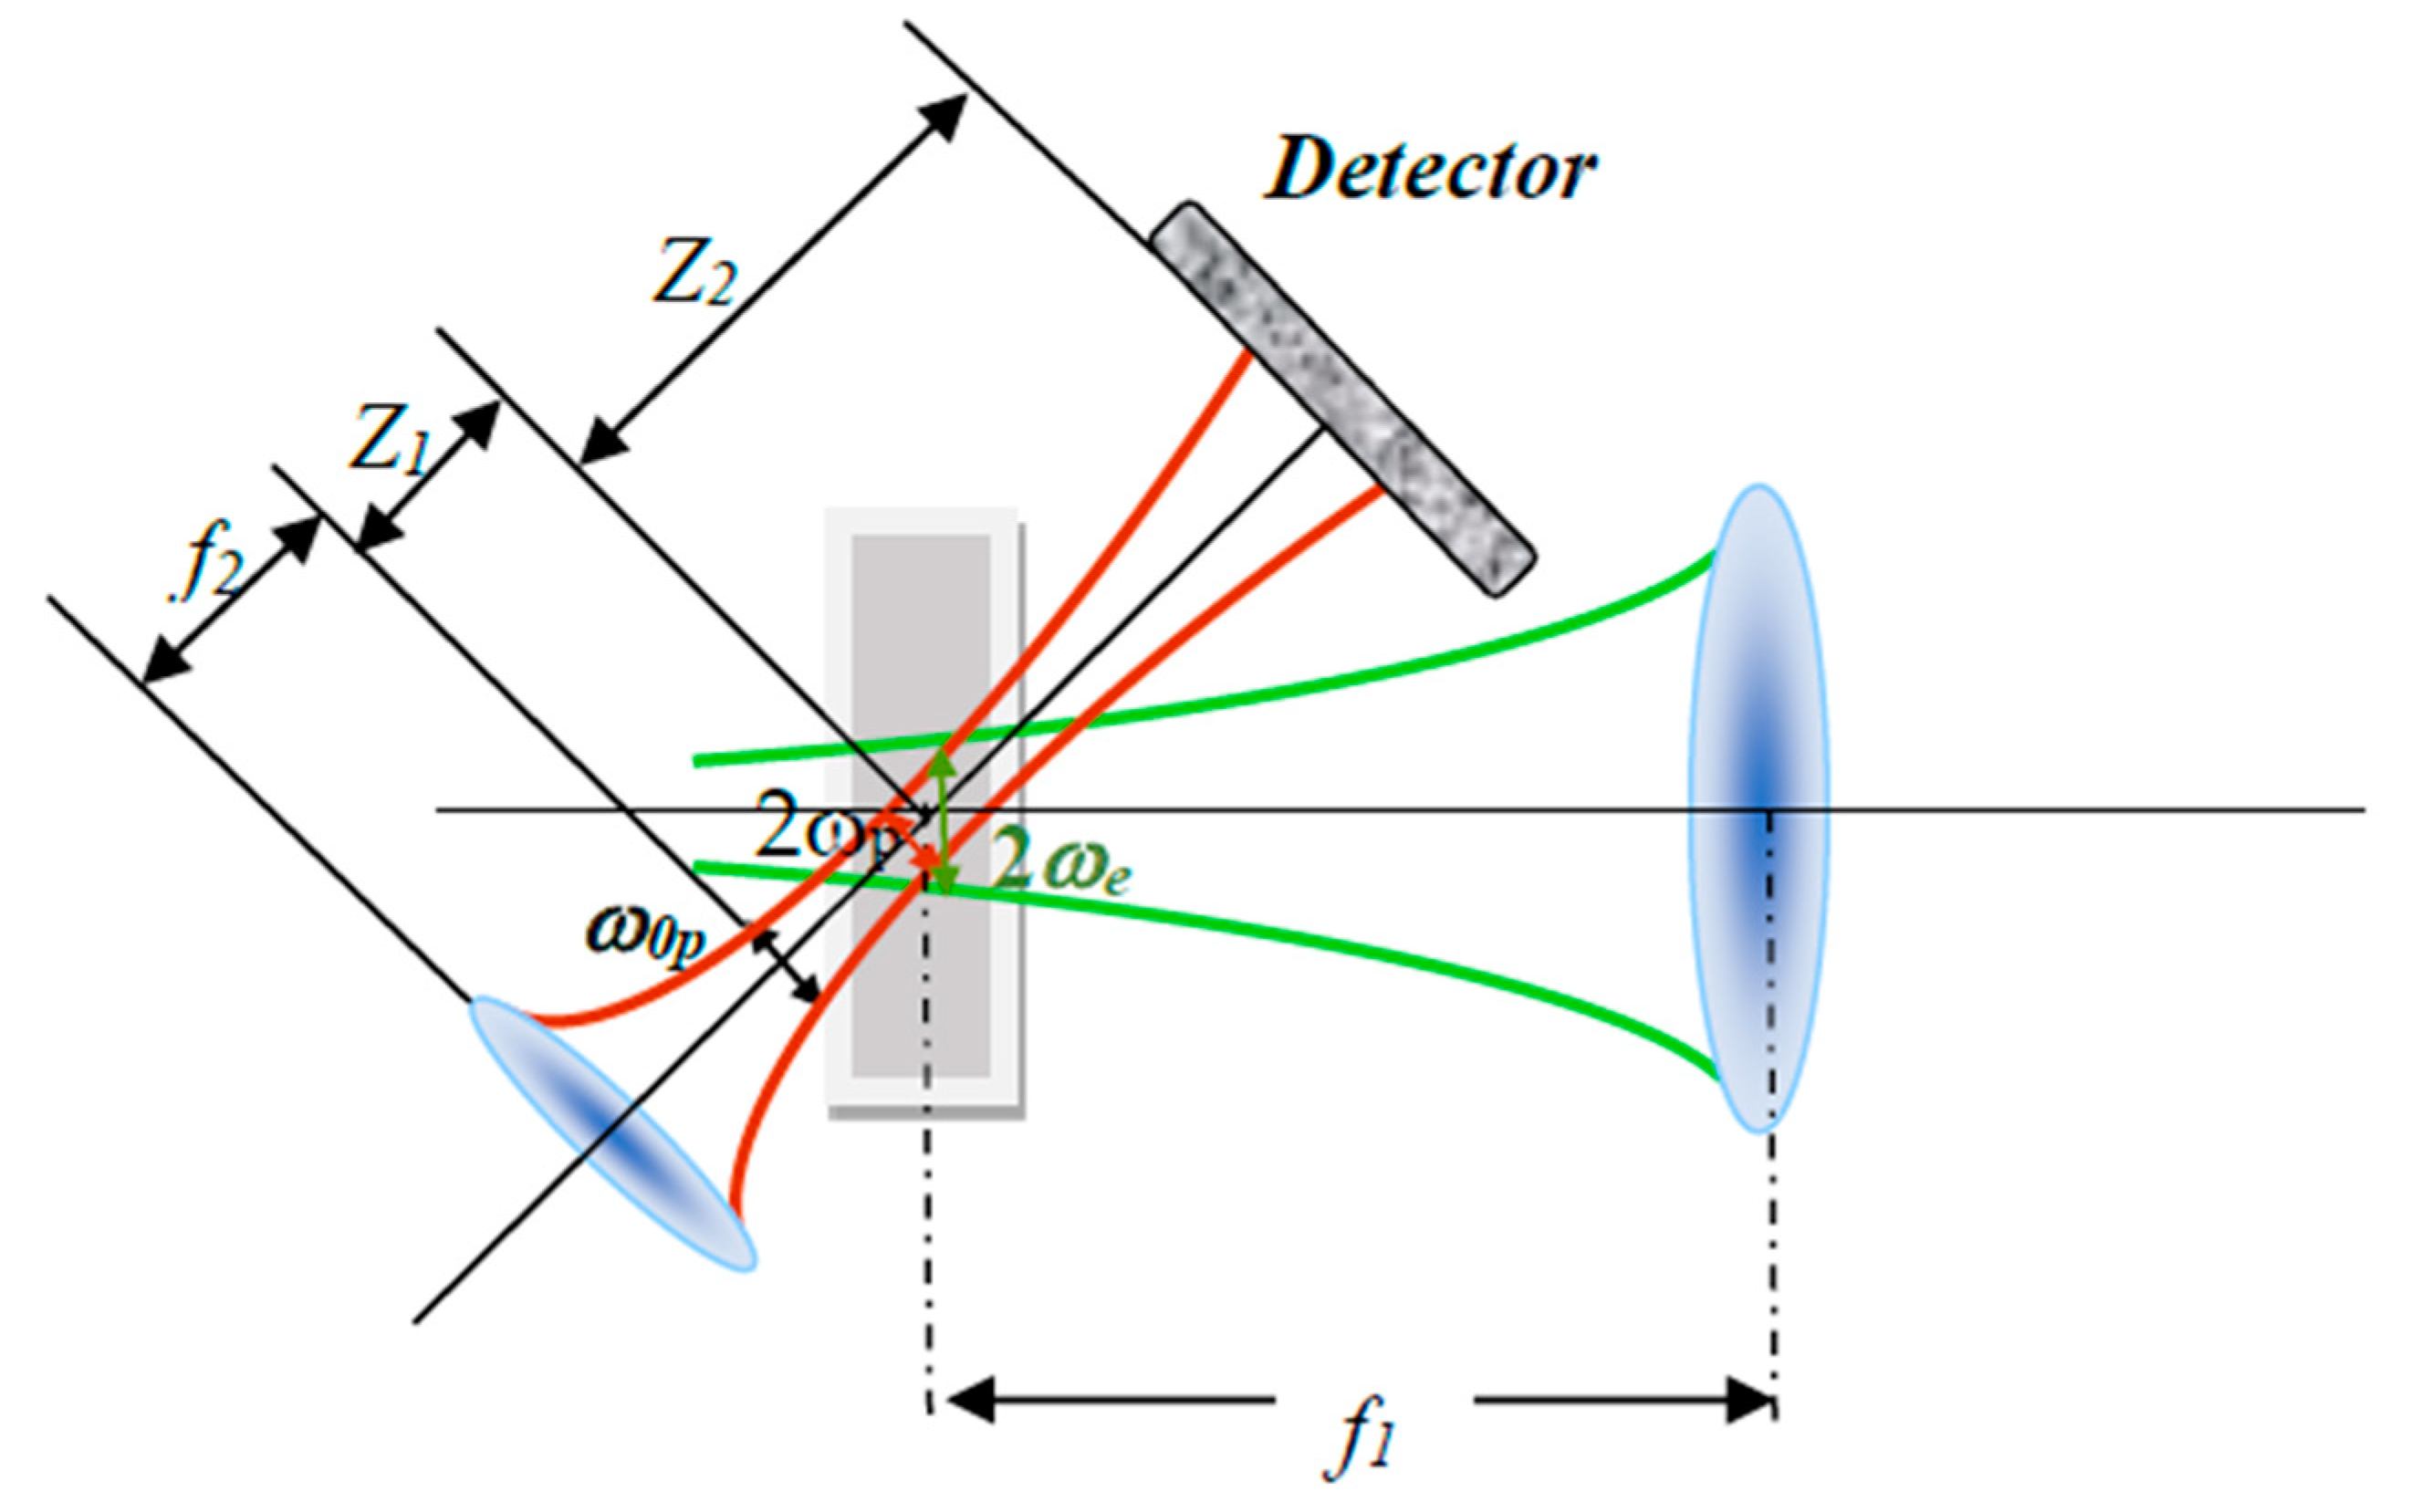
3.2. Z-Scan Setup
3.3. Spatial Self-Phase Modulation Setup
3.4. Thermal Lens Setup
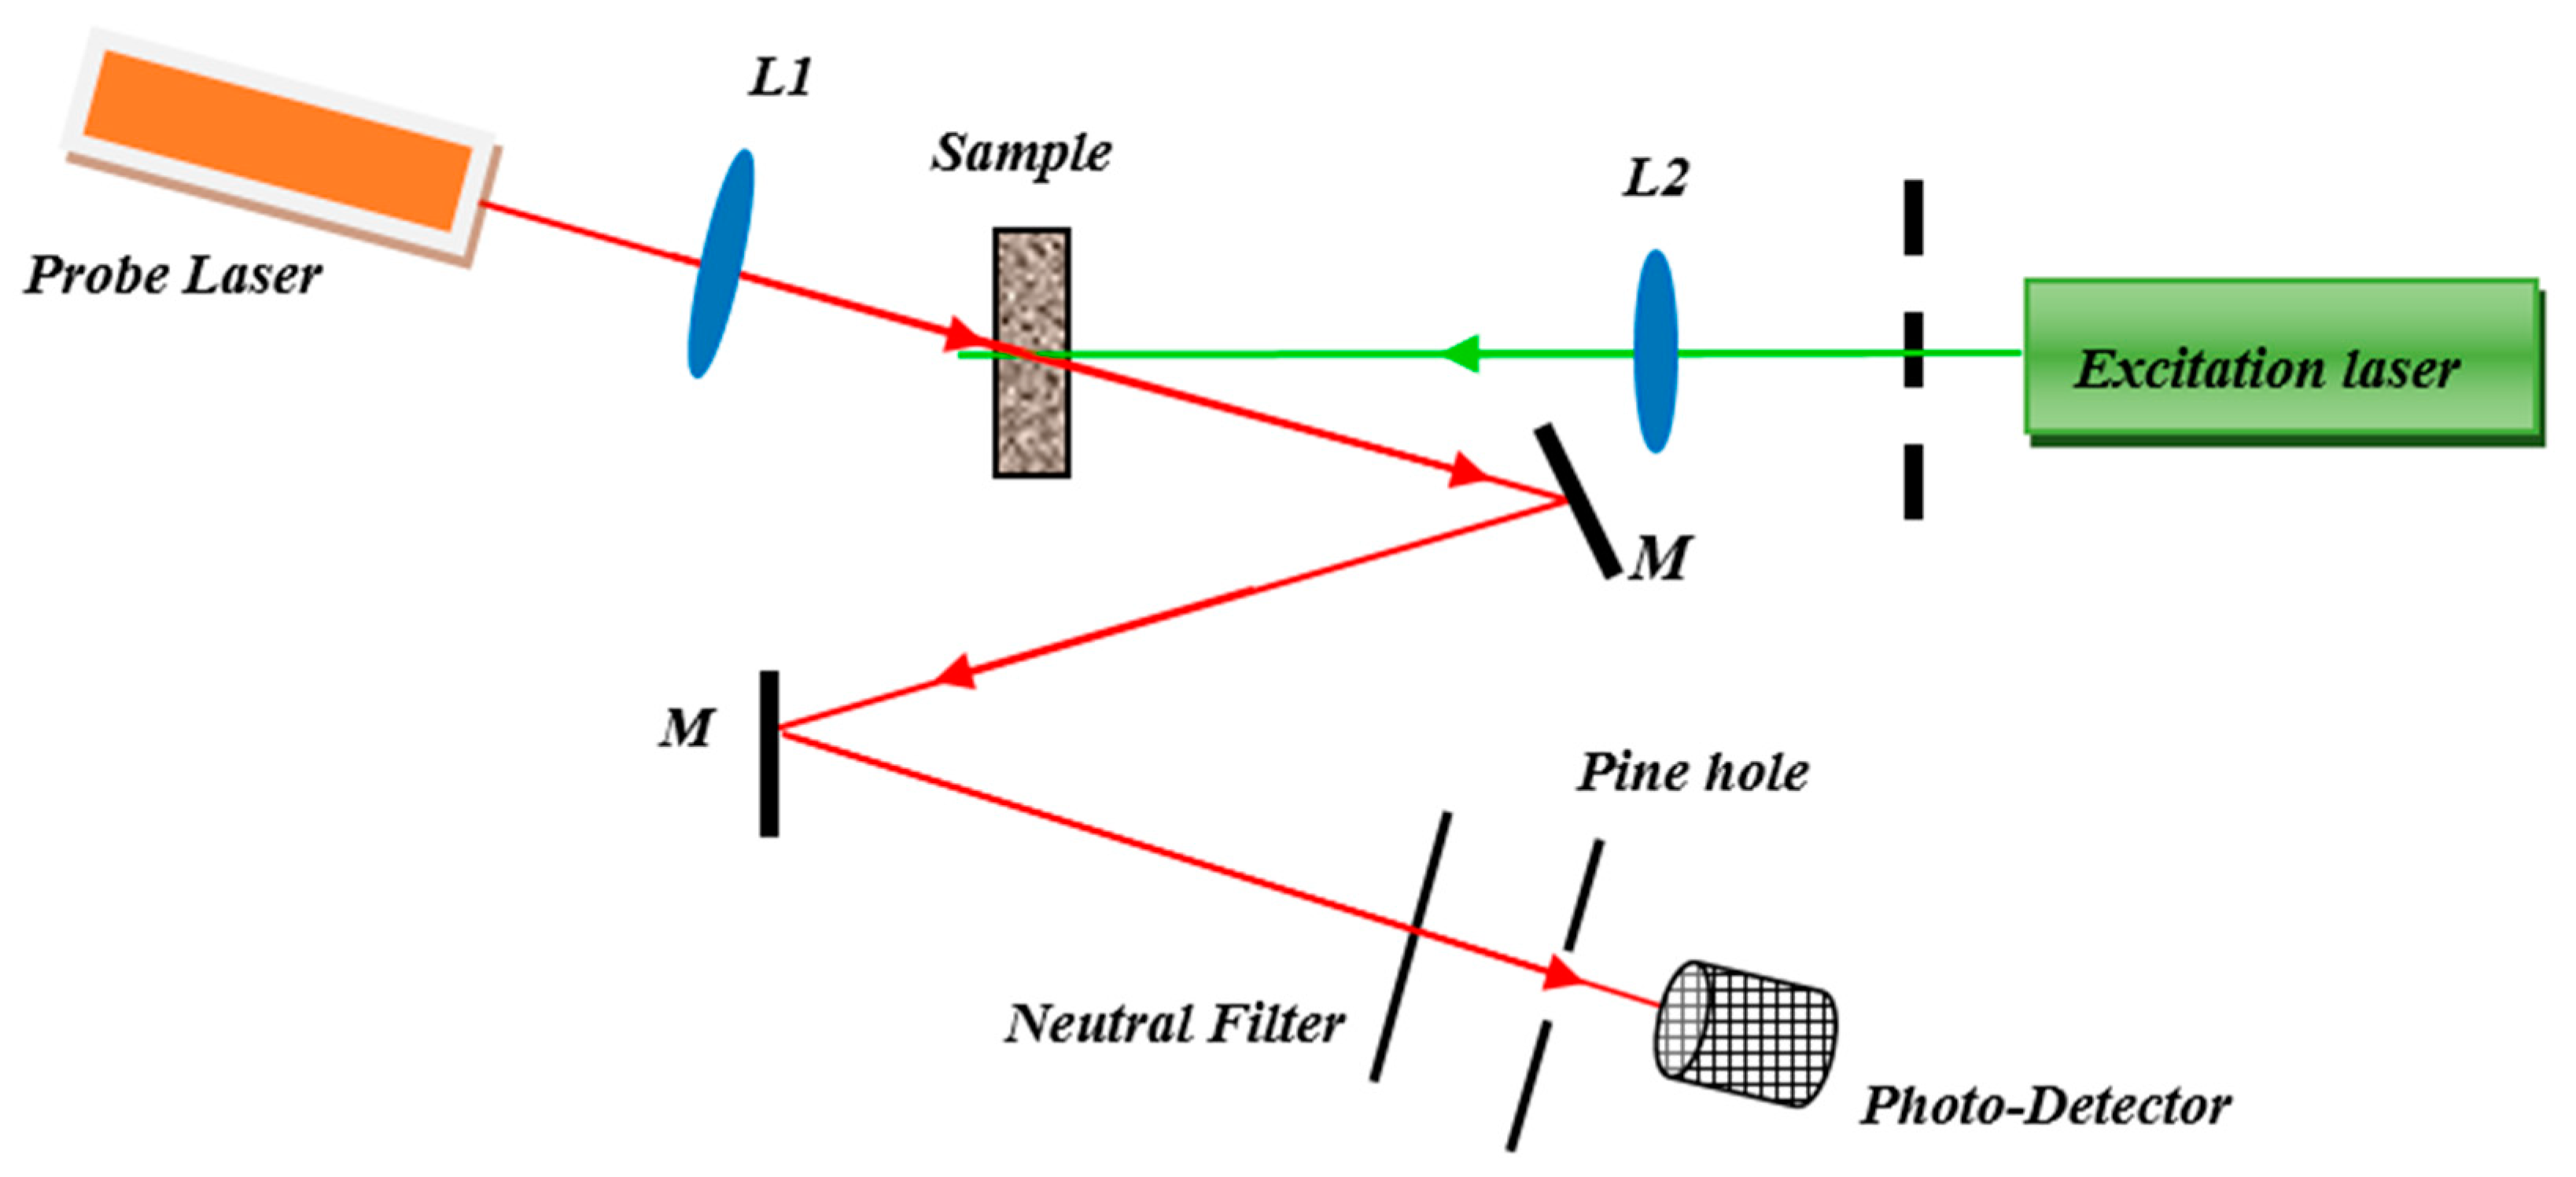
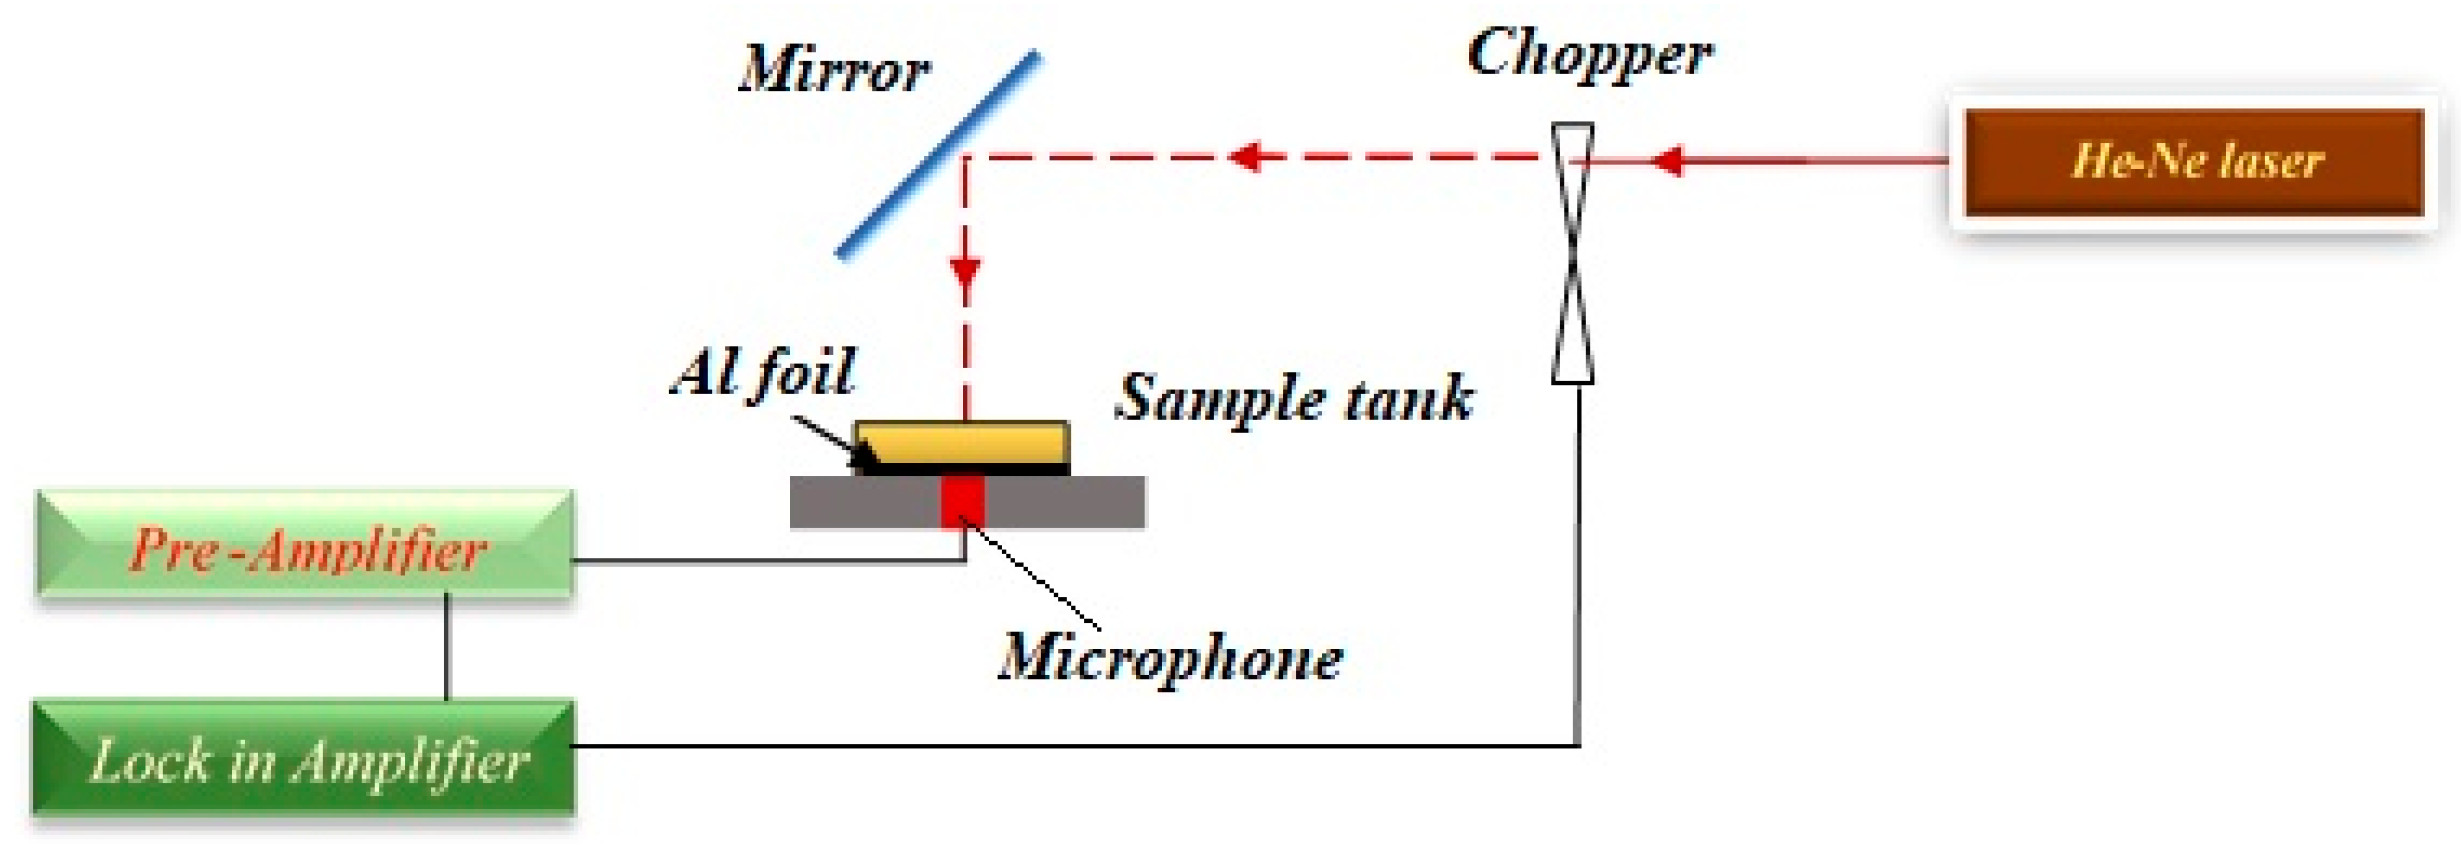
3.5. Photoacoustic (PA) Setup
4. Conclusions
Author Contributions
Funding
Conflicts of Interest
Abbreviations
| Pt-NPs | Platinum nanoparticles |
| GO | Graphene oxide |
| SSPM | Spatial self-phase modulation |
| PA | Photoacoustic |
| RG | Rosencwaig Gersho |
| TEM | Transmission electron microscopy |
| TL | Thermal lens |
| FT-IR | Fourier transform infrared spectroscopy |
References
- Duan, S.; Du, Z.; Fan, H.; Wang, R. Nanostructure Optimization of Platinum-Based Nanomaterials for Catalytic Applications. Nanomaterials 2018, 8, 949. [Google Scholar] [CrossRef] [PubMed]
- Antolini, E.; Lopes, T.; Gonzalez, E.R. An overview of platinum-based catalysts as methanol-resistant oxygen reduction materials for direct methanol fuel cells. J. Alloys Compd. 2008, 461, 253–262. [Google Scholar] [CrossRef]
- Hauch, A.; Georg, A. Diffusion in the electrolyte and charge-transfer reaction at the platinum electrode in dye-sensitized solar cells. Electrochim. Acta 2001, 46, 3457–3466. [Google Scholar] [CrossRef]
- Giuseppe, C.; Pietro, C.; Alessia, I.; Alessandro, S.; Ilaria, C.; Gaetano, D.M.A. new type of transparent and low cost counter-electrode based on platinum nanoparticles for dye-sensitized solar cells. Energy Environ. Sci. 2011, 4, 1838. [Google Scholar]
- Yang, M.; Yang, Y.; Liu, Y.; Shen, G.; Yu, R. Platinum nanoparticles-doped sol-gel/carbon nanotubes composite electrochemical sensors and biosensors. Biosens. Bioelectron. 2006, 21, 1125–1131. [Google Scholar] [CrossRef] [PubMed]
- Pedone, D.; Moglianetti, M.; De Luca, E.; Bardi, G.; Pompa, P.P. Platinum nanoparticles in nanobiomedicine. Chem. Soc. Rev. 2017, 46, 4951–4975. [Google Scholar] [CrossRef]
- Rehman, M.U.; Yoshihisa, Y.; Miyamoto, Y.; Shimizu, T. The anti-inflammatory effects of platinum nanoparticles on the lipopolysaccharide-induced inflammatory response in RAW 264.7 macrophages. Inflamm. Res. 2012, 61, 1177–1185. [Google Scholar] [CrossRef]
- Kim, W.; Lee, J.S.; Shin, D.H.; Jang, J. Platinum nanoparticles immobilized on polypyrrole nanofibers for non-enzyme oxalic acid sensor. J. Mater. Chem. B 2018, 6, 1272–1278. [Google Scholar] [CrossRef]
- Suresh, A.; Novak, S.; Wellenius, P.; Misra, V.; Muth, V.F. Transparent indium gallium zinc oxide transistor based floating gate memory with platinum nanoparticles in the gate dielectric. Appl. Phys. Lett. 2009, 94, 123501. [Google Scholar] [CrossRef]
- Chen, A.; Holt-Hindle, P. Platinum-Based Nanostructured Materials: Synthesis, Properties, and Applications. Chem. Rev. 2010, 110, 3767–3804. [Google Scholar] [CrossRef]
- Peng, Z.; Yang, H. Designer platinum nanoparticles: Control of shape, composition in alloy, nanostructure and electrocatalytic property. Nano Today 2009, 4, 143–164. [Google Scholar] [CrossRef]
- Stepanov, A.L.; Golubev, A.N.; Nikitin, S.I.; Osin, Y.N. A review on the fabrication and properties of platinum nanoparticles. Rev. Adv. Mater. Sci. 2014, 38, 160–175. [Google Scholar]
- San, B.H.; Moh, S.H.; Kim, K.K. Investigation of the heating properties of platinum nanoparticles under a radiofrequency current. Int. J. Hyperthermia 2013, 29, 99–105. [Google Scholar] [CrossRef] [PubMed]
- Johannsen, M.; Thiesen, B.; Wust, P.; Jordan, A. Magnetic nanoparticle hyperthermia for prostate cancer. Int. J. Hyperthermia 2010, 26, 790–795. [Google Scholar] [CrossRef] [PubMed]
- Brondani, D.; Scheeren, C.W.; Dupont, J.; Vieira, I.C. Biosensor based on platinum nanoparticles dispersed in ionic liquid and laccase for determination of adrenaline. Sens. Actuators B Chem. 2009, 140, 252–259. [Google Scholar] [CrossRef]
- Ullah, M.H.; Chung, W.S.; Kim, I.; Ha, C.S. pH-selective synthesis of monodisperse nanoparticles and 3D dendritic nanoclusters of CTAB-stabilized platinum for electrocatalytic O2 reduction. Small 2006, 2, 870–873. [Google Scholar] [CrossRef]
- Du, Y.K.; Yang, P.; Mou, Z.G.; Hua, N.; Jiang, L. Thermal decomposition behaviors of PVP coated on platinum nanoparticles. J. Appl. Polym. Sci. 2006, 99, 23–26. [Google Scholar] [CrossRef]
- Wang, X.; Zhang, Y.; Li, T.; Tian, W.; Zhang, Q.; Cheng, Y. Generation 9 Polyamidoamine Dendrimer Encapsulated Platinum Nanoparticle Mimics Catalase Size, Shape, and Catalytic Activity. Langmuir 2013, 29, 5262–5270. [Google Scholar] [CrossRef]
- Schmidt, E.; Kleist, W.; Krumeich, F.; Mallat, T.; Baiker, A. Platinum Nanoparticles: The Crucial Role of Crystal Face and Colloid Stabilizer in the Diastereoselective Hydrogenation of Cinchonidine. Chem. Eur. J. 2010, 16, 2181–2192. [Google Scholar] [CrossRef]
- Fu, Y.; Zhao, X.; Zhang, J.; Li, W. DNA-Based Platinum Nanozymes for Peroxidase Mimetics. J. Phys. Chem. C 2014, 118, 18116–18125. [Google Scholar] [CrossRef]
- Yu, C.J.; Chen, T.H.; Jiang, J.Y.; Tseng, W.L. Lysozyme-directed synthesis of platinum nanoclusters as a mimic oxidase. Nanoscale 2014, 6, 9618–9624. [Google Scholar] [CrossRef] [PubMed]
- He, S.B.; Deng, H.H.; Liu, A.L.; Li, G.W.; Lin, X.H.; Chen, W.; Xia, X.H. Synthesis and Peroxidase-Like Activity of Salt-Resistant Platinum Nanoparticles by Using Bovine Serum Albumin as the Scaffold. Chem. Cat. Chem. 2014, 6, 1543–1548. [Google Scholar] [CrossRef]
- Chen, X.; Wu, G.; Chen, J.; Chen, X.; Xie, Z.; Wang, X. Synthesis of “clean” and well-dispersive Pd nanoparticles with excellent electrocatalytic property on graphene oxide. J. Am. Chem. Soc. 2011, 133, 3693–3695. [Google Scholar] [CrossRef] [PubMed]
- Das, R.; Nath, S.S.; Chakdar, D.; Gope, G.; Bhattacharjee, R. Synthesis of silver nanoparticles and their optical properties. J. Exp. Nanosci. 2010, 5, 357–362. [Google Scholar] [CrossRef]
- Gharibshahi, E.; Saion, E.; Ashraf, A.; Gharibshahi, L. Size-Controlled and Optical Properties of Platinum Nanoparticles by Gamma Radiolytic Synthesis. Appl. Radiat. Isot. 2017, 130, 211–217. [Google Scholar] [CrossRef] [PubMed]
- Mendivil Palma, M.I.; Krishnan, B.; Rodriguez, G.A.C.; Das Roy, T.K.; Avellaneda, D.A.; Shaji, S. Synthesis and Properties of Platinum Nanoparticles by Pulsed Laser Ablation in Liquid. J. Nanomater. 2016, 2016, 9651637. [Google Scholar] [CrossRef]
- Jakobi, J.; Menéndez-Manjón, A.; Chakravadhanula, V.S.; Kienle, L.; Wagener, P.; Barcikowski, S. Stoichiometry of alloy nanoparticles from laser ablation of PtIr in acetone and their electrophoretic deposition on PtIr electrodes. Nanotechnology 2011, 22, 145601. [Google Scholar] [CrossRef]
- Yan, Z.; Bao, R.; Chrisey, D.B. Excimer laser ablation of a Pt target in water: The observation of hollow particles. Nanotechnology 2010, 21, 145609. [Google Scholar] [CrossRef]
- Mendivil, M.; Krishnan, B.; Castillo, G.A.; Shaji, S. Synthesis and properties of palladium nanoparticles by pulsed laser ablation in liquid. Appl. Surf. Sci. 2015, 348, 45–53. [Google Scholar] [CrossRef]
- Goncalves, G.; Marques, P.A.A.P.; Granadeiro, C.M.; Nogueira, H.I.S.; Singh, M.K.; Grácio, J. Surface Modification of Graphene Nanosheets with Gold Nanoparticles: The Role of Oxygen Moieties at Graphene Surface on Gold Nucleation and Growth. Chem. Mater. 2009, 21, 4796–4802. [Google Scholar] [CrossRef]
- Chen, C.; Long, M.C.; Wu, H.D.; Cai, W.M. One-step synthesis of Pt nanoparticles/reduced graphene oxide composite with enhanced electrochemical catalytic activity. Sci. China Chem. 2013, 56, 354–361. [Google Scholar] [CrossRef]
- Sadrolhosseini, A.R.; Noor, A.S.M.; Shameli, K.; Kharazmi, A.; Huang, N.M.; Mahdi, M.A. Preparation of graphene oxide stabilized nickel nanoparticles with thermal effusivity properties by laser ablation method. J. Nanomater. 2013, 2013, 986764. [Google Scholar] [CrossRef]
- Hontoria-Lucas, C.; Lopez-Peinado, A.J.; Lopez-Gonzalez, J.d.D.; Rojas-Cervantes, M.L.; Martin-Aranda, R.M. Study of oxygen-containing groups in a series of graphite oxides: Physical and chemical characterization. Carbon 1995, 33, 1585–1592. [Google Scholar] [CrossRef]
- Kim, W.J.; Basavaraja, C.; Thinh, P.X.; Huh, D.S. Structural characterization and DC conductivity of honeycomb-patterned poly(ε-caprolactone)/gold nanoparticle-reduced graphite oxide composite films. Mater. Lett. 2013, 90, 14–18. [Google Scholar] [CrossRef]
- Emiru, T.F.; Ayele, D.W. Controlled synthesis, characterization and reduction of graphene oxide: A convenient method for large scale production. Egypt. J. Basic Appl. Sci. 2017, 4, 74–79. [Google Scholar] [CrossRef]
- Ge, S.; Yan, M.; Lu, J.; Zhang, M.; Yu, F.; Yu, J.; Song, X.; Yu, S. Electrochemical biosensor based on graphene oxide–Au nanoclusters composites for l-cysteine analysis. Biosens. Bioelectron. 2012, 31, 49–54. [Google Scholar] [CrossRef]
- Ren, P.G.; Yan, D.X.; Ji, X.; Chen, T.; Li, Z.M. Temperature dependence of graphene oxide reduced by hydrazine hydrate. Nanotechnology 2010, 22, 055705. [Google Scholar] [CrossRef]
- Niu, Z.; Chen, J.; Hng, H.H.; Ma, J.; Chen, X. A leavening strategy to prepare reduced graphene oxide foams. Adv. Mater. 2012, 24, 4144–4150. [Google Scholar]
- Sadrolhosseini, A.R.; Noor, A.S.M.; Faraji, N.; Kharazmi, A.; Mahdi, M.A. Optical Nonlinear Refractive Index of Laser-Ablated Gold Nanoparticles Graphene Oxide Composite. J. Nanomater. 2014, 2014, 962917. [Google Scholar] [CrossRef]
- Fu, Q.; Sun, W. Mie theory for light scattering by a spherical particle in an absorbing medium. Appl. Opt. 2001, 40, 1354–1361. [Google Scholar] [CrossRef]
- Walter, J.G.; Petersen, S.; Stahl, F.; Scheper, T.; Barcikowski, S. Laser ablation-based one-step generation and bio-functionalization of gold nanoparticles conjugated with aptamers. J. Nanobiotechnol. 2010, 8, 21. [Google Scholar] [CrossRef] [PubMed]
- Gupta, P.; Ramrakhiani, M. Influence of the Particle Size on the Optical Properties of CdSe Nanoparticles. Open Nanosci. J. 2009, 3, 15–19. [Google Scholar] [CrossRef]
- Sadrolhosseini, A.R.; Rashid, S.A.; Shafie, S.; Soleimani, H. Laser ablation synthesis of Ag nanoparticles in graphene quantum dots aqueous solution and optical properties of nanocomposite. Appl. Phys. A 2019, 125, 82. [Google Scholar] [CrossRef]
- Zamiri, R.; Zakaria, A.; Ahangar, H.A.; Sadrolhosseini, A.R.; Mahdi, M.A. Fabrication of silver nanoparticles dispersed in palm oil using laser ablation. Int. J. Mol. Sci. 2010, 11, 4764–4770. [Google Scholar] [CrossRef] [PubMed]
- Fox, M. Optical Properties of Solids; Oxford University Press: New York, NY, USA, 2002. [Google Scholar] [CrossRef]
- Rad, A.G.; Abbasi, H.; Golyari, K. Fabrication and nonlinear refractive index measurement of colloidal silver nanoparticles. Int. J. Appl. Phys. Math. 2012, 2, 135. [Google Scholar] [CrossRef]
- Sheik-Bahae, M.; Said, A.A.; Van Stryland, E.W. High-sensitivity, single-beam n 2 measurements. Opt. Lett. 1989, 14, 955–957. [Google Scholar] [CrossRef]
- Prusty, S.; Mavi, H.S.; Shukla, A.K. Optical nonlinearity in silicon nanoparticles: Effect of size and probing intensity. Phys. Rev. B 2005, 71, 113313. [Google Scholar] [CrossRef]
- Sadrolhosseini, A.R.; Noor, A.S.M.; Mehdipour, L.A.; Noura, A.; Mahdi, M.A. Application of thermal lens technique to measure the thermal diffusivity of biodiesel blend. Opt. Rev. 2015, 22, 289–293. [Google Scholar] [CrossRef]
- Shen, J.; Lowe, R.D.; Snook, R.D. A model for cw laser induced mode-mismatched dual-beam thermal lens spectrometry. Chem. Phys. 1992, 165, 385–396. [Google Scholar] [CrossRef]
- Delgado-Vasallo, O.; Marin, E. Application of the photoacoustic technique to the measurement of the thermal effusivity of liquids. J. Phys. D 1999, 32, 593–597. [Google Scholar] [CrossRef]
- Sadrolhosseini, A.R.; Rashid, S.A.; Noor, A.S.M.; Kharazmi, A.; Mehdipour, L.A. Fabrication of silver nanoparticles in pomegranate seed oil with thermal properties by laser ablation technique. Dig. J. Nanomater. Biostruct. 2015, 10, 1009–1018. [Google Scholar]
- Huang, N.M.; Lim, H.N.; Chia, C.H.; Yarmo, M.A.; Muhamad, M.R. Simple room-temperature preparation of high-yield large-area graphene oxide. Int. J. Nanomed. 2011, 6, 3443–3448. [Google Scholar] [CrossRef] [PubMed]
- Sadrolhosseini, A.R.; Mahdi, M.A.; Alizadeh, F.; Rashid, S.A. Laser Ablation Technique for Synthesis of Metal Nanoparticle in Liquid. In Laser Technology and its Applications; IntechOpen: London, UK, 2018; pp. 63–83. [Google Scholar]
- Zhang, J.; Claverie, J.; Chaker, M.; Ma, D. Colloidal Metal Nanoparticles Prepared by Laser Ablation and their Applications. ChemPhysChem 2017, 18, 986–1006. [Google Scholar] [CrossRef] [PubMed]
- Ratti, M.; Naddeo, J.J.; Griepenburg, J.C.; O’Malley, S.M.; Bubb, D.M.; Klein, E.A. Production of Metal Nanoparticles by Pulsed Laser-ablation in Liquids: A Tool for Studying the Antibacterial Properties of Nanoparticles. J. Vis. Exp. 2017, 124, e55416. [Google Scholar] [CrossRef] [PubMed]
- Zhang, Y.; Wang, Y. Nonlinear optical properties of metal nanoparticles: A review. RSC Adv. 2017, 7, 45129–45144. [Google Scholar] [CrossRef]
- Sadrolhosseini, A.R.; Abdul Rashid, S.; Shojanazeri, H.; Noor, A.S.M. Spatial self-phase modulation patterns in graphene oxide and graphene oxide with silver and gold nanoparticles. Opt. Quant. Electron. 2016, 48, 1–3. [Google Scholar] [CrossRef]
- Deng, L.; He, K.; Zhou, T.; Li, C. Formation and evolution of far-field diffraction patterns of divergent and convergent Gaussian beams passing through self-focusing and self-defocusing media. J. Opt. A Pure Appl. Opt. 2005, 7, 409–4015. [Google Scholar] [CrossRef]
- Zamiri, R.; Parvizi, R.; Zakaria, A.; Sadrolhosseini, A.R.; Zamiri, G.; Darroudi, M.; Husin, M.S. Investigation on nonlinear-optical properties of palm oil/silver nanoparticles. J. Eur. Opt. Soc. Rapid Publ. 2012, 7, 1–4. [Google Scholar] [CrossRef]
- Karimzadeh, K. Spatial self-phase modulation of a laser beam propagating through liquids with self-induced natural convection flow. J. Opt. 2012, 14, 095701. [Google Scholar] [CrossRef]
- Zamiri, R.; Azmi, Z.; Bin Ahmad, M.; Shameli, K.; Darroudi, M.; Mahdi, M.A.; Husin, M.S. Thermal diffusivity of silver metallic nanoparticles in clay matrix. J. Optoelectron. Adv. Mater. 2010, 12, 1879–1883. [Google Scholar]
- Snook, R.D.; Lowe, R.D. Thermal lens spectrometry A review. Analyst 1995, 120, 2051–2068. [Google Scholar] [CrossRef]
- Silva, R.; de Araújo, M.A.; Jali, P.; Moreira, S.G.; Alcantara, P., Jr.; de Oliveira, P.C. Thermal lens spectrometry: Optimizing amplitude and shortening the transient time. AIP Adv. 2011, 1, 022154. [Google Scholar] [CrossRef]
- Gao, F.; Feng, X.; Zhang, R.; Liu, S.; Ding, R.; Kishor, R.; Zheng, Y. Single laser pulse generates dual photoacoustic signals for differential contrast photoacoustic imaging. Sci. Rep. 2017, 7, 626. [Google Scholar] [CrossRef] [PubMed]


| Pt-NPs/GO (min) | Concentration of Pt-NPs (ppm) | Particle Size (nm) | Volume Fraction of Pt-NPs |
|---|---|---|---|
| 5 | 4.3 | 22 | 0.02009 |
| 10 | 8.43 | 18 | 0.03939 |
| 20 | 17.4 | 15 | 0.08131 |
| 30 | 25 | 12 | 0.11683 |
| Sample | n | k (10−8) | ||||
|---|---|---|---|---|---|---|
| 532 (nm) | 594 (nm) | 633 (nm) | 532 (nm) | 594 (nm) | 633 (nm) | |
| Pt-NPs (5 min) | 1.82334 | 1.80125 | 1.58539 | 7.466 | 7.251 | 0.499 |
| Pt-NPs (10 min) | 1.95732 | 1.94191 | 1.76538 | 9.636 | 9.544 | 0.785 |
| Pt-NPs (20 min) | 2.09519 | 2.07813 | 1.87933 | 12.206 | 12.071 | 0.993 |
| Pt-NPs (30 min) | 2.31368 | 2.30018 | 2.14037 | 17.151 | 17.096 | 1.562 |
| Pt-NPs/GO (min) | ||||
|---|---|---|---|---|
| 5 | −1.435 | 0.176 | 9.9991 | −1.56 |
| 10 | −1.83 | 0.228 | 9.9988 | −1.79 |
| 20 | −2.4 | 0.288 | 9.9985 | −2.43 |
| 30 | −3.1 | 0.405 | 9.9979 | −3.81 |
| Sample | Thermal Effusivity (W s1/2 cm−2 K−1) | Thermal Diffusivity (10−5 m2/s) | ||||
|---|---|---|---|---|---|---|
| Water | 45.614 | 0.163 | - | |||
| Ethylene glycol | 26.025 | 0.093 | - | |||
| Pure GO | 47.013 | 0.168 | 1.78 | 0.00319 | 0.0341 | 0.0763 |
| Pt-NPs/GO 5 min | 63.076 | 0.2254 | 1.48 | 0.00308 | 0.0432 | 0.096 |
| Pt-NPs/GO 10 min | 65.818 | 0.2352 | 1.39 | 0.00227 | 0.0585 | 0.132 |
| Pt-NPs/GO 20 min | 76.396 | 0.273 | 1.30 | 0.00152 | 0.0875 | 0.202 |
| Pt-NPs/GO 30 min | 89.325 | 0.3192 | 1.15 | 0.0011 | 0.1223 | 0.288 |
© 2019 by the authors. Licensee MDPI, Basel, Switzerland. This article is an open access article distributed under the terms and conditions of the Creative Commons Attribution (CC BY) license (http://creativecommons.org/licenses/by/4.0/).
Share and Cite
Sadrolhosseini, A.R.; Habibiasr, M.; Shafie, S.; Solaimani, H.; Lim, H.N. Optical and Thermal Properties of Laser-Ablated Platinum Nanoparticles Graphene Oxide Composite. Int. J. Mol. Sci. 2019, 20, 6153. https://doi.org/10.3390/ijms20246153
Sadrolhosseini AR, Habibiasr M, Shafie S, Solaimani H, Lim HN. Optical and Thermal Properties of Laser-Ablated Platinum Nanoparticles Graphene Oxide Composite. International Journal of Molecular Sciences. 2019; 20(24):6153. https://doi.org/10.3390/ijms20246153
Chicago/Turabian StyleSadrolhosseini, Amir Reza, Mina Habibiasr, Suhaidi Shafie, Hassan Solaimani, and Hong Ngee Lim. 2019. "Optical and Thermal Properties of Laser-Ablated Platinum Nanoparticles Graphene Oxide Composite" International Journal of Molecular Sciences 20, no. 24: 6153. https://doi.org/10.3390/ijms20246153
APA StyleSadrolhosseini, A. R., Habibiasr, M., Shafie, S., Solaimani, H., & Lim, H. N. (2019). Optical and Thermal Properties of Laser-Ablated Platinum Nanoparticles Graphene Oxide Composite. International Journal of Molecular Sciences, 20(24), 6153. https://doi.org/10.3390/ijms20246153