A Review of Computational Methods for Cervical Cells Segmentation and Abnormality Classification


Abstract
1. Introduction
2. Cervical Cancer Disease Characterization
Cervical Cancer Types
3. Cervical Cancer Screening Characterization
3.1. Screening Methods
3.2. Classification Systems
The Bethesda System
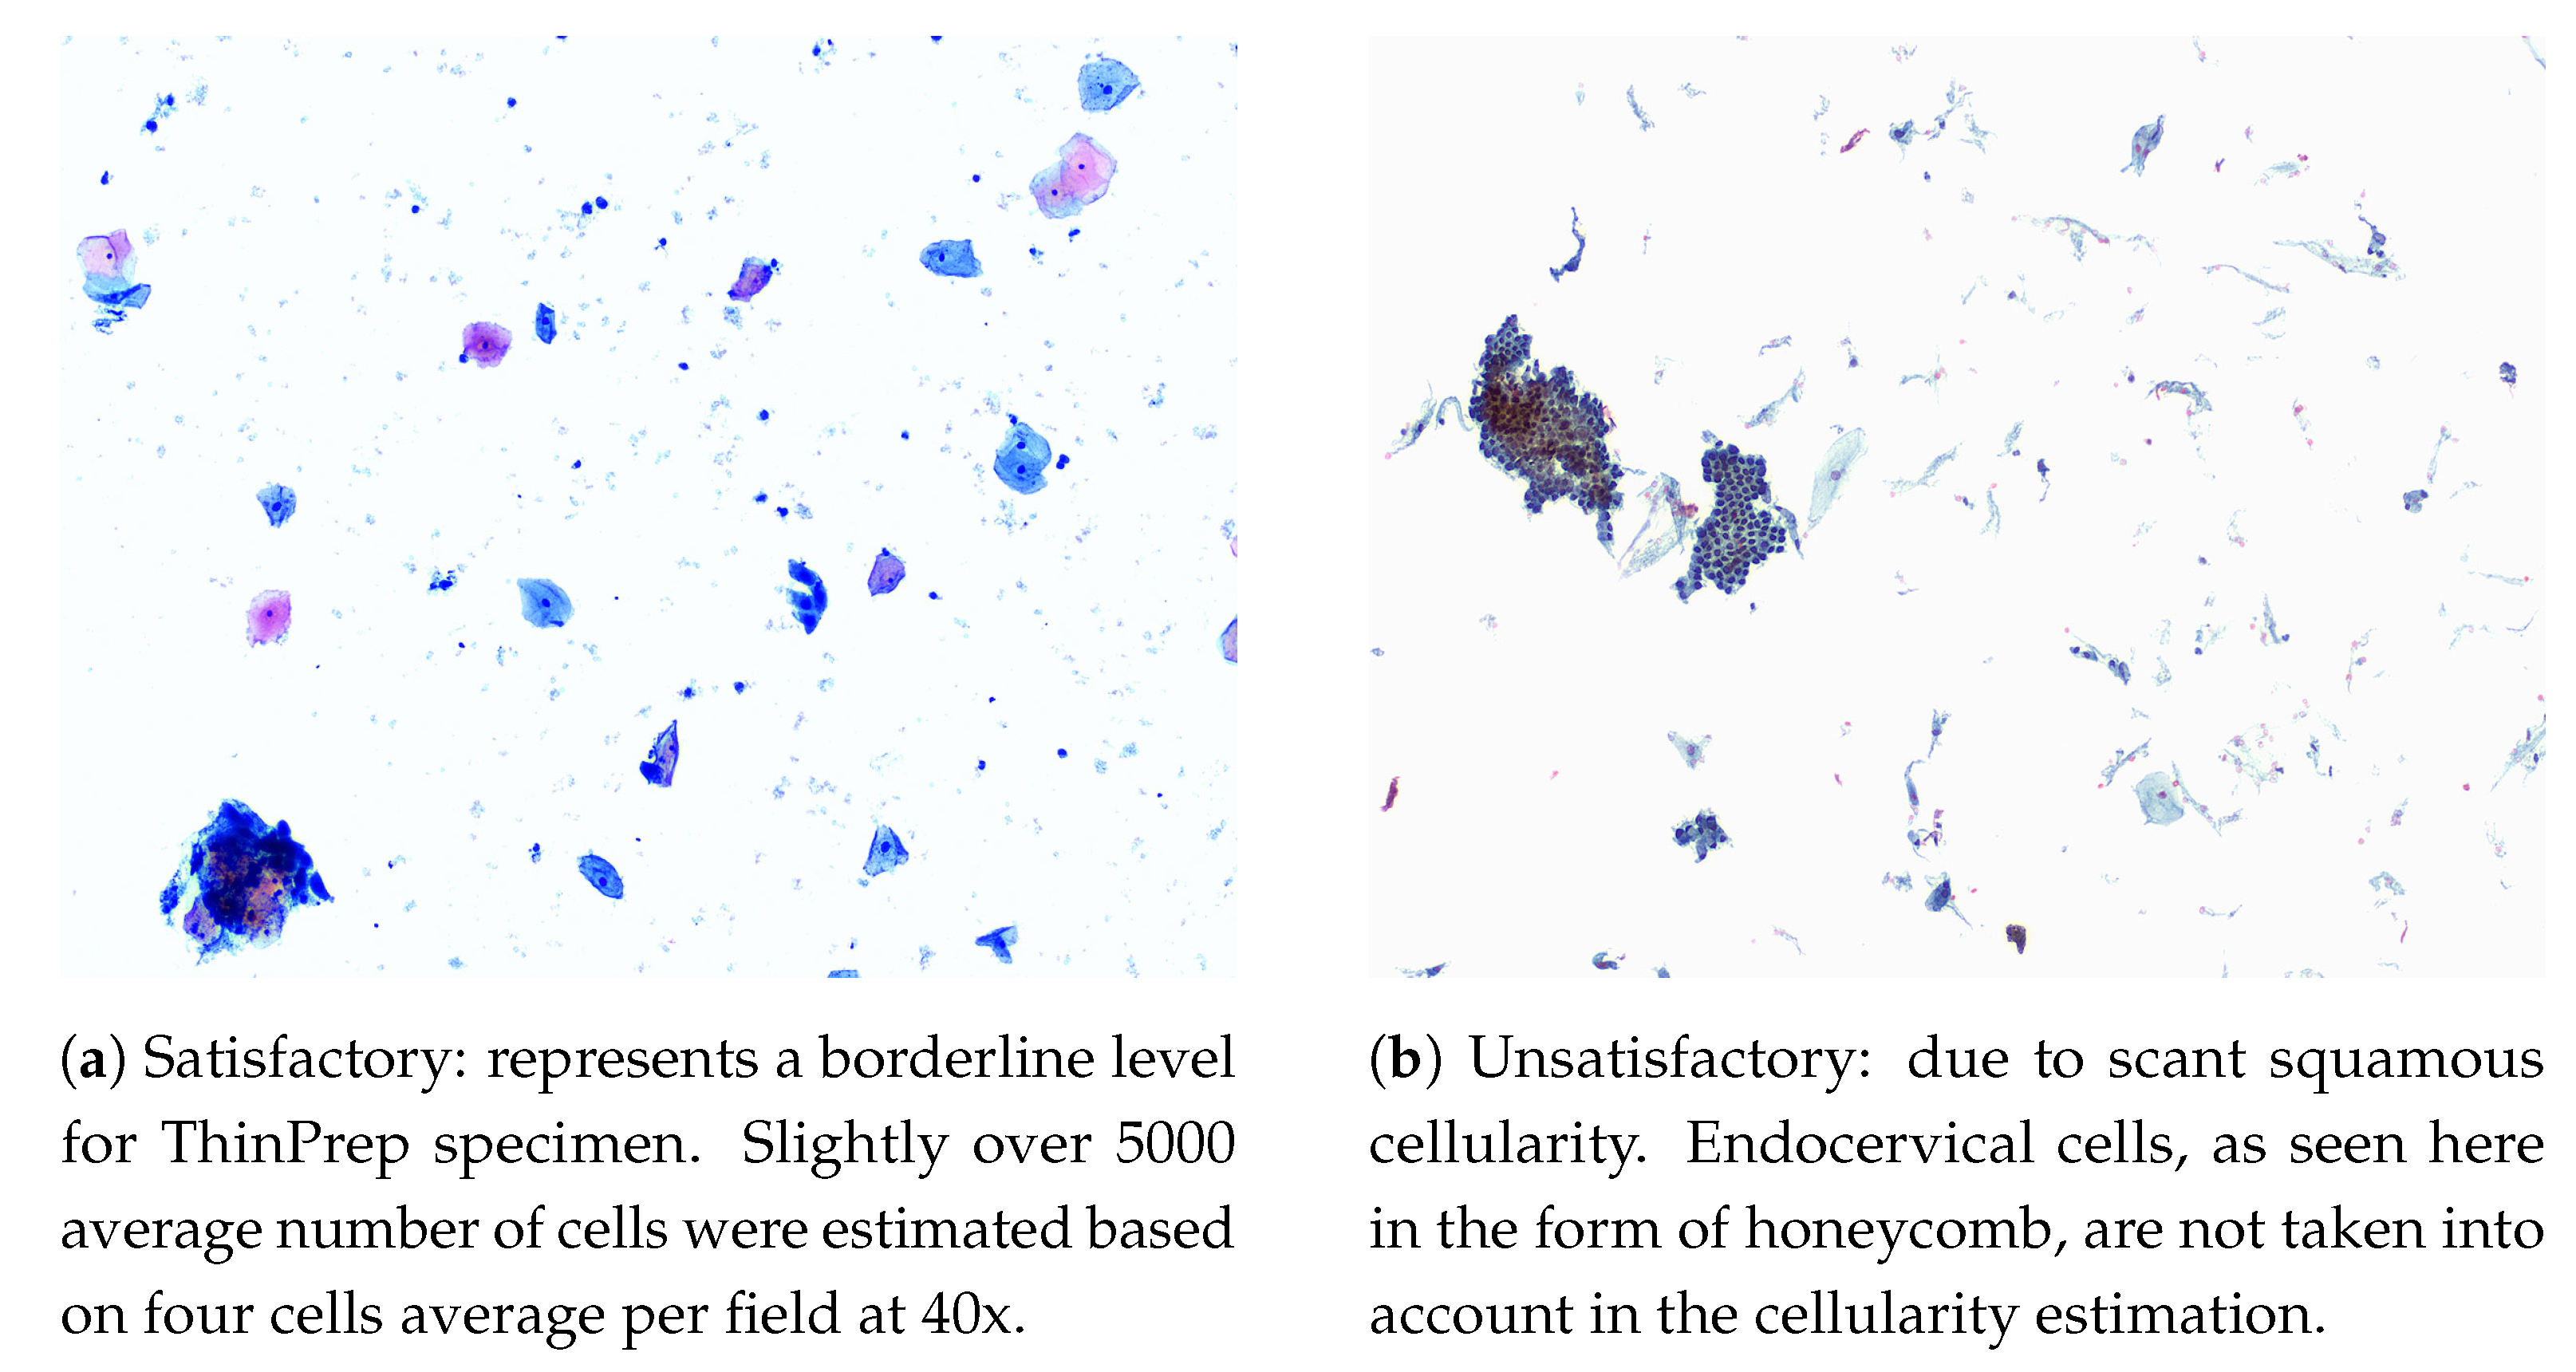
- Cellularity: a minimum of 5000 squamous cells on LBC and 8000–12,000 on CPS (Endocervical cells are not counted for this purpose). Examples of cellularity assessment are given in Figure 1.
- Obscuring Factors: unsatisfactory if more than 75% of the sample is obscured by blood, inflammatory cells, exudates or other artifacts.
- Evidence of Transformation Zone: 10 well-preserved endocervical cells or squamous metaplastic cells. Although this is an optional adequacy criterion, it is often included in reports.
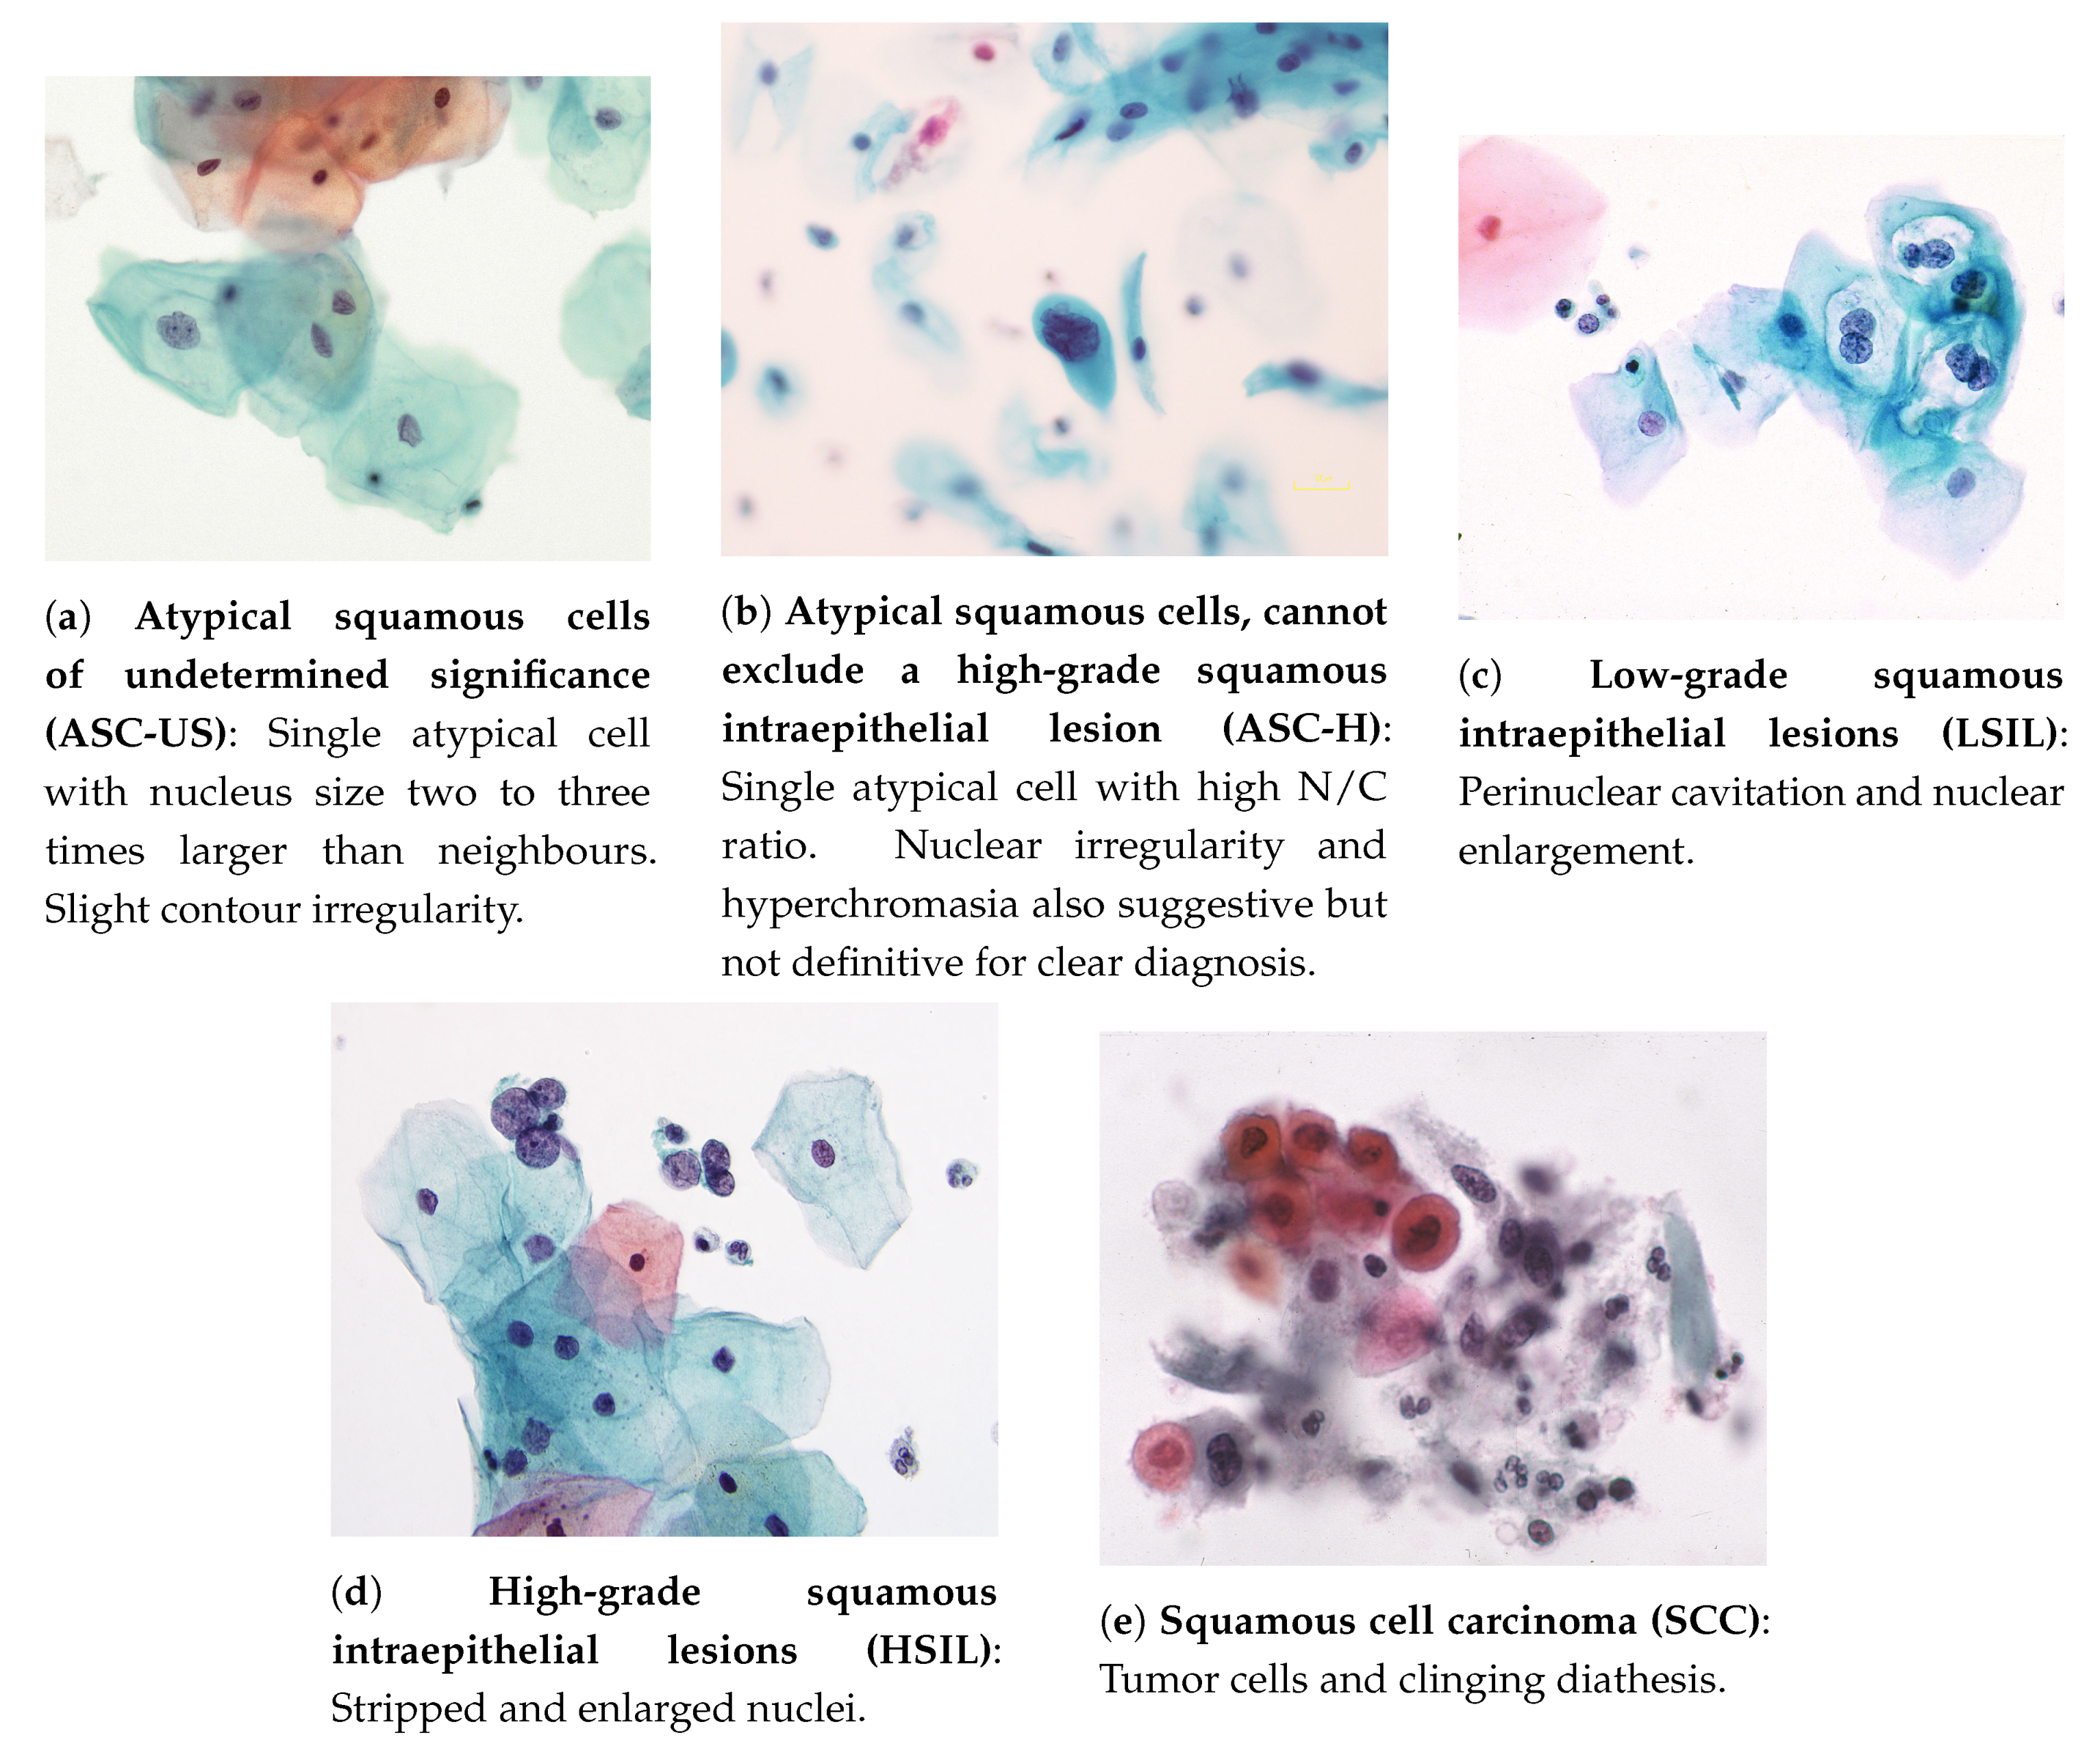
- Atypical squamous cells of undetermined significance (ASC-US): these cells are suggestive of low-grade squamous intraepithelial lesions (LSILs) and present a nucleus of approximately 2.5 to three times the area of a normal intermediate squamous cell nucleus (approximately 35 mm) or twice the size of a squamous metaplastic cell nucleus (approximately 50 m) [26]. Example in Figure 2a.
- Atypical squamous cells, cannot exclude a high-grade squamous intraepithelial lesion (ASC-H): An interpretation of ASC-H is appropriate when atypical cells are undoubtedly present, but a clear distinction between high-grade squamous intraepithelial lesions (HSILs) or carcinoma is not viable. Example in Figure 2b.
- Low-grade squamous intraepithelial lesions (LSILs): to interpret a cell as a LSIL, nuclear abnormalities must be found. Characteristics of LSILs usually include nuclear enlargement, hyperchromasia (may be less evident in liquid-based samples), overall large cell size, “smudged” nuclear chromatin, well-defined cytoplasm, and multinucleation. Additional features of LSILs may, but are not required to, include perinuclear cavitation, a sharply defined perinuclear cavity, or condensation of cytoplasm around the periphery [26]. Example in Figure 2c.
- High-grade squamous intraepithelial lesions (HSILs): refers to cervical abnormalities that have a high likelihood of progressing to cancer if not treated [3]. The cells of HSILs are smaller than LSILs, showing less cytoplasmic maturity (see image below), and often contain quite small basal-type cells. Example in Figure 2d.
- Squamous cell carcinoma (SCC): the most prevalent malignant neoplasm of the uterine cervix, being defined as an invasive epithelial tumor composed of squamous cells of varying degrees of differentiation [29]. Commonly, a carcinoma appears as an isolated single cell, having notorious variations both in cellular size, shape, nucleus, and with possible irregular membranes [26]. Example in Figure 2e.
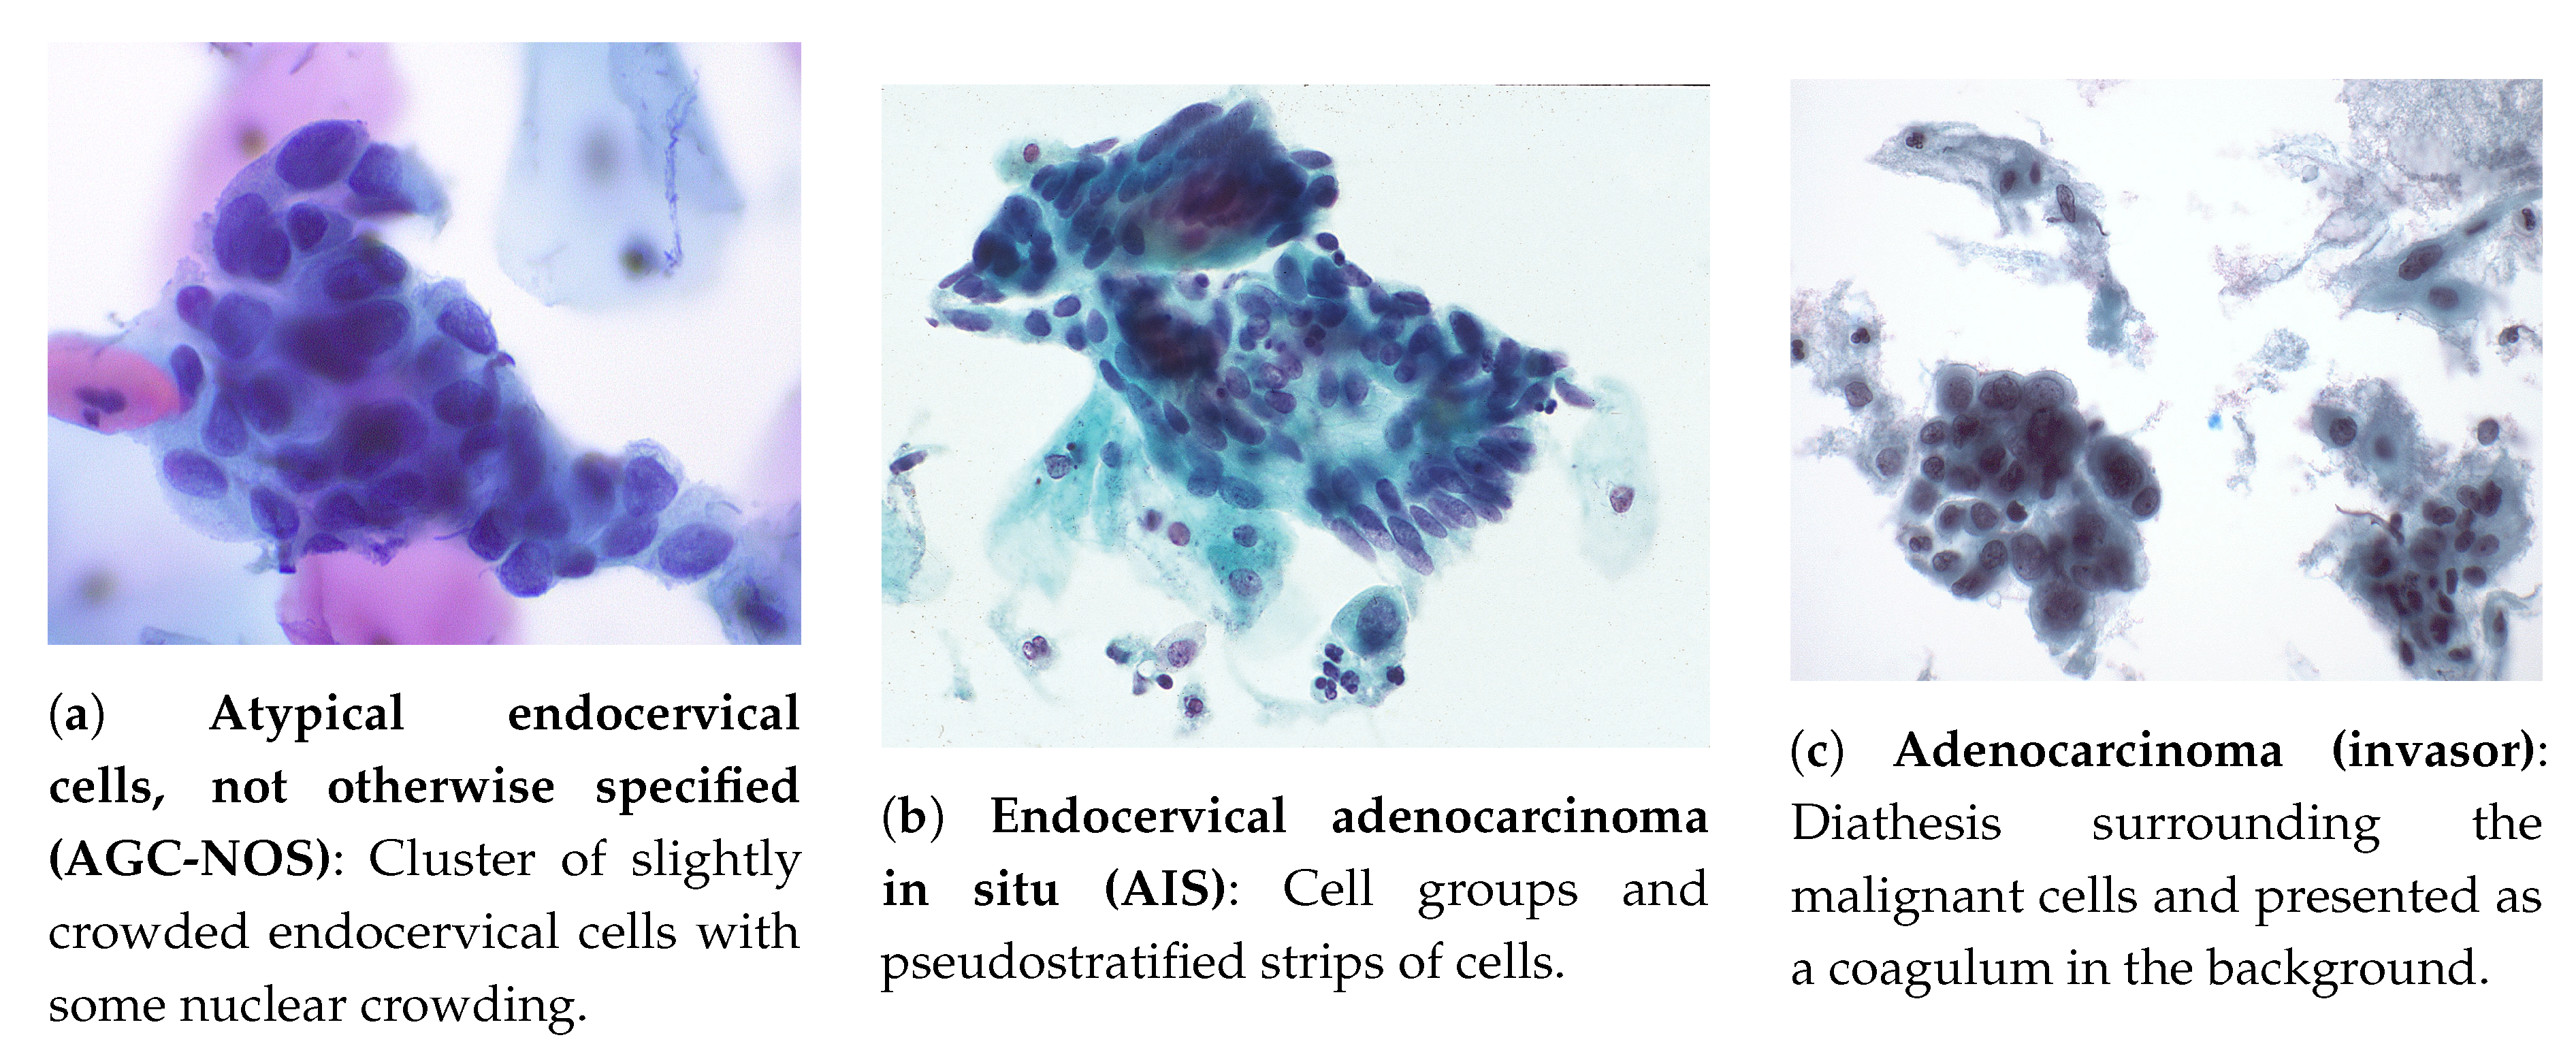
- Atypical endocervical cells, not otherwise specified (AGC-NOS): occurrence in sheets and strips with some cell crowding, nuclear overlap, and/or pseudo stratification, nuclear enlargement, up to three to five times the area of normal endocervical nuclei, variation in nuclear size and shape, mild nuclear hyperchromasia, cell groups with rosettes (gland formations) or feathering (second image, second column) or small groups, usually five to ten cells per group (third image, second column) [26]. Example in Figure 3a.
- Atypical glandular cells, favor neoplastic: cell morphology practically suggests an interpretation of endocervical adenocarcinoma in situ or invasive carcinoma, but is not likewise enough to classify it that way. The criteria comprise the occurrence of abnormal cells in sheets and strips with nuclear crowding, overlap and/or pseudo stratification, rare cell groups with rosettes or feathering, among other characteristics [26].
- Endocervical adenocarcinoma in situ (AIS): represents for glandular abnormalities the same as HSILs to squamous cells and is considered the precursor of invasive endocervical adenocarcinoma. It consists of a non-invasive high-grade endocervical glandular lesion, characterized by nuclear enlargement, hyperchromasia, chromatin abnormality, pseudo-stratification, and mitotic activity [26]. Example in Figure 3b.
- Adenocarcinoma (invasor): cytologic criteria matches those identified for AIS, but may contemplate additional signs of invasion [26]: (i) abundant abnormal cells, typically with columnar configuration; (ii) enlarged, pleomorphic nuclei; (iii) irregular chromatin distribution, chromatin clearing, and nuclear membrane irregularities; (iv) single cells, two-dimensional sheets or three-dimensional clusters, and syncytial aggregates; (v) cytoplasm is usually finely vacuolated; (vi) necrotic tumor diathesis (Tumor diathesis is a host response to tissue destruction by infiltrative growth of cancer [30], consisting of granular proteinaceous precipitates on slide surface of cytologic smears [31]) is common. Example in Figure 3c.
3.3. Datasets
3.4. Computer-Aided Commercial Systems for Cervical Cancer Screening
4. Literature Review on Computational Approaches for Cervical Cytology
4.1. Focus Assessment
4.2. Adequacy Assessment
4.3. Segmentation
Overlapping Cells
4.4. Classification
4.4.1. Feature-Based Classification
Cellular Features
Classification Algorithms
4.4.2. Deep Learning Classification
4.4.3. Binary vs. Multi-Class
4.4.4. Multimodal Classification
5. Discussion
5.1. Segmentation
5.2. Classification
6. Conclusions and Considerations for Next Generation of CADx Systems
6.1. Adequacy Assessment
6.2. Segmentation
6.3. Classification
Funding
Conflicts of Interest
References
- WHO, World Health Organization. WHO|Cervical Cancer. Available online: http://www.who.int/cancer/prevention/diagnosis-screening/cervical-cancer/en/ (accessed on 17 September 2019).
- WHO, World Health Organization. Human Papillomavirus (HPV) and Cervical Cancer, Fact Sheet. Available online: https://www.who.int/news-room/fact-sheets/detail/human-papillomavirus-(hpv)-and-cervical-cancer (accessed on 17 September 2019).
- World Health Organization. Comprehensive Cervical Cancer Control: A Guide to Essential Practice, 2nd ed.; World Health Organization: Geneva, Switzerland, 2014. [Google Scholar]
- National Cancer Institute. Cervical Cancer-Cancer Stat Facts. 2018. Available online: https://seer.cancer.gov/statfacts/html/cervix.html (accessed on 5 February 2019).
- World Health Organization. Human papillomavirus vaccines: WHO position paper. Wkl. Epidemiol. Rec. 2014, 89, 465–492. [Google Scholar] [CrossRef]
- National Cancer Institute. Cervical Cancer Treatment. 2018. Available online: https://www.cancer.gov/types/cervical/patient/cervical-treatment-pdq (accessed on 12 December 2018).
- National Cancer Institute. Pap and HPV Testing. 2018. Available online: https://www.cancer.gov/types/cervical/pap-hpv-testing-fact-sheet (accessed on 12 December 2018).
- Marth, C.; Landoni, F.; Mahner, S.; McCormack, M.; Gonzalez-Martin, A.; Colombo, N. Cervical cancer: ESMO Clinical Practice Guidelines for diagnosis, treatment and follow-up. Ann. Oncol. 2017, 28, iv72–iv83. [Google Scholar] [CrossRef] [PubMed]
- Cancer Research UK. Types and grades|Cervical cancer|Cancer Research UK. 2017. Available online: https://www.cancerresearchuk.org/about-cancer/cervical-cancer/stages-types-grades/types-and-grades (accessed on 7 January 2018).
- Clifford, G.M.; Smith, J.S.; Plummer, M.; Muñoz, N.; Franceschi, S. Human papillomavirus types in invasive cervical cancer worldwide: a meta-analysis. Br. J. Cancer 2003, 88, 63–73. [Google Scholar] [CrossRef] [PubMed]
- Green, J.; Berrington de Gonzalez, A.; Sweetland, S.; Beral, V.; Chilvers, C.; Crossley, B.; Deacon, J.; Hermon, C.; Jha, P.; Mant, D.; et al. Risk factors for adenocarcinoma and squamous cell carcinoma of the cervix in women aged 20–44 years: the UK National Case–Control Study of Cervical Cancer. Br. J. Cancer 2003, 89, 2078–2086. [Google Scholar] [CrossRef] [PubMed]
- Jhingran, A.; Russell, A.H.; Seiden, M.V.; Duska, L.R.; Goodman, A.K.; Lee, S.I.; Digumarthy, S.R.; Fuller, A.F. Cancers of the Cervix, Vulva, and Vagina. In Abeloff’s Clinical Oncology, 5th ed.; Elsevier Inc.: Amsterdam, The Netherlands, 2013; pp. 1534–1574.e8. [Google Scholar]
- Banik, U.; Bhattacharjee, P.; Ahamad, S.U.; Rahman, Z. Pattern of epithelial cell abnormality in Pap smear: A clinicopathological and demographic correlation. Cytojournal 2011, 8. [Google Scholar] [CrossRef]
- Naucler, P.; Ryd, W.; Törnberg, S.; Strand, A.; Wadell, G.; Elfgren, K.; R\a adberg, T.; Strander, B.; Johansson, B.; Forslund, O. Human papillomavirus and Papanicolaou tests to screen for cervical cancer. N. Engl. J. Med. 2007, 357, 1589–1597. [Google Scholar] [CrossRef]
- Cancer Research UK. Cervical Cancer: About Cervical Screening. 2017. Available online: https://www.cancerresearchuk.org/about-cancer/cervical-cancer/getting-diagnosed/screening/about (accessed on 7 January 2019).
- Huy, N.V.Q.; Tam, L.M.; Tram, N.V.Q.; Thuan, D.C.; Vinh, T.Q.; Thanh, C.N.; Chuang, L. The value of visual inspection with acetic acid and Pap smear in cervical cancer screening program in low resource settings—A population-based study. Gynecol. Oncol. Rep. 2018, 24, 18–20. [Google Scholar] [CrossRef]
- World Health Organization and International Agency for Research on Cancer. Prevention of Cervical Cancer through Screening Using Visual Inspection with Acetic Acid (VIA) and Treatment with Cryotherapy. A Demonstration project in six African Countries: Malawi, Madagascar, Nigeria, Uganda, the United Republic of Tanzania, and Zambia; World Health Organization: Geneva, Switzerland, 2012. [Google Scholar]
- Haghighi, F.; Ghanbarzadeh, N.; Ataee, M.; Sharifzadeh, G.; Mojarrad, J.S.; Najafi-Semnani, F. A comparison of liquid-based cytology with conventional Papanicolaou smears in cervical dysplasia diagnosis. Adv. Biomed. Res. 2016, 5. [Google Scholar] [CrossRef]
- Qureshi, S.; Singh, U.; Foruin, S.; Negi, N.; Agarwal, G.; Singh, N. Liquid-based Cytology vs Conventional Cytology as a Screening Tool for Cervical Cancer in Postmenopausal Women. J. South Asian Fed. Obstet. Gynaecol. (SAFOG) 2017, 2, 5. [Google Scholar]
- Singh, V.B.; Gupta, N.; Nijhawan, R.; Srinivasan, R.; Suri, V.; Rajwanshi, A. Liquid-based cytology versus conventional cytology for evaluation of cervical Pap smears: Experience from the first 1000 split samples. Indian J. Pathol. Microbiol. 2015, 58, 17. [Google Scholar] [CrossRef]
- Nishio, H.; Iwata, T.; Nomura, H.; Morisada, T.; Takeshima, N.; Takano, H.; Sasaki, H.; Nakatani, E.; Teramukai, S.; Aoki, D. Liquid-based cytology versus conventional cytology for detection of uterine cervical lesions: A prospective observational study. Jpn. J. Clin. Oncol. 2018, 48, 522–528. [Google Scholar] [CrossRef] [PubMed]
- Pankaj, S.; Nazneen, S.; Kumari, S.; Kumari, A.; Kumari, A.; Kumari, J.; Choudhary, V.; Kumar, S. Comparison of conventional Pap smear and liquid-based cytology: A study of cervical cancer screening at a tertiary care center in Bihar. Indian J. Cancer 2018, 55, 80. [Google Scholar] [CrossRef] [PubMed]
- Padubidri, V.; Daftary, S. Shaw’s Textbook of Gynaecology, 16th ed.; Elsevier: Mumbai, India, 2015. [Google Scholar]
- Chrysostomou, A.C.; Stylianou, D.C.; Constantinidou, A.; Kostrikis, L.G. Cervical Cancer Screening Programs in Europe: The Transition Towards HPV Vaccination and Population-Based HPV Testing. Viruses 2018, 10, 729. [Google Scholar] [CrossRef] [PubMed]
- Smith, R.A.; Andrews, K.S.; Brooks, D.; Fedewa, S.A.; Manassaram-Baptiste, D.; Saslow, D.; Brawley, O.W.; Wender, R.C. Cancer screening in the United States, 2018: A review of current American Cancer Society guidelines and current issues in cancer screening. CA Cancer J. Clin. 2018, 68, 297–316. [Google Scholar] [CrossRef] [PubMed]
- Nayar, R.; Wilbur, D. The Bethesda System for Reporting Cervical Cytology: Definitions, Criteria, and Explanatory Notes, 3rd ed.; Springer International Publishing: Berlin, Germany, 2015. [Google Scholar]
- Richart, R. Natural history of cervical intraepithelial neoplasia. Clin. Obstet. Gynecol. 1967, 10, 748–784. [Google Scholar] [CrossRef]
- Nayar, R.; Wilbur, D.C. The Pap Test and Bethesda 2014. Acta Cytol. 2015, 59, 121–132. [Google Scholar] [CrossRef]
- Kurman, R.; Carcangiu, M.; Herrington, C.; Young, R. WHO Classification of Tumours of Female Reproductive Organs, 4th ed.; International Agency for Research on Cancer (IARC): Lyon, France, 2014; Volume 6. [Google Scholar]
- Cho, J.S.; Park, J.S.; Kim, H.S. Analysis for the Presence of Tumor Diathesis in Cervicovaginal Smears. Korean Soc. Clin. Lab. Sci. 2001, 33, 245–250. [Google Scholar]
- Izadi-Mood, N.; Sarmadi, S.; Sadidi, H. Frequency of Tumor Diathesis in Pap Smears of Women with Carcinoma of Uterine Cervix in Women Hospital (1995–2003). Iran. J. Pathol. 2014, 9, 263–267. [Google Scholar]
- Jantzen, J.; Norup, J.; Dounias, G.; Beth, B. Pap-smear Benchmark Data for Pattern Classification. Nat. Inspir. Smart Inf. Syst. (NiSIS 2005) 2005, 1–9. Available online: https://www.researchgate.net/profile/Jan_Jantzen/publication/265873515_Pap-smear_Benchmark_Data_For_Pattern_Classification/links/551af0090cf2fdce84383bdb.pdf (accessed on 15 October 2019).
- Lu, Z.; Carneiro, G.; Bradley, A.P. An Improved Joint Optimization of Multiple Level Set Functions for the Segmentation of Overlapping Cervical Cells. IEEE Trans. Image Process. 2015, 24, 1261–1272. [Google Scholar] [CrossRef]
- Lu, Z.; Carneiro, G.; Bradley, A.P.; Ushizima, D.; Nosrati, M.S.; Bianchi, A.G.C.; Carneiro, C.M.; Hamarneh, G. Evaluation of Three Algorithms for the Segmentation of Overlapping Cervical Cells. IEEE J. Biomed. Health Inf. 2017, 21, 441–450. [Google Scholar] [CrossRef] [PubMed]
- Bradley, A.P.; Bamford, P.C. A One-pass Extended Depth of Field Algorithm Based on the Over-complete Discrete Wavelet Transform. Image Vis. Comput. 2004, 279–284. Available online: https://www.researchgate.net/profile/Andrew_Bradley/publication/37618354_A_One-Pass_Extended_Depth_of_Field_Algorithm_Based_on_the_Over-Complete_Discrete_Wavelet_Transform/links/00463519ab92ca0e95000000.pdf (accessed on 15 October 2019).
- Phoulady, H.A.; Mouton, P.R. A New Cervical Cytology Dataset for Nucleus Detection and Image Classification (Cervix93) and Methods for Cervical Nucleus Detection. arXiv 2018, arXiv:1811.09651. [Google Scholar]
- Fernandes, K.; Cardoso, J.S.; Fernandes, J. Transfer Learning with Partial Observability Applied to Cervical Cancer Screening; Pattern Recognition and Image Analysis; Lecture Notes in Computer Science; Springer International Publishing: Berlin, Germany, 2017; pp. 243–250. [Google Scholar]
- Fernandes, K.; Cardoso, J.S.; Fernandes, J. UCI Machine Learning Repository: Cervical cancer (Risk Factors) Data Set. 2017. Available online: https://archive.ics.uci.edu/ml/datasets/Cervical+cancer+(Risk+Factors) (accessed on 14 October 2019).
- Jusman, Y.; Ng, S.C.; Abu Osman, N.A. Intelligent Screening Systems for Cervical Cancer. Sci. World J. 2014. [Google Scholar] [CrossRef] [PubMed]
- Pantanowitz, L.; Hornish, M.; Goulart, R.A. The impact of digital imaging in the field of cytopathology. CytoJournal 2009, 6, 6. [Google Scholar] [CrossRef]
- Biscotti, C.V.; Dawson, A.E.; Dziura, B.; Galup, L.; Darragh, T.; Rahemtulla, A.; Wills-Frank, L. Assisted primary screening using the automated ThinPrep Imaging System. Am. J. Clin. Pathol. 2005, 123, 281–287. [Google Scholar] [CrossRef]
- Roberts, J.M.; Thurloe, J.K.; Bowditch, R.C.; Hyne, S.G.; Greenberg, M.; Clarke, J.M.; Biro, C. A three-armed trial of the ThinPrep Imaging System. Diagn. Cytopathol. 2007, 35, 96–102. [Google Scholar] [CrossRef]
- Schledermann, D.; Hyldebrandt, T.; Ejersbo, D.; Hoelund, B. Automated screening versus manual screening: A comparison of the ThinPrep® imaging system and manual screening in a time study. Diagn. Cytopathol. 2007, 35, 348–352. [Google Scholar] [CrossRef]
- Halford, J.A.; Batty, T.; Boost, T.; Duhig, J.; Hall, J.; Lee, C.; Walker, K. Comparison of the sensitivity of conventional cytology and the ThinPrep Imaging System for 1,083 biopsy confirmed high-grade squamous lesions. Diagn. Cytopathol. 2010, 38, 318–326. [Google Scholar] [CrossRef]
- Ling Yeong, M.; Pringle, E.; Stewart, J.; Retter, E. A comparison of ThinPrep Imager-assisted with manual screening, and its place in the New Zealand cervical cancer screening program. Pathology 2013, 45, 474–477. [Google Scholar] [CrossRef]
- Kitchener, H.; Blanks, R.; Cubie, H.; Desai, M.; Dunn, G.; Legood, R.; Gray, A.; Sadique, Z.; Moss, S.; Group, M.T.S.; et al. MAVARIC—A comparison of automation-assisted and manual cervical screening: A randomised controlled trial. Health Technol. Assess. 2011, 16. [Google Scholar] [CrossRef]
- Wilbur, D.C.; Black-Schaffer, W.S.; Luff, R.D.; Abraham, K.P.; Kemper, C.; Molina, J.T.; Tench, W.D. The Becton Dickinson Focal Point GS Imaging System Clinical Trials Demonstrate Significantly Improved Sensitivity for the Detection of Important Cervical Lesions. Am. J. Clin. Pathol. 2009, 132, 767–775. [Google Scholar] [CrossRef] [PubMed]
- Bengtsson, E.; Malm, P. Screening for Cervical Cancer Using Automated Analysis of PAP-Smears. Comput. Math. Methods Med. 2014. [Google Scholar] [CrossRef] [PubMed]
- Berek, J.S.; Hacker, N.F. Practical Gynecologic Oncology; Lippincott Williams & Wilkins: Philadelphia, PA, USA, 2005. [Google Scholar]
- Guillaud, M.; Benedet, J.L.; Cantor, S.B.; Staerkel, G.; Follen, M.; MacAulay, C. DNA ploidy compared with human papilloma virus testing (Hybrid Capture II) and conventional cervical cytology as a primary screening test for cervical high-grade lesions and cancer in 1555 patients with biopsy confirmation. Cancer 2006, 107, 309–318. [Google Scholar] [CrossRef] [PubMed]
- Sun, X.R.; Wang, J.; Garner, D.; Palcic, B. Detection of Cervical Cancer and High Grade Neoplastic Lesions by a Combination of Liquid-Based Sampling Preparation and DNA Measurements Using Automated Image Cytometry. Cell. Oncol. 2005, 27, 33–41. [Google Scholar] [CrossRef]
- Zahniser, D.J.; Wong, K.L.; Brenner, J.F.; Ball, H.G.; Garcia, G.L.; Hutchinson, M.L. Contextual analysis and intermediate cell markers enhance high-resolution cell image analysis for automated cervical smear diagnosis. Cytometry 1991, 12, 10–14. [Google Scholar] [CrossRef]
- Redondo, R.; Cristobal, G.; Deniz, O.; Garcia-rojo, M.; Bueno, G.; Valdiviezo, J.C.; Nava, R.; Cristóbal, G.; Salido, J.; Fernández, M.D.M.; et al. Autofocus evaluation for brightfield microscopy pathology. J. Biomed. Opt. 2012, 17, 036008. [Google Scholar] [CrossRef]
- Zhang, L.; Kong, H.; Chin, C.T.; Liu, S.; Fan, X.; Wang, T.; Chen, S. Automation-assisted cervical cancer screening in manual liquid-based cytology with hematoxylin and eosin staining. Cytom. Part A 2014, 85, 214–230. [Google Scholar] [CrossRef]
- Liu, X.Y.; Wang, W.H.; Sun, Y. Autofocusing for Automated Microscopic Evaluation of Blood Smear and Pap Smear. In Proceedings of the 2006 International Conference of the IEEE Engineering in Medicine and Biology Society, New York, NY, USA, 30 August–3 September 2006; pp. 4718–4721. [Google Scholar] [CrossRef]
- Carpenter, A.E.; Jones, T.R.; Lamprecht, M.R.; Clarke, C.; Kang, I.H.; Friman, O.; Guertin, D.A.; Chang, J.H.; Lindquist, R.A.; Moffat, J.; et al. CellProfiler: Image analysis software for identifying and quantifying cell phenotypes. Gen. Biol. 2006, 7, R100. [Google Scholar] [CrossRef]
- Bankhead, P.; Loughrey, M.B.; Fernández, J.A.; Dombrowski, Y.; McArt, D.G.; Dunne, P.D.; McQuaid, S.; Gray, R.T.; Murray, L.J.; Coleman, H.G.; et al. QuPath: Open source software for digital pathology image analysis. Sci. Rep. 2017, 7, 16878. [Google Scholar] [CrossRef]
- Rueden, C.T.; Schindelin, J.; Hiner, M.C.; DeZonia, B.E.; Walter, A.E.; Arena, E.T.; Eliceiri, K.W. ImageJ2: ImageJ for the next generation of scientific image data. BMC Bioinf. 2017, 18, 529. [Google Scholar] [CrossRef] [PubMed]
- Schneider, C.A.; Rasband, W.S.; Eliceiri, K.W. NIH Image to ImageJ: 25 years of image analysis. Nat. Methods 2012, 9, 671–675. [Google Scholar] [CrossRef] [PubMed]
- Riana, D.; Plissiti, M.E.; Nikou, C.; Widyantoro, D.H.; Mengko, T.L.R.; Kalsoem, O. Inflammatory cell extraction and nuclei detection in Pap smear images. Int. J. E-Health Med. Commun. (IJEHMC) 2015, 6, 27–43. [Google Scholar] [CrossRef]
- Riana, D.; Widyantoro, D.H.; Mengko, T.L. Extraction and classification texture of inflammatory cells and nuclei in normal pap smear images. In Proceedings of the 2015 4th International Conference on Instrumentation, Communications, Information Technology, and Biomedical Engineering (ICICI-BME), Bandung, Indonesia, 2–3 November 2015; pp. 65–69. [Google Scholar]
- Muhimmah, I.; Kurniawan, R.; Indrayanti. Analysis of features to distinguish epithelial cells and inflammatory cells in Pap smear images. In Proceedings of the 2013 6th International Conference on Biomedical Engineering and Informatics, Hangzhou, China, 16–18 December 2013; pp. 519–523. [Google Scholar] [CrossRef]
- Malm, P.; Balakrishnan, B.N.; Sujathan, V.K.; Kumar, R.; Bengtsson, E. Debris removal in Pap-smear images. Comput. Methods Progr. Biomed. 2013, 111, 128–138. [Google Scholar] [CrossRef] [PubMed]
- Kumar, R.R.; Kumar, V.A.; Kumar, P.S.; Sudhamony, S.; Ravindrakumar, R. Detection and removal of artifacts in cervical cytology images using support vector machine. In Proceedings of the 2011 IEEE International Symposium on IT in Medicine and Education, Cuangzhou, China, 9–11 December 2011; Volume 1, pp. 717–721. [Google Scholar]
- Plissiti, M.E.; Nikou, C.; Charchanti, A. Automated Detection of Cell Nuclei in Pap Smear Images Using Morphological Reconstruction and Clustering. IEEE Trans. Inf. Technol. Biomed. 2011, 15, 233–241. [Google Scholar] [CrossRef]
- van der Laak, J.A.W.M.; Siebers, A.G.; Cuijpers, V.M.J.I.; Pahlplatz, M.M.M.; de Wilde, P.C.M.; Hanselaar, A.G.J.M. Automated identification of diploid reference cells in cervical smears using image analysis. Cytometry 2002, 47, 256–264. [Google Scholar] [CrossRef]
- Medical Services Advisory Committee. Automation-Assisted and Liquid-Based Cytology for Cervical Cancer Screening: Assessment Report; Federal Department of Health and Ageing: Canberra, Australia, 2009. [Google Scholar]
- Cahn, R.L.; Poulsen, R.S.; Toussaint, G. Segmentation of cervical cell images. J. Histochem. Cytochem. 1977, 25, 681–688. [Google Scholar] [CrossRef]
- Borst, H.; Abmayr, W.; Gais, P. A thresholding method for automatic cell image segmentation. J. Histochem. Cytochem. 1979, 27, 180–187. [Google Scholar] [CrossRef]
- Chang, C.W.; Lin, M.Y.; Harn, H.J.; Harn, Y.C.; Chen, C.H.; Tsai, K.H.; Hwang, C.H. Automatic segmentation of abnormal cell nuclei from microscopic image analysis for cervical cancer screening. In Proceedings of the 2009 IEEE 3rd International Conference on Nano/Molecular Medicine and Engineering, Tainan, Taiwan, 18–21 October 2009; pp. 77–80. [Google Scholar] [CrossRef]
- Kim, K.B.; Song, D.H.; Woo, Y.W. Nucleus Segmentation and Recognition of Uterine Cervical Pap-Smears. Rough Sets, Fuzzy Sets, Data Mining and Granular Computing; Lecture Notes in Computer Science; An, A., Stefanowski, J., Ramanna, S., Butz, C.J., Pedrycz, W., Wang, G., Eds.; Springer: Berlin/Heidelberg, Germany, 2007; pp. 153–160. [Google Scholar]
- Wu, H.S.; Gil, J.; Barba, J. Optimal segmentation of cell images. IEE Proc. Vis. Image Signal Process. 1998, 145, 50–56. [Google Scholar] [CrossRef]
- Plissiti, M.E.; Nikou, C.; Charchanti, A. Combining shape, texture and intensity features for cell nuclei extraction in Pap smear images. Pattern Recognit. Lett. 2011, 32, 838–853. [Google Scholar] [CrossRef]
- Gençtav, A.; Aksoy, S.; Önder, S. Unsupervised segmentation and classification of cervical cell images. Pattern Recognit. 2012, 45, 4151–4168. [Google Scholar] [CrossRef]
- Tareef, A.; Song, Y.; Huang, H.; Feng, D.; Chen, M.; Wang, Y.; Cai, W. Multi-pass fast watershed for accurate segmentation of overlapping cervical cells. IEEE Trans. Med. Imaging 2018, 37, 2044–2059. [Google Scholar] [CrossRef] [PubMed]
- Bamford, P.; Lovell, B. Unsupervised cell nucleus segmentation with active contours. Signal Process. 1998, 71, 203–213. [Google Scholar] [CrossRef]
- Li, K.; Lu, Z.; Liu, W.; Yin, J. Cytoplasm and nucleus segmentation in cervical smear images using Radiating GVF Snake. Pattern Recognit. 2012, 45, 1255–1264. [Google Scholar] [CrossRef]
- Plissiti, M.E.; Nikou, C. Cervical cell classification based exclusively on nucleus features. In International Conference Image Analysis and Recognition; Springer: Berlin, Germany, 2012; pp. 483–490. [Google Scholar]
- Lu, Z.; Carneiro, G.; Bradley, A.P. Automated nucleus and cytoplasm segmentation of overlapping cervical cells. In International Conference on Medical Image Computing and Computer-Assisted Intervention; Springer: Berlin, Germany, 2013; pp. 452–460. [Google Scholar]
- Nosrati, M.S.; Hamarneh, G. Segmentation of overlapping cervical cells: A variational method with star-shape prior. In Proceedings of the 2015 IEEE 12th International Symposium on Biomedical Imaging (ISBI), New York, NY, USA, 16–19 April 2015; pp. 186–189. [Google Scholar]
- Ushizima, D.M.; Bianchi, A.G.; Carneiro, C.M. Segmentation of Subcellular Compartments Combining Superpixel Representation with Voronoi Diagrams; Technical Report; Lawrence Berkeley National Lab. (LBNL): Berkeley, CA, USA, 2015; 3p. [Google Scholar]
- Zhang, L.; Kong, H.; Chin, C.T.; Liu, S.; Chen, Z.; Wang, T.; Chen, S. Segmentation of cytoplasm and nuclei of abnormal cells in cervical cytology using global and local graph cuts. Comput. Med. Imaging Gr. 2014, 38, 369–380. [Google Scholar] [CrossRef]
- Phoulady, H.A.; Goldgof, D.B.; Hall, L.O.; Mouton, P.R. An Approach for Overlapping Cell Segmentation in Multi-Layer Cervical Cell Volumes. 2015. Available online: https://pdfs.semanticscholar.org/5a40/8292d67224d86810b225a2844b4cdbec0e12.pdf (accessed on 15 October 2019).
- Phoulady, H.A.; Goldgof, D.B.; Hall, L.O.; Mouton, P.R. A new approach to detect and segment overlapping cells in multi-layer cervical cell volume images. In Proceedings of the 2016 IEEE 13th International Symposium on Biomedical Imaging (ISBI), Prague, Czech Republic, 13–16 April 2016; pp. 201–204. [Google Scholar]
- Phoulady, H.A.; Goldgof, D.; Hall, L.O.; Mouton, P.R. A framework for nucleus and overlapping cytoplasm segmentation in cervical cytology extended depth of field and volume images. Comput. Med. Imaging Gr. 2017, 59, 38–49. [Google Scholar] [CrossRef]
- Tareef, A.; Song, Y.; Cai, W.; Feng, D.D.; Chen, M. Automated three-stage nucleus and cytoplasm segmentation of overlapping cells. In Proceedings of the 2014 13th International Conference on Control Automation Robotics & Vision (ICARCV), Singapore, 10–12 December 2014; pp. 865–870. [Google Scholar]
- Zhao, L.; Li, K.; Wang, M.; Yin, J.; Zhu, E.; Wu, C.; Wang, S.; Zhu, C. Automatic cytoplasm and nuclei segmentation for color cervical smear image using an efficient gap-search MRF. Comput. Biol. Med. 2016, 71, 46–56. [Google Scholar] [CrossRef]
- Tareef, A.; Song, Y.; Cai, W.; Huang, H.; Chang, H.; Wang, Y.; Fulham, M.; Feng, D.; Chen, M. Automatic segmentation of overlapping cervical smear cells based on local distinctive features and guided shape deformation. Neurocomputing 2017, 221, 94–107. [Google Scholar] [CrossRef]
- Song, Y.; Zhang, L.; Chen, S.; Ni, D.; Li, B.; Zhou, Y.; Lei, B.; Wang, T. A deep learning based framework for accurate segmentation of cervical cytoplasm and nuclei. In Proceedings of the 2014 36th Annual International Conference of the IEEE Engineering in Medicine and Biology Society, Chicago, IL, USA, 26–30 August 2014; pp. 2903–2906. [Google Scholar]
- Song, Y.; Tan, E.L.; Jiang, X.; Cheng, J.Z.; Ni, D.; Chen, S.; Lei, B.; Wang, T. Accurate cervical cell segmentation from overlapping clumps in pap smear images. IEEE Trans. Med. Imaging 2017, 36, 288–300. [Google Scholar] [CrossRef]
- Gautam, S.; Jith, N.; Sao, A.K.; Bhavsar, A.; Natarajan, A. Considerations for a PAP Smear Image Analysis System with CNN Features. arXiv 2018, arXiv:1806.09025. [Google Scholar]
- Gautam, S.; Bhavsar, A.; Sao, A.K.; Harinarayan, K.K. CNN based segmentation of nuclei in PAP-smear images with selective pre-processing. Medical Imaging 2018: Digital Pathology. Int. Soc. Opt. Photon. 2018, 10581, 105810X. [Google Scholar] [CrossRef]
- Tareef, A.; Song, Y.; Huang, H.; Wang, Y.; Feng, D.; Chen, M.; Cai, W. Optimizing the cervix cytological examination based on deep learning and dynamic shape modeling. Neurocomputing 2017, 248, 28–40. [Google Scholar] [CrossRef]
- Bamford, S.; Lovell, B. A Water Immersion Algorithm for Cytological Image Segmentation. In Proceedings of the APRS Image Segmentation Workshop, Citeseer, Sydney, Australia, 27–28 December 1996; pp. 75–79. [Google Scholar]
- Kale, A.; Aksoy, S. Segmentation of Cervical Cell Images. In Proceedings of the 2010 20th International Conference on Pattern Recognition, IEEE Computer Society, Washington, DC, USA, 23–26 August 2010; pp. 2399–2402. [Google Scholar] [CrossRef]
- Malm, P.; Brun, A. Closing Curves with Riemannian Dilation: Application to Segmentation in Automated Cervical Cancer Screening. In Advances in Visual Computing; Lecture Notes in Computer Science; Springer: Berlin/Heidelberg, Germany, 2009; pp. 337–346. [Google Scholar]
- Tsai, M.H.; Chan, Y.K.; Lin, Z.Z.; Yang-Mao, S.F.; Huang, P.C. Nucleus and cytoplast contour detector of cervical smear image. Pattern Recognit. Lett. 2008, 29, 1441–1453. [Google Scholar] [CrossRef]
- Lin, C.H.; Chan, Y.K.; Chen, C.C. Detection and segmentation of cervical cell cytoplast and nucleus. Int. J. Imaging Syst. Technol. 2009, 19, 260–270. [Google Scholar] [CrossRef]
- Yang-Mao, S.; Chan, Y.; Chu, Y. Edge Enhancement Nucleus and Cytoplast Contour Detector of Cervical Smear Images. IEEE Trans. Syst. Man Cybern. Part B (Cybern.) 2008, 38, 353–366. [Google Scholar] [CrossRef]
- Chen, C.; Wang, W.; Ozolek, J.A.; Rohde, G.K. A flexible and robust approach for segmenting cell nuclei from 2D microscopy images using supervised learning and template matching. Cytom. Part A 2013, 83, 495–507. [Google Scholar] [CrossRef]
- Plissiti, M.E.; Nikou, C. Overlapping cell nuclei segmentation using a spatially adaptive active physical model. IEEE Trans. Image Process. 2012, 21, 4568–4580. [Google Scholar] [CrossRef]
- Plissiti, M.E.; Nikou, C.; Charchanti, A. Accurate Localization of Cell Nuclei in PAP Smear Images Using Gradient Vector Flow Deformable Models. 2010. Available online: https://s3.amazonaws.com/academia.edu.documents/3542734/c30_insicc-biosignals-valencia-2010.pdf?response-content-disposition=inline%3B%20filename%3DAccurate_localization_of_cell_nuclei_in.pd&X-Amz-Algorithm=AWS4-HMACSHA256&X-Amz-Credential=AKIAIWOWYYGZ2Y53UL3A%2F20191015%2Fus-east-1%2Fs3%2Faws4_request&X-Amz-Date=20191015T052814Z&X-Amz-Expires=3600&X-Amz-SignedHeaders=host&XAmz-Signature=0da2af18ed85fcec3292c08b4ddee5261389d2cea7bf84ddc43d079ee12b2757 (accessed on 15 October 2019).
- Guan, T.; Zhou, D.; Liu, Y. Accurate segmentation of partially overlapping cervical cells based on dynamic sparse contour searching and GVF snake model. IEEE J. Biomed. Health Inf. 2015, 19, 1494–1504. [Google Scholar] [CrossRef]
- Harandi, N.M.; Sadri, S.; Moghaddam, N.A.; Amirfattahi, R. An automated method for segmentation of epithelial cervical cells in images of ThinPrep. J. Med. Syst. 2010, 34, 1043–1058. [Google Scholar] [CrossRef]
- Plissiti, M.E.; Nikou, C. A Review of Automated Techniques for Cervical Cell Image Analysis and Classification. In Biomedical Imaging and Computational Modeling in Biomechanics; Lecture Notes in Computational Vision and Biomechanics; Springer: Dordrecht, The Netherlands, 2013; pp. 1–18. [Google Scholar] [CrossRef]
- Lezoray, O.; Cardot, H. Cooperation of color pixel classification schemes and color watershed: A study for microscopic images. IEEE Trans. Image Process. 2002, 11, 783–789. [Google Scholar] [CrossRef]
- Bak, E.; Najarian, K.; Brockway, J.P. Efficient segmentation framework of cell images in noise environments. In Proceedings of the 26th Annual International Conference of the IEEE Engineering in Medicine and Biology Society, San Francisco, CA, USA, 1–5 September 2004; Volume 1, pp. 1802–1805. [Google Scholar]
- Sobrevilla, P.; Montseny, E.; Lerma, E. A Fuzzy-based Automated Cells Detection System for Color Pap Smear Tests—FACSDS. In Fuzzy Sets and Their Extensions: Representation, Aggregation and Models; Springer: Berlin/Heidelberg, Germany, 2008; pp. 657–674. [Google Scholar]
- Mustafa, N.; Isa, N.A.M.; Mashor, M.Y. Automated Multicells Segmentation of ThinPrep Image Using Modified Seed Based Region Growing Algorithm (< Special Issue> Biosensors: Data Acquisition, Processing and Control). Int. J. Biomed. Soft Comput. Human Sci. 2009, 14, 41–47. [Google Scholar]
- Lassouaoui, N.; Hamami, L. Genetic algorithms and multifractal segmentation of cervical cell images. In Proceedings of the Seventh International Symposium on Signal Processing and Its Applications, Paris, France, 4 July 2003; Volume 2, pp. 1–4. [Google Scholar]
- Garrido, A.; De La Blanca, N.P. Applying deformable templates for cell image segmentation. Pattern Recognit. 2000, 33, 821–832. [Google Scholar] [CrossRef]
- Saha, R.; Bajger, M.; Lee, G. Spatial shape constrained fuzzy C-means (FCM) clustering for nucleus segmentation in pap smear images. In Proceedings of the 2016 International Conference on Digital Image Computing: Techniques and Applications (DICTA), Gold Coast, Australia, 30 November–2 December 2016; pp. 1–8. [Google Scholar]
- Devi, M.A.; Sheeba, J.I.; Joseph, K.S. Neutrosophic graph cut-based segmentation scheme for efficient cervical cancer detection. J. King Saud Univ. Comput. Inf. Sci. 2018. [Google Scholar] [CrossRef]
- Zhang, L.; Kong, H.; Liu, S.; Wang, T.; Chen, S.; Sonka, M. Graph-based segmentation of abnormal nuclei in cervical cytology. Comput. Med. Imaging Gr. 2017, 56, 38–48. [Google Scholar] [CrossRef] [PubMed]
- Vink, J.P.; Van Leeuwen, M.B.; Van Deurzen, C.H.M.; De Haan, G. Efficient nucleus detector in histopathology images. J. Microsc. 2013, 249, 124–135. [Google Scholar] [CrossRef]
- Ragothaman, S.; Narasimhan, S.; Basavaraj, M.G.; Dewar, R. Unsupervised segmentation of cervical cell images using gaussian mixture model. In Proceedings of the IEEE Conference on Computer Vision and Pattern Recognition Workshops, Las Vegas, NV, USA, 26 June–1 July 2016; pp. 70–75. [Google Scholar]
- Jung, C.; Kim, C. Segmenting clustered nuclei using H-minima transform-based marker extraction and contour parameterization. IEEE Trans. Biomed. Eng. 2010, 57, 2600–2604. [Google Scholar] [CrossRef]
- Nosrati, M.; Hamarneh, G. A variational approach for overlapping cell segmentation. ISBI Overl. Cerv. Cytol. Image Segm. Chall. 2014, 1–2. Available online: http://citeseerx.ist.psu.edu/viewdoc/download?doi=10.1.1.431.2236&rep=rep1&type=pdf (accessed on 15 October 2019).
- Ramalho, G.L.; Ferreira, D.S.; Bianchi, A.G.; Carneiro, C.M.; Medeiros, F.N.; Ushizima, D.M. Cell reconstruction under voronoi and enclosing ellipses from 3d microscopy. In Proceedings of the IEEE International Symposium on Biomedical Imaging (ISBI), New York, NY, USA, 16–19 April 2015. [Google Scholar]
- Lee, H.; Kim, J. Segmentation of overlapping cervical cells in microscopic images with superpixel partitioning and cell-wise contour refinement. In Proceedings of the IEEE Conference on Computer Vision and Pattern Recognition Workshops, Las Vegas, NV, USA, 26 June–1 July 2016; pp. 63–69. [Google Scholar]
- Sornapudi, S.; Stanley, R.J.; Stoecker, W.V.; Almubarak, H.; Long, R.; Antani, S.; Thoma, G.; Zuna, R.; Frazier, S.R. Deep Learning Nuclei Detection in Digitized Histology Images by Superpixels. J. Pathol. Inf. 2018, 9, 5. [Google Scholar]
- Wang, Y.; Wong, A.K. Overlapping Cell Segmentation with Shape Prior. In Proceedings of the 9th International Conference on Bioinformatics, Biocomputational Systems and Biotechnologies, Barcelona, Spain, 21–25 May 2017. [Google Scholar]
- Taneja, A.; Ranjan, P.; Ujlayan, A. Multi-cell nuclei segmentation in cervical cancer images by integrated feature vectors. Multimed. Tools Appl. 2018, 77, 9271–9290. [Google Scholar] [CrossRef]
- Kumar, P.; Happy, S.L.; Chatterjee, S.; Sheet, D.; Routray, A. An unsupervised approach for overlapping cervical cell cytoplasm segmentation. In Proceedings of the 2016 IEEE EMBS Conference on Biomedical Engineering and Sciences (IECBES), Kuala Lumpur, Malaysia, 4–8 December 2016; pp. 106–109. [Google Scholar]
- Braz, E.F.; Lotufo, R.D.A. Nuclei Detection Using Deep Learning. Simp. Bras. Telecomun. Process. Sinais 2017, 1059–1063. [Google Scholar]
- Chen, Y.; Huang, P.; Lin, K.; Lin, H.; Wang, L.; Cheng, C.; Chen, T.; Chan, Y.; Chiang, J.Y. Semi-Automatic Segmentation and Classification of Pap Smear Cells. IEEE J. Biomed. Health Inf. 2014, 18, 94–108. [Google Scholar] [CrossRef]
- Mariarputham, E.J.; Stephen, A. Nominated Texture Based Cervical Cancer Classification. Comput. Math. Methods Med. 2014, 2015, 10. [Google Scholar] [CrossRef] [PubMed]
- Zhao, M.; Wu, A.; Song, J.; Sun, X.; Dong, N. Automatic screening of cervical cells using block image processing. Biomed. Eng. Online 2016, 15, 14. [Google Scholar] [CrossRef] [PubMed]
- Mat-Isa, N.A.; Mashor, M.Y.; Othman, N.H. An automated cervical pre-cancerous diagnostic system. Artif. Intell. Med. 2008, 42, 1–11. [Google Scholar] [CrossRef] [PubMed]
- Chankong, T.; Theera-Umpon, N.; Auephanwiriyakul, S. Automatic cervical cell segmentation and classification in Pap smears. Comput. Methods Progr. Biomed. 2014, 113, 539–556. [Google Scholar] [CrossRef]
- Marinakis, Y.; Marinaki, M.; Dounias, G. Particle swarm optimization for pap-smear diagnosis. Exp. Syst. Appl. 2008, 35, 1645–1656. [Google Scholar] [CrossRef]
- Marinakis, Y.; Dounias, G. Nearest Neighbor Based Pap-Smear Cell Classification Using Tabu Search for Feature Selection. In Nature Inspired Smart Information Systems (NiSIS 2006); EU Co-Ordinate Action: Tenerife, Spain, 2006; p. 12. [Google Scholar]
- Marinakis, Y.; Dounias, G.; Jantzen, J. Pap smear diagnosis using a hybrid intelligent scheme focusing on genetic algorithm based feature selection and nearest neighbor classification. Comput. Biol. Med. 2009, 39, 69–78. [Google Scholar] [CrossRef]
- Bora, K.; Chowdhury, M.; Mahanta, L.B.; Kundu, M.K.; Das, A.K. Automated classification of Pap smear images to detect cervical dysplasia. Comput. Methods Progr. Biomed. 2017, 138, 31–47. [Google Scholar] [CrossRef]
- Gómez, O.H.; Sánchez-DelaCruz, E.; Mata, A.P.d.l. Classification of Cervical Cancer Using Assembled Algorithms in Microscopic Images of Papanicolaou. Res. Comput. Sci. 2017, 139, 125–134. [Google Scholar]
- Zhang, L.; Lu, L.; Nogues, I.; Summers, R.M.; Liu, S.; Yao, J. DeepPap: Deep Convolutional Networks for Cervical Cell Classification. IEEE J. Biomed. Health Inf. 2017, 21, 1633–1643. [Google Scholar] [CrossRef]
- Jith, O.U.N.; Harinarayanan, K.K.; Gautam, S.; Bhavsar, A.; Sao, A.K. DeepCerv: Deep Neural Network for Segmentation Free Robust Cervical Cell Classification. In Computational Pathology and Ophthalmic Medical Image Analysis; Lecture Notes in Computer Science; Springer: Berlin, Germany, 2018; pp. 86–94. [Google Scholar]
- Lin, H.; Hu, Y.; Chen, S.; Yao, J.; Zhang, L. Fine-Grained Classification of Cervical Cells Using Morphological and Appearance Based Convolutional Neural Networks. IEEE Access 2019, 7, 71541–71549. [Google Scholar] [CrossRef]
- Rosado, L.; Correia da Costa, J.M.; Elias, D.; S Cardoso, J. A Review of Automatic Malaria Parasites Detection and Segmentation in Microscopic Images. Anti-Infect. Agents 2016, 14, 11–22. [Google Scholar] [CrossRef]
- Lorenzo-Ginori, J.V.; Curbelo-Jardines, W.; López-Cabrera, J.D.; Huergo-Suárez, S.B. Cervical cell classification using features related to morphometry and texture of nuclei. In Iberoamerican Congress on Pattern Recognition; Springer: Berlin, Germany, 2013; pp. 222–229. [Google Scholar]
- Rasche, C.; Ţigăneşteanu, C.; Neghină, M.; Sultana, A. Cervical Nuclei Classification: Feature Engineering Versus Deep Belief Network. In Medical Image Understanding and Analysis; Communications in Computer and Information Science; Springer: Berlin, Germany, 2017; pp. 874–885. [Google Scholar]
- Bejnordi, B.E.; Moshavegh, R.; Sujathan, K.; Malm, P.; Bengtsson, E.; Mehnert, A. Novel chromatin texture features for the classification of pap smears. Proc. SPIE 2013, 8676. [Google Scholar] [CrossRef]
- Lakshmi, G.K.; Krishnaveni, K. Feature extraction and feature set selection for cervical cancer diagnosis. Indian J. Sci. Technol. 2016, 9. [Google Scholar] [CrossRef]
- Oliver, L.H.; Poulsen, R.S.; Toussaint, G.T.; Louis, C. Classification of atypical cells in the automatic cytoscreening for cervical cancer. Pattern Recognit. 1979, 11, 205–212. [Google Scholar] [CrossRef]
- Walker, R.F.; Jackway, P.; Lovell, B.; Longstaff, I.D. Classification of cervical cell nuclei using morphological segmentation and textural feature extraction. Proceedings of ANZIIS the ’94-Australian New Zealnd Intelligent Information Systems Conference, Brisbane, Australia, 29 November–2 December 1994; pp. 297–301. [Google Scholar] [CrossRef]
- Huang, P.C.; Chan, Y.K.; Chan, P.C.; Chen, Y.F.; Chen, R.C.; Huang, Y.R. Quantitative Assessment of Pap Smear Cells by PC-Based Cytopathologic Image Analysis System and Support Vector Machine. In Medical Biometrics; Lecture Notes in Computer Science; Springer: Berlin/Heidelberg, Germany, 2007; pp. 192–199. [Google Scholar]
- Hyeon, J.; Choi, H.; Lee, B.D.; Lee, K.N. Diagnosing cervical cell images using pre-trained convolutional neural network as feature extractor. In Proceedings of the 2017 IEEE International Conference on Big Data and Smart Computing (BigComp), Jeju, Korea, 13–16 February 2017; pp. 390–393. [Google Scholar] [CrossRef]
- Bora, K.; Chowdhury, M.; Mahanta, L.B.; Kundu, M.K.; Das, A.K. Pap Smear Image Classification Using Convolutional Neural Network. In Proceedings of the Tenth Indian Conference on Computer Vision, Graphics and Image Processing, ICVGIP ’16, Guwahati, India, 18–22 December 2016; pp. 55:1–55:8. [Google Scholar] [CrossRef]
- Mango, L.J. Computer-assisted cervical cancer screening using neural networks. Cancer Lett. 1994, 77, 155–162. [Google Scholar] [CrossRef]
- Gallegos-Funes, F.J.; Gómez-Mayorga, M.E.; López-Bonilla, J.L.; Cruz-Santiago, R. Rank M-Type Radial Basis Function ( RMRBF ) Neural Network for Pap Smear Microscopic Image Classification. Apeiron Stud. Infin. Nat. 2009, 16. Available online: http://www.redshift.vif.com/JournalFiles/V16NO4PDF/V16N4GAL.pdf (accessed on 15 October 2019).
- Sokouti, B.; Haghipour, S.; Tabrizi, A.D. A framework for diagnosing cervical cancer disease based on feedforward MLP neural network and ThinPrep histopathological cell image features. Neural Comput. Appl. 2014, 24, 221–232. [Google Scholar] [CrossRef]
- Yusoff, I.A.; Isa, N.A.M.; Othman, N.H.; Sulaiman, S.N.; Jusman, Y. Performance of neural network architectures: Cascaded MLP versus extreme learning machine on cervical cell image classification. In Proceedings of the 10th International Conference on Information Science, Signal Processing and Their Applications (ISSPA 2010), Kuala Lumpur, Malaysia, 10–13 May 2010; pp. 308–311. [Google Scholar] [CrossRef]
- Mat-Isa, N.A.; Mashor, M.Y.; Othman, N.H.; Malaysia, U.S.M. Classification of Cervical Cancer Cells Using HMLP Network with Confidence Percentage and Confidence Level Analysis. Int. J. Comput. Int. Manag. 2003, 11, 17–29. [Google Scholar]
- Ramli, D.A.; Kadmin, A.F.; Mashor, M.Y.; Ashidi, N.; Isa, M. Diagnosis of Cervical Cancer Using Hybrid Multilayered Perceptron (HMLP) Network. In Knowledge-Based Intelligent Information and Engineering Systems; Lecture Notes in Computer Science; Springer: Berlin/Heidelberg, Germany, 2004; pp. 591–598. [Google Scholar]
- Li, Z.; Najarian, K. Automated classification of Pap smear tests using neural networks. In Proceedings of the IJCNN’01, International Joint Conference on Neural Networks, (Cat. No.01CH37222), Washington, DC, USA, 15–19 July 2001; Volume 4, pp. 2899–2901. [Google Scholar] [CrossRef]
- Gupta, R.; Sarwar, A.; Sharma, V. Screening of Cervical Cancer by Artificial Intelligence based Analysis of Digitized Papanicolaou-Smear Images. Int. J. Contemp. Med. Res. 2017, 4. Available online: https://www.researchgate.net/profile/Arvind_Singh56/post/Are_there_any_articles_published_on_the_role_of_artificial_intelligence_in_the_screening_of_cancers/attachment/5d6b55c7cfe4a7968dc6805d/AS%3A798192790683648%401567315399484/download/1.pdf (accessed on 15 October 2019).
- Sarwar, A.; Sharma, V.; Gupta, R. Hybrid ensemble learning technique for screening of cervical cancer using Papanicolaou smear image analysis. Pers. Med. Univ. 2015, 4, 54–62. [Google Scholar] [CrossRef]
- Krizhevsky, A.; Sutskever, I.; Hinton, G.E. ImageNet Classification with Deep Convolutional Neural Networks. In Advances in Neural Information Processing Systems 25; Curran Associates, Inc.: Dutchess County, NY, USA, 2012; pp. 1097–1105. [Google Scholar]
- Fernandes, K.; Chicco, D.; Cardoso, J.S.; Fernandes, J. Supervised deep learning embeddings for the prediction of cervical cancer diagnosis. PeerJ Comput. Sci. 2018, 4, e154. [Google Scholar] [CrossRef]
- Nallaperumal, K.; Krishnaveni, K. Watershed segmentation of cervical images using multiscale morphological gradient and HSI color space. Int. J. Imaging Sci. Eng. 2008, 2, 212–216. [Google Scholar]
- Bollmann, R.; Bankfalvi, A.; Griefingholt, H.; Trosic, A.; Speich, N.; Schmitt, C.; Bollmann, M. Validity of combined cytology and human papillomavirus (HPV) genotyping with adjuvant DNA-cytometry in routine cervical screening: Results from 31031 women from the Bonn-region in West Germany. Oncol. Rep. 2005, 13, 915–922. [Google Scholar] [CrossRef] [PubMed]
- Böcking, A.; Stockhausen, J.; Meyer-Ebrecht, D. Towards a Single Cell Cancer Diagnosis. Multimodal and Monocellular Measurements of Markers and Morphology (5M). Cell. Oncol. 2004, 26, 73–79. [Google Scholar] [CrossRef] [PubMed]
- Xu, T.; Huang, X.; Kim, E.; Long, L.R.; Antani, S. Multi-test cervical cancer diagnosis with missing data estimation. Proc. SPIE 2015, 9414. [Google Scholar] [CrossRef]
- Song, D.; Kim, E.; Huang, X.; Patruno, J.; Muñoz-Avila, H.; Heflin, J.; Long, L.R.; Antani, S. Multimodal Entity Coreference for Cervical Dysplasia Diagnosis. IEEE Trans. Med. Imaging 2015, 34, 229–245. [Google Scholar] [CrossRef]
- Xu, T.; Zhang, H.; Huang, X.; Zhang, S.; Metaxas, D.N. Multimodal Deep Learning for Cervical Dysplasia Diagnosis. In Medical Image Computing and Computer-Assisted Intervention—MICCAI 2016; Lecture Notes in Computer Science; Springer: Berlin, Germany, 2016; pp. 115–123. [Google Scholar]
- Ropers, S.; Bell, A.A.; Wurflinger, T.; Backing, A.; Meyer-Ebrecht, D. Automatic scene comparison and matching in multimodal cytopathological microscopic images. In Proceedings of the IEEE International Conference on Image Processing 2005, Genova, Italy, 14 September 2005; Volume 1. [Google Scholar] [CrossRef]
- Bell, A.A.; Würflinger, T.; Ropers, S.O.; Böcking, A.; Aach, T. Towards Fully Automatic Acquisition of Multimodal Cytopathological Microscopy Images with Autofocus and Scene Matching. Methods Inf. Med. 2007, 46, 314–323. [Google Scholar] [CrossRef][Green Version]
- Ngiam, J.; Khosla, A.; Kim, M.; Nam, J.; Lee, H.; Ng, A.Y. Multimodal Deep Learning. In Proceedings of the 28th International Conference on Machine Learning (ICML-11), Bellevue, WA, USA, 28 June–2 July 2011; p. 8. [Google Scholar]
- Cai, L.; Wang, Z.; Gao, H.; Shen, D.; Ji, S. Deep Adversarial Learning for Multi-Modality Missing Data Completion. In Proceedings of the 24th ACM SIGKDD International Conference on Knowledge Discovery & Data Mining, KDD ’18, London, UK, 19–23 August 2018; pp. 1158–1166. [Google Scholar] [CrossRef]
- Zhao, C.; Li, Z. Automated cell block system for atypical glandular cells of cervical cytology. Cancer Cytopathol. 2014, 122, 5–7. [Google Scholar] [CrossRef]
- Marques, J.P.d.H.; Costa, L.B.; de Souza e Pinto, A.P.; de Lima, A.F.; Leite Duarte, M.E.; Fernandes Barbosa, A.P.; de Medeiros, P.L. Atypical glandular cells and cervical cancer: systematic review. Revis. Assoc. Médica Bras. (Engl. Ed.) 2011, 57, 229–233. [Google Scholar] [CrossRef]
- Zhang, J.; Liu, Y. Cervical Cancer Detection Using SVM Based Feature Screening. In Medical Image Computing and Computer-Assisted Intervention—MICCAI 2004; Lecture Notes in Computer Science; Springer: Berlin/Heidelberg, Germany, 2004; pp. 873–880. [Google Scholar]
- Bigras, G.; de Marval, F. The probability for a Pap test to be abnormal is directly proportional to HPV viral load: Results from a Swiss study comparing HPV testing and liquid-based cytology to detect cervical cancer precursors in 13,842 women. Br. J. Cancer 2005, 93, 575–581. [Google Scholar] [CrossRef]


| Classification System | Author | Grading Criteria | Reporting Purpose | Clinical Purpose |
|---|---|---|---|---|
| The Bethesda System (TBS) [26] | United States National Cancer Institute (NCI) | For cervical cytological report (results of microscopic examination of a smear) | Depending on the cells’ extent of abnormality | Screening (test for detecting early changes of the cells of the cervix) |
| Cervical Intraepithelial Neoplasia (CIN) [27] | Richart R.M. | For histological report (results of microscopic examination of tissue samples) | According to the thickness of the abnormal epithelium | Diagnosis (medical test to aid in the diagnosis or detection of cervical cancer) |
| TNM [8] | Union for International Cancer Control (UICC) | To document prognostic factors: tumour’s size (T), affected lymph nodes (N) and distant metastases (M) | Based either on clinical description or pathological classification | Staging and tumour risk assessment |
| FIGO [8] | International Federation of Gynaecology and Obstetrics (FIGO) | To determine the extent of the cervical invasion | Based on clinical examination | Staging and tumour risk assessment |
| Dataset | Year | Type | No Images | Purpose | Description |
|---|---|---|---|---|---|
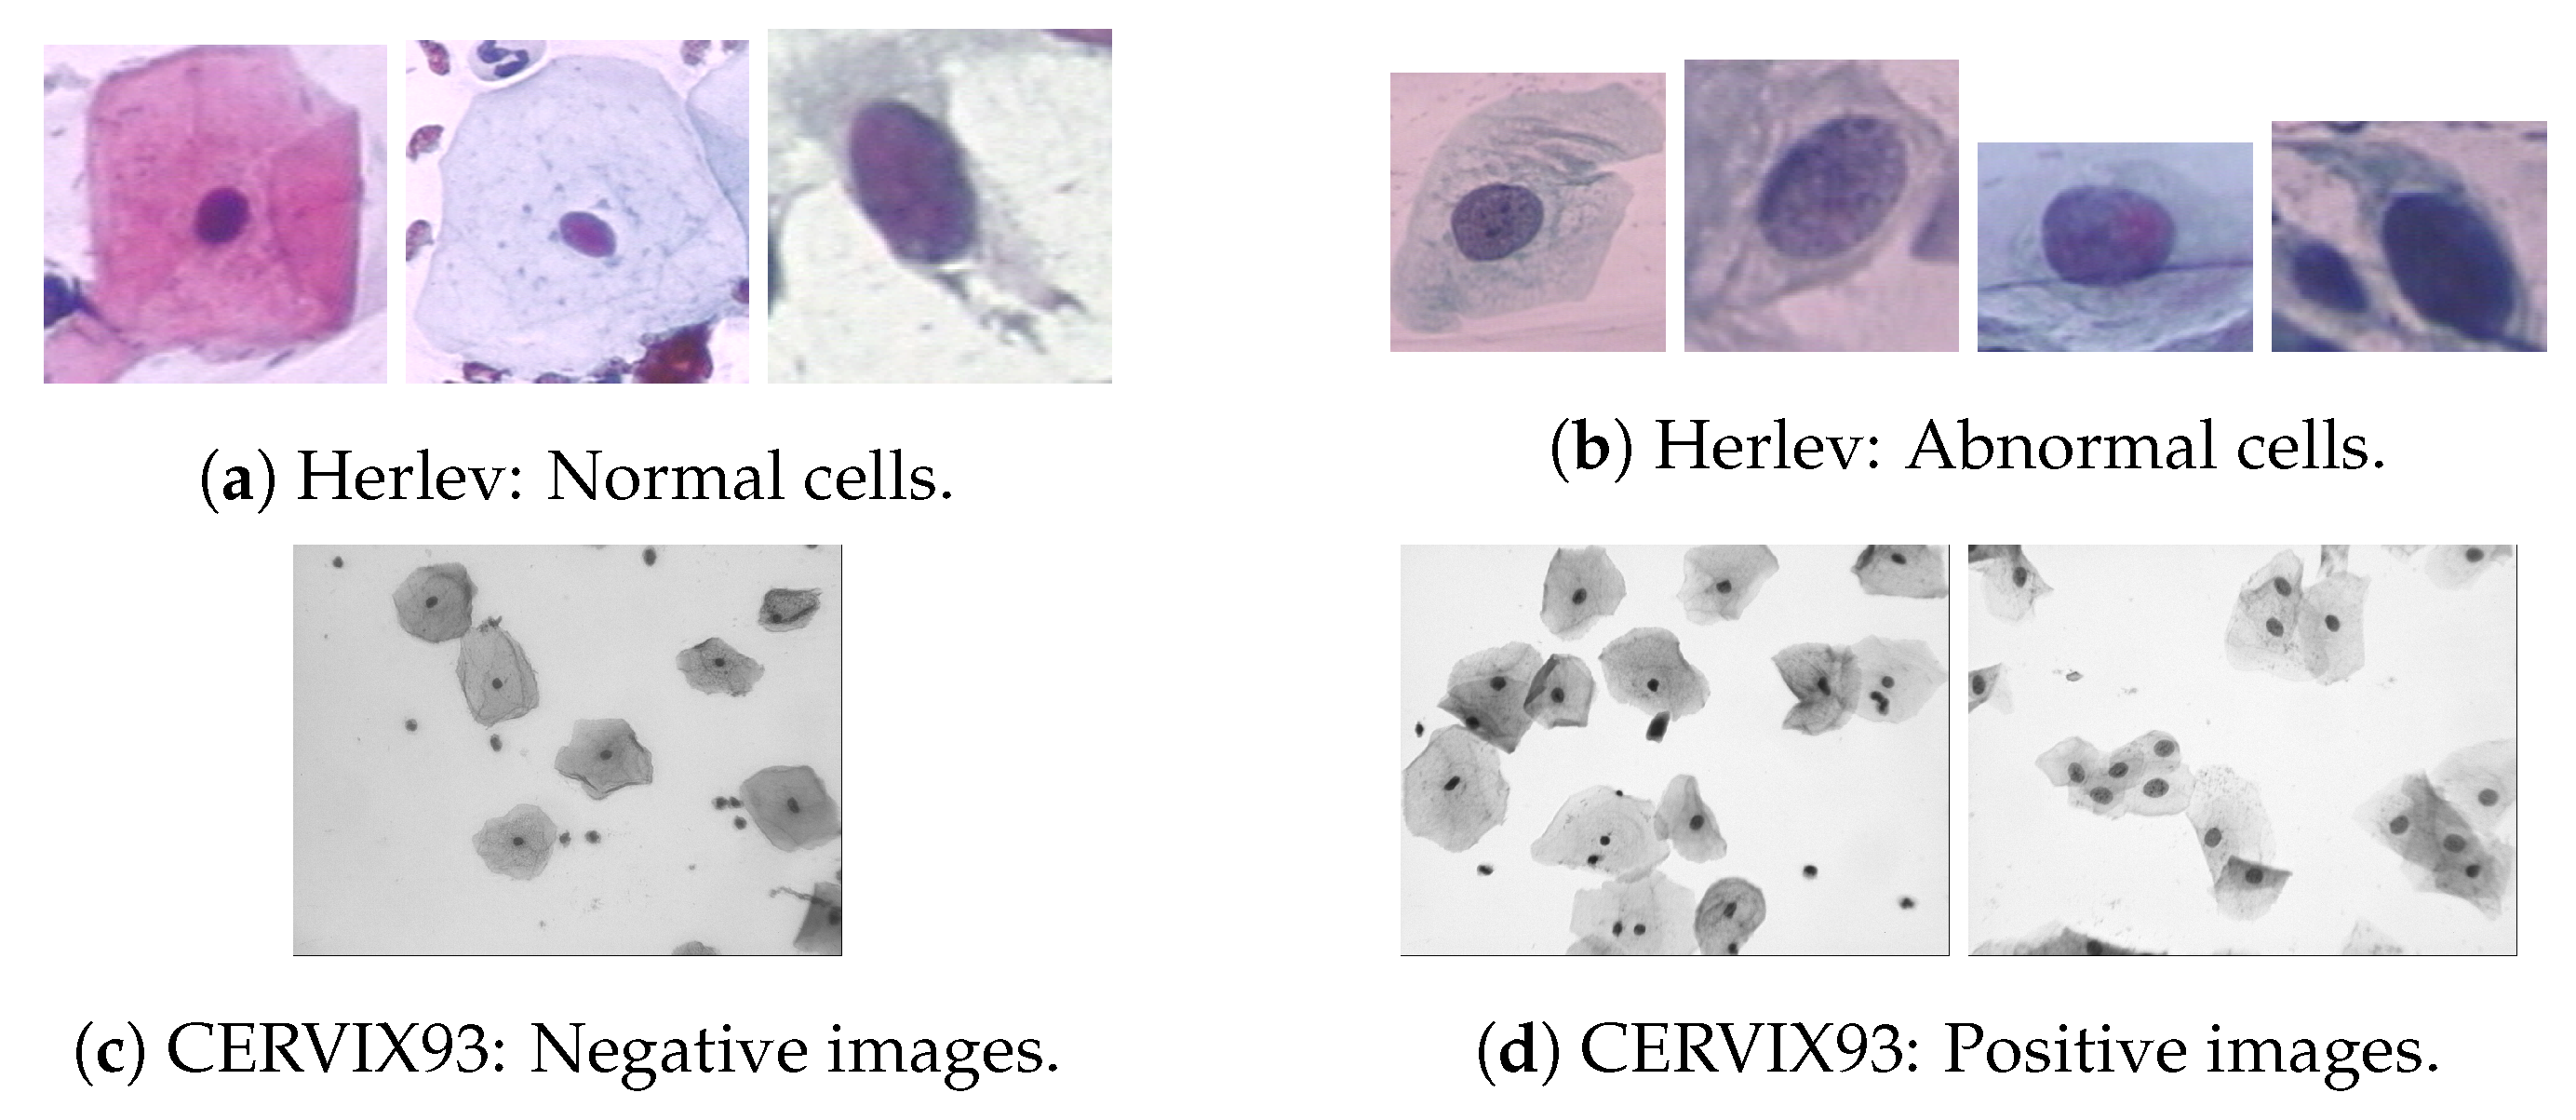
| Herlev [32] | 2005 | Image | 917 | Seg. Class. | Single-cell images with segmentation ground-truth. Classification divided in seven classes (Figure 4). |
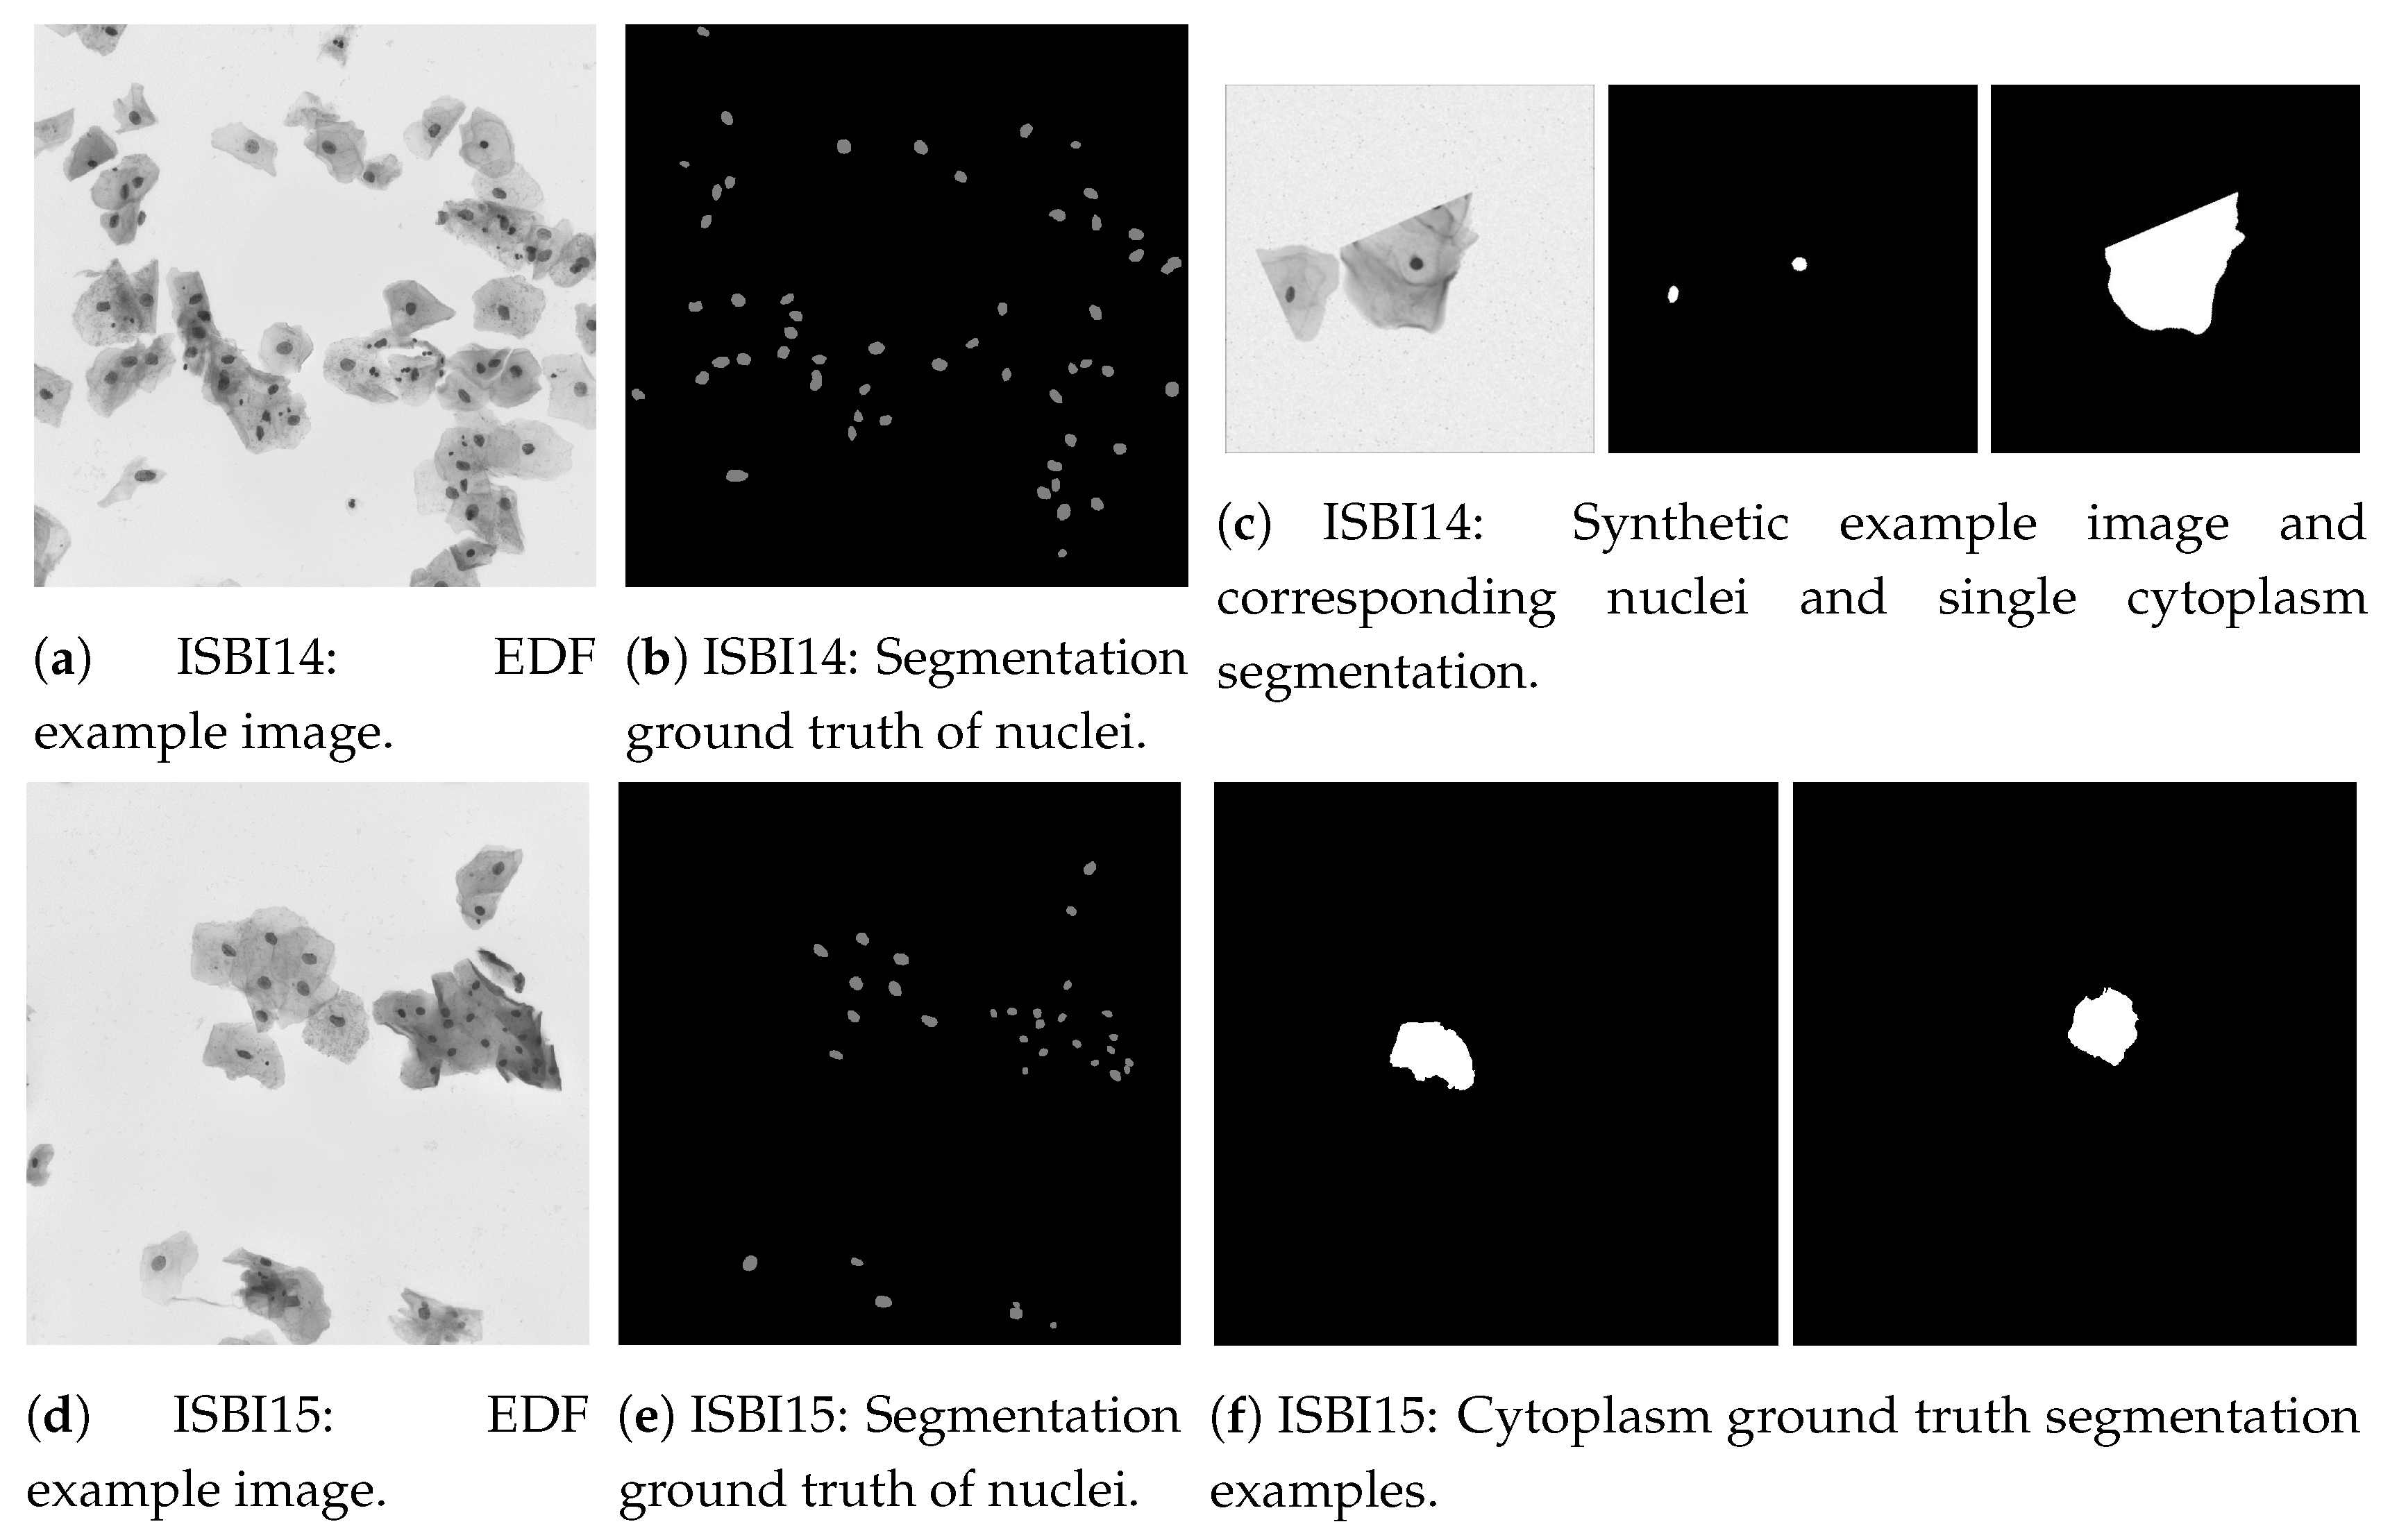
| ISBI14 [33,34] | 2014 | Image | 16 EDF + 945 Synthetic | Seg. | Extended depth field (EDF) [35] and synthetic images containing cells with different overlapping degrees. Segmentation of nuclei and cytoplasm (Figure 5). |
| ISBI15 [33] | 2015 | Image | 17 EDF (each with 20 FOVs) | Seg. | EDF images containing cells with different overlapping degrees and respective fields of view (FOVs). Nuclei and cytoplasm segmentation (Figure 5). |
| CERVIX93 [36] | 2018 | Image | 93 EDF (each with 20 FOVs) | Seg. Class. | Similiar to ISBI15 images. Classification divided in seven classes (Figure 4). Segmentation only for nuclei points. |
| Risk-Factors [37,38] | 2017 | Text | - | Class. | Patient’s information and medical history. Target variables: required diagnosis tests (Hinselmann, Schiller, Cytology and Biopsy). It can be used to infer the patient’s likelihood of having cervical cancer. |
| Paper/Authors | Segmentation Technique | Cells Overlap | Datasets | Performance |
|---|---|---|---|---|
| Watersheds | ||||
| Plissiti et al. (2011, 2011) [65,73] | Watershed computation + Refinement based on shape prior. Artifact removal by distance-dependent rule and pixel classification (Fuzzy C-means (FCM), support vector machine (SVM)). | No | Private | FCM: Rec: 90.6% Sp: 75.3%. SVM: Rec: 69.9% Sp: 92.0% |
| Gençtav et al. 2012 [74] | Multi-scale watershed + Hierarchical unsupervised segmentation tree + Final binary classifier within cell regions | Yes (clumps and nuclei only) | Herlev, Private | (Herlev): Acc: 97%; Prec: 88%. Rec: 93%; DSC: 0.89 |
| Tareef et al. 2018 [75] | Multi-pass watershed + Ellipse fitting | Yes | ISBI 2014, ISBI 2015 | (ISBI 2014): Nuc DSC: 0.925; Rec: 95.0%; Prec: 90.6%. (ISBI 2015): Cyt DSC: 0.851 |
| Active Contour Models (ACM)/Gradient Vector Flow (GVF) | ||||
| Bamford et al. 1998 [76] | Viterbi search-based dual active contour | No | Private | Acc: 99.6% |
| Li et al. 2012 [77] | K-means clustering + Edge computation map by Radiating GVF | No | Herlev | DSC: 0.954 |
| Plissiti et al. 2012 [78] | Snake driven by adaptative physical model | Overl. Nuclei | Private | Hausdorf distance: 19.91 |
| Level Sets with Shape Priors | ||||
| Lu et al. (2015, 2013) [33,79] | Unsupervised Gaussian mixture models (GMM) + Maximally stable extremal regions (MSER) + Level set with elliptical shape | Yes | ISBI 2014 | Nuc Prec:94.2%; Rec:91.2%; DSC:0.921. Cyt DSC: 0.88 |
| Nosrati and Hamarneh 2015 [80] | Random forest (RF) classifier + Level Set with elliptical, 2014, and/or star shape prior, 2015, and Voronoi energy based, 2015 | Yes | ISBI 2014 | Nuc Prec: 90.1%; Rec:91.6%; DSC:0.900. Cyt DSC: 0.871 |
| Graph/Grid-based | ||||
| Ushizima et al. 2015, 3 pages [81] | Graph-based region growing + Voronoi Diagram | Yes | ISBI 2014, ISBI 2015 | (ISBI 2014): Nuc Rec: 87.1%; Prec: 96.8%; DSC: 0.914. Cyt DSC:0.872. (ISBI 2015): Cyt DSC: 0.875 |
| Zhang et al. (2014, 2014) [54,82] | Multi-way graph cut globally on the a* channel for background/cell segmentation + Local adaptative graph-cut (LAGC) for nucleus delineation. | Only touching nuclei | Private | Nuc Prec: 85%; Rec: 90%; Cyt Acc: 93%; DSC: 0.93 |
| Phoulady et al. (2015, 2016, 2017) [83,84,85] | Iterative thresholding + GMM Expectation-Maximization (EM) + Grid approach with distance metric from multi-focal images | Yes | ISBI 2014, ISBI 2015 | (ISBI 2014): Nuc Prec: 96.1%; Rec: 93.3%. Cyt DSC: 0.901. (ISBI 2015): Cyt DSC: 0.869 |
| Machine Learning Classification (Nuclei, Cytoplasm, Background) | ||||
| Tareef et al. 2014 [86] | Linear kernel SVM classifier on superpixels followed by edge enchancement and adaptative thresholding techniques | Yes | ISBI 2014 | Nuc Prec: 94.3%; Rec: 92.0%; DSC: 0.926. Cyt: DSC 0.914 |
| Zhao et al. 2016 [87] | Markov random field (MRF) classifier with a Gap-search algorithm + Automatic labeling map | No | Herlev, Private | (Herlev) Nuc DSC: 0.93. Cyt DSC: 0.82 |
| Tareef et al. 2017 [88] | SVM classification + Shape based-guided Level Set based on Sparse Coding for overlapping cytoplasm | Yes | ISBI 2014 | Nuc Prec: 95%; Rec: 93%; DSC: 0.93. Cyt DSC: 0.89 |
| Convolutional Neural Network (CNN) Segmentation | ||||
| Song et al. (2014, 2017) [89,90] | Multi-scale CNN feature extraction with spatial pyramids + neural network (NN). Refinement: Graph partitioning + Unsupervised Clustering (2015). Dynamic multi-template shape model (2017). | Only touching nuclei (2015). Yes (2017) | Private, ISBI 2015 | (ISBI 2015): Nuc DSC: 0.93. Cyt DSC: 0.91 |
| Gautam et al. (2018, 2018) [91,92] | CNN with selective pre-processing based on nucleus size and chromatin pattern + post-processing morphological filtering. | No | Herlev | Prec: 89%; Rec: 91%; DSC:0.90 |
| Tareef et al. 2017 [93] | CNN patch-based for cellular components classification. Cytoplasm estimation by Voronoi Diagram + Level Set with Shape prior | Yes | ISBI 2014 | Nuc Prec: 94%; Rec:95%; DSC:0.94.Cyt DSC:0.897 |
| Paper/Authors | Classification Technique | Datasets | Classes | Performance |
|---|---|---|---|---|
| Support Vector Machine (SVM) | ||||
| Chen et al. 2014 [126] | SVM and Fisher linear discriminant classifiers with feature selection filter and wrapper methods. Best: SVM with Recursive Feature Addition (RFA) | Private | 2 | Acc 98.8%; Rec 91.4%; Sp 99.9%; |
| Mariarputham et al. 2014 [127] | NN and SVM with different kernels + Feature set (FS). Best: Linear Kernel SVM | Herlev | 2, 7 class | Acc: Norm. 96.91%; Interm. 93.89%; Col. 92.35%; Mild 92.33%; Mod. 96.62%; Sev. 92.10%; CIS. 91.72% |
| Zhao et al. 2016 [128] | Block image partitioning and segmentation. Feature extraction on non-background blocks followed by classification through a radial basis function-SVM. | Private | 2-class | Acc 98.98%; Rec 95.0%; Sp 99.33% |
| Artificial Neural Networks (ANN) | ||||
| Mat-Isa et al. 2008 [129] | Cascade Hybrid Multilayer Perceptron (HMLP). 1st: Abnormal/Normal 2nd: LSIL vs HSIL classifier | Private | 3 class | Acc 97.50%; Rec 96.67%; Sp 100% |
| Chankong et al. 2014 [130] | Extensive comparison of five classifiers and FS. Best: three layer Backpropagation ANN with nine features | Herlev, Private (ERUDIT, LCH) | 2, 4, 7 class | (Herlev) 2-class: Acc 99.27%; Rec 99.85%; Sp 96.53%. 7-class: Acc 93.78%; Rec 98.96%; Sp 96.69%; |
| Zhang et al. 2014 [54] | Artifact classifier + four Iterative Abnormality MLP classifiers | HELBC (Private) | 2 class | CCR 94.3%; Rec 88.1%; Sp 100% |
| Unsupervised Classification | ||||
| Marinakis et al. (2006, 2008, 2009) [131,132,133] | K-NN with FS: Tabu Search (2006), Particle Swarm (2008) and Genetic Algorithm (2009) | Herlev, Private | 2, 7 class | (Herlev) 2-class: RMSE 0.1796; OE 3.164%. 7-class: RMSE 0.895; OE 4.253% |
| Gençtav et al. 2012 [74] | Hierarchical clustering tree + optimal leaf ordering that maximizes similarly of adjacent leaves and ranks cells’ abnormality. | Herlev, Hacettepe (Private) | 7 class | (Herlev) Rs 0.848; k 0.848; kw 0.848 |
| Plissiti et al. 2012 [78] | Fuzzy C-means and Spectral Clustering based on nuclei features only | Herlev | 2, 7 class | FCM H-mean: 90.58%; SClust H-mean: 88.77% |
| Ensemble | ||||
| Bora et al. 2017 [134] | Ensemble of LSSVM, MLP and RF weighted by majority voting. Single cell and smear level classification | Herlev, Private | 2, 3 class | (Herlev) 2-class: Acc 96.51%; Rec 98.96%; Sp 89.67%. 3-class: Acc 91.71%; Rec 89.41%; Sp 94.84%; |
| Gómez et al. 2017 [135] | Comparison of several algorithms. Best: Bagging + MultilayerPerceptron and AdaBoostM1 + LMT | Herlev | 2-class | Acc 95.74% |
| Deep Learning | ||||
| Zhang et al. 2017 [136] | Nuclei centered patched-based CNN through Transfer Learning | Herlev, HEMLBC (Private) | 2-class: | Acc 98.3%; Rec 98.2%; Sp 98.3%; H-mean 98.3%; |
| Jith et al. 2018 [137] | CNN based on fine tuned AlexNet | Herlev, Aindra (Private) | 2-class | Acc 99.6% |
| Gautam et al. 2018 [91] | Two patch-based CNNs with selective pre-processing + pre-trained AlexNet classification or Hierarchical Decision Tree with CNN on each leaf | Herlev, Aindra (Private) | 2, 7-class | 2-class Acc: 99.3%. 7-class Acc: 93.75% |
| Lin et al. 2019 [138] | Concatenate nucleus centered RGB images patches with cytoplasm and nucleus masks as a five-channel input to several pre-trained CNN | Herlev | 2,7-class | 2-class: Acc 94.5%; Rec 97.4%; Sp 90.4%. 7-class: Acc 64.5% |
| Shape | Chromatin | Texture | Other |
|---|---|---|---|
| Area * | Brightness * | Multi-nucleus cells | Fourier descriptor |
| Roundness * | Mean Grey Level | GLCM measures | Nucleus distribution |
| Longest Diameter * | Intensity Disparity | Optical Density | Nucleus Position |
| Eccentricity | Minima * | Uniformity | Graph-based (contextual) |
| Major Axis length | Maxima * | Entropy | |
| Minor Axis Length | Average Color | Smoothness | |
| Perimeter * | Boundary intensity | Neighborhood Intensity Disparity | |
| Elongation * | Smoothness | LBP mean value | |
| Convexity | Variance | Coarseness | |
| SDNRL | |||
| N/C ratio |
© 2019 by the authors. Licensee MDPI, Basel, Switzerland. This article is an open access article distributed under the terms and conditions of the Creative Commons Attribution (CC BY) license (http://creativecommons.org/licenses/by/4.0/).
Share and Cite
Conceição, T.; Braga, C.; Rosado, L.; Vasconcelos, M.J.M. A Review of Computational Methods for Cervical Cells Segmentation and Abnormality Classification. Int. J. Mol. Sci. 2019, 20, 5114. https://doi.org/10.3390/ijms20205114
Conceição T, Braga C, Rosado L, Vasconcelos MJM. A Review of Computational Methods for Cervical Cells Segmentation and Abnormality Classification. International Journal of Molecular Sciences. 2019; 20(20):5114. https://doi.org/10.3390/ijms20205114
Chicago/Turabian StyleConceição, Teresa, Cristiana Braga, Luís Rosado, and Maria João M. Vasconcelos. 2019. "A Review of Computational Methods for Cervical Cells Segmentation and Abnormality Classification" International Journal of Molecular Sciences 20, no. 20: 5114. https://doi.org/10.3390/ijms20205114
APA StyleConceição, T., Braga, C., Rosado, L., & Vasconcelos, M. J. M. (2019). A Review of Computational Methods for Cervical Cells Segmentation and Abnormality Classification. International Journal of Molecular Sciences, 20(20), 5114. https://doi.org/10.3390/ijms20205114