New Molecular Markers Involved in Regulation of Ovarian Granulosa Cell Morphogenesis, Development and Differentiation during Short-Term Primary In Vitro Culture—Transcriptomic and Histochemical Study Based on Ovaries and Individual Separated Follicles

 , ,
, , 


Abstract
1. Introduction
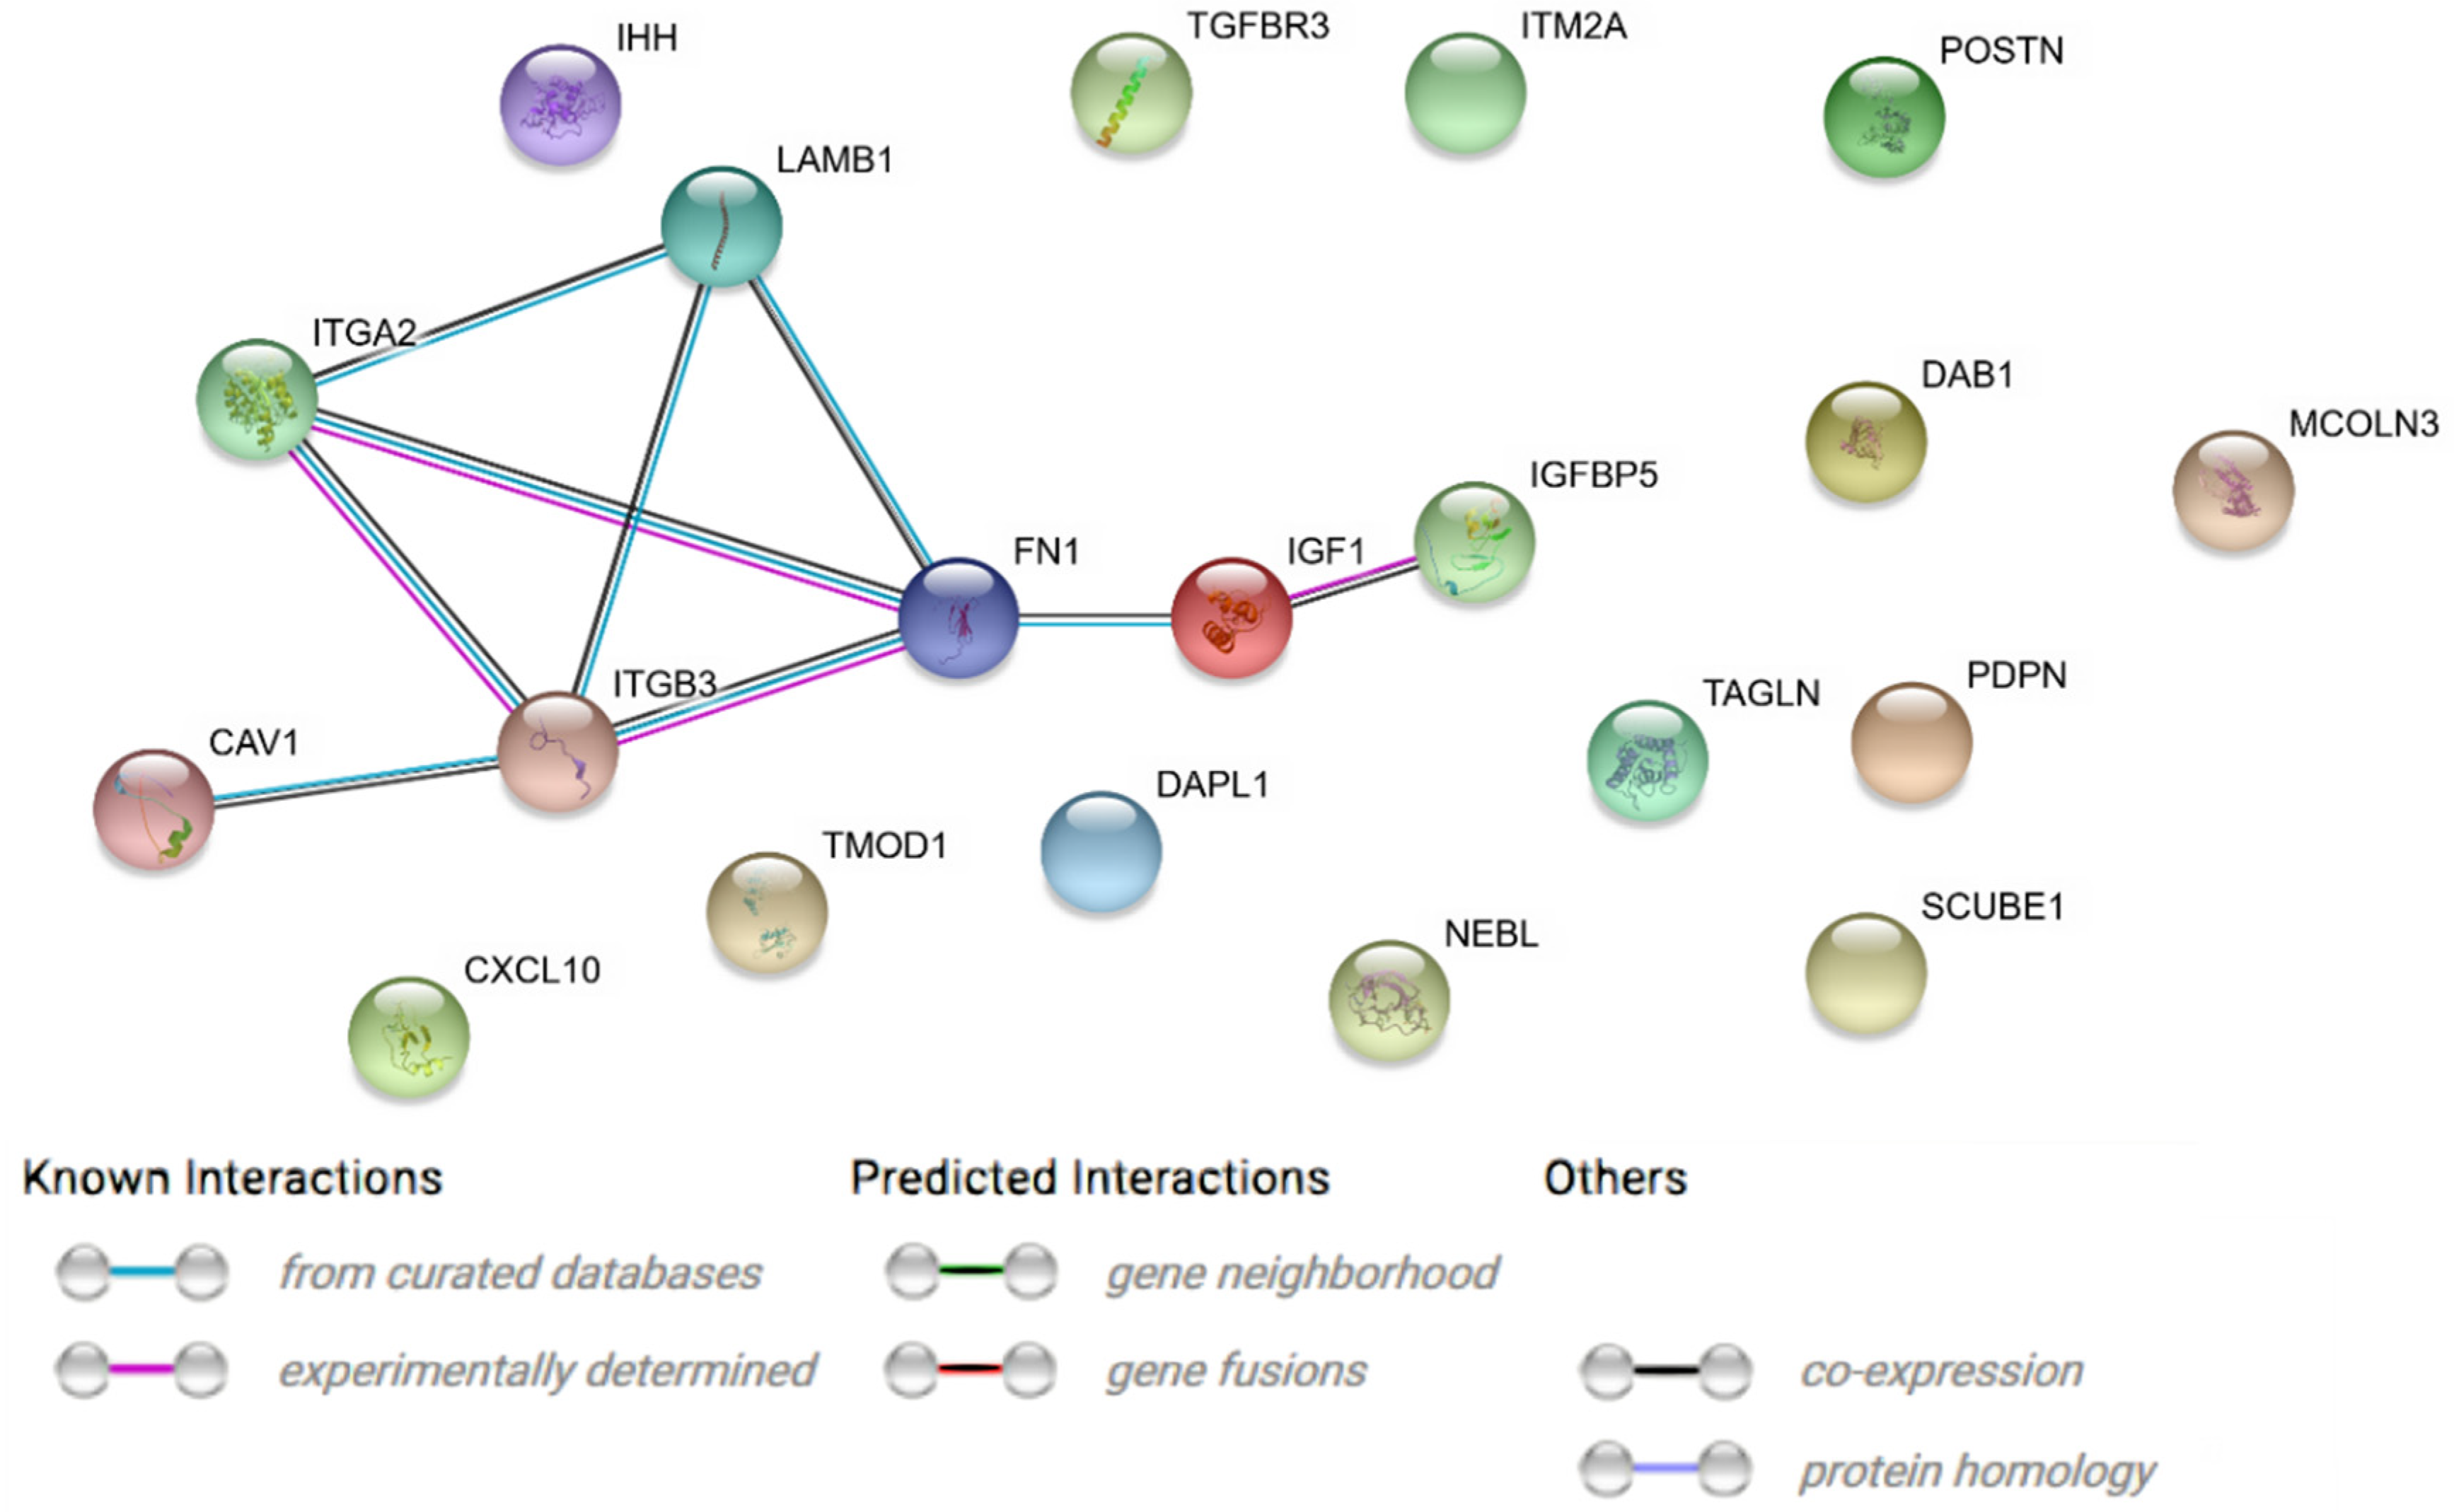
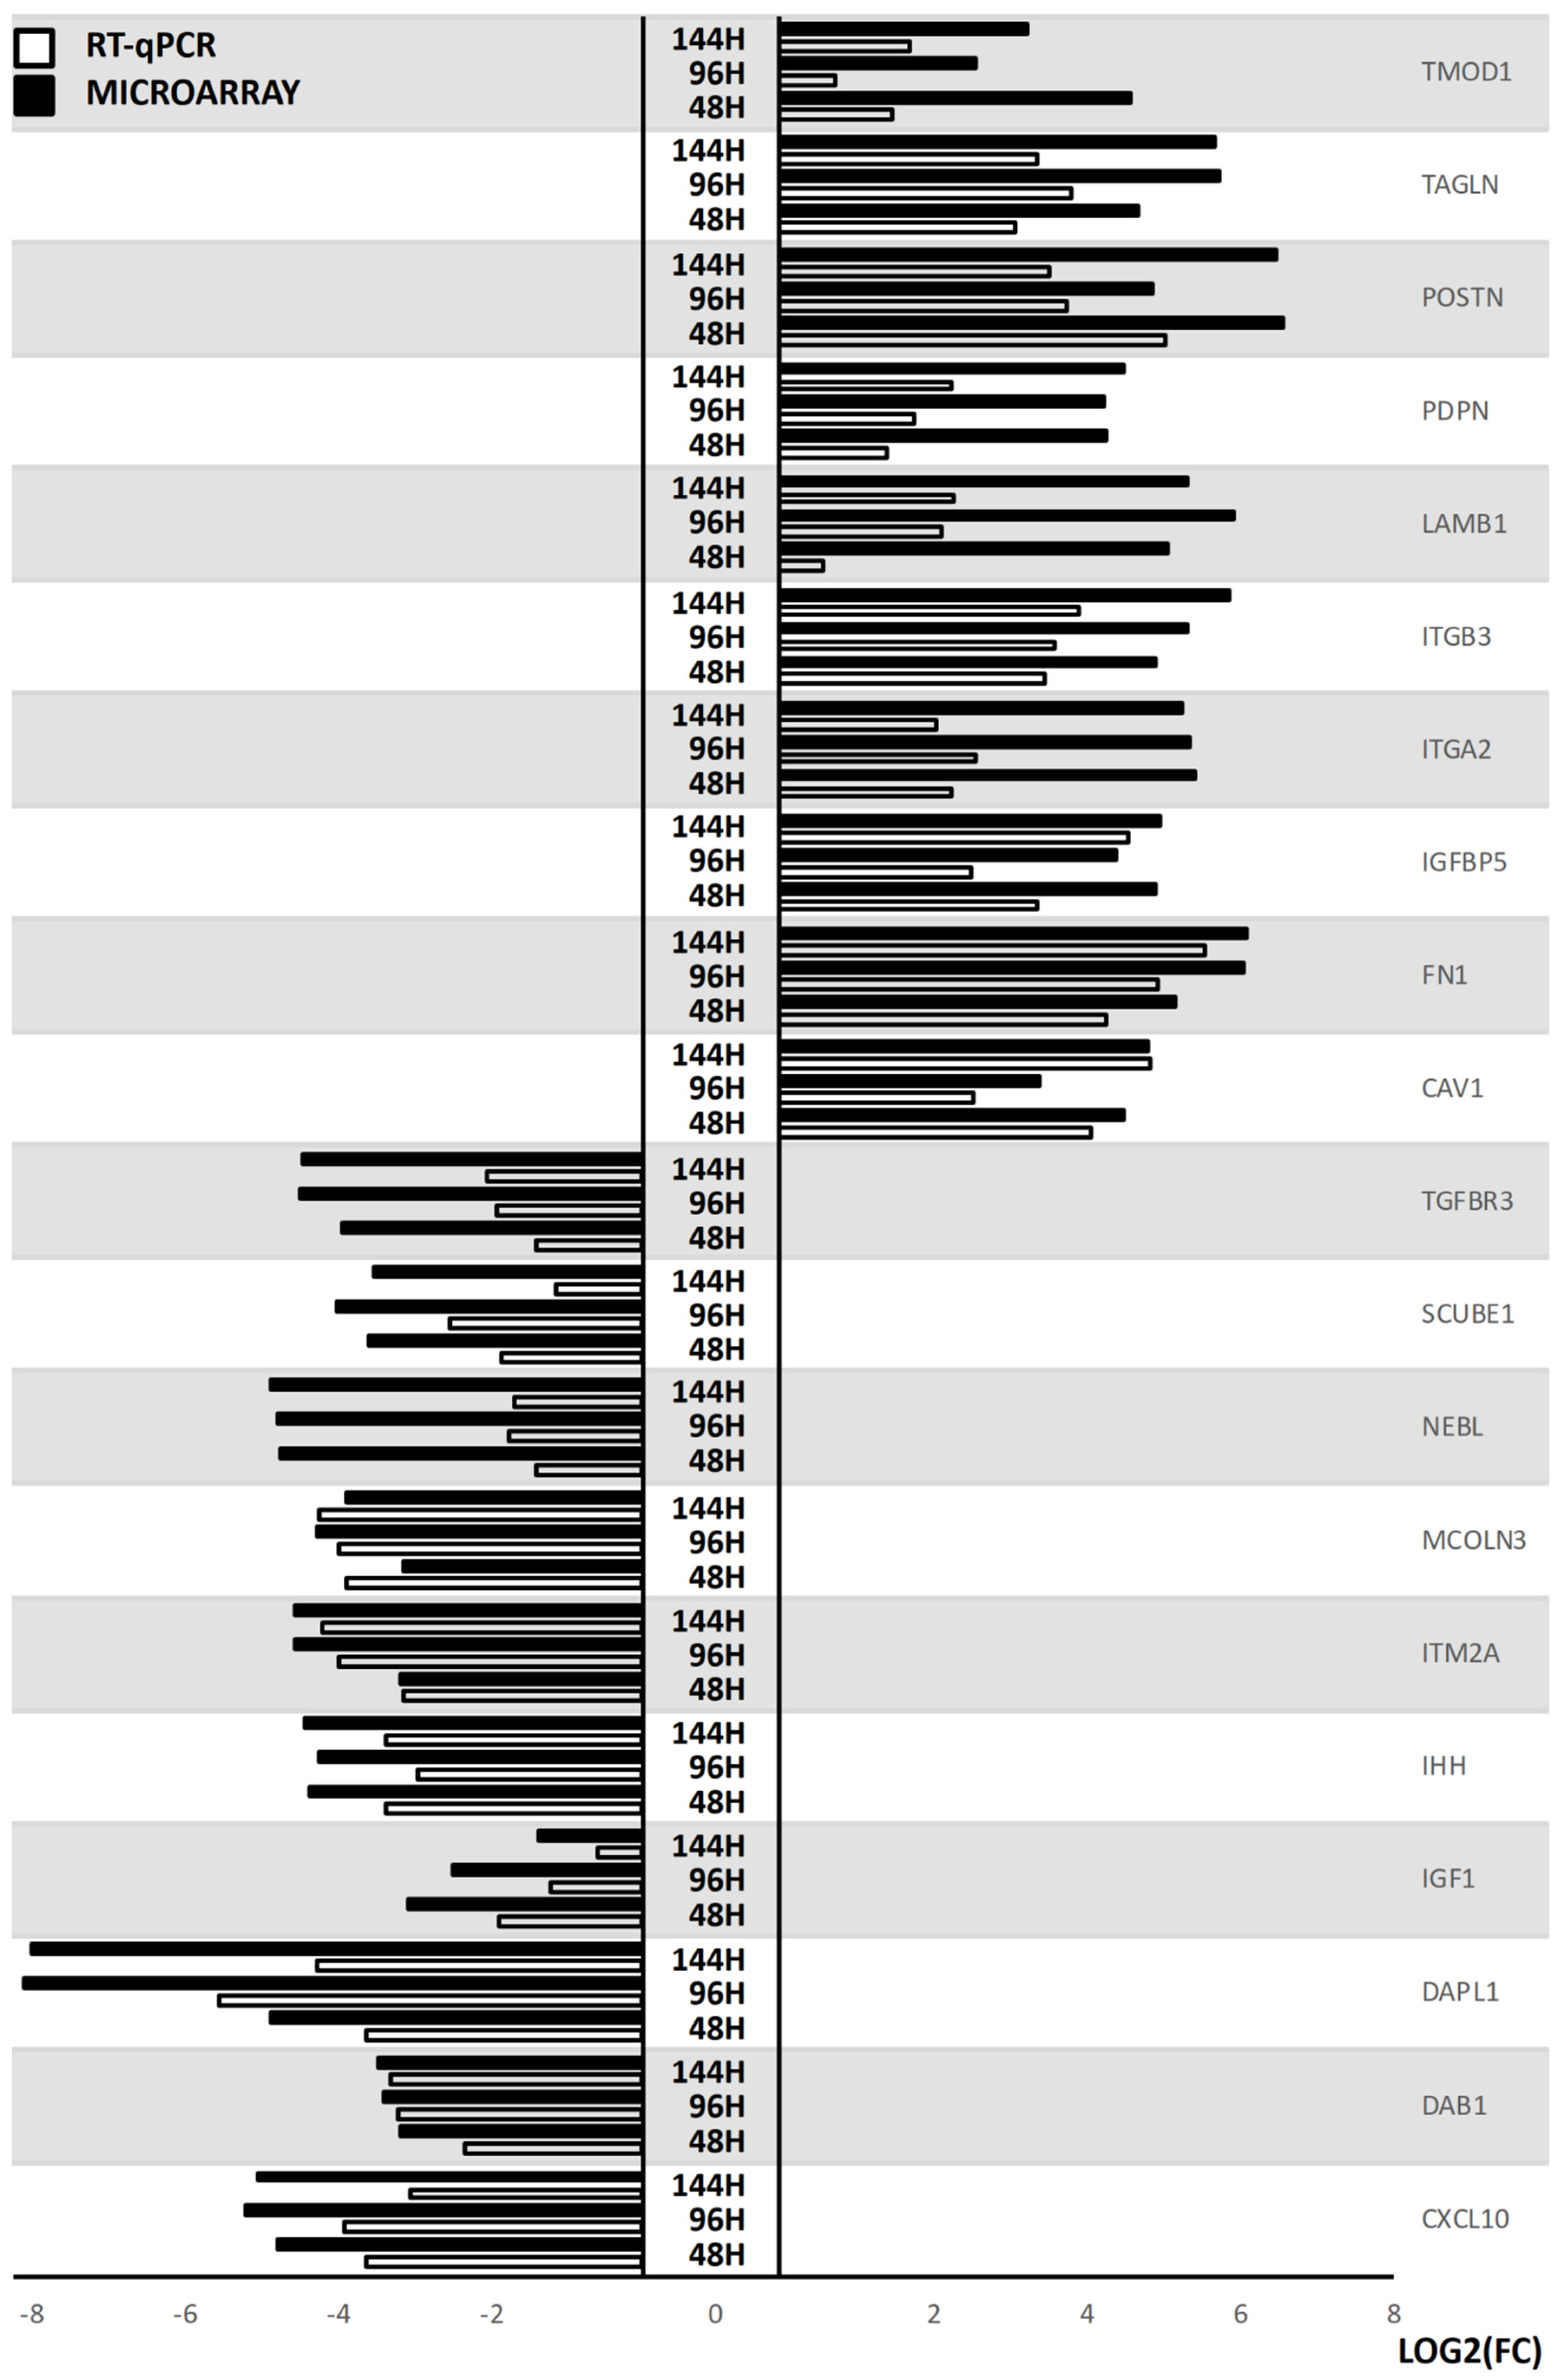
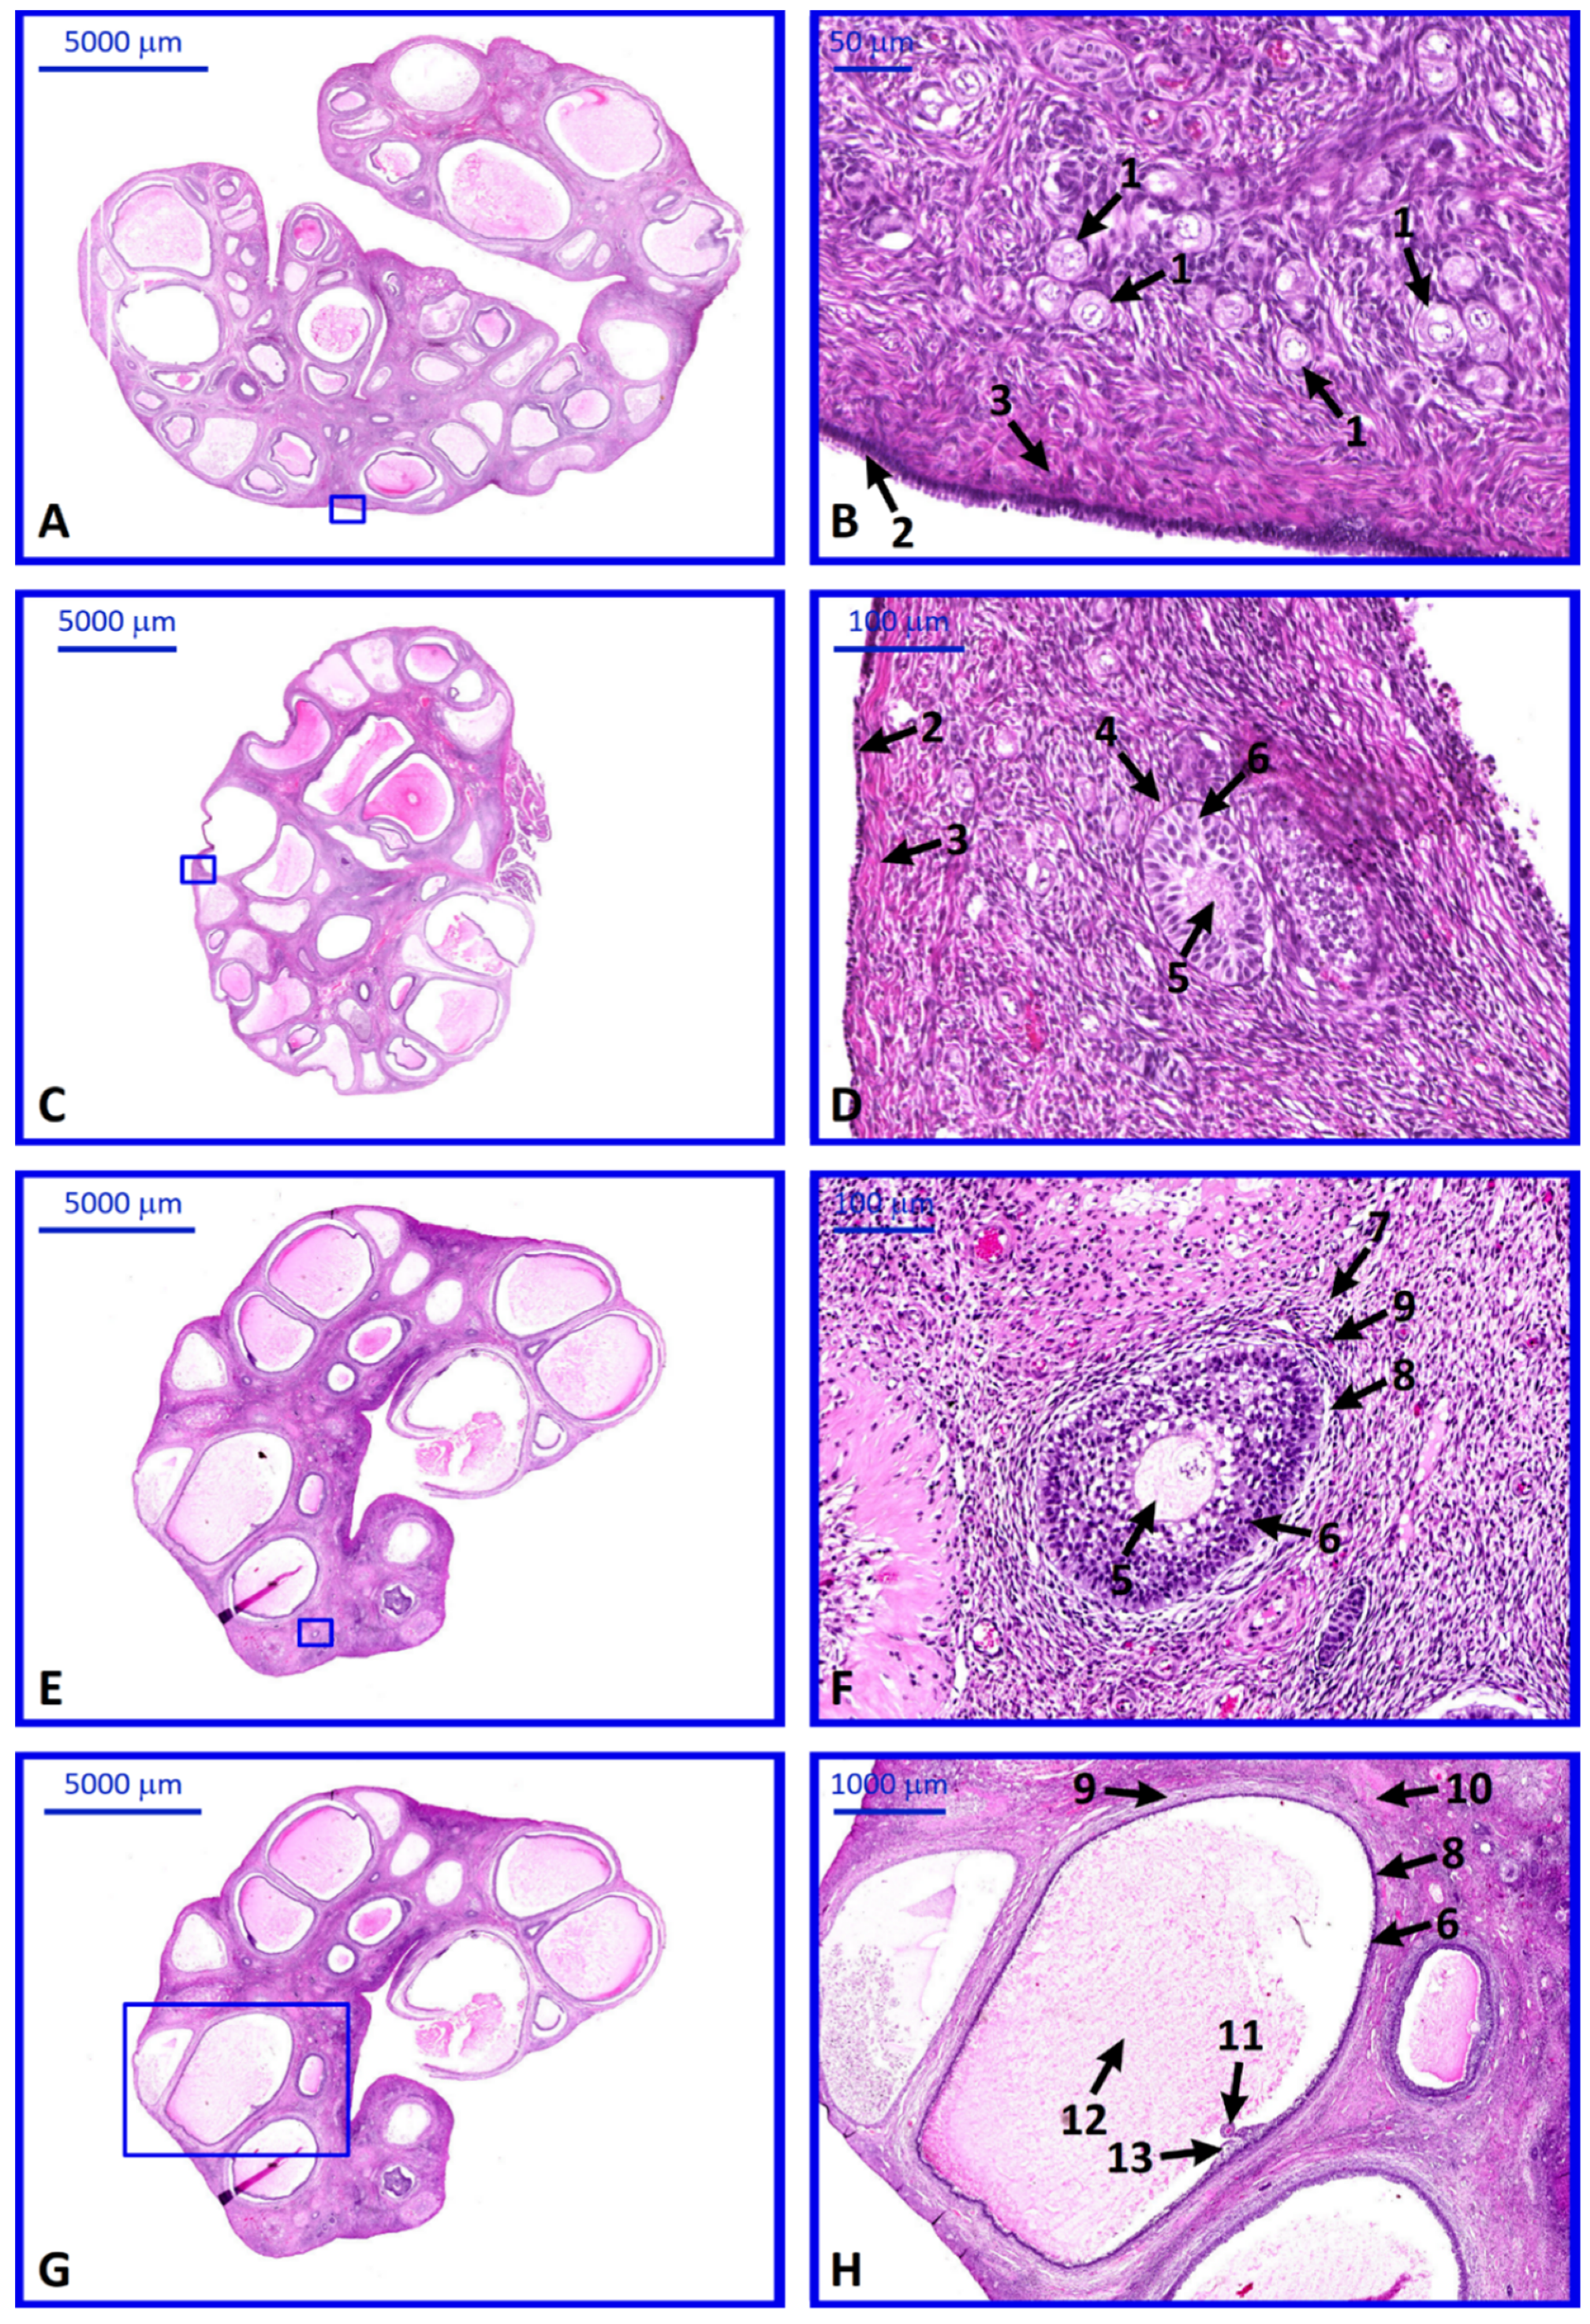
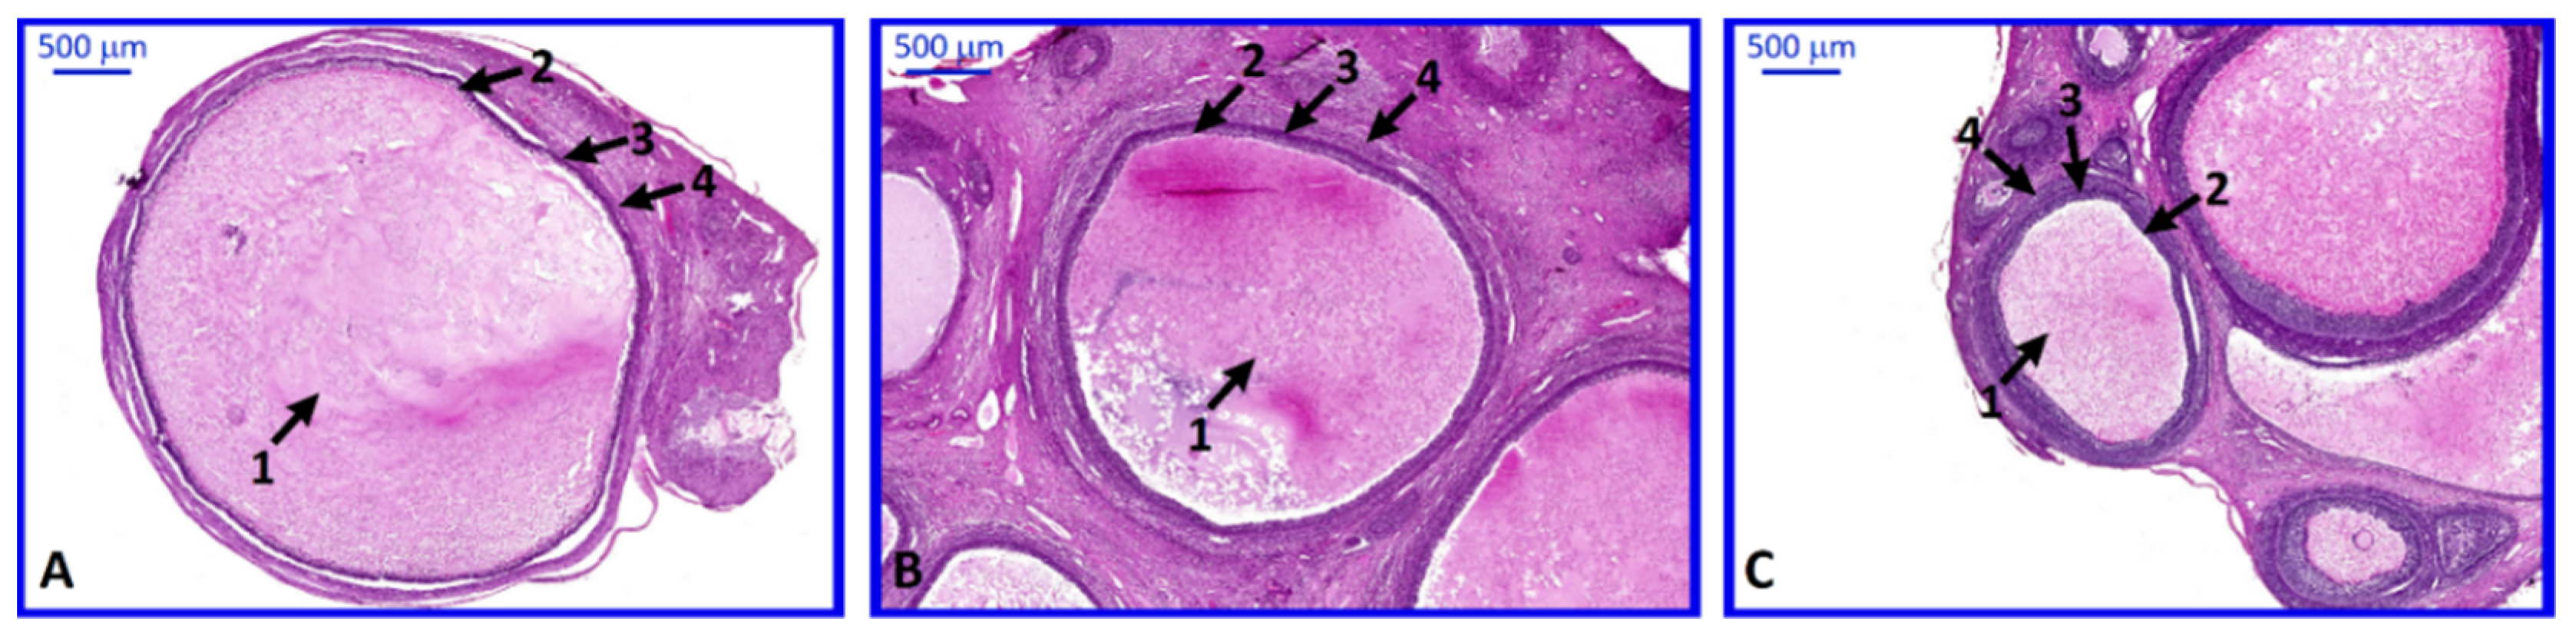
2. Results
3. Discussion
4. Materials and Methods
4.1. Animals
4.2. Collection of Porcine Ovaries and In Vitro Culture of Granulosa Cells
4.3. Histological Analysis
4.4. Microarray Expression Analysis and Statistics
4.5. Real-Time Quantitative Polymerase Chain Reaction (RT-qPCR) Analysis
Author Contributions
Funding
Acknowledgments
Conflicts of Interest
References
- Rybska, M.; Knap, S.; Jankowski, M.; Jeseta, M.; Bukowska, D.; Antosik, P.; Nowicki, M.; Zabel, M.; Kempisty, B.; Jaśkowski, J.M. Characteristic of factors influencing the proper course of folliculogenesis in mammals. Med. J. Cell Biol. 2018, 6, 33–38. [Google Scholar] [CrossRef]
- Hunter, M.G. Oocyte maturation and ovum quality in pigs. Rev. Reprod. 2000, 5, 122–130. [Google Scholar] [CrossRef] [PubMed]
- Rybska, M.; Knap, S.; Jankowski, M.; Jeseta, M.; Bukowska, D.; Antosik, P.; Nowicki, M.; Zabel, M.; Kempisty, B.; Jaśkowski, J.M. Cytoplasmic and nuclear maturation of oocytes in mammals—Living in the shadow of cells developmental capability. Med. J. Cell Biol. 2018, 6, 13–17. [Google Scholar] [CrossRef]
- Knight, P.G.; Glister, C. TGF-β superfamily members and ovarian follicle development. Reproduction 2006, 132, 191–206. [Google Scholar] [CrossRef] [PubMed]
- Kempisty, B.; Ziółkowska, A.; Piotrowska, H.; Zawierucha, P.; Antosik, P.; Bukowska, D.; Ciesiółka, S.; Jaśkowski, J.M.; Brüssow, K.P.; Nowicki, M.; et al. Real-time proliferation of porcine cumulus cells is related to the protein levels and cellular distribution of Cdk4 and Cx43. Theriogenology 2013, 80, 411–420. [Google Scholar] [CrossRef] [PubMed]
- Kranc, W.; Brązert, M.; Ożegowska, K.; Nawrocki, M.M.J.; Budna, J.; Celichowski, P.; Dyszkiewicz-Konwińska, M.; Jankowski, M.; Jeseta, M.; Pawelczyk, L.; et al. Expression Profile of Genes Regulating Steroid Biosynthesis and Metabolism in Human Ovarian Granulosa Cells—A Primary Culture Approach. Int. J. Mol. Sci. 2017, 18, 2673. [Google Scholar] [CrossRef] [PubMed]
- von Mering, C.; Jensen, L.J.; Snel, B.; Hooper, S.D.; Krupp, M.; Foglierini, M.; Jouffre, N.; Huynen, M.A.; Bork, P. STRING: known and predicted protein-protein associations, integrated and transferred across organisms. Nucleic Acids Res. 2004, 33, D433–D437. [Google Scholar] [CrossRef]
- Ciesiółka, S.; Budna, J.; Jopek, K.; Bryja, A.; Kranc, W.; Chachuła, A.; Borys, S.; Dyszkiewicz Konwińska, M.; Ziółkowska, A.; Antosik, P.; et al. Influence of Estradiol-17beta on Progesterone and Estrogen Receptor mRNA Expression in Porcine Follicular Granulosa Cells during Short-Term, in Vitro Real-Time Cell Proliferation. Biomed Res. Int. 2016, 2016, 1–8. [Google Scholar] [CrossRef]
- Kranc, W.; Budna, J.; Kahan, R.; Chachuła, A.; Bryja, A.; Ciesiółka, S.; Borys, S.; Antosik, M.P.; Bukowska, D.; Brussow, K.P.; et al. Molecular basis of growth, proliferation, and differentiation of mammalian follicular granulosa cells. J. Biol. Regul. Homeost. Agents 2017, 31, 1–8. [Google Scholar]
- Kranc, W.; Chachuła, A.; Wojtanowicz-Markiewicz, K.; Ociepa, E.; Bukowska, D.; Borys, S.; Piotrowska, H.; Bryja, A.; Antosik, P.; Klaus, P.; et al. The Insight into Developmental Capacity of Mammalian Cocs and Cumulus-Granulosa Cells-Recent Studies and Perspectives. Austin J. Invit. Fertil. 2015, 2, 1023–1027. [Google Scholar]
- Fraser, H.M.; Wulff, C. Angiogenesis in the corpus luteum. Reprod. Biol. Endocrinol. 2003, 1, 88. [Google Scholar] [CrossRef] [PubMed]
- Kranc, W.; Chachuła, A.; Bryja, A.; Ciesiółka, S.; Budna, J.; Wojtanowicz-Markiewicz, K.; Sumelka, E.; Borys, S.; Antosik, P.; Bukowska, D.; et al. Selected molecular and physiological aspects of mammalian ovarian granulosa cells in primary culture. Med. Weter. 2016, 72, 723–727. [Google Scholar] [CrossRef]
- Kranc, W.; Brązert, M.; Budna, J.; Celichowski, P.; Bryja, A.; Nawrocki, M.J.; Ożegowska, K.; Jankowski, M.; Chermuła, B.; Dyszkiewicz-Konwińska, M.; et al. Genes responsible for proliferation, differentiation, and junction adhesion are significantly up-regulated in human ovarian granulosa cells during a long-term primary in vitro culture. Histochem. Cell Biol. 2018. [Google Scholar] [CrossRef] [PubMed]
- Kossowska-Tomaszczuk, K.; De Geyter, C.; De Geyter, M.; Martin, I.; Holzgreve, W.; Scherberich, A.; Zhang, H. The Multipotency of Luteinizing Granulosa Cells Collected from Mature Ovarian Follicles. Stem Cells 2009, 27, 210–219. [Google Scholar] [CrossRef] [PubMed]
- Salilew-Wondim, D.; Ibrahim, S.; Gebremedhn, S.; Tesfaye, D.; Heppelmann, M.; Bollwein, H.; Pfarrer, C.; Tholen, E.; Neuhoff, C.; Schellander, K.; et al. Clinical and subclinical endometritis induced alterations in bovine endometrial transcriptome and miRNome profile. BMC Genomics 2016, 17, 218. [Google Scholar] [CrossRef] [PubMed]
- Liu, G.Y.; Xiong, Y.Z. Isolation, sequence analysis and expression profile of a novel porcine gene, CXCL10, differentially expressed in the Longissimus dorsi muscle tissues from Meishan, Meishan × Large White cross and Large White pigs. DNA Seq. 2007, 18, 415–422. [Google Scholar] [CrossRef]
- Hernandez, D.A.; Bennett, C.M.; Dunina-Barkovskaya, L.; Wedig, T.; Capetanaki, Y.; Herrmann, H.; Conover, G.M. Nebulette is a powerful cytolinker organizing desmin and actin in mouse hearts. Mol. Biol. Cell 2016, 27, 3869–3882. [Google Scholar] [CrossRef]
- Komori, T. Regulation of Proliferation, Differentiation and Functions of Osteoblasts by Runx2. Int. J. Mol. Sci. 2019, 20, 1694. [Google Scholar] [CrossRef]
- DeLaughter, D.M.; Clark, C.R.; Christodoulou, D.C.; Seidman, C.E.; Baldwin, H.S.; Seidman, J.G.; Barnett, J.V. Transcriptional Profiling of Cultured, Embryonic Epicardial Cells Identifies Novel Genes and Signaling Pathways Regulated by TGFβR3 In Vitro. PLoS ONE 2016, 11, e0159710. [Google Scholar] [CrossRef]
- Morén, A.; Ichijo, H.; Miyazono, K. Molecular cloning and characterization of the human and porcine transforming growth factor-beta type III receptors. Biochem. Biophys. Res. Commun. 1992, 189, 356–362. [Google Scholar] [CrossRef]
- Yang, R.-B.; Ng, C.K.D.; Wasserman, S.M.; Colman, S.D.; Shenoy, S.; Mehraban, F.; Kömüves, L.G.; Tomlinson, J.E.; Topper, J.N. Identification of a Novel Family of Cell-surface Proteins Expressed in Human Vascular Endothelium. J. Biol. Chem. 2002, 277, 46364–46373. [Google Scholar] [CrossRef] [PubMed]
- Long, H.; Bock, H.H.; Lei, T.; Chai, X.; Yuan, J.; Herz, J.; Frotscher, M.; Yang, Z. Identification of alternatively spliced Dab1 and Fyn isoforms in pig. BMC Neurosci. 2011, 12, 17. [Google Scholar] [CrossRef] [PubMed]
- Liu, G.Y.; Ge, C.R.; Zhang, X.; Gao, S.Z. Isolation, sequence identification and tissue expression distribution of three novel porcine genes—RAB14, S35A3 and ITM2A. Mol. Biol. Rep. 2008, 35, 201–206. [Google Scholar] [CrossRef] [PubMed]
- Uenishi, H.; Eguchi-Ogawa, T.; Shinkai, H.; Okumura, N.; Suzuki, K.; Toki, D.; Hamasima, N.; Awata, T. PEDE (Pig EST Data Explorer) has been expanded into Pig Expression Data Explorer, including 10 147 porcine full-length cDNA sequences. Nucleic Acids Res. 2007, 35, D650–D653. [Google Scholar] [CrossRef] [PubMed]
- Martina, J.A.; Lelouvier, B.; Puertollano, R. The Calcium Channel Mucolipin-3 is a Novel Regulator of Trafficking Along the Endosomal Pathway. Traffic 2009, 10, 1143–1156. [Google Scholar] [CrossRef]
- Sirotkin, A.V.; Florkovičová (Koničková), I.; Schaeffer, H.-J.; Laurincik, J.; Harrath, A.H. Interrelationships between ovarian follicles grown in culture and possible mediators. Reprod. Biol. 2017, 17, 97–104. [Google Scholar] [CrossRef]
- Shindo, K.; Aishima, S.; Ohuchida, K.; Fujiwara, K.; Fujino, M.; Mizuuchi, Y.; Hattori, M.; Mizumoto, K.; Tanaka, M.; Oda, Y. Podoplanin expression in cancer-associated fibroblasts enhances tumor progression of invasive ductal carcinoma of the pancreas. Mol. Cancer 2013, 12, 168. [Google Scholar] [CrossRef]
- Buhrke, T.; Lengler, I.; Lampen, A. Analysis of proteomic changes induced upon cellular differentiation of the human intestinal cell line Caco-2. Dev. Growth Differ. 2011, 53, 411–426. [Google Scholar] [CrossRef]
- Dyszkiewicz-Konwińska, M.; Bryja, A.; Jopek, K.; Budna, J.; Khozmi, R.; Jeseta, M.; Bukowska, D.; Antosik, P.; Bruska, M.; Nowicki, M.; et al. Expression of genes responsible for cell morphogenesis involved in differentiation in porcine buccal pouch mucosal cells during long-term primary culture and real-time proliferation in vitro. J. Biol. Regul. Homeost. Agents 2017, 31, 855–864. [Google Scholar]
- Singh, P.; Carraher, C.; Schwarzbauer, J.E. Assembly of fibronectin extracellular matrix. Annu. Rev. Cell Dev. Biol. 2010, 26, 397–419. [Google Scholar] [CrossRef]
- Miner, J.H.; Li, C.; Mudd, J.L.; Go, G.; Sutherland, A.E. Compositional and structural requirements for laminin and basement membranes during mouse embryo implantation and gastrulation. Development 2004, 131, 2247–2256. [Google Scholar] [CrossRef] [PubMed]
- Li, H.; Yu, T.; Ma, Y.; Wang, H. Expression of Laminin gene family in porcine pluripotent stem cells. Sheng Wu Gong Cheng Xue Bao 2017, 33, 1304–1314. [Google Scholar] [CrossRef] [PubMed]
- Hwang, K.-C.; Lee, H.-Y.; Cui, X.-S.; Kim, J.-H.; Kim, N.H. Identification of maternal mRNAs in porcine parthenotes at the 2-cell stage: A comparison with the blastocyst stage. Mol. Reprod. Dev. 2005, 70, 314–323. [Google Scholar] [CrossRef] [PubMed]
- Chermuła, B.; Brązert, M.; Iżycki, D.; Ciesiółka, S.; Kranc, W.; Celichowski, P.; Ożegowska, K.; Nawrocki, M.J.; Jankowski, M.; Jeseta, M.; et al. New Gene Markers of Angiogenesis and Blood Vessels Development in Porcine Ovarian Granulosa Cells during Short-Term Primary Culture In Vitro. Biomed Res. Int. 2019, 2019, 6545210. [Google Scholar] [CrossRef] [PubMed]
- Gorodkin, J.; Cirera, S.; Hedegaard, J.; Gilchrist, M.J.; Panitz, F.; Jørgensen, C.; Scheibye-Knudsen, K.; Arvin, T.; Lumholdt, S.; Sawera, M.; et al. Porcine transcriptome analysis based on 97 non-normalized cDNA libraries and assembly of 1,021,891 expressed sequence tags. Genome Biol. 2007, 8, R45. [Google Scholar] [CrossRef] [PubMed]
- Ge, Z.-J.; Schatten, H.; Zhang, C.-L.; Sun, Q.-Y. Oocyte ageing and epigenetics. REPRODUCTION 2015, 149, R103–R114. [Google Scholar] [CrossRef] [PubMed]
- Burnik Papler, T.; Vrtačnik Bokal, E.; Prosenc Zmrzljak, U.; Stimpfel, M.; Laganà, A.S.; Ghezzi, F.; Jančar, N. PGR and PTX3 gene expression in cumulus cells from obese and normal weighting women after administration of long-acting recombinant follicle-stimulating hormone for controlled ovarian stimulation. Arch. Gynecol. Obstet. 2019, 299, 863–871. [Google Scholar] [CrossRef] [PubMed]
- Trejter, M.; Hochol, A.; Tyczewska, M.; Ziolkowska, A.; Jopek, K.; Szyszka, M.; Malendowicz, L.K.; Rucinski, M. Sex-related gene expression profiles in the adrenal cortex in the mature rat: microarray analysis with emphasis on genes involved in steroidogenesis. Int. J. Mol. Med. 2015, 35, 702–714. [Google Scholar] [CrossRef]
- Chamier-Gliszczyńska, A.; Brązert, M.; Sujka-Kordowska, P.; Popis, M.; Ożegowska, K.; Stefańska, K.; Kocherova, I.; Celichowski, P.; Kulus, M.; Bukowska, D.; et al. Genes involved in angiogenesis and circulatory system development are differentially expressed in porcine epithelial oviductal cells during long-term primary in vitro culture—A transcriptomic study. Med. J. Cell Biol. 2018, 6, 163–173. [Google Scholar] [CrossRef]
- Nawrocki, M.J.; Celichowski, P.; Jankowski, M.; Kranc, W.; Bryja, A.; Borys-Wójcik, S.; Jeseta, M.; Antosik, P.; Bukowska, D.; Bruska, M.; et al. Ontology groups representing angiogenesis and blood vessels development are highly up-regulated during porcine oviductal epithelial cells long-term real-time proliferation—A primary cell culture approach. Med. J. Cell Biol. 2018, 6, 186–194. [Google Scholar] [CrossRef]
- Stefańska, K.; Chamier-Gliszczyńska, A.; Jankowski, M.; Celichowski, P.; Kulus, M.; Rojewska, M.; Antosik, P.; Bukowska, D.; Bruska, M.; Nowicki, M.; et al. Epithelium morphogenesis and oviduct development are regulated by significant increase of expression of genes after long-term in vitro primary culture—A microarray assays. Med. J. Cell Biol. 2018, 6, 195–204. [Google Scholar] [CrossRef]
- Kranc, W.; Brązert, M.; Ożegowska, K.; Budna-Tukan, J.; Celichowski, P.; Jankowski, M.; Bryja, A.; Nawrocki, M.J.; Popis, M.; Jeseta, M.; et al. Response to abiotic and organic substances stimulation belongs to ontologic groups significantly up-regulated in porcine immature oocytes. Med. J. Cell Biol. 2018. [Google Scholar] [CrossRef]
- Borys-Wójcik, S.; Kocherova, I.; Celichowski, P.; Popis, M.; Jeseta, M.; Bukowska, D.; Antosik, P.; Nowicki, M.; Kempisty, B. Protein oligomerization is the biochemical process highly up-regulated in porcine oocytes before in vitro maturation (IVM). Med. J. Cell Biol. 2018, 6, 155–162. [Google Scholar] [CrossRef]
- Budna, J.; Celichowski, P.; Bryja, A.; Jeseta, M.; Jankowski, M.; Bukowska, D.; Antosik, P.; Nowicki, A.; Brüssow, K.P.; Bruska, M.; et al. Expression Changes in Fatty acid Metabolic Processrelated Genes in Porcine Oocytes During in Vitro Maturation. Med. J. Cell Biol. 2018, 6, 48–54. [Google Scholar] [CrossRef]
- Huang, D.W.; Sherman, B.T.; Tan, Q.; Kir, J.; Liu, D.; Bryant, D.; Guo, Y.; Stephens, R.; Baseler, M.W.; Lane, H.C.; et al. DAVID Bioinformatics Resources: expanded annotation database and novel algorithms to better extract biology from large gene lists. Nucleic Acids Res. 2007, 35, W169–W175. [Google Scholar] [CrossRef] [PubMed]


| Gene | FC 48 h/0 h | FC 96 h/0 h | FC 14 h4/0 h | p Value 48 h/0 h | p Value 96 h/0 h | p Value 144 h/0 h | Entrez ID |
|---|---|---|---|---|---|---|---|
| CXCL10 | 0.036689 | 0.027744 | 0.030979 | 3.47 × 10⁶ | 1.07 × 10⁶ | 1.53 × 10⁶ | 3627 |
| DAB1 | 0.112175 | 0.096043 | 0.092698 | 3.33 × 10⁶ | 1.07 × 10⁶ | 1.26 × 10⁶ | 1600 |
| DAPL1 | 0.03486 | 0.003772 | 0.004046 | 1.00 × 10⁶ | 9.14 × 10⁸ | 9.57 × 10⁸ | 92196 |
| IGF1 | 0.119841 | 0.180781 | 0.391369 | 9.96 × 10⁵ | 0.000172 | 0.006284 | 3479 |
| IHH | 0.049771 | 0.0538 | 0.047738 | 2.16 × 10⁶ | 1.06 × 10⁶ | 1.09 × 10⁶ | 3549 |
| ITM2A | 0.11303 | 0.043537 | 0.042942 | 7.74 × 10⁶ | 7.05 × 10⁷ | 8.20 × 10⁷ | 9452 |
| MCOLN3 | 0.114236 | 0.052489 | 0.068606 | 9.09 × 10⁶ | 1.06 × 10⁶ | 1.98 × 10⁶ | 55283 |
| NEBL | 0.037428 | 0.037303 | 0.034729 | 9.56 × 10⁷ | 3.68 × 10⁷ | 4.09 × 10⁷ | 10529 |
| SCUBE1 | 0.084451 | 0.063451 | 0.087118 | 4.12 × 10⁶ | 1.09 × 10⁶ | 2.53 × 10⁶ | 80274 |
| TGFBR3 | 0.065878 | 0.045288 | 0.04622 | 4.56 × 10⁷ | 1.51 × 10⁷ | 1.50 × 10⁷ | 7049 |
| CAV1 | 22.31557 | 10.4332 | 28.12126 | 4.28 × 10⁷ | 4.59 × 10⁷ | 1.50 × 10⁷ | 857 |
| FN1 | 35.37896 | 66.1651 | 68.74185 | 3.59 × 10⁷ | 9.92 × 10⁸ | 9.57 × 10⁸ | 2335 |
| IGFBP5 | 29.89599 | 20.97384 | 31.2743 | 4.42 × 10⁷ | 3.09 × 10⁷ | 2.28 × 10⁷ | 3488 |
| ITGA2 | 42.67896 | 41.0013 | 38.26346 | 3.52 × 10⁷ | 1.21 × 10⁷ | 1.26 × 10⁷ | 3673 |
| ITGB3 | 29.91255 | 39.85199 | 57.68212 | 3.52 × 10⁷ | 1.21 × 10⁷ | 9.57 × 10⁸ | 3690 |
| LAMB1 | 33.30078 | 60.54652 | 39.6371 | 3.52 × 10⁷ | 9.14 × 10⁸ | 9.57 × 10⁸ | 3912 |
| HPDPN | 18.98888 | 18.65575 | 22.39775 | 2.14 × 10⁵ | 1.11 × 10⁵ | 1.07 × 10⁵ | 10630 |
| POSTN | 95.22897 | 29.49005 | 88.94606 | 3.52 × 10⁷ | 1.80 × 10⁷ | 9.57 × 10⁸ | 10631 |
| TAGLN | 25.56666 | 53.77139 | 50.96687 | 3.52 × 10⁷ | 9.14 × 10⁸ | 9.57 × 10⁸ | 6876 |
| TMOD1 | 23.71613 | 5.946509 | 9.468941 | 1.00 × 10⁶ | 6.63 × 10⁶ | 2.71 × 10⁶ | 7111 |
| Gene | Gene ID | Primer Sequence (5′–3′) | Product Size (bp) |
|---|---|---|---|
| CXCL10 | 494019 | CTCCTGAAAGGCCCATCATA GCACATGGGATAGAGGAGGA | 193 |
| DAB1 | 100037307 | TACGTTTGTGGGAAGGAAGG CTTCCTTCTTTTGGCTGGTG | 202 |
| DAPL1 | 100157537 | CCTGCTCTGGAGAAGGTCAC GGGCCTAAGGAAAGTTTTGG | 151 |
| IGF1 | 47523587 | TTCTACTTGGCCCTGTGCTT CTCCAGCCTCCTCAGATCAC | 222 |
| IHH | 397174 | CTCCACTGCCCTCTCAGAAC AGCTCGCAGCTGTGTCACTA | 182 |
| ITM2A | 595131 | TCTCGTAGGCCTTTCCTTCA AGGCAGGAAGTAGGGCTCTC | 163 |
| MCOLN3 | 100625693 | TCCGAGTGCCTTTTCTCACT CGGATATAAACGTGCGGAGT | 238 |
| NEBL | 100522395 | CAAACCCTTCAAGGCTACCA CTGAGAACACGCTTCCATCA | 177 |
| SCUBE1 | 100524621 | AATCCAATGAAGCCAACAGC AGGGCCTTGATCAGCTTCTT | 160 |
| TGFBR3 | 397512 | TTTGTTTTAGCTGGGGGTTG TGGCCACAGGGATTTTTAAG | 177 |
| CAV1 | 404693 | TAGGTCAGCAGCCTCCCTAA CTGGTGAGAGGCAGGAAAAG | 243 |
| FN1 | 397620 | TGAGCCTGAAGAGACCTGCT CAGCTCCAATGCAGGTACAG | 113 |
| IGFBP5 | 397182 | TGGGGGTTTGTTTCTCTGAC TTCTGGCAGGTAGAGCAGGT | 181 |
| ITGA2 | 397483 | CATGCCAGATCCCTTCATCT CGCTTAAGGCTTGGAAACTG | 153 |
| ITGB3 | 397063 | GGCTTCAAAGACAGCCTCAC AGTCCTTTTCCGAGCACTCA | 175 |
| LAMB1 | 396707 | CTTCACCACCTTGGACCACT AGCTGTGGCTCATAGCGAAT | 216 |
| PDPN | 100738269 | AGCAGATGCTGTGTCCCTCT TATGGAACCTGGGCTGGTAG | 201 |
| POSTN | 100152401 | ATTGACCGTGTCCTCACACA GCCACTTTGTCTCCCATGAT | 212 |
| TAGLN | 397021 | TTAAAGGCCGCTGAGGACTA ATGACATGCTTTCCCTCCTG | 233 |
| TMOD1 | 100316850 | AGCCCTAACGGAAGAAGAGC CCTTTGCTTGCTTTTCCAAG | 170 |
© 2019 by the authors. Licensee MDPI, Basel, Switzerland. This article is an open access article distributed under the terms and conditions of the Creative Commons Attribution (CC BY) license (http://creativecommons.org/licenses/by/4.0/).
Share and Cite
Kulus, M.; Sujka-Kordowska, P.; Konwerska, A.; Celichowski, P.; Kranc, W.; Kulus, J.; Piotrowska-Kempisty, H.; Antosik, P.; Bukowska, D.; Iżycki, D.; et al. New Molecular Markers Involved in Regulation of Ovarian Granulosa Cell Morphogenesis, Development and Differentiation during Short-Term Primary In Vitro Culture—Transcriptomic and Histochemical Study Based on Ovaries and Individual Separated Follicles. Int. J. Mol. Sci. 2019, 20, 3966. https://doi.org/10.3390/ijms20163966
Kulus M, Sujka-Kordowska P, Konwerska A, Celichowski P, Kranc W, Kulus J, Piotrowska-Kempisty H, Antosik P, Bukowska D, Iżycki D, et al. New Molecular Markers Involved in Regulation of Ovarian Granulosa Cell Morphogenesis, Development and Differentiation during Short-Term Primary In Vitro Culture—Transcriptomic and Histochemical Study Based on Ovaries and Individual Separated Follicles. International Journal of Molecular Sciences. 2019; 20(16):3966. https://doi.org/10.3390/ijms20163966
Chicago/Turabian StyleKulus, Magdalena, Patrycja Sujka-Kordowska, Aneta Konwerska, Piotr Celichowski, Wiesława Kranc, Jakub Kulus, Hanna Piotrowska-Kempisty, Paweł Antosik, Dorota Bukowska, Dariusz Iżycki, and et al. 2019. "New Molecular Markers Involved in Regulation of Ovarian Granulosa Cell Morphogenesis, Development and Differentiation during Short-Term Primary In Vitro Culture—Transcriptomic and Histochemical Study Based on Ovaries and Individual Separated Follicles" International Journal of Molecular Sciences 20, no. 16: 3966. https://doi.org/10.3390/ijms20163966
APA StyleKulus, M., Sujka-Kordowska, P., Konwerska, A., Celichowski, P., Kranc, W., Kulus, J., Piotrowska-Kempisty, H., Antosik, P., Bukowska, D., Iżycki, D., Bruska, M., Zabel, M., Nowicki, M., & Kempisty, B. (2019). New Molecular Markers Involved in Regulation of Ovarian Granulosa Cell Morphogenesis, Development and Differentiation during Short-Term Primary In Vitro Culture—Transcriptomic and Histochemical Study Based on Ovaries and Individual Separated Follicles. International Journal of Molecular Sciences, 20(16), 3966. https://doi.org/10.3390/ijms20163966