From Green Remediation to Polymer Hybrid Fabrication with Improved Optical Band Gaps


Abstract

1. Introduction
2. Results and Discussion
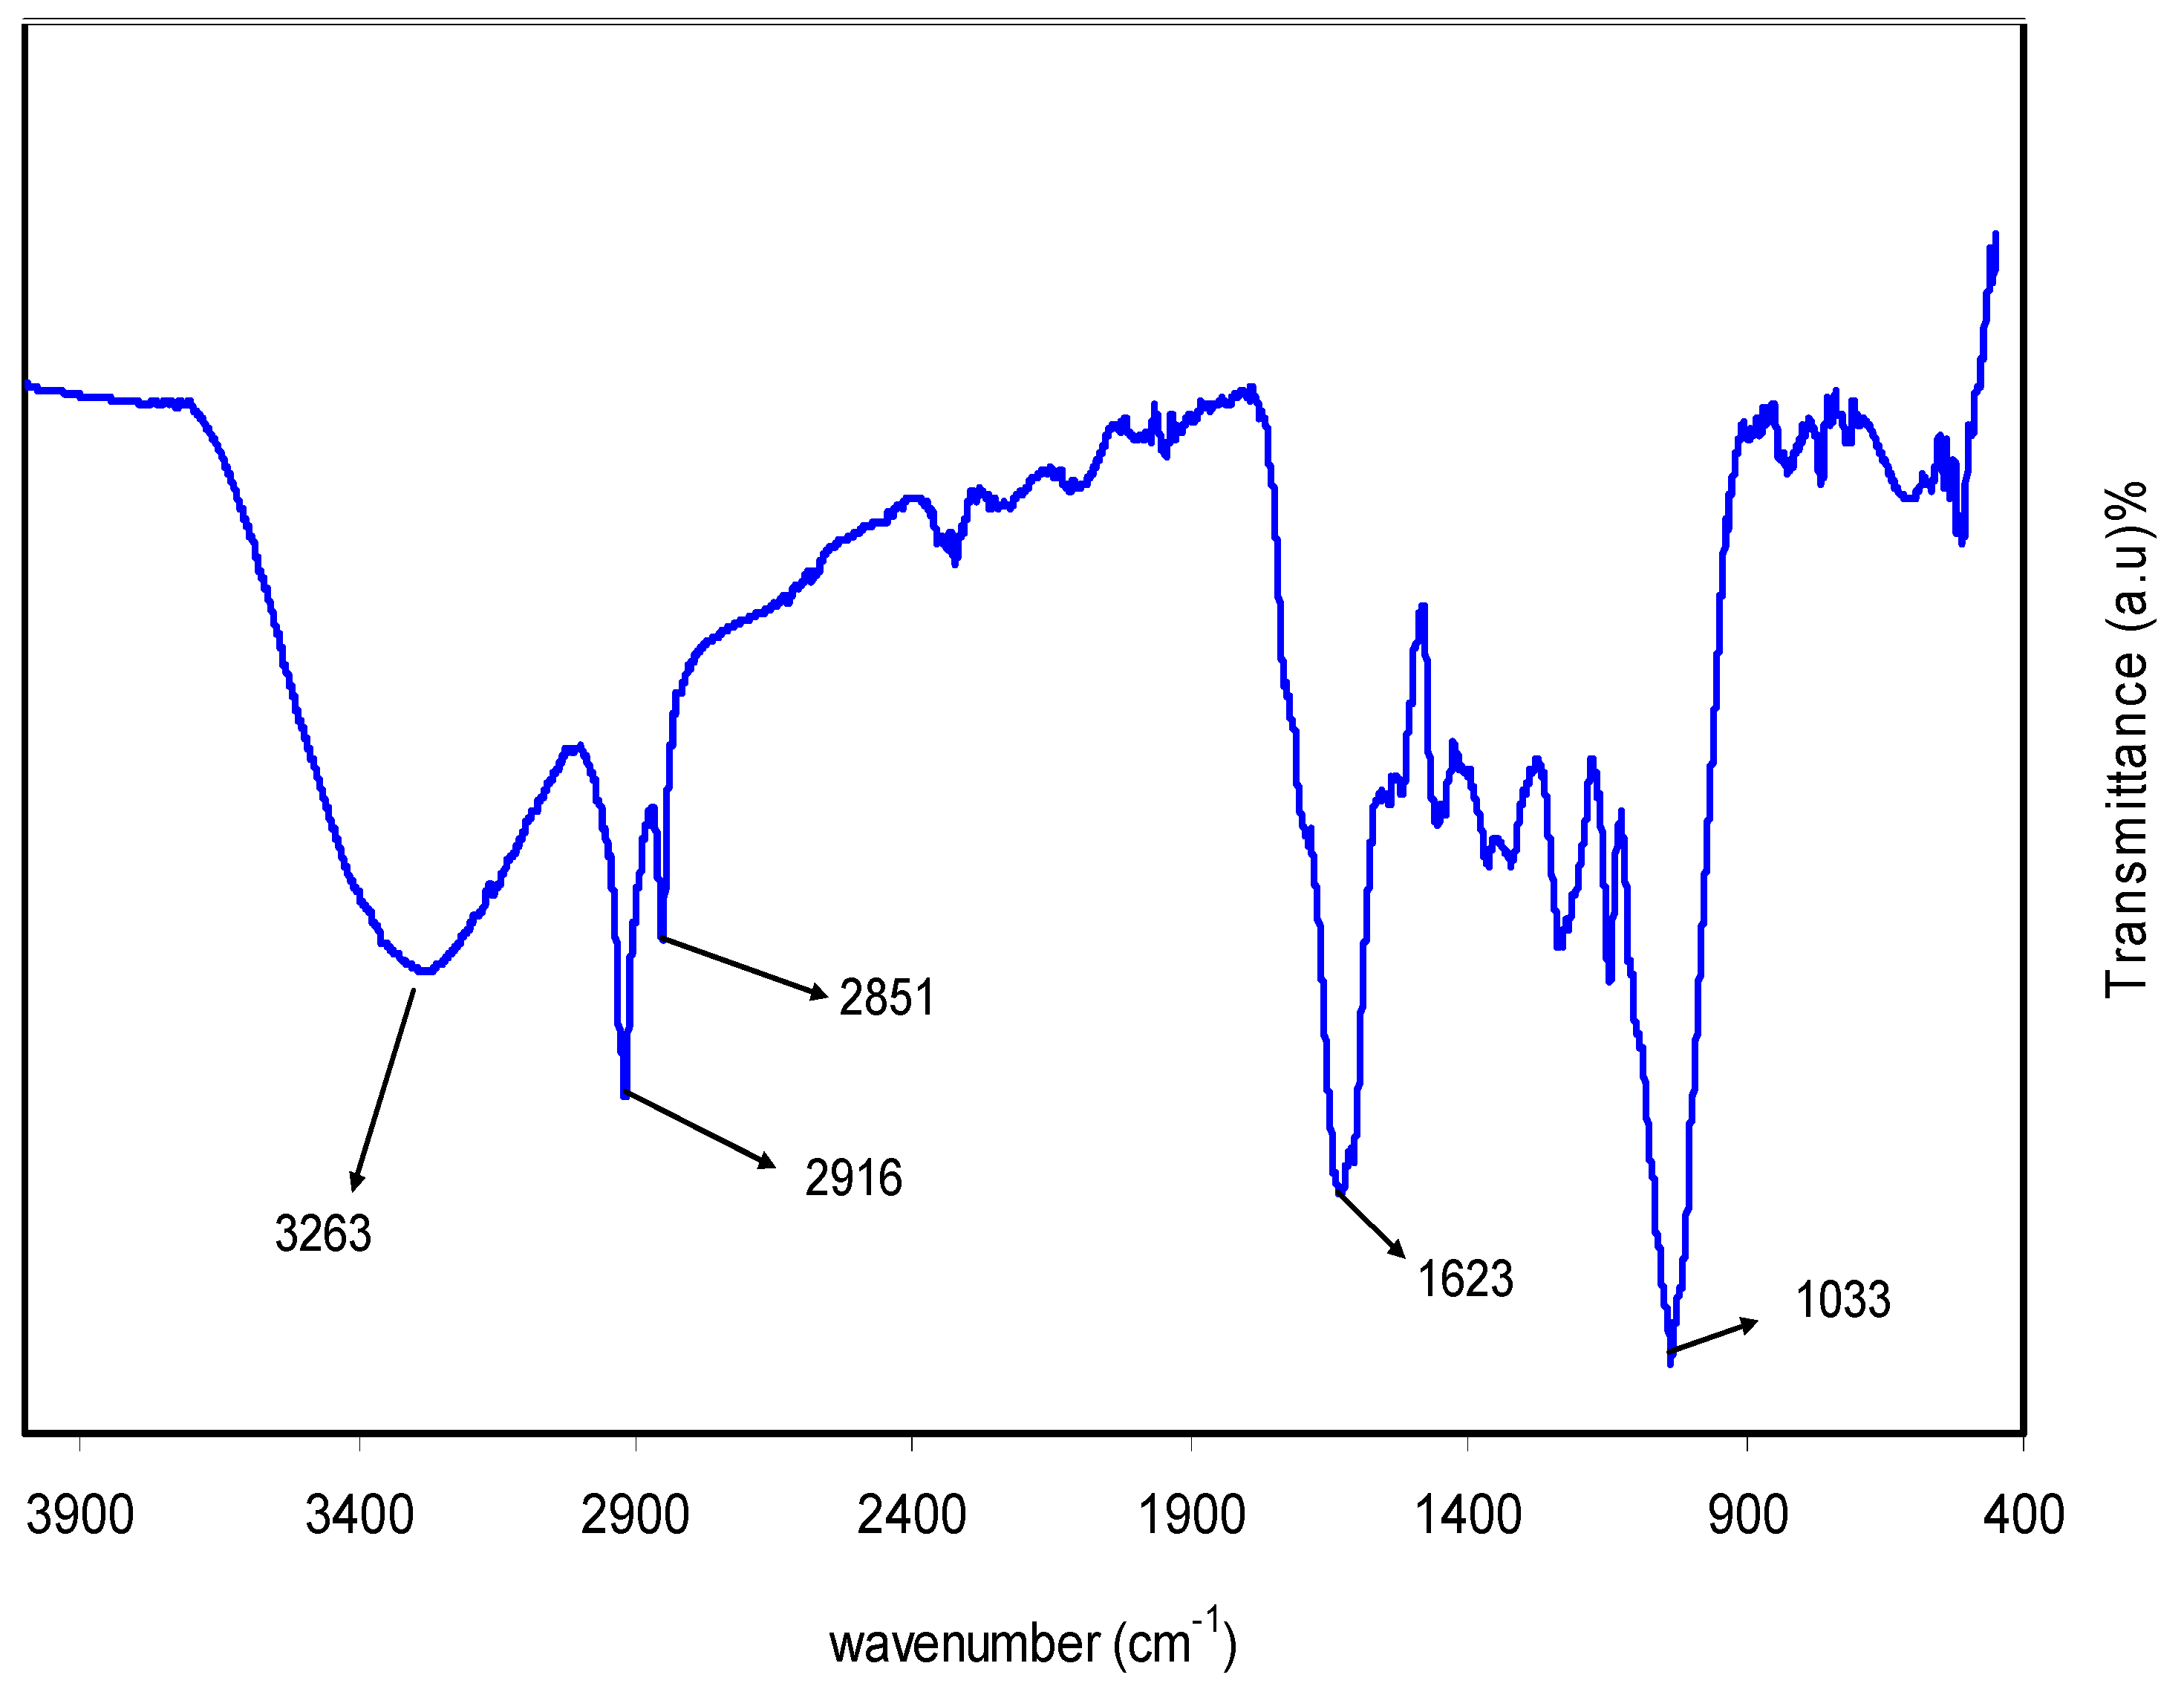
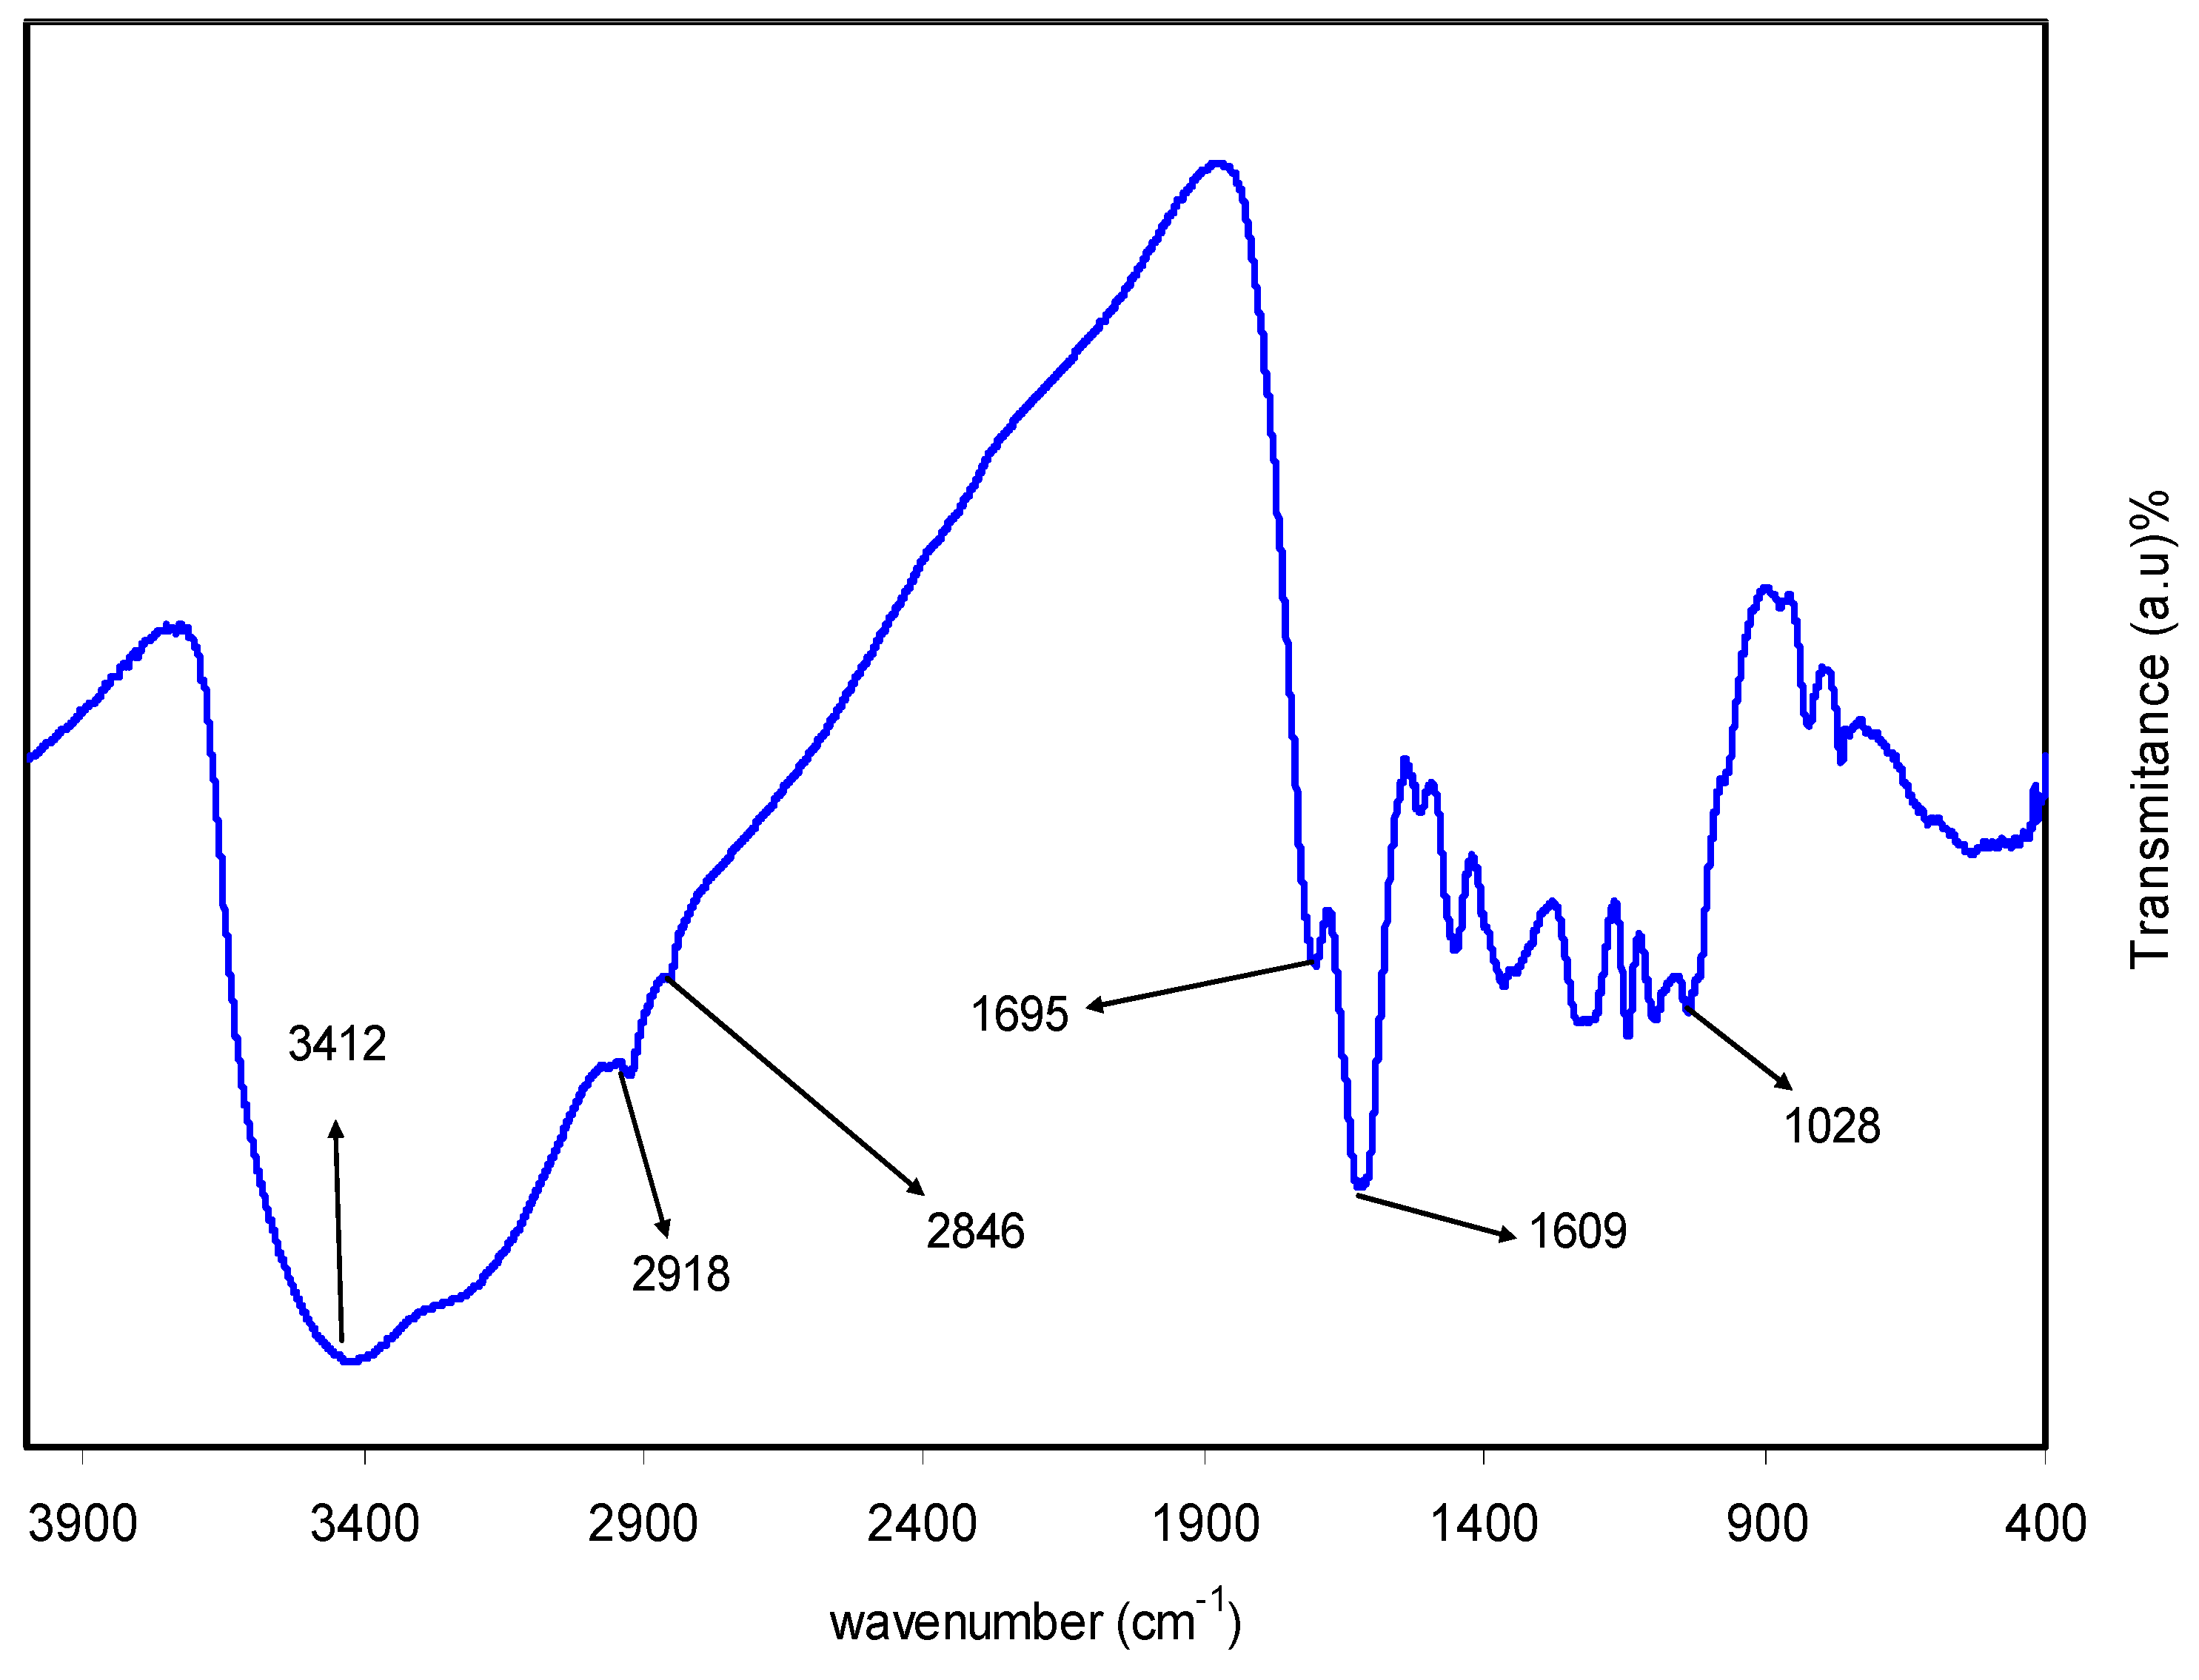
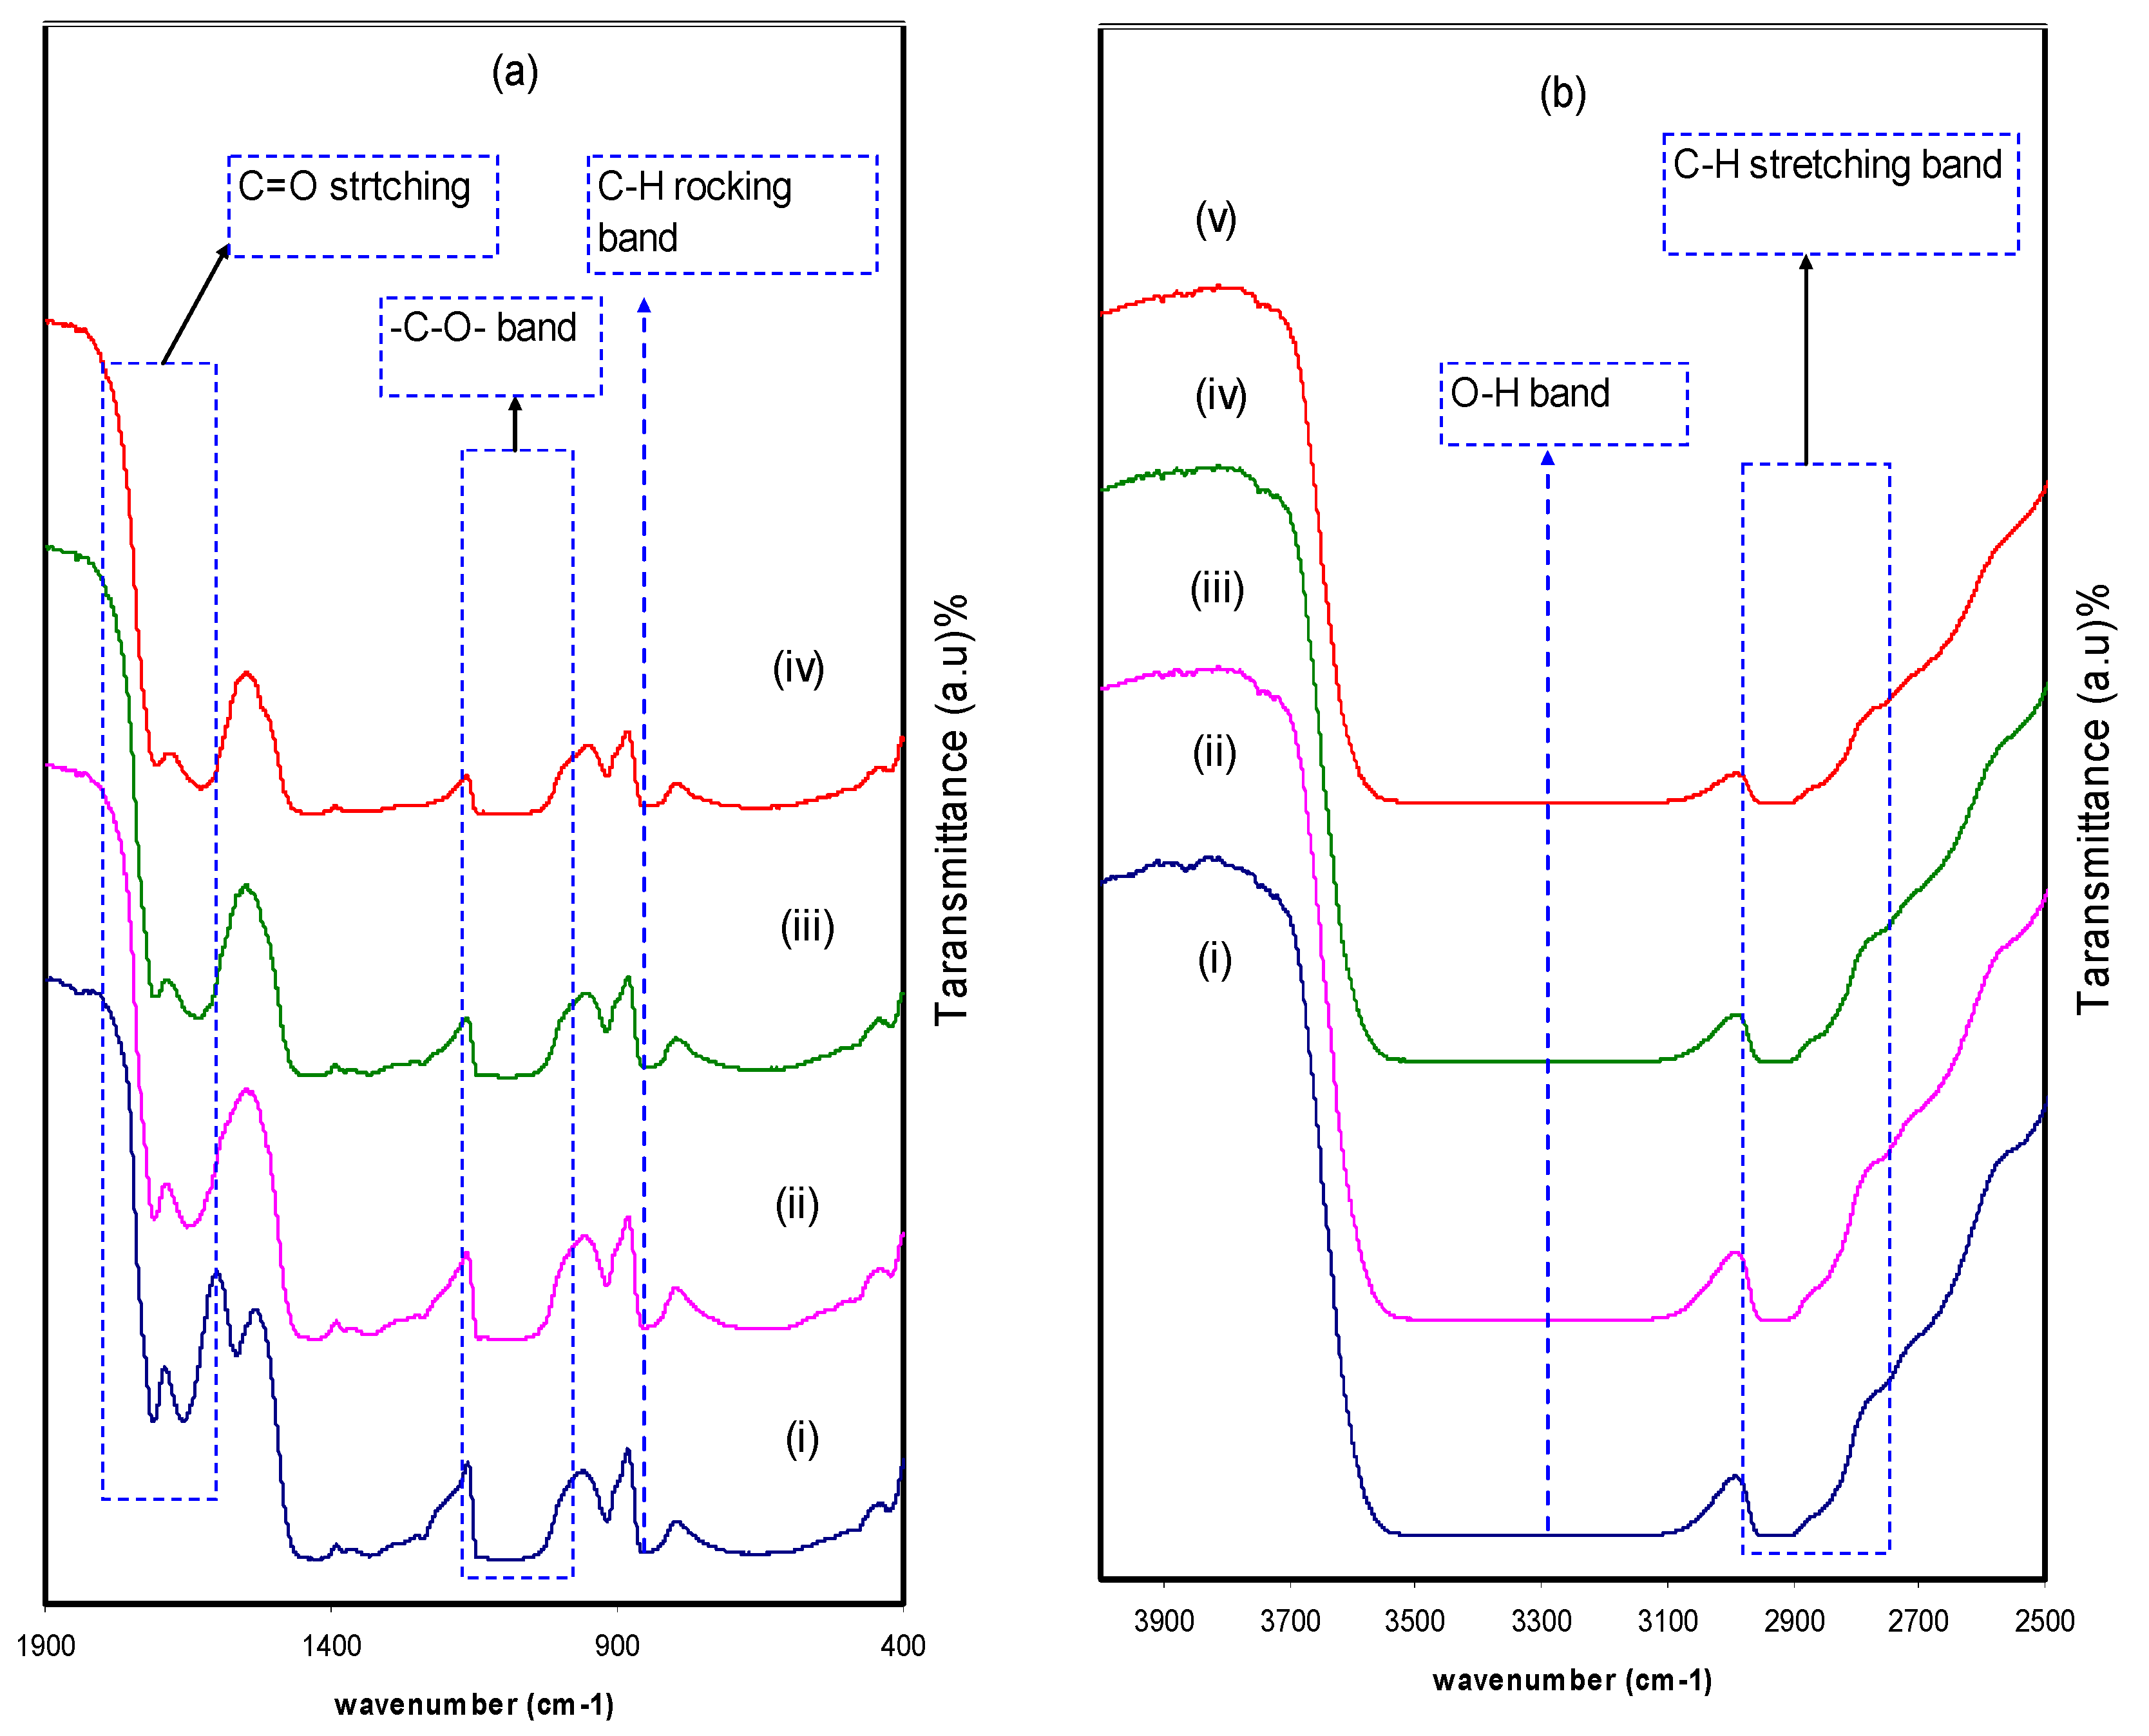
2.1. FTIR Study
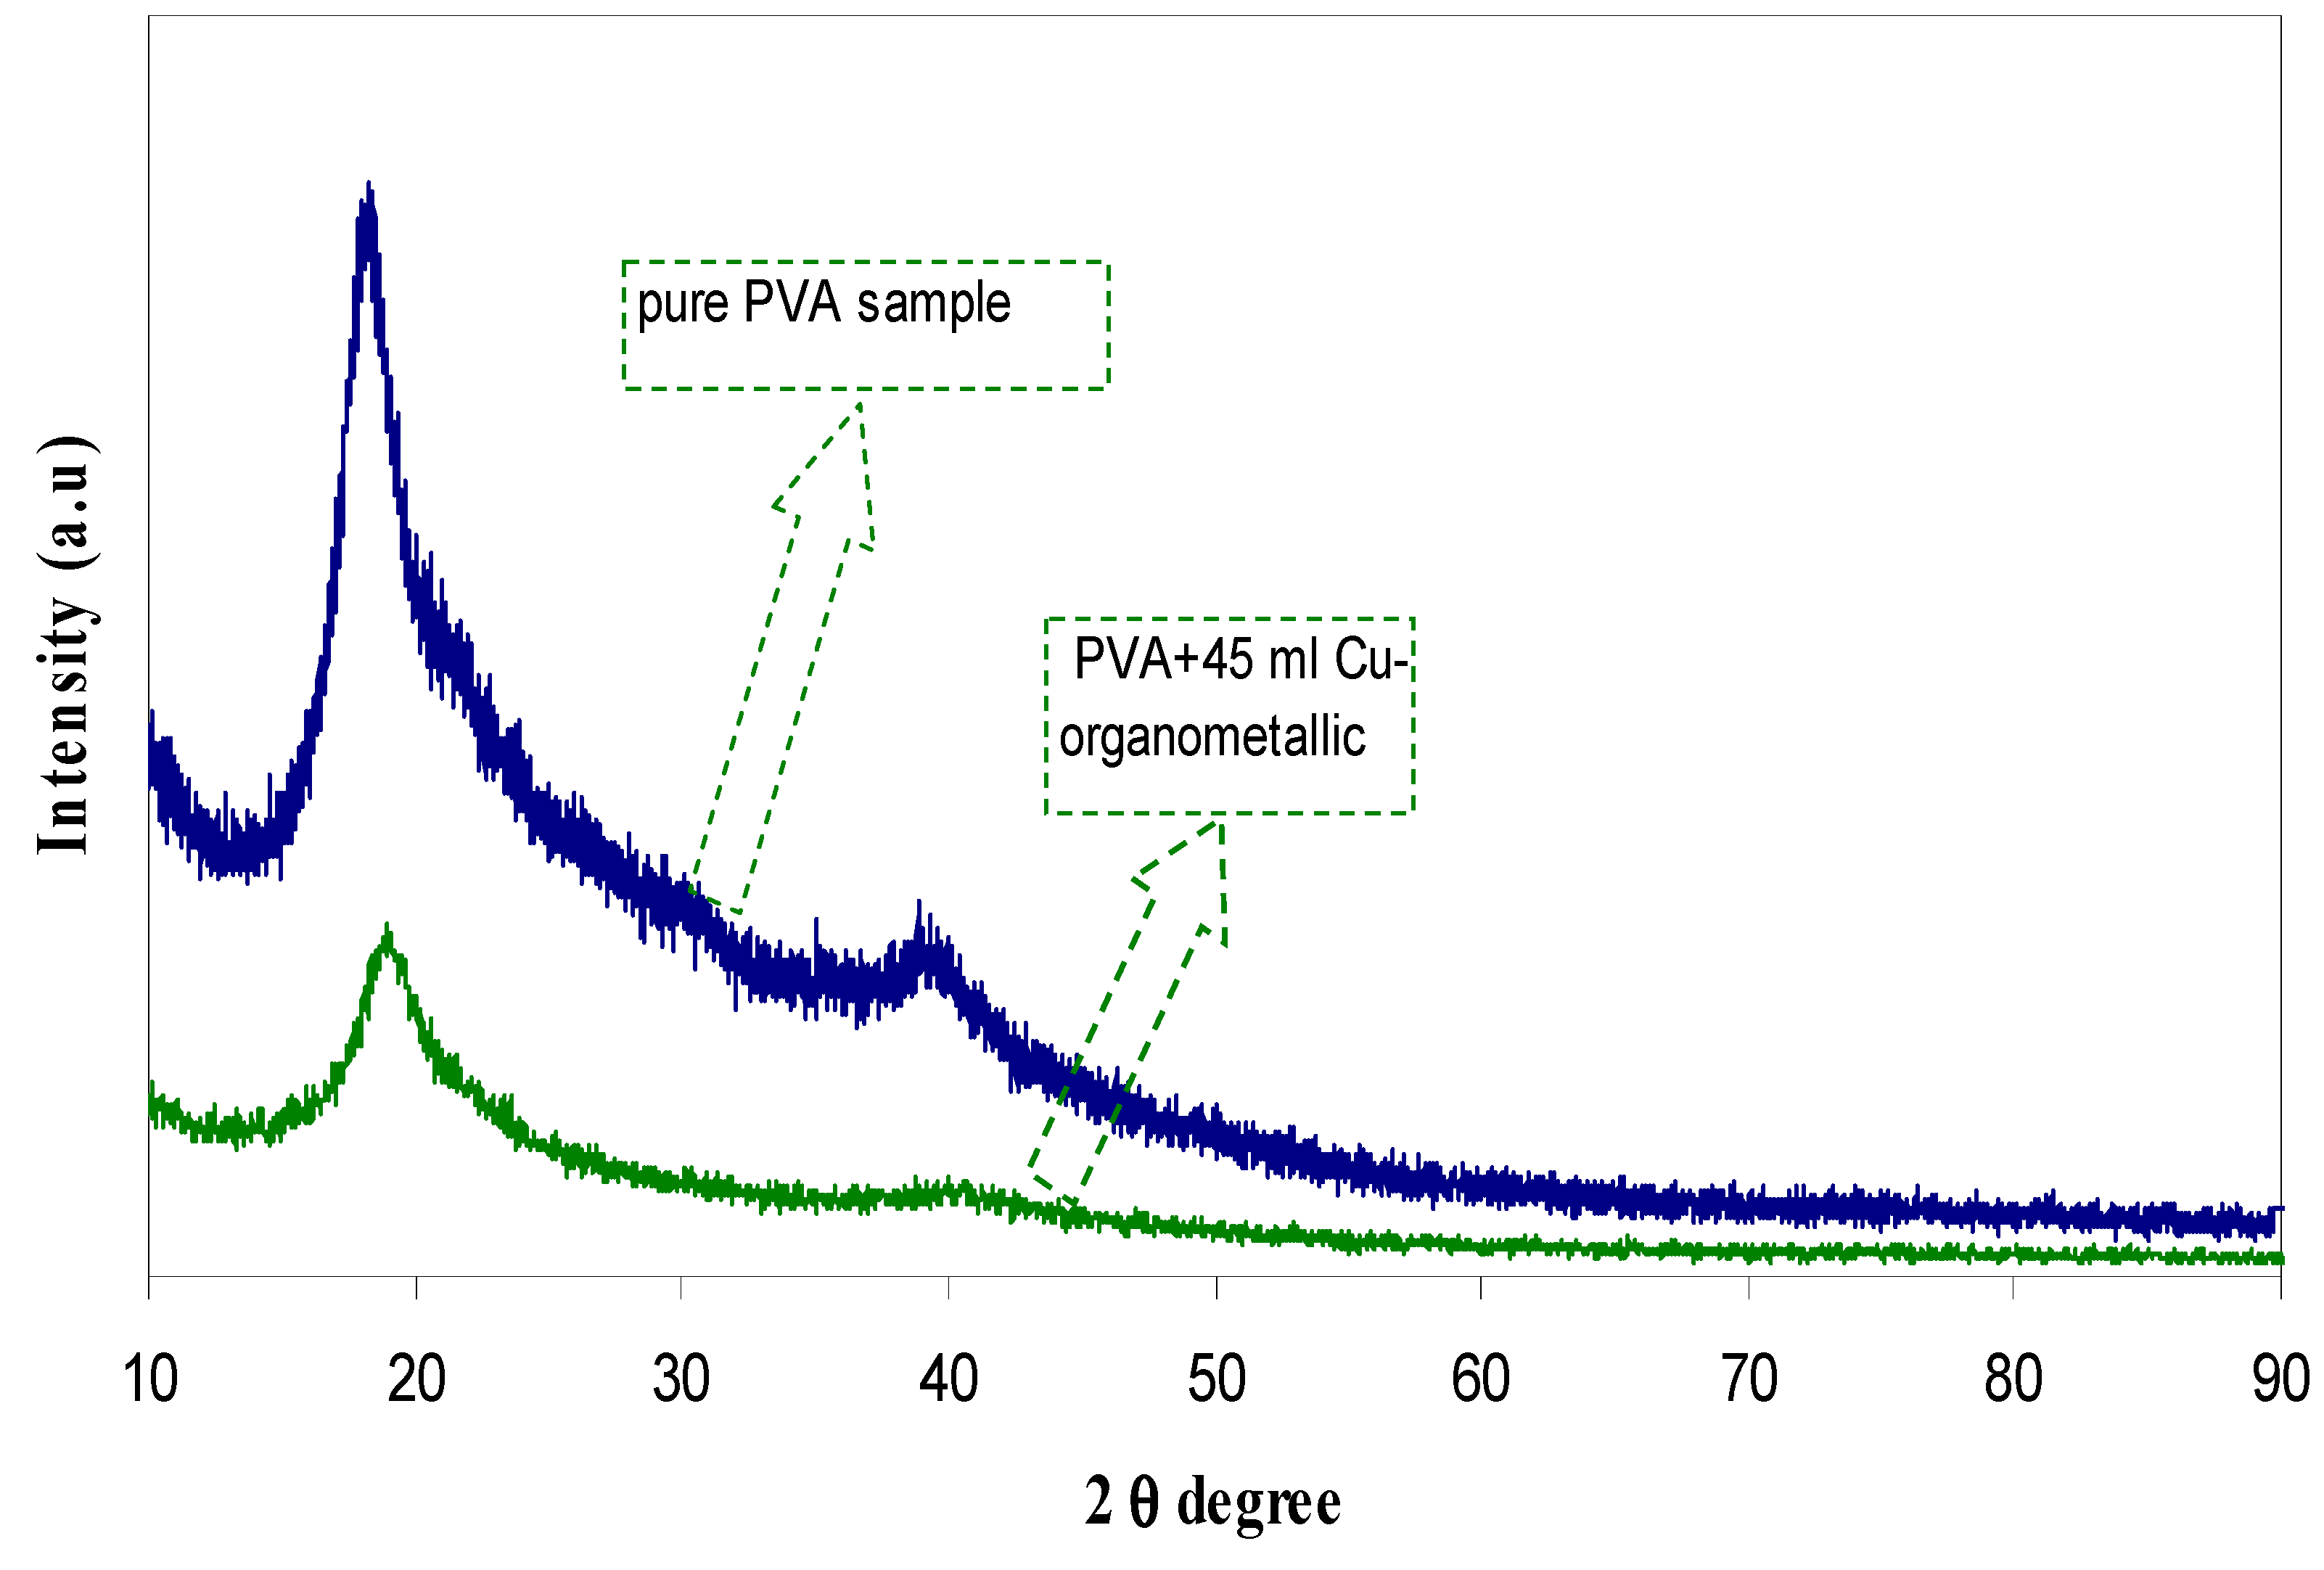
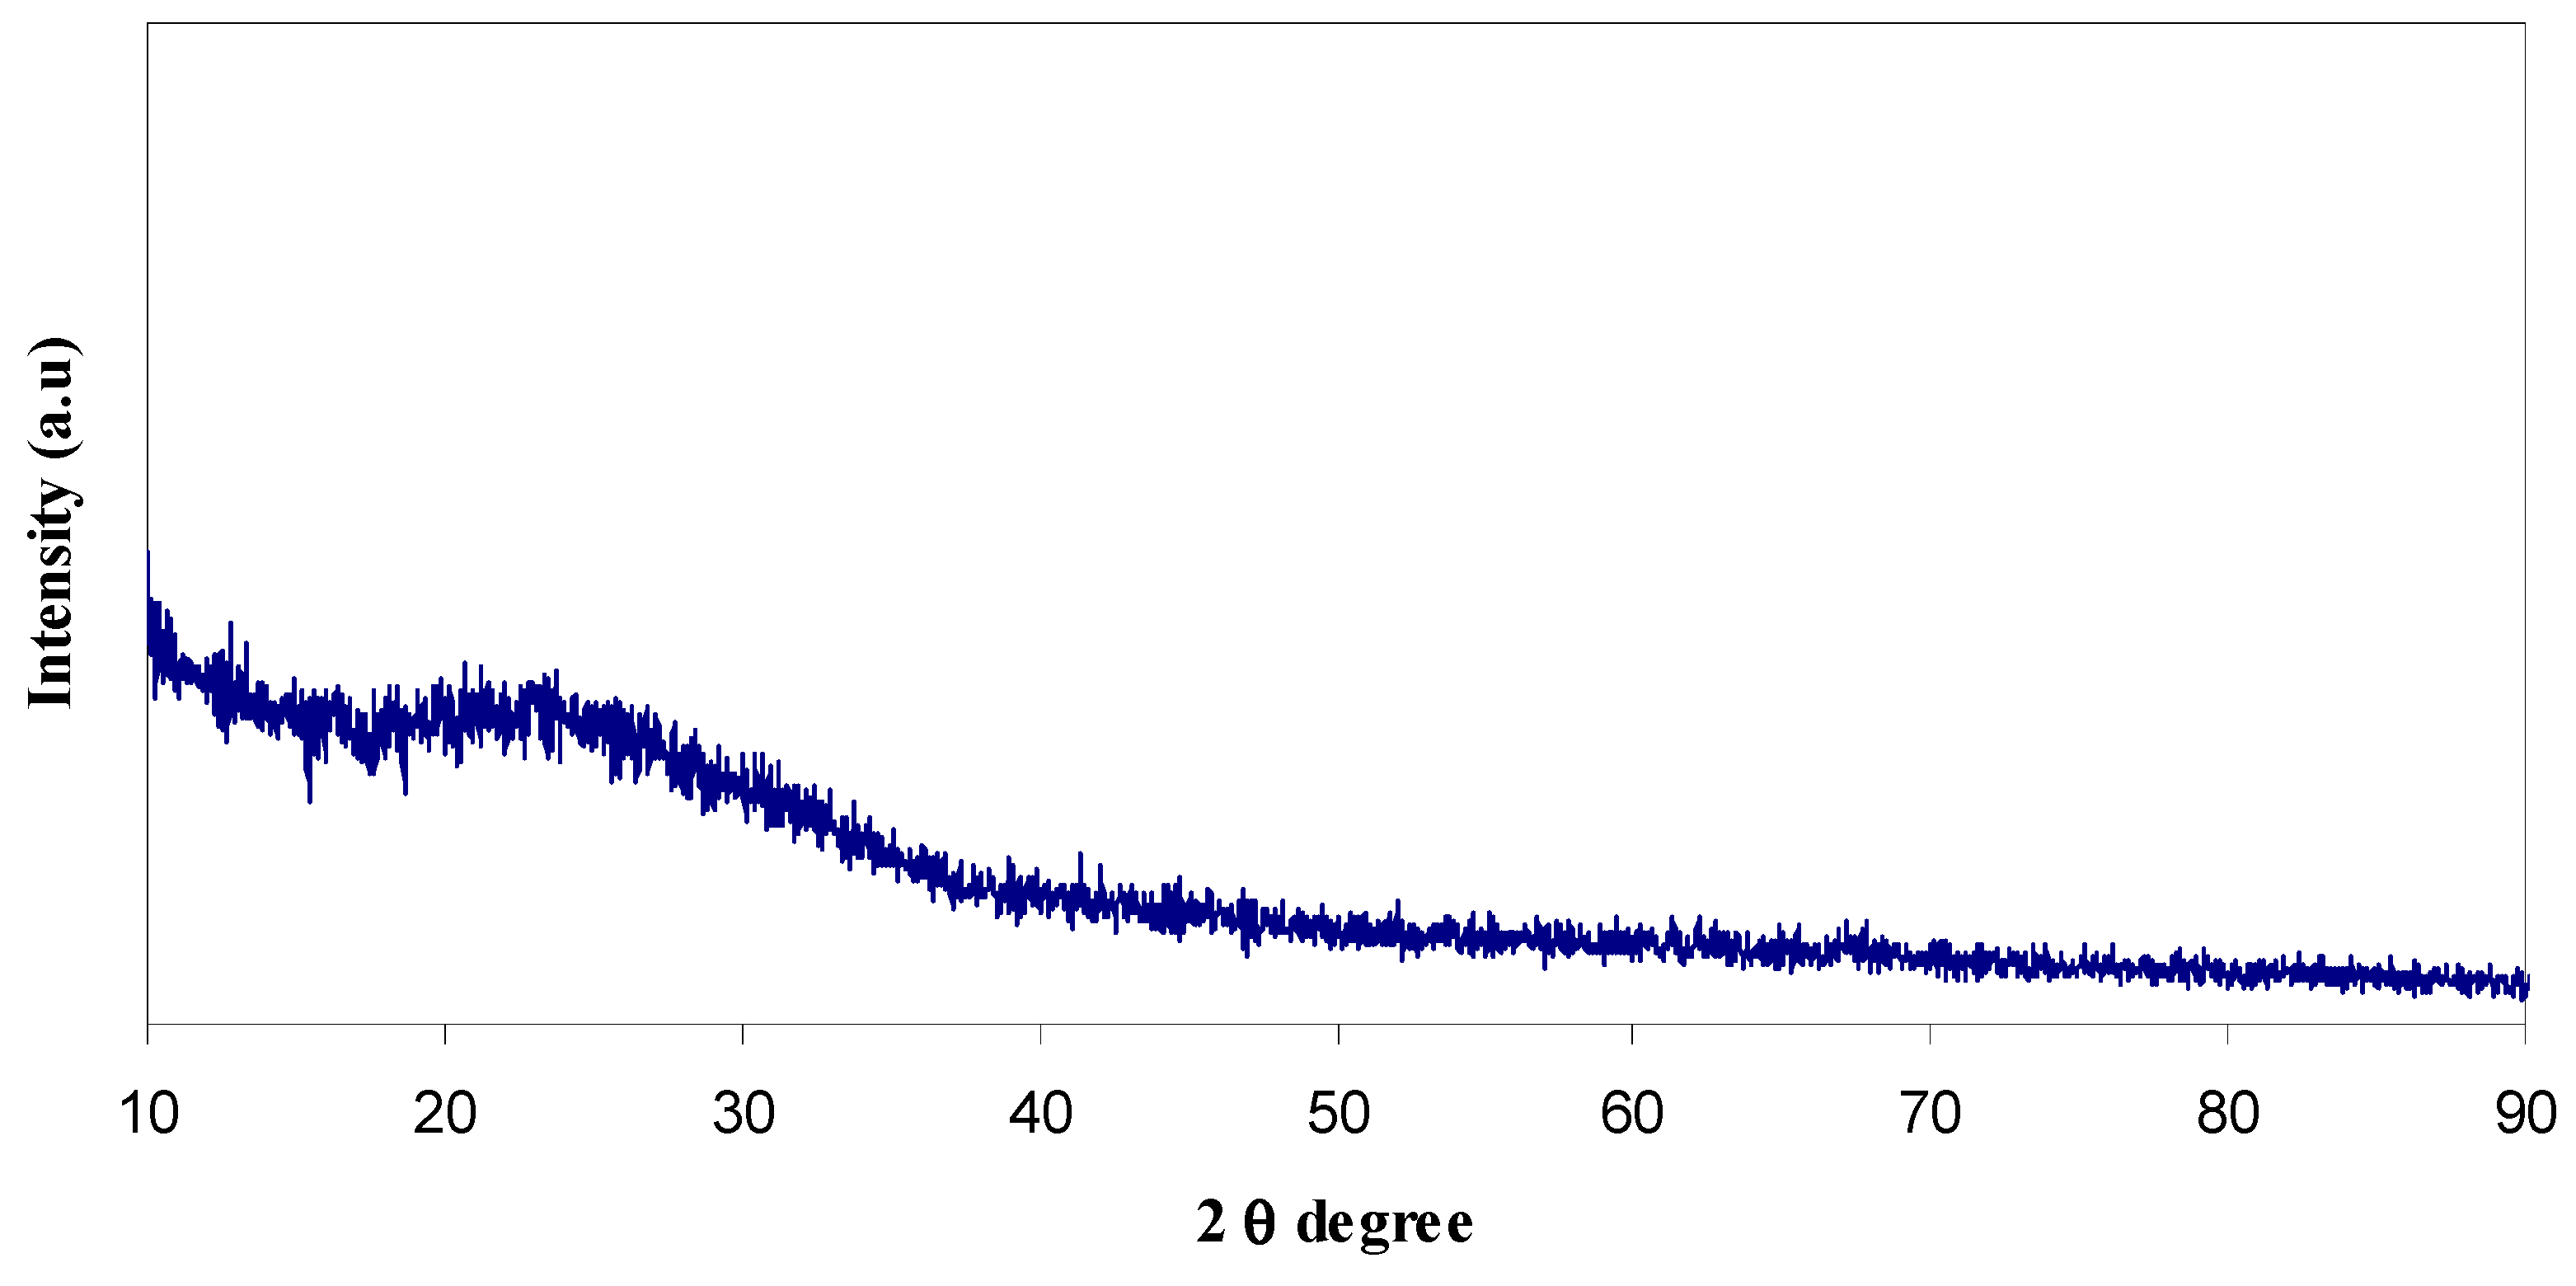
2.2. XRD Study
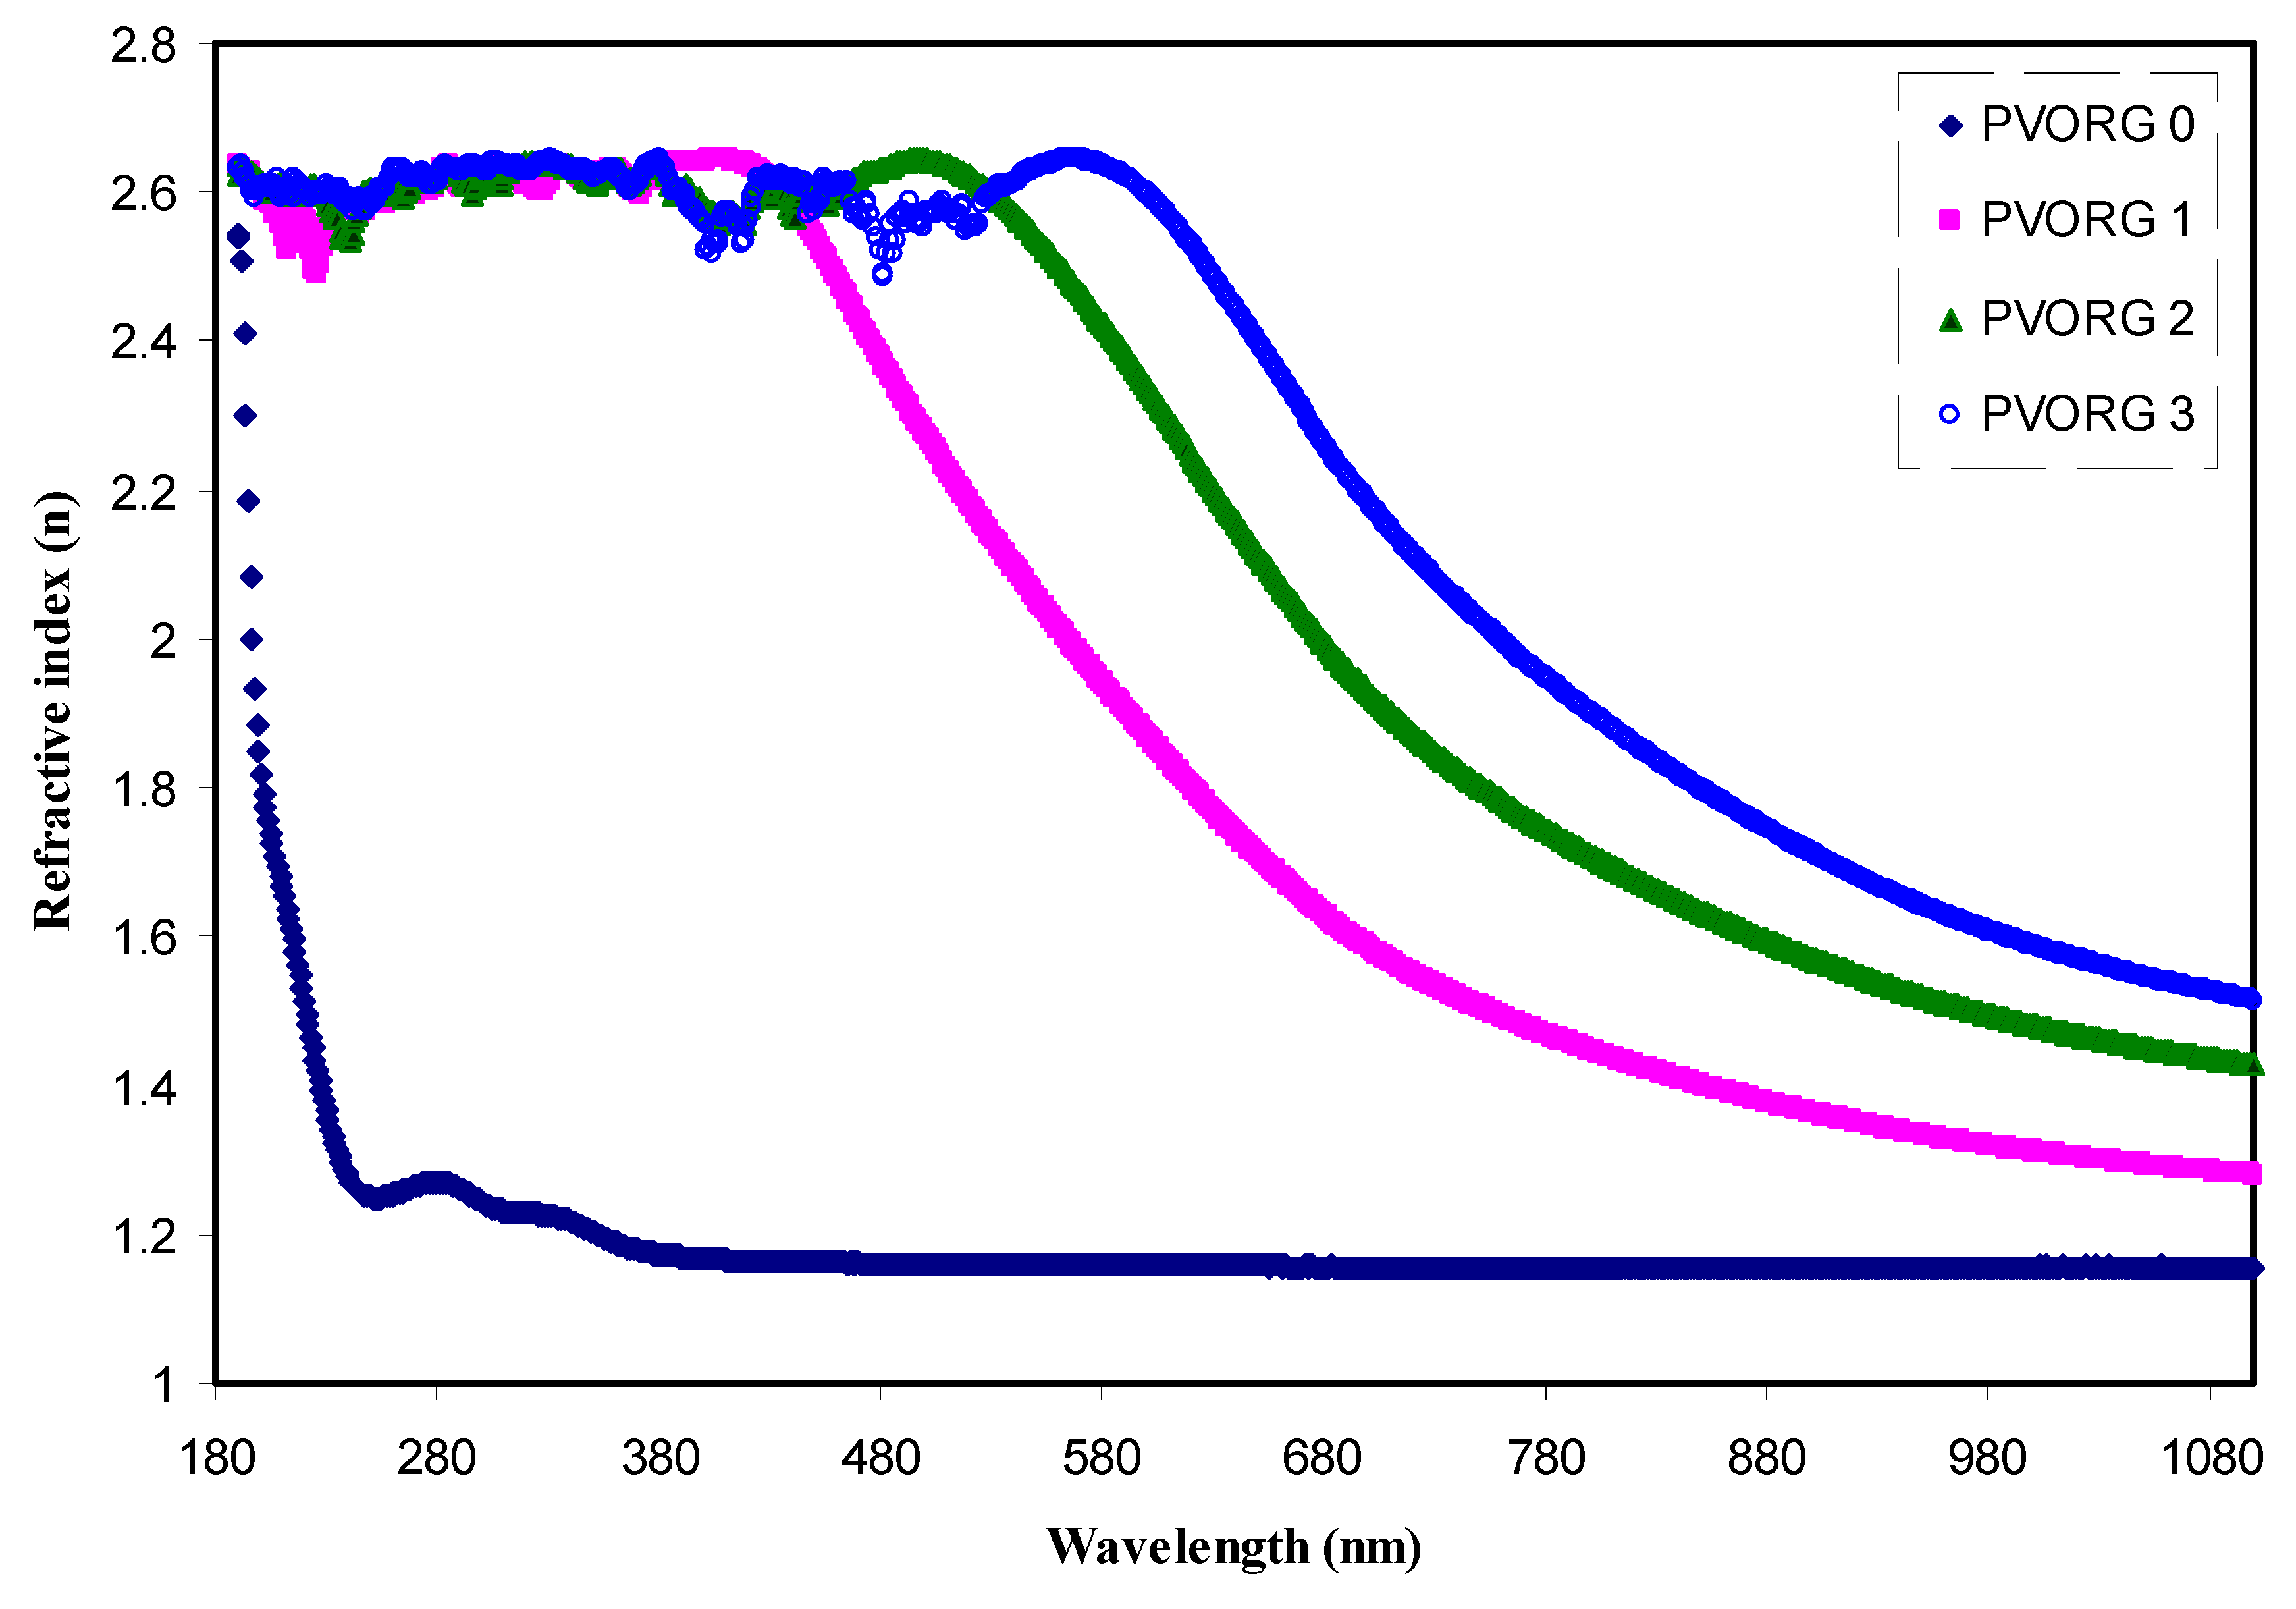
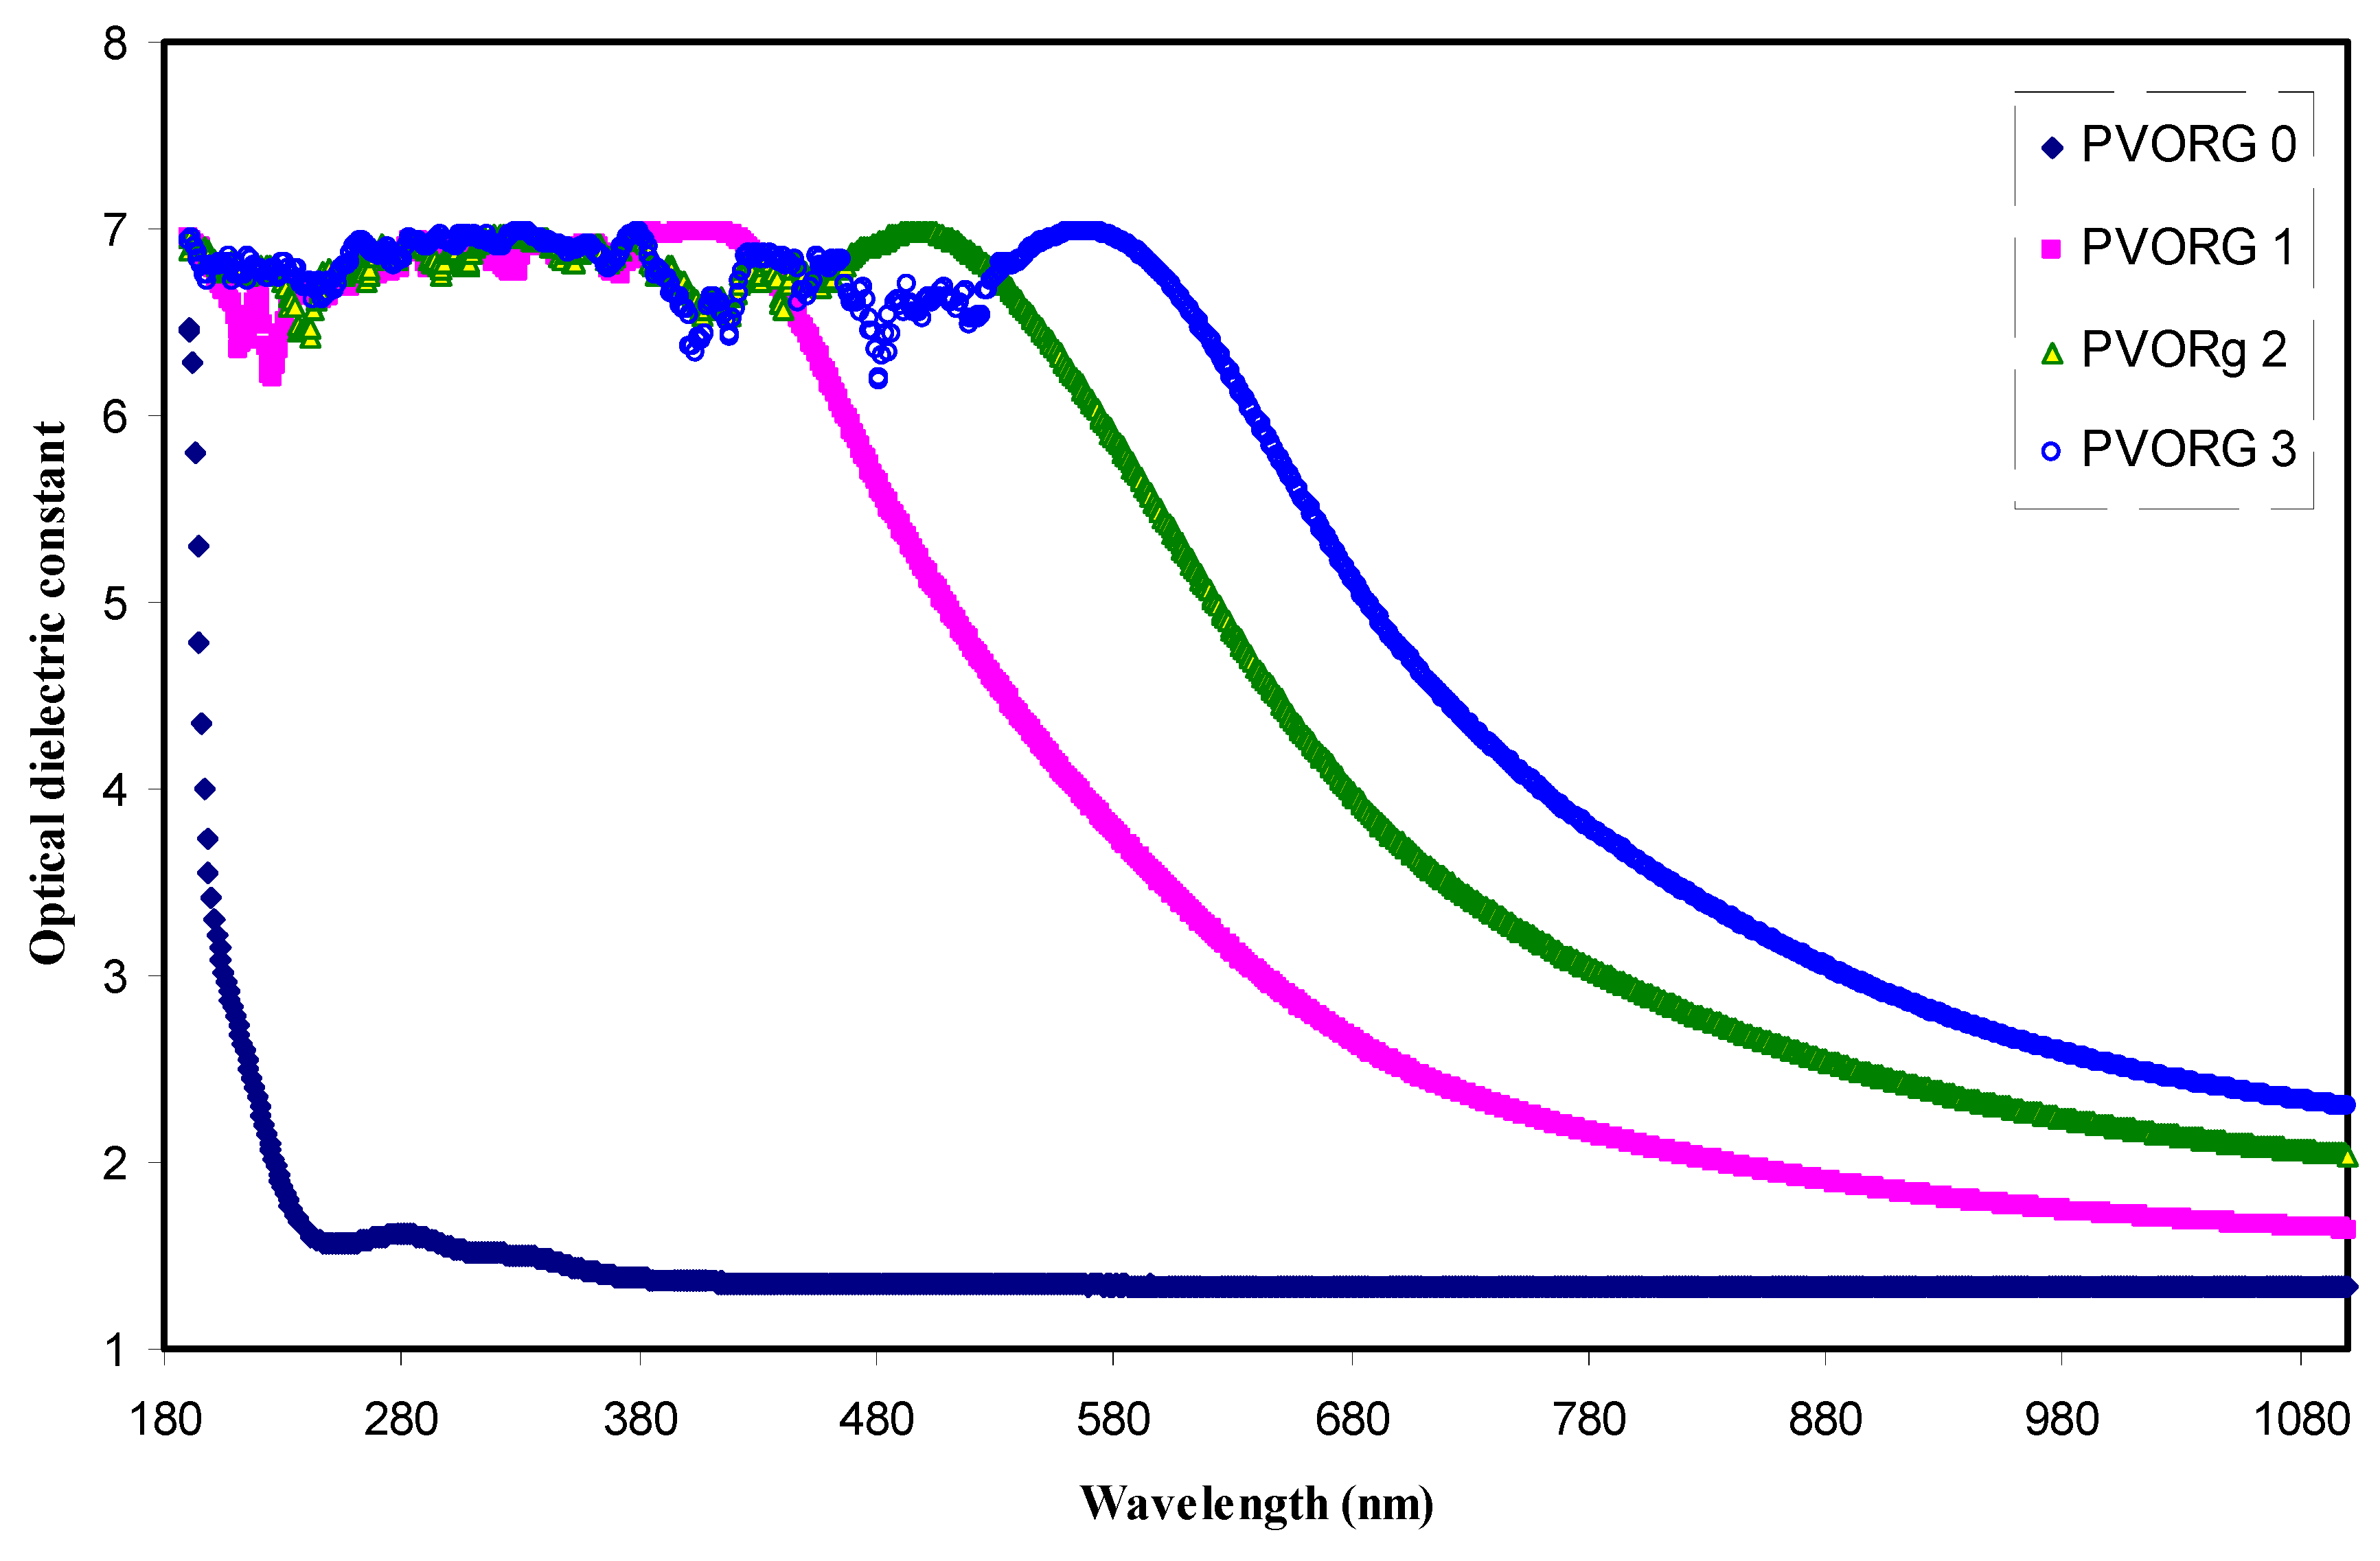
2.3. Optical Properties
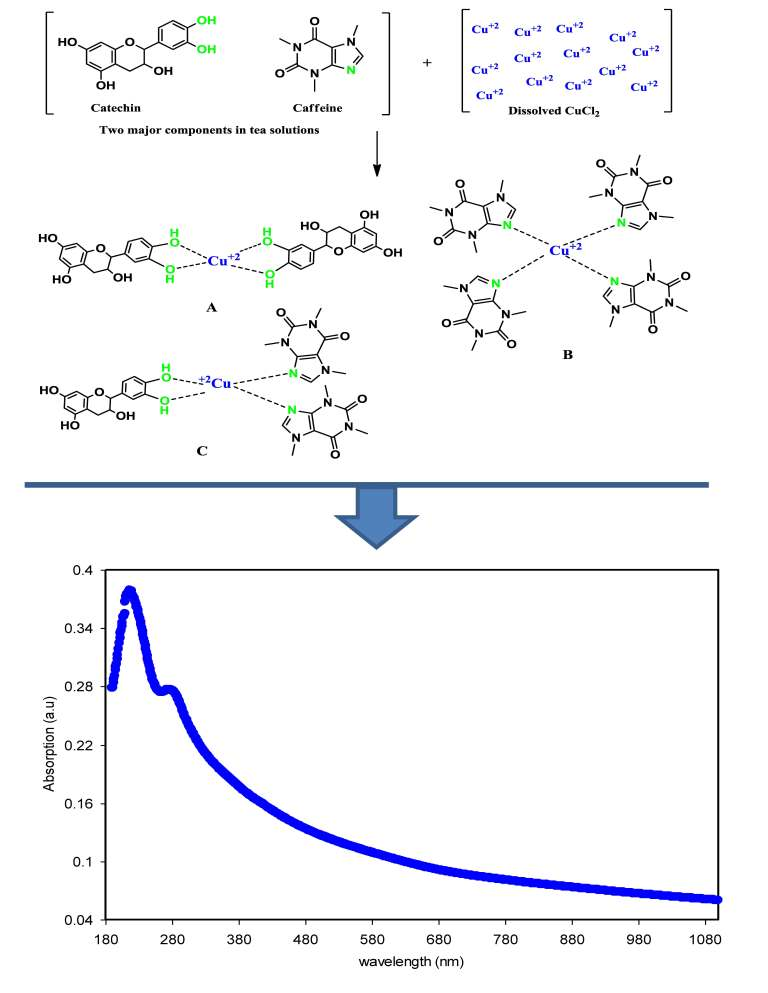
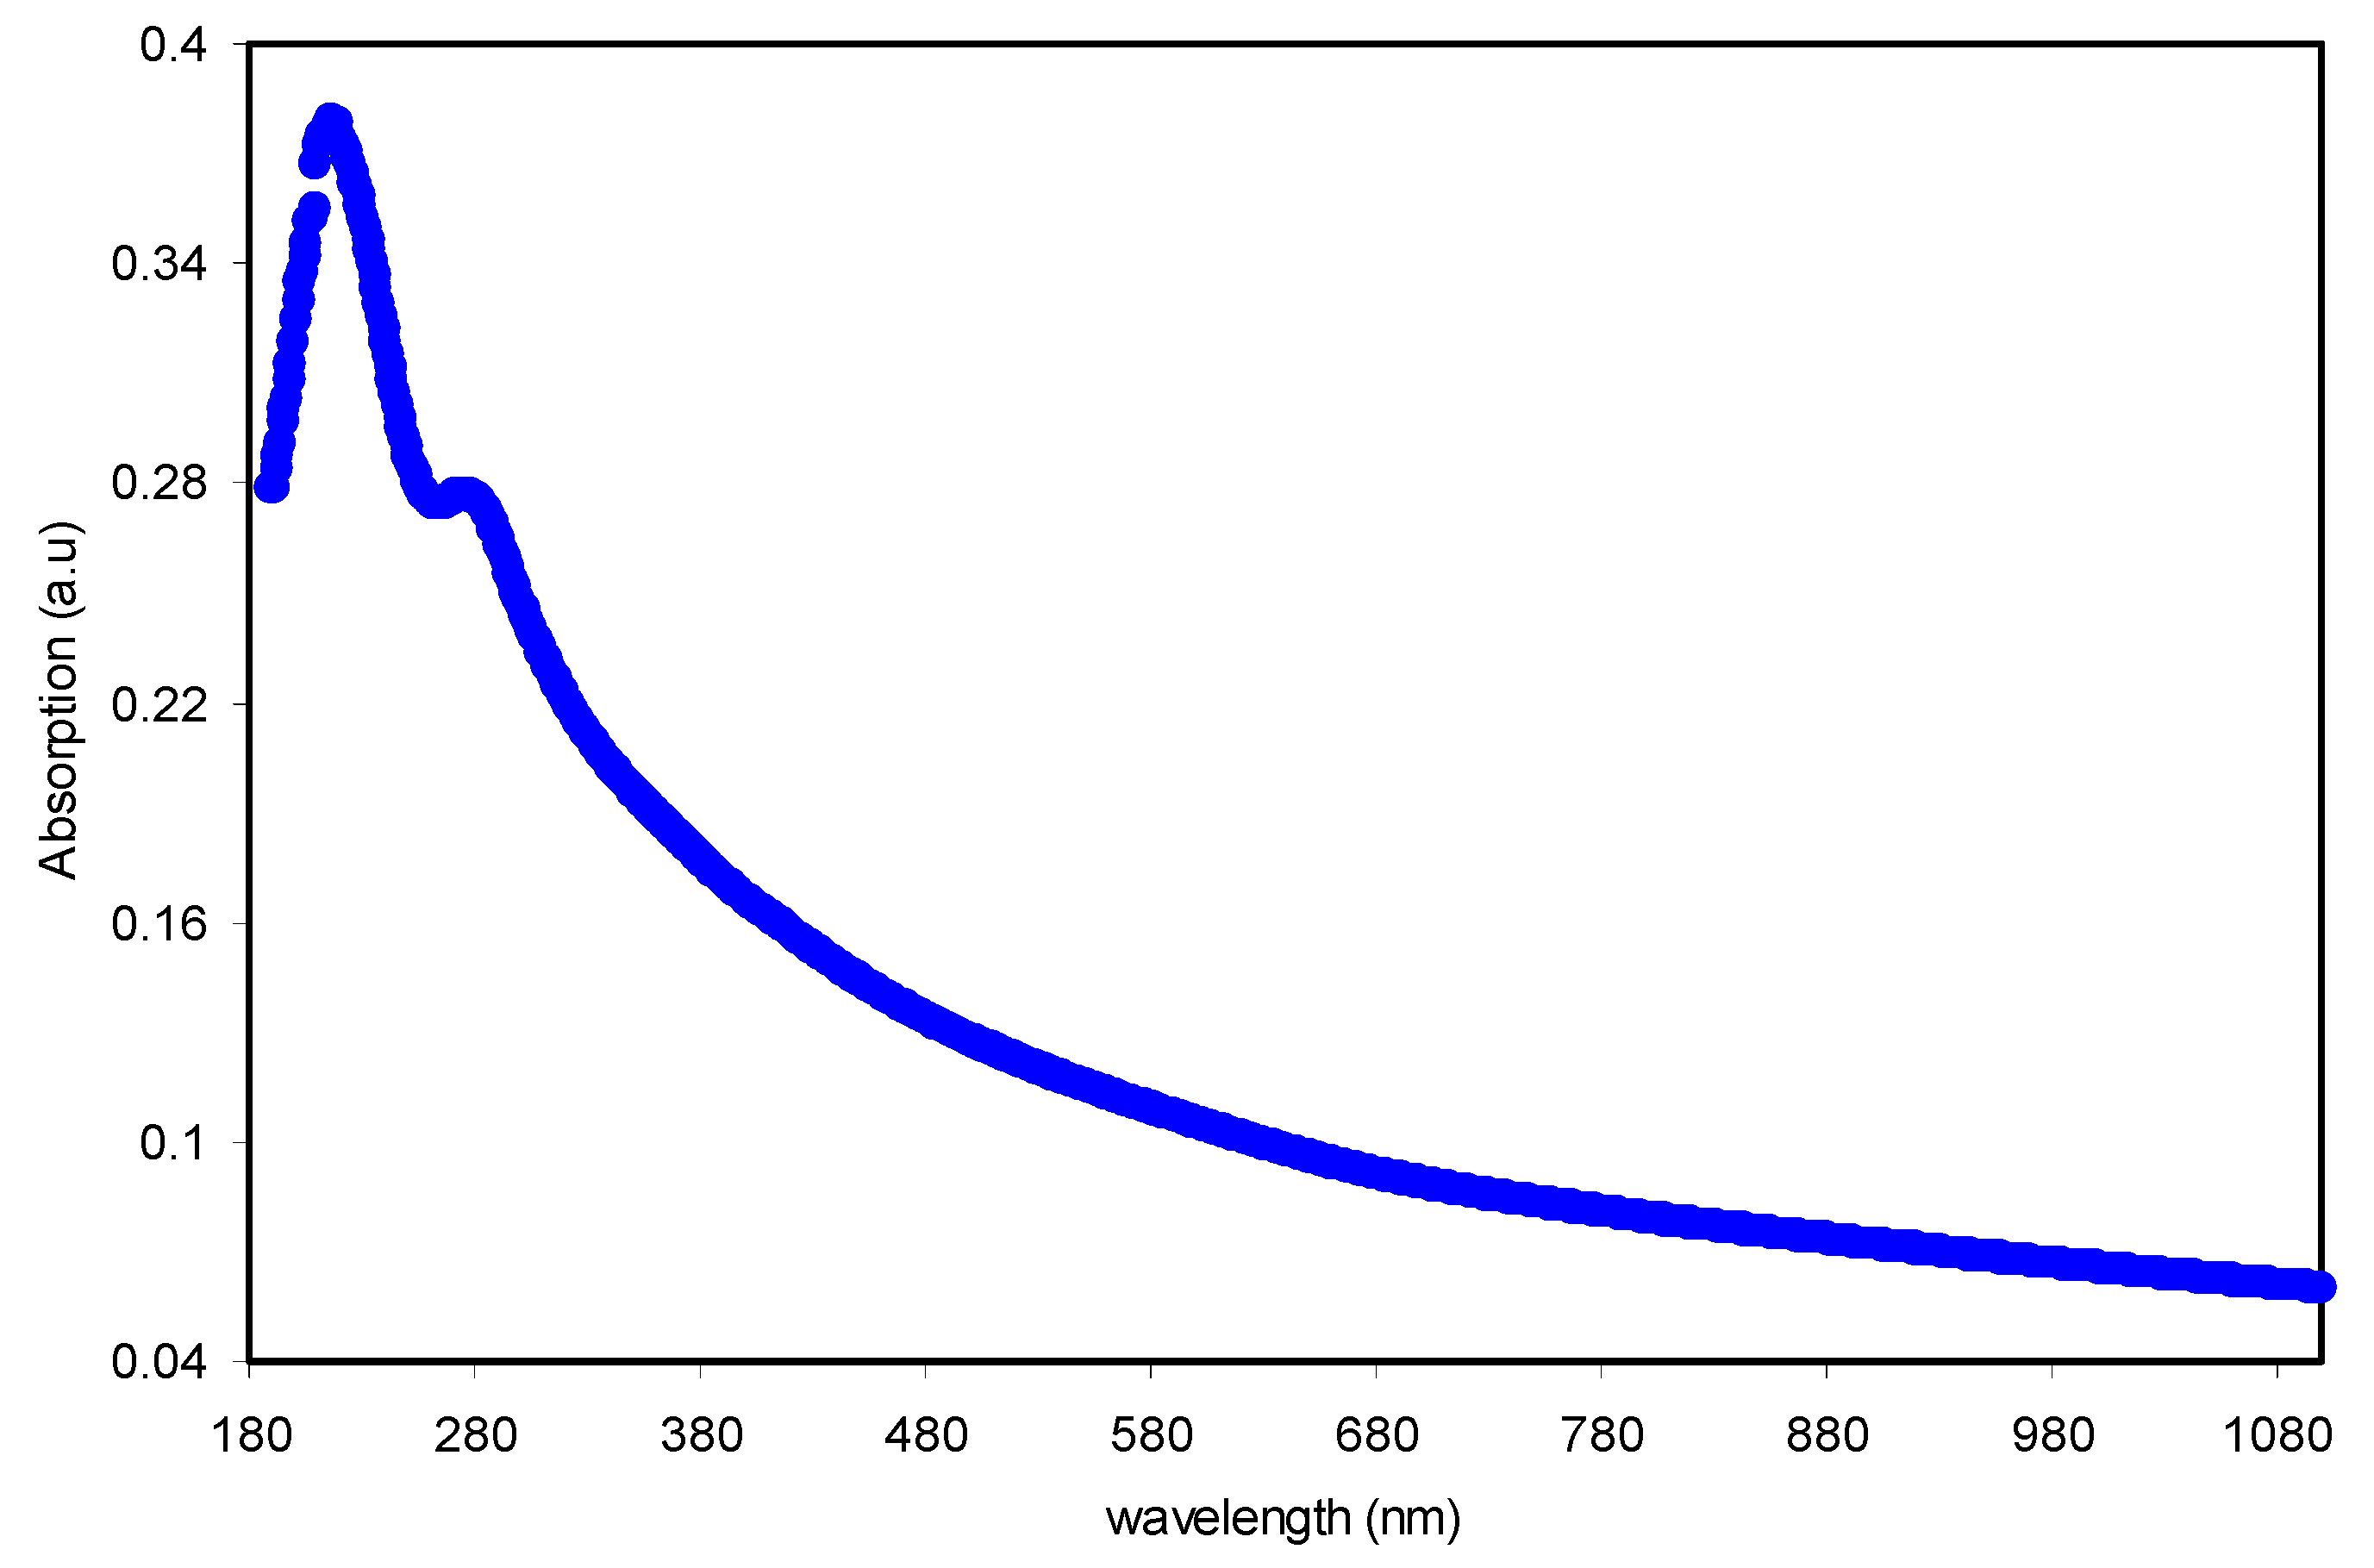
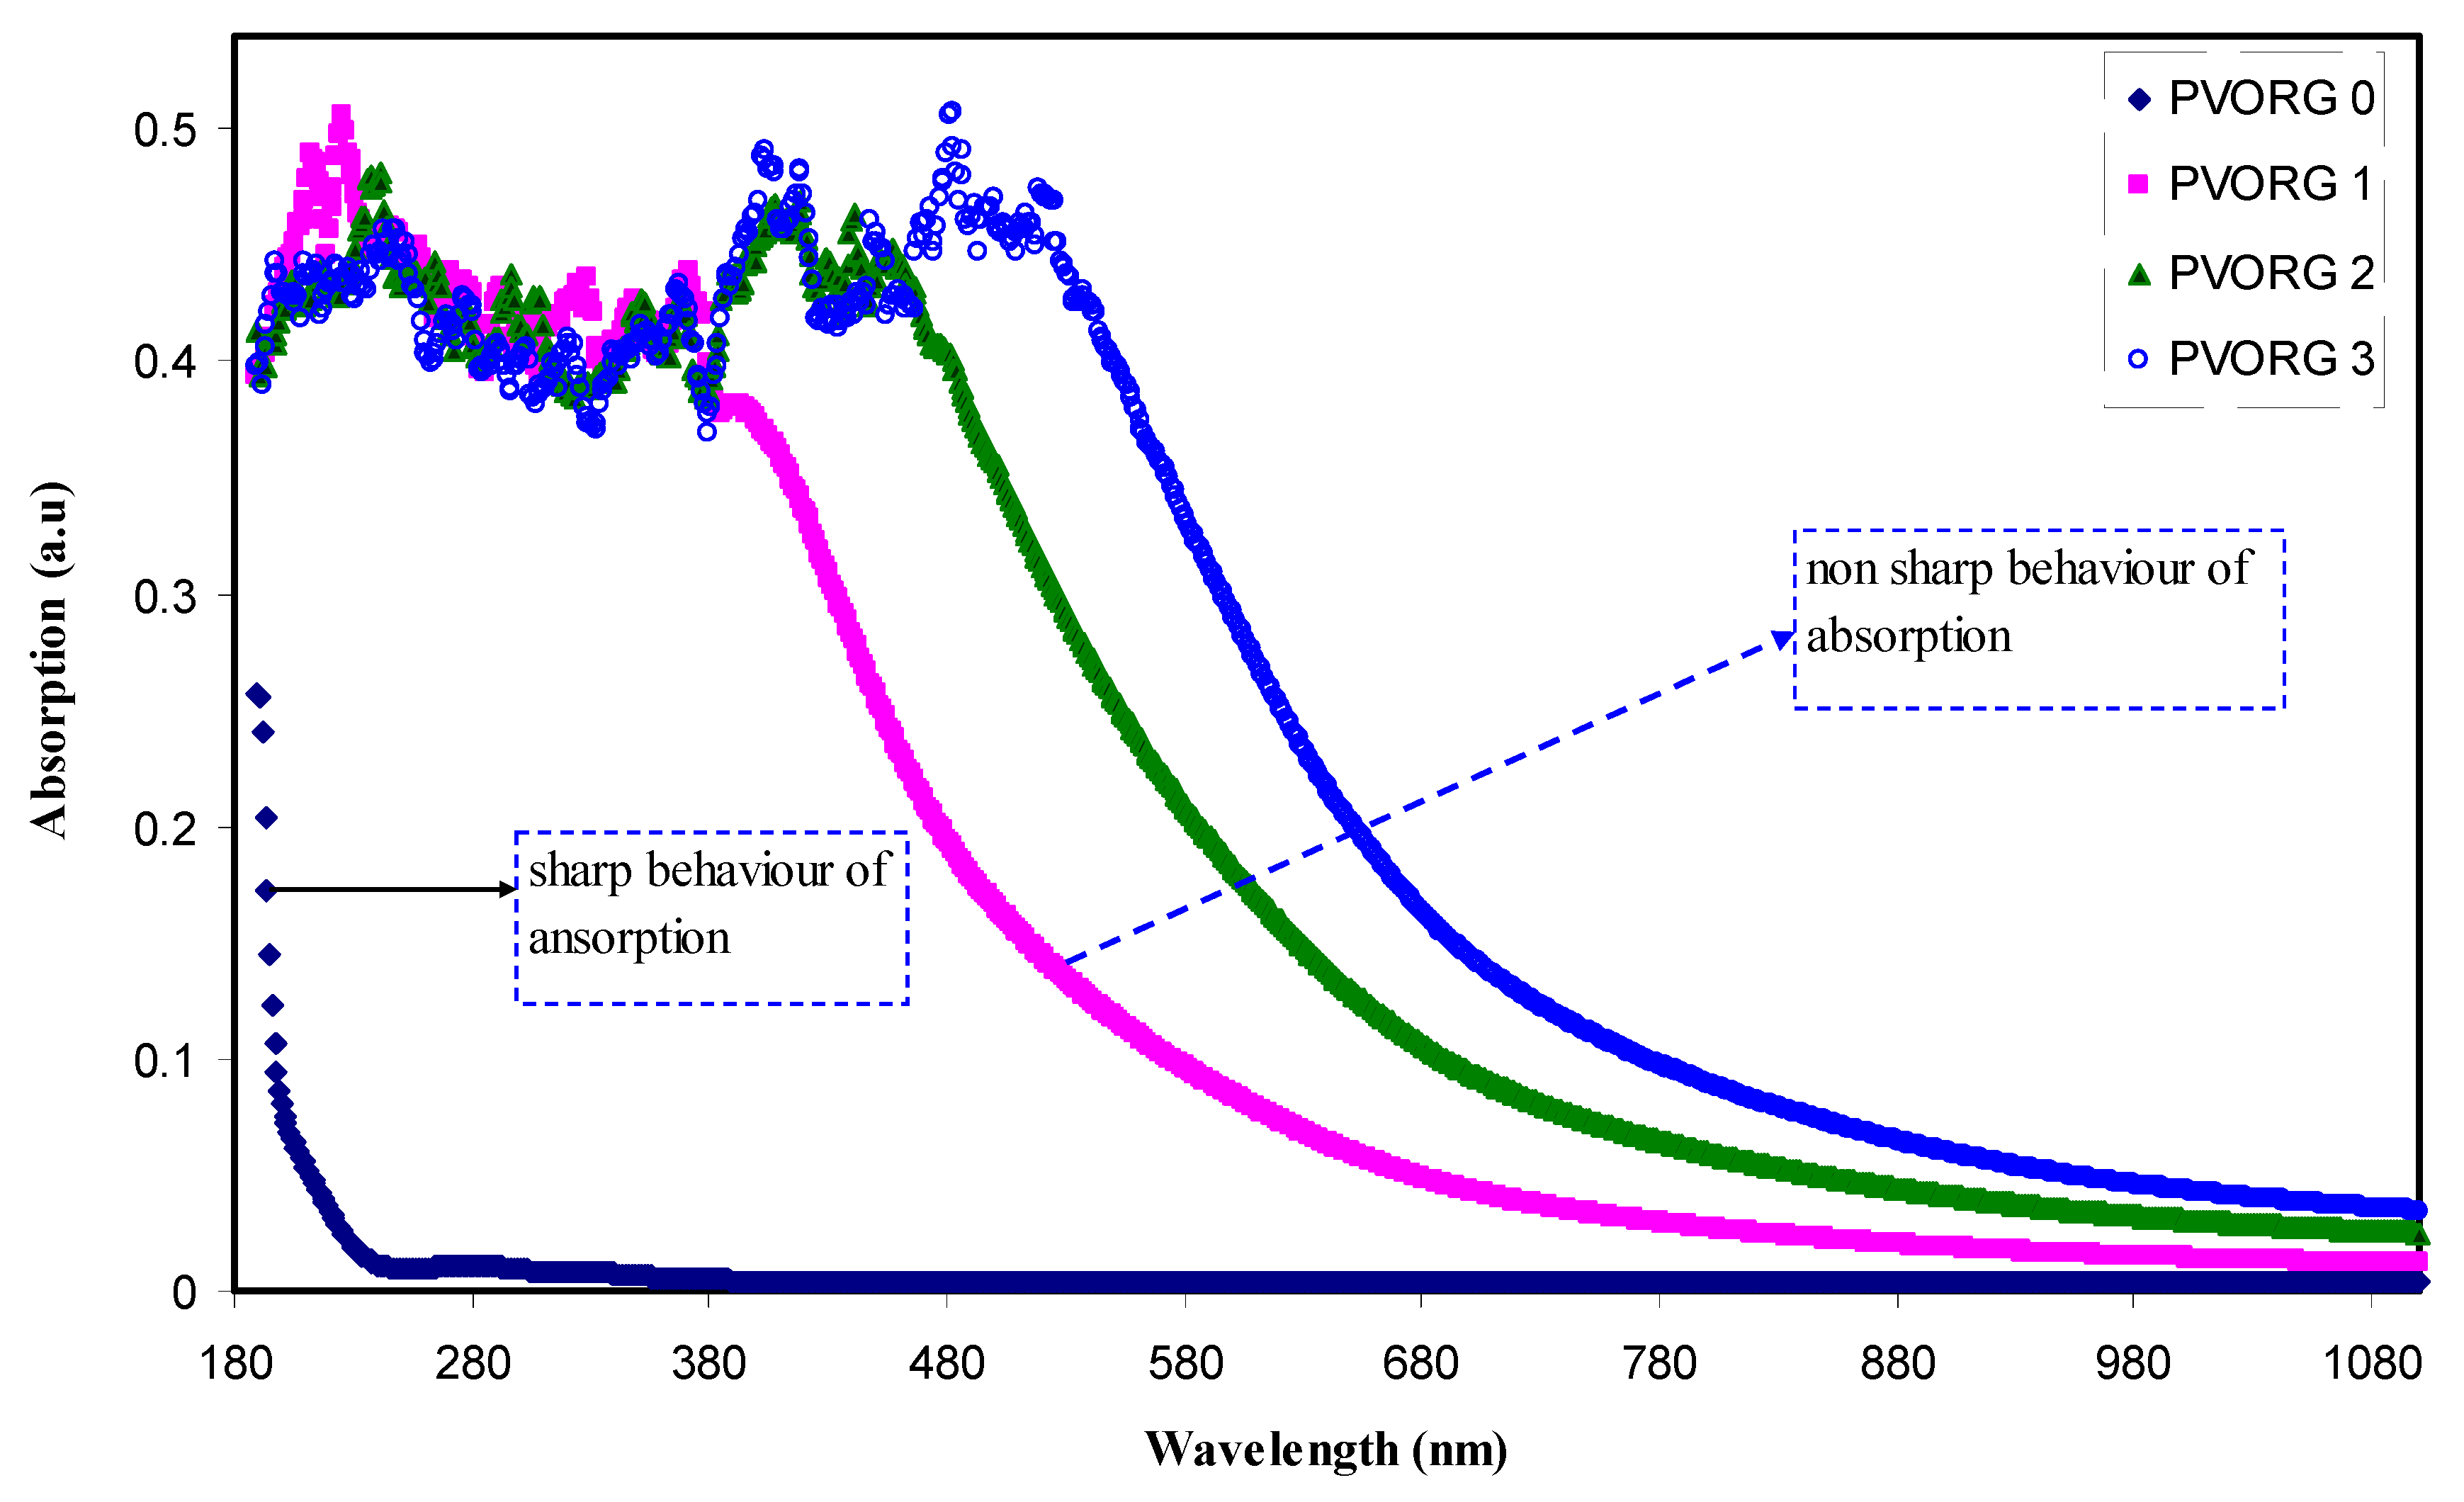
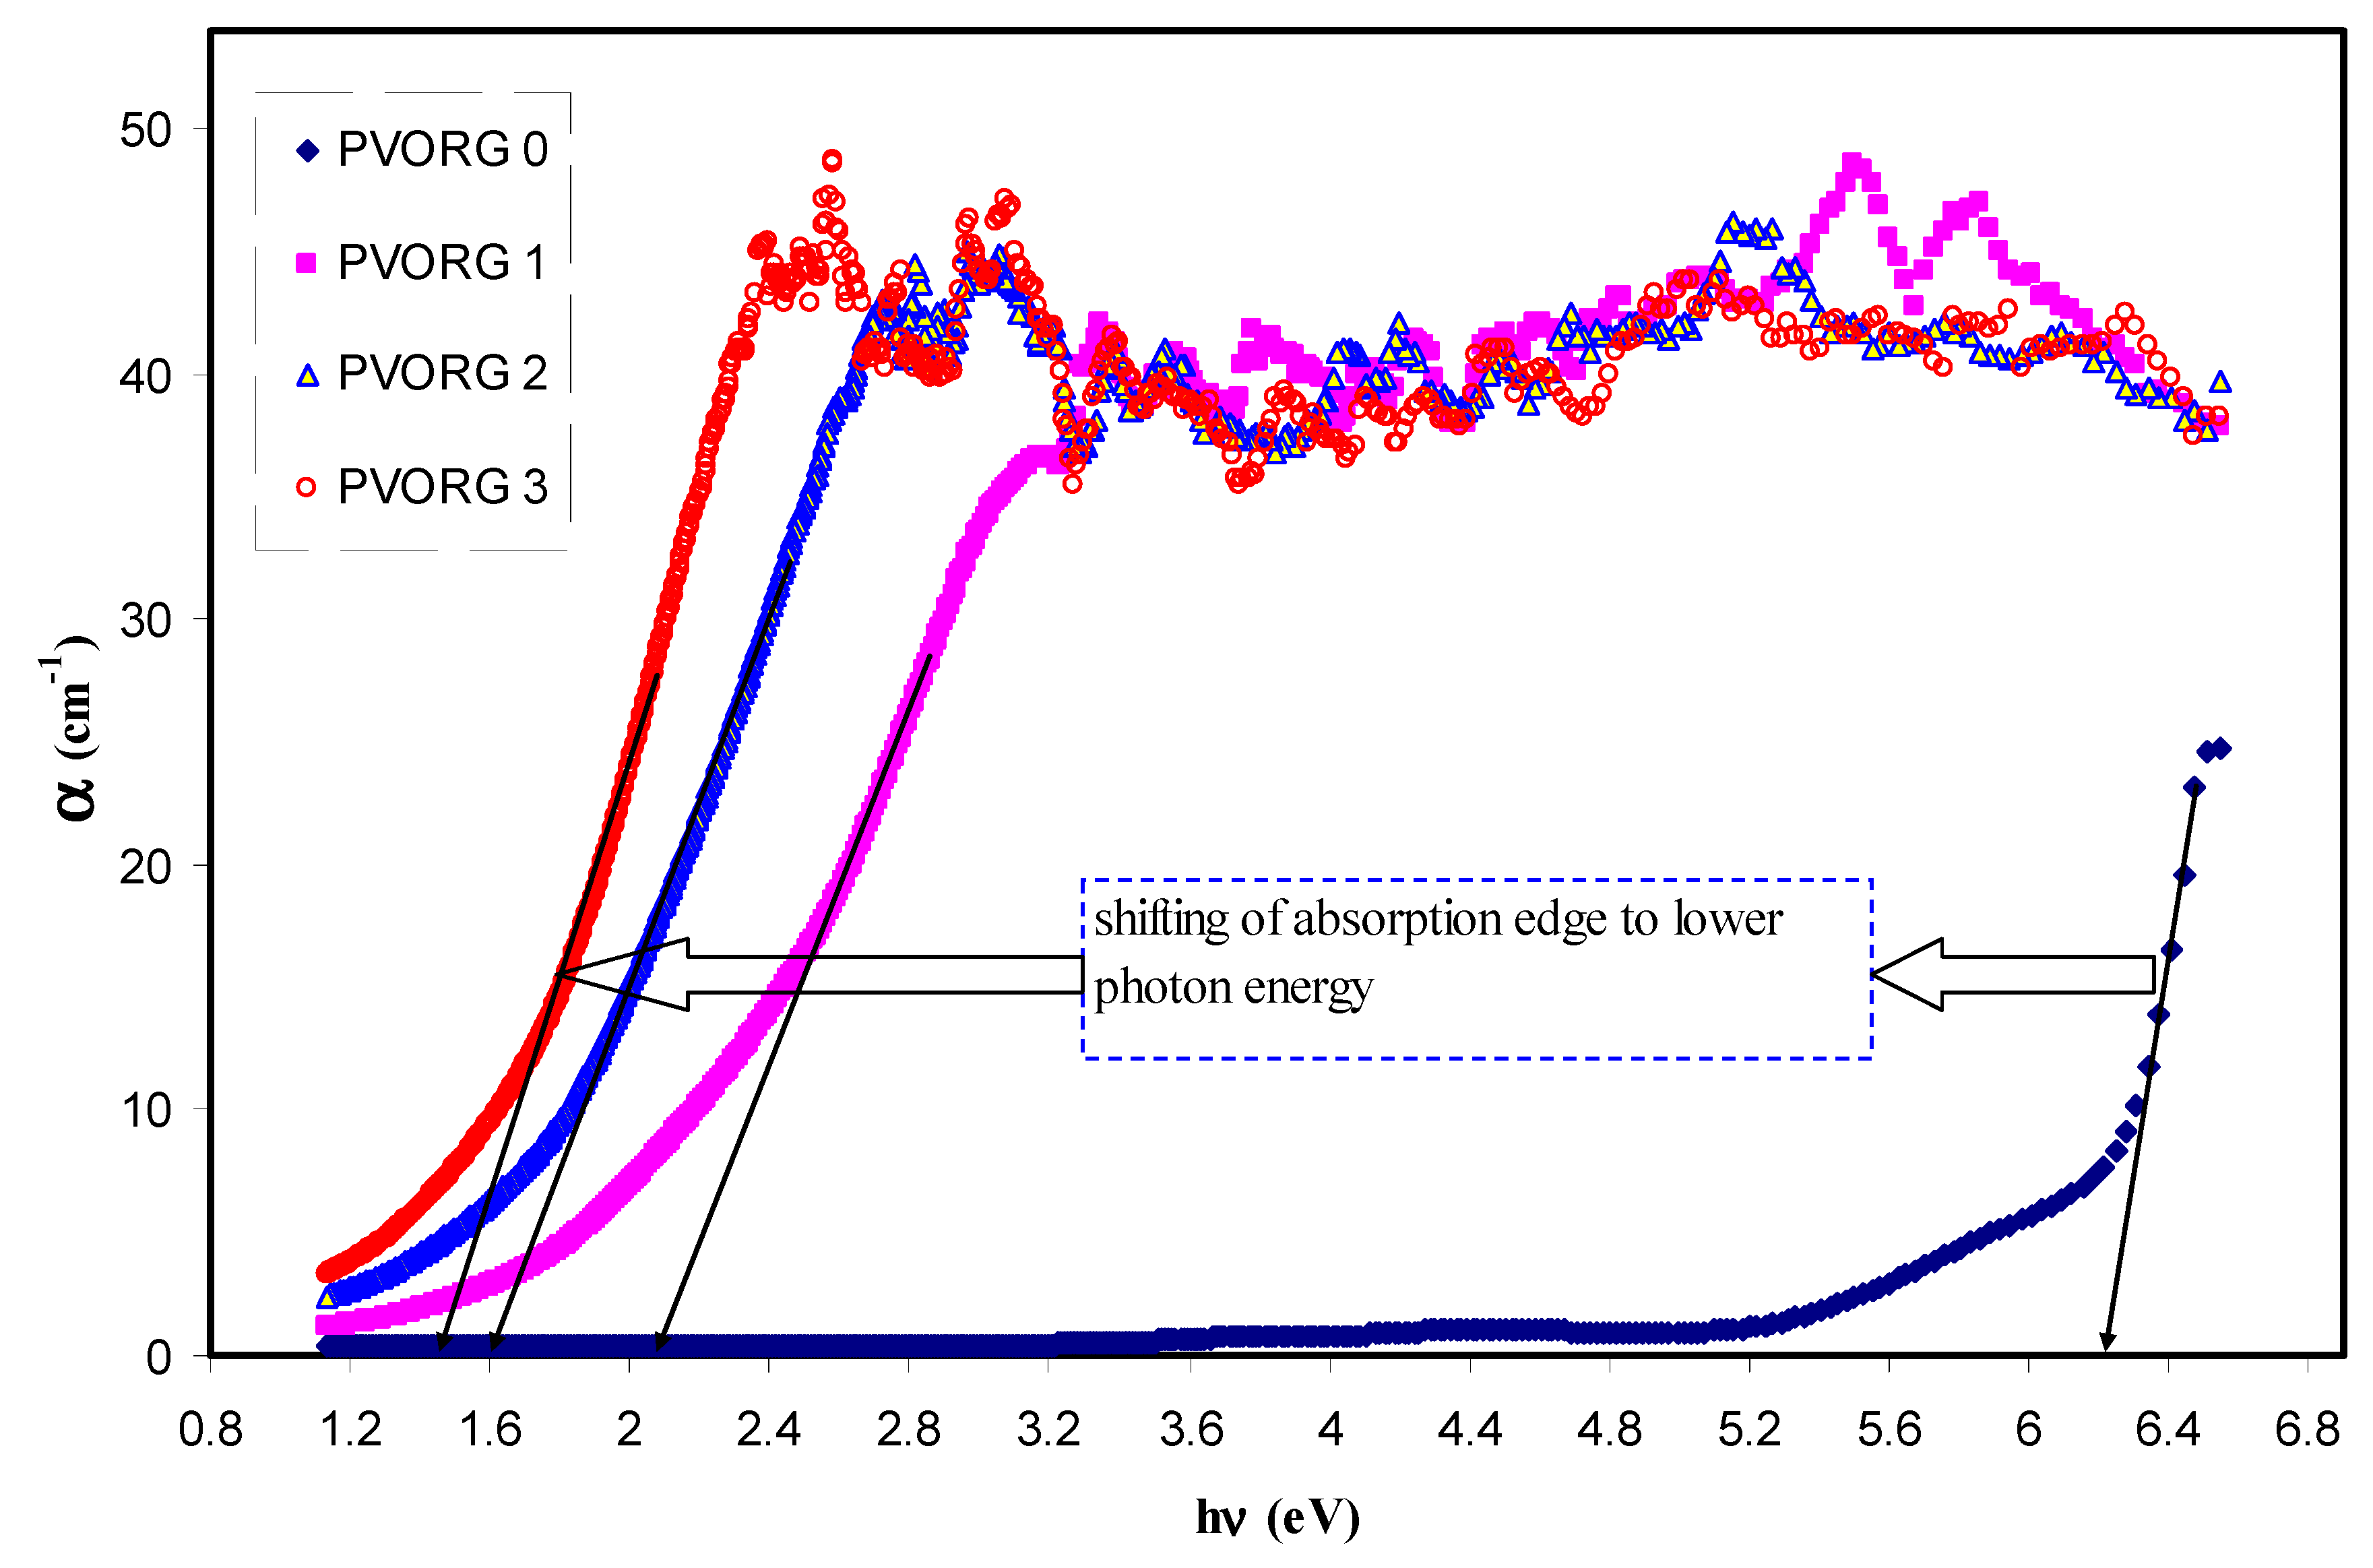
2.3.1. Absorption Study
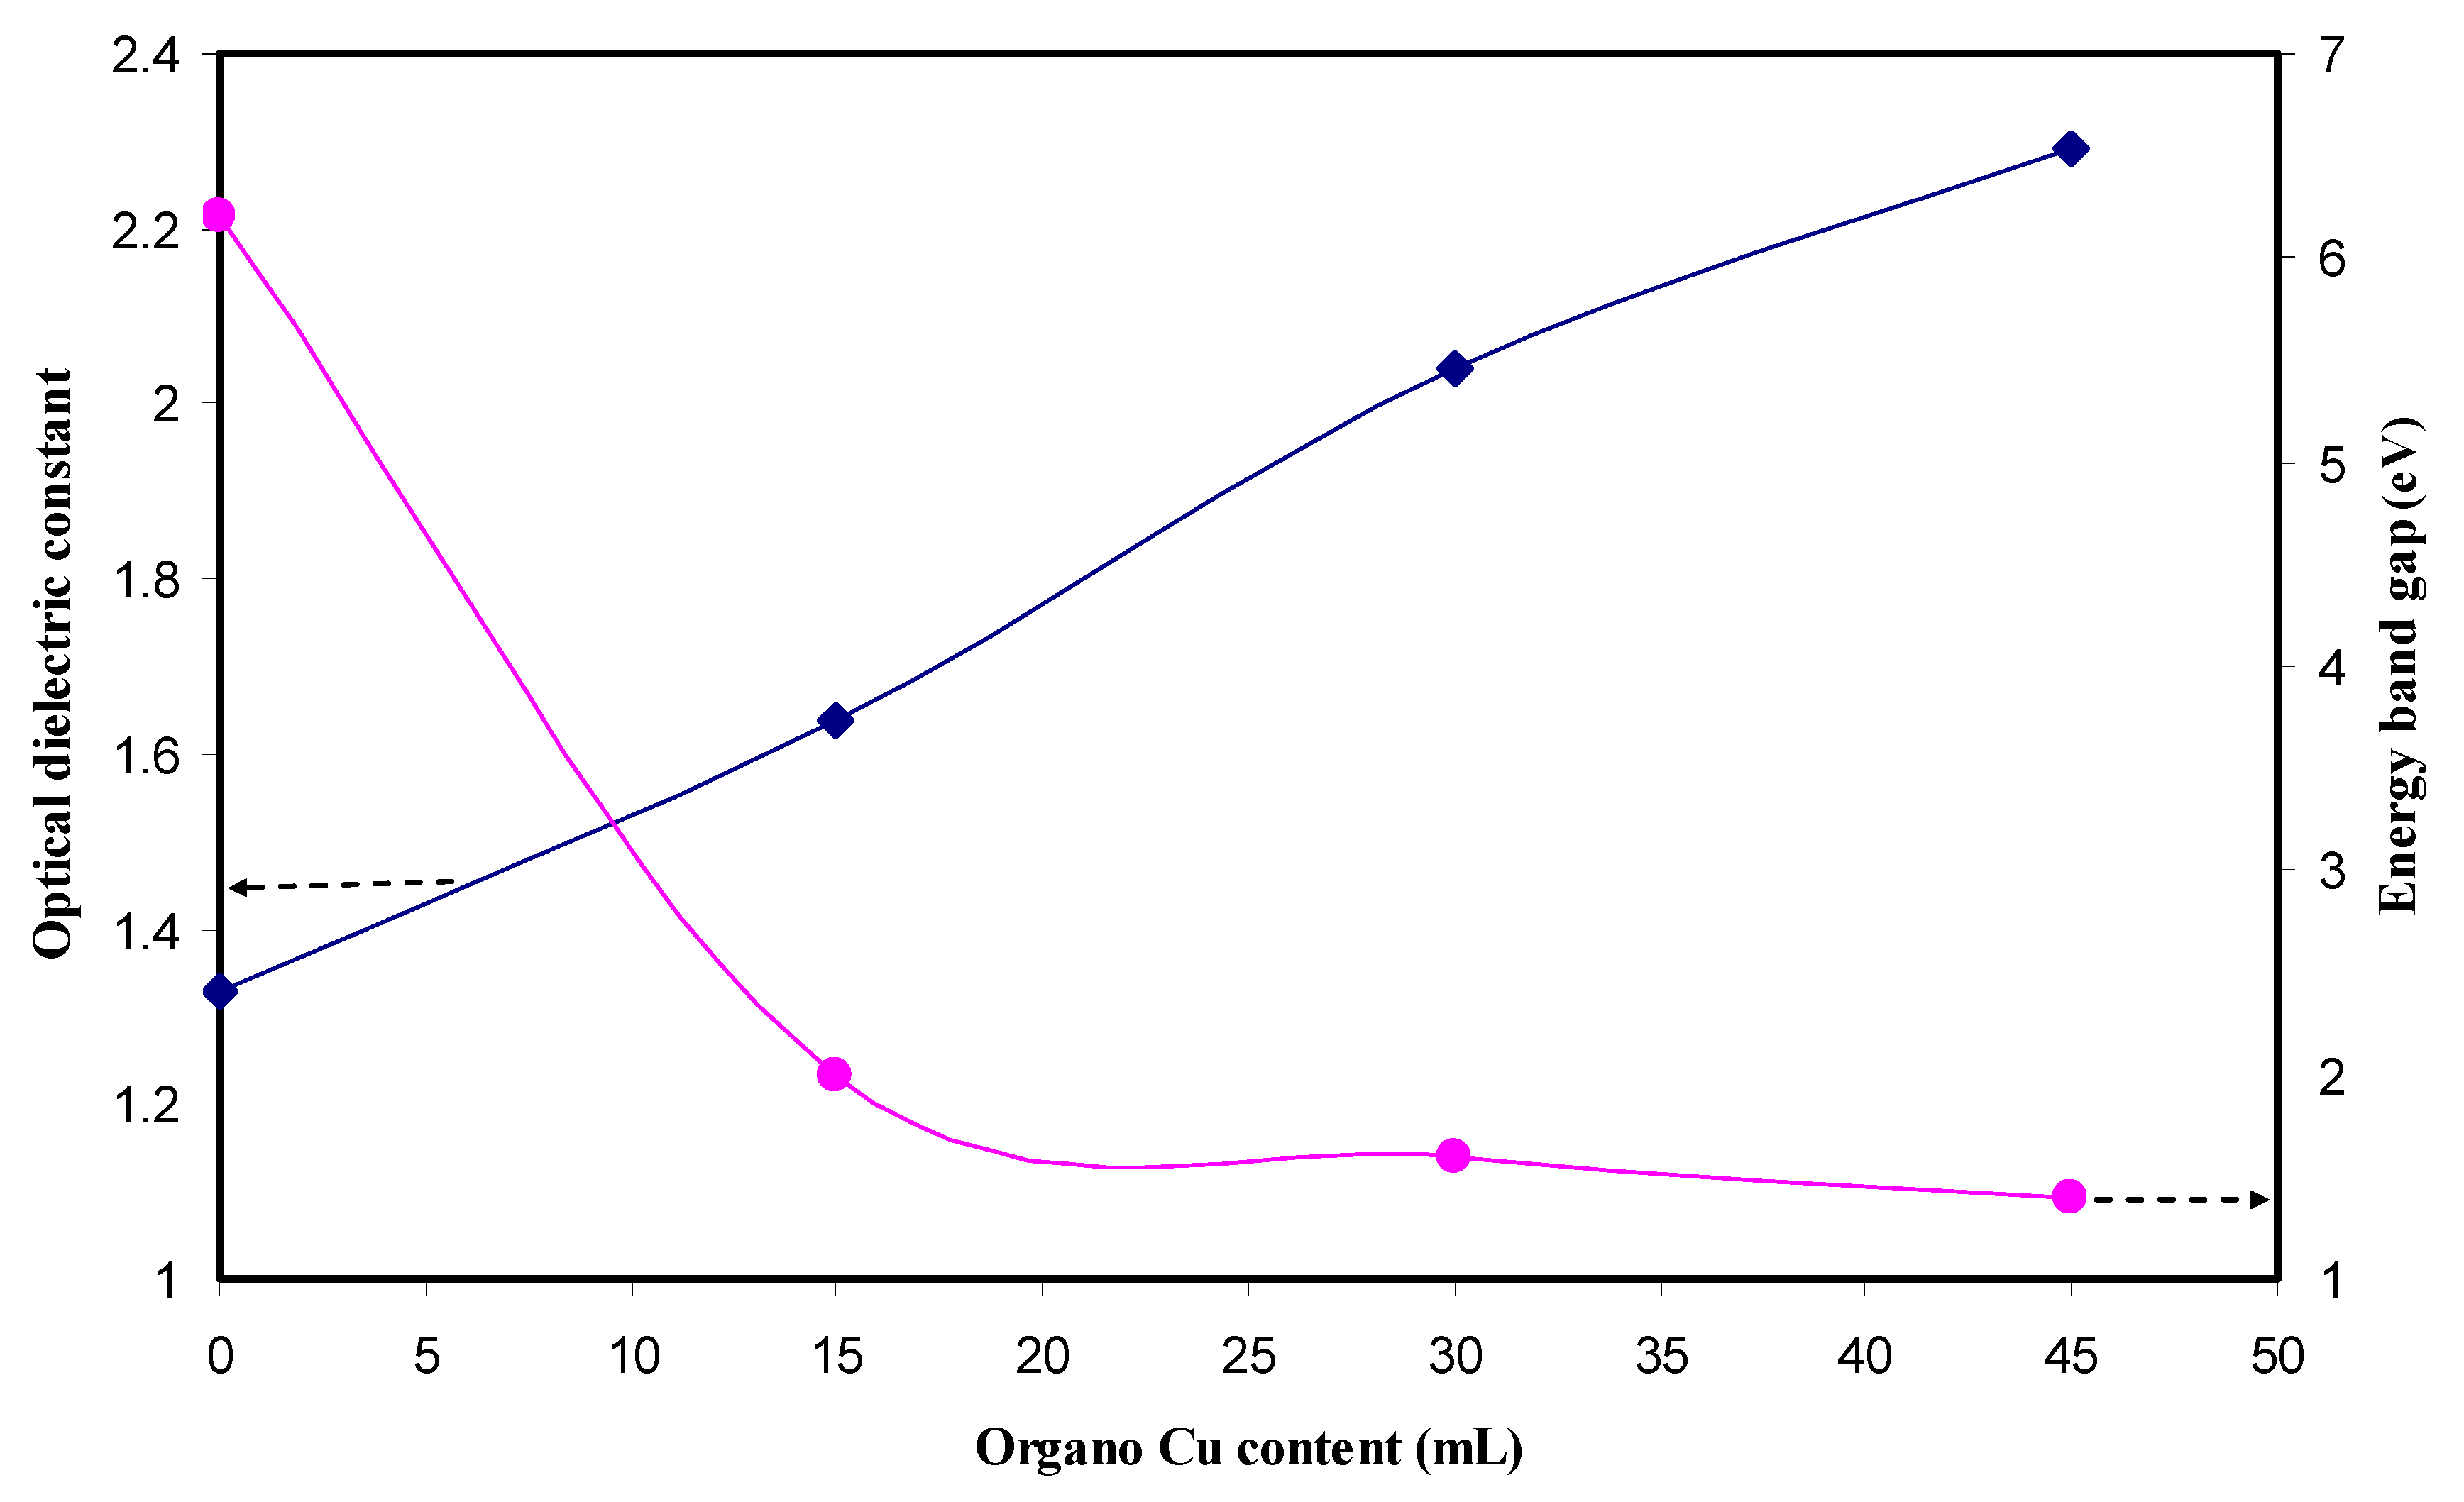
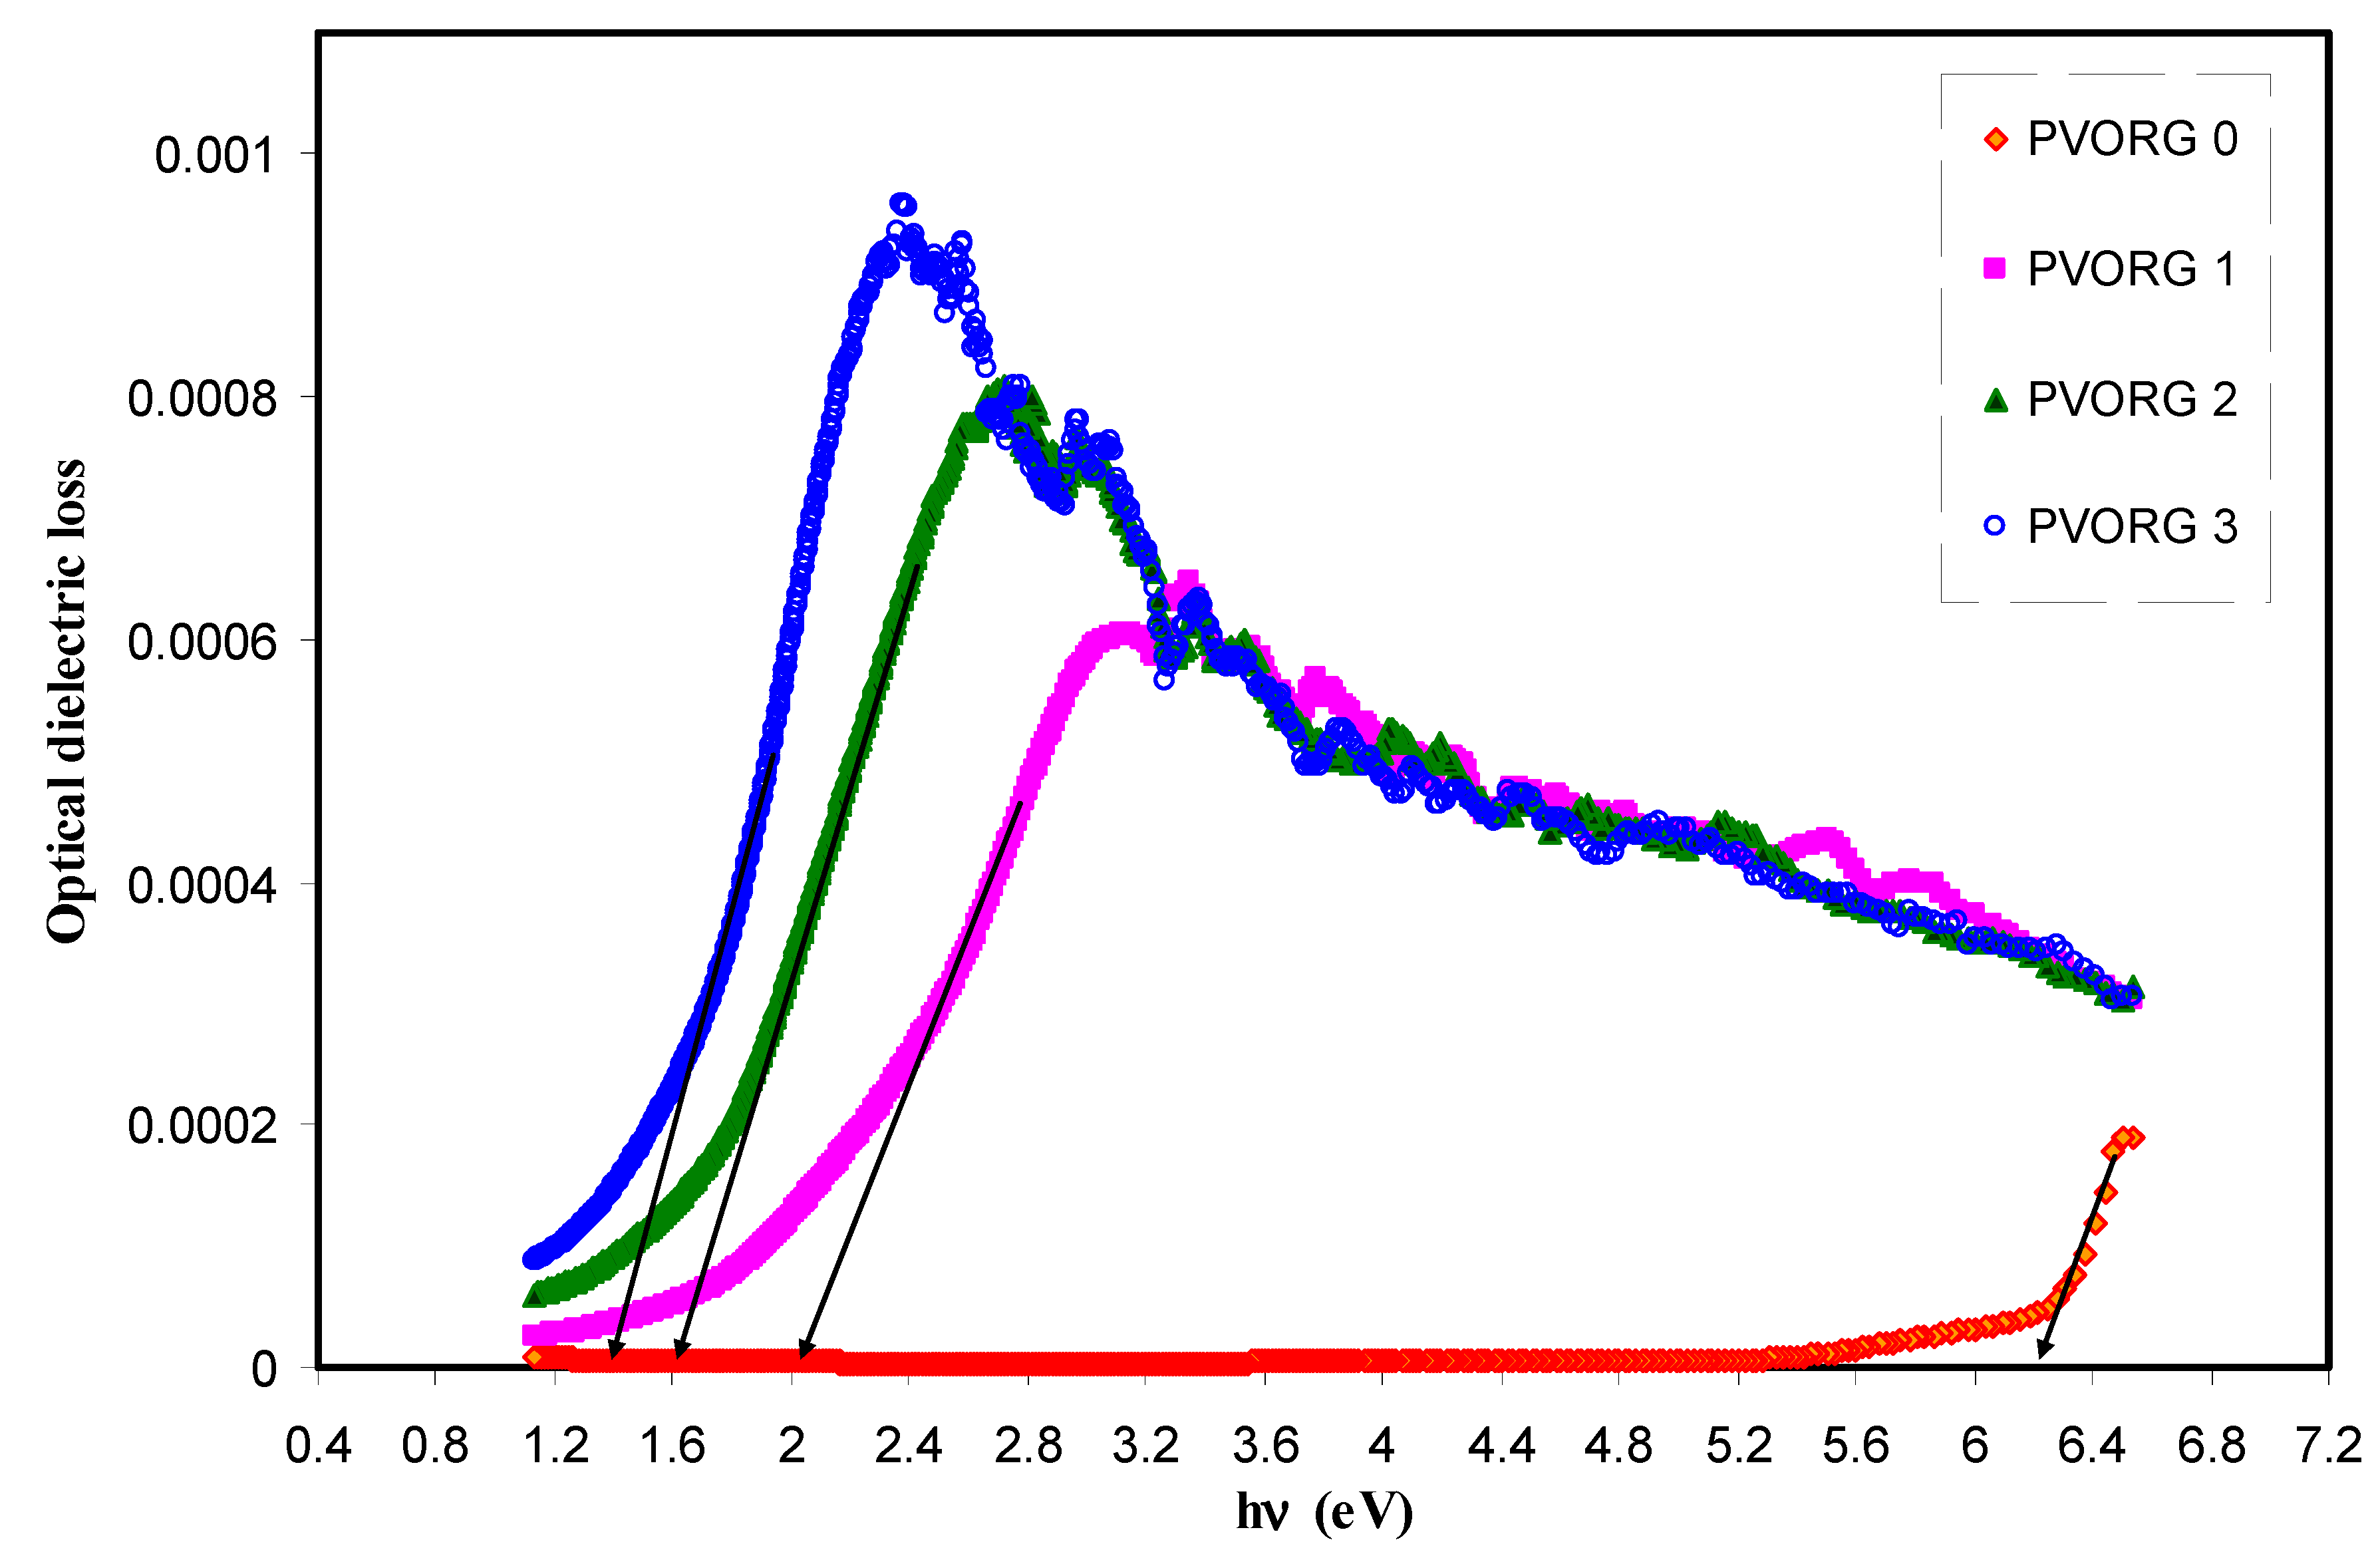
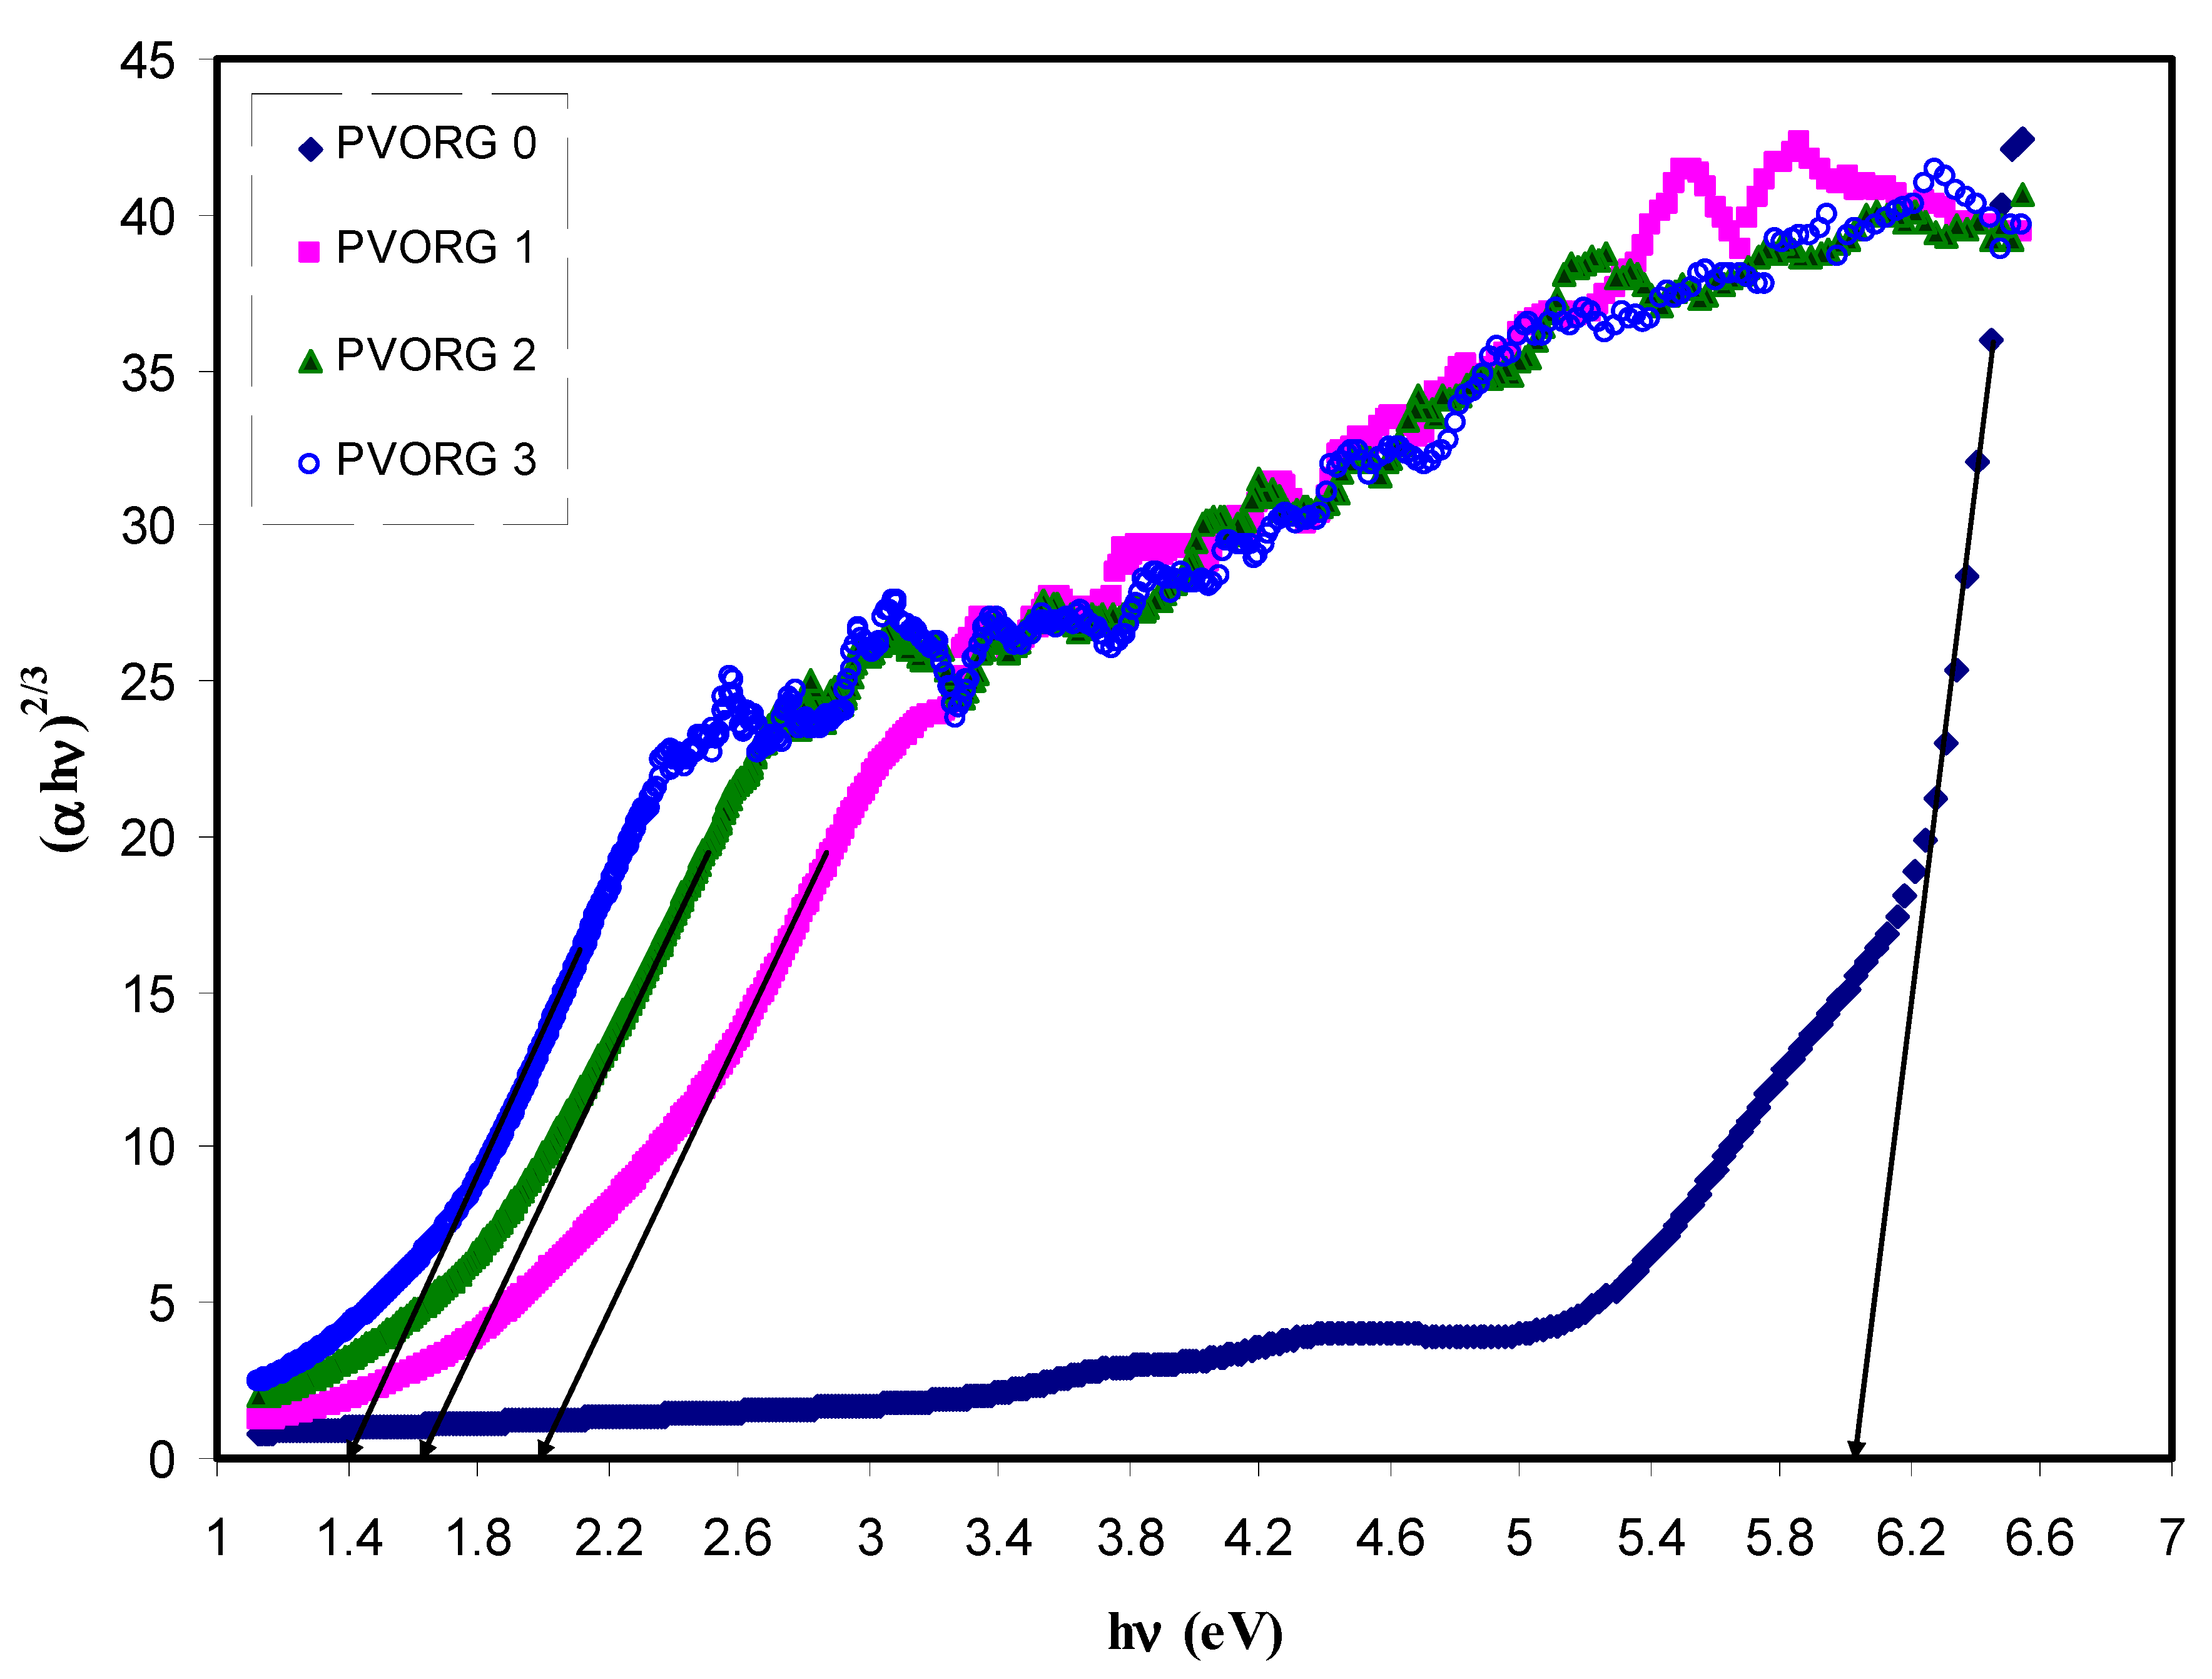
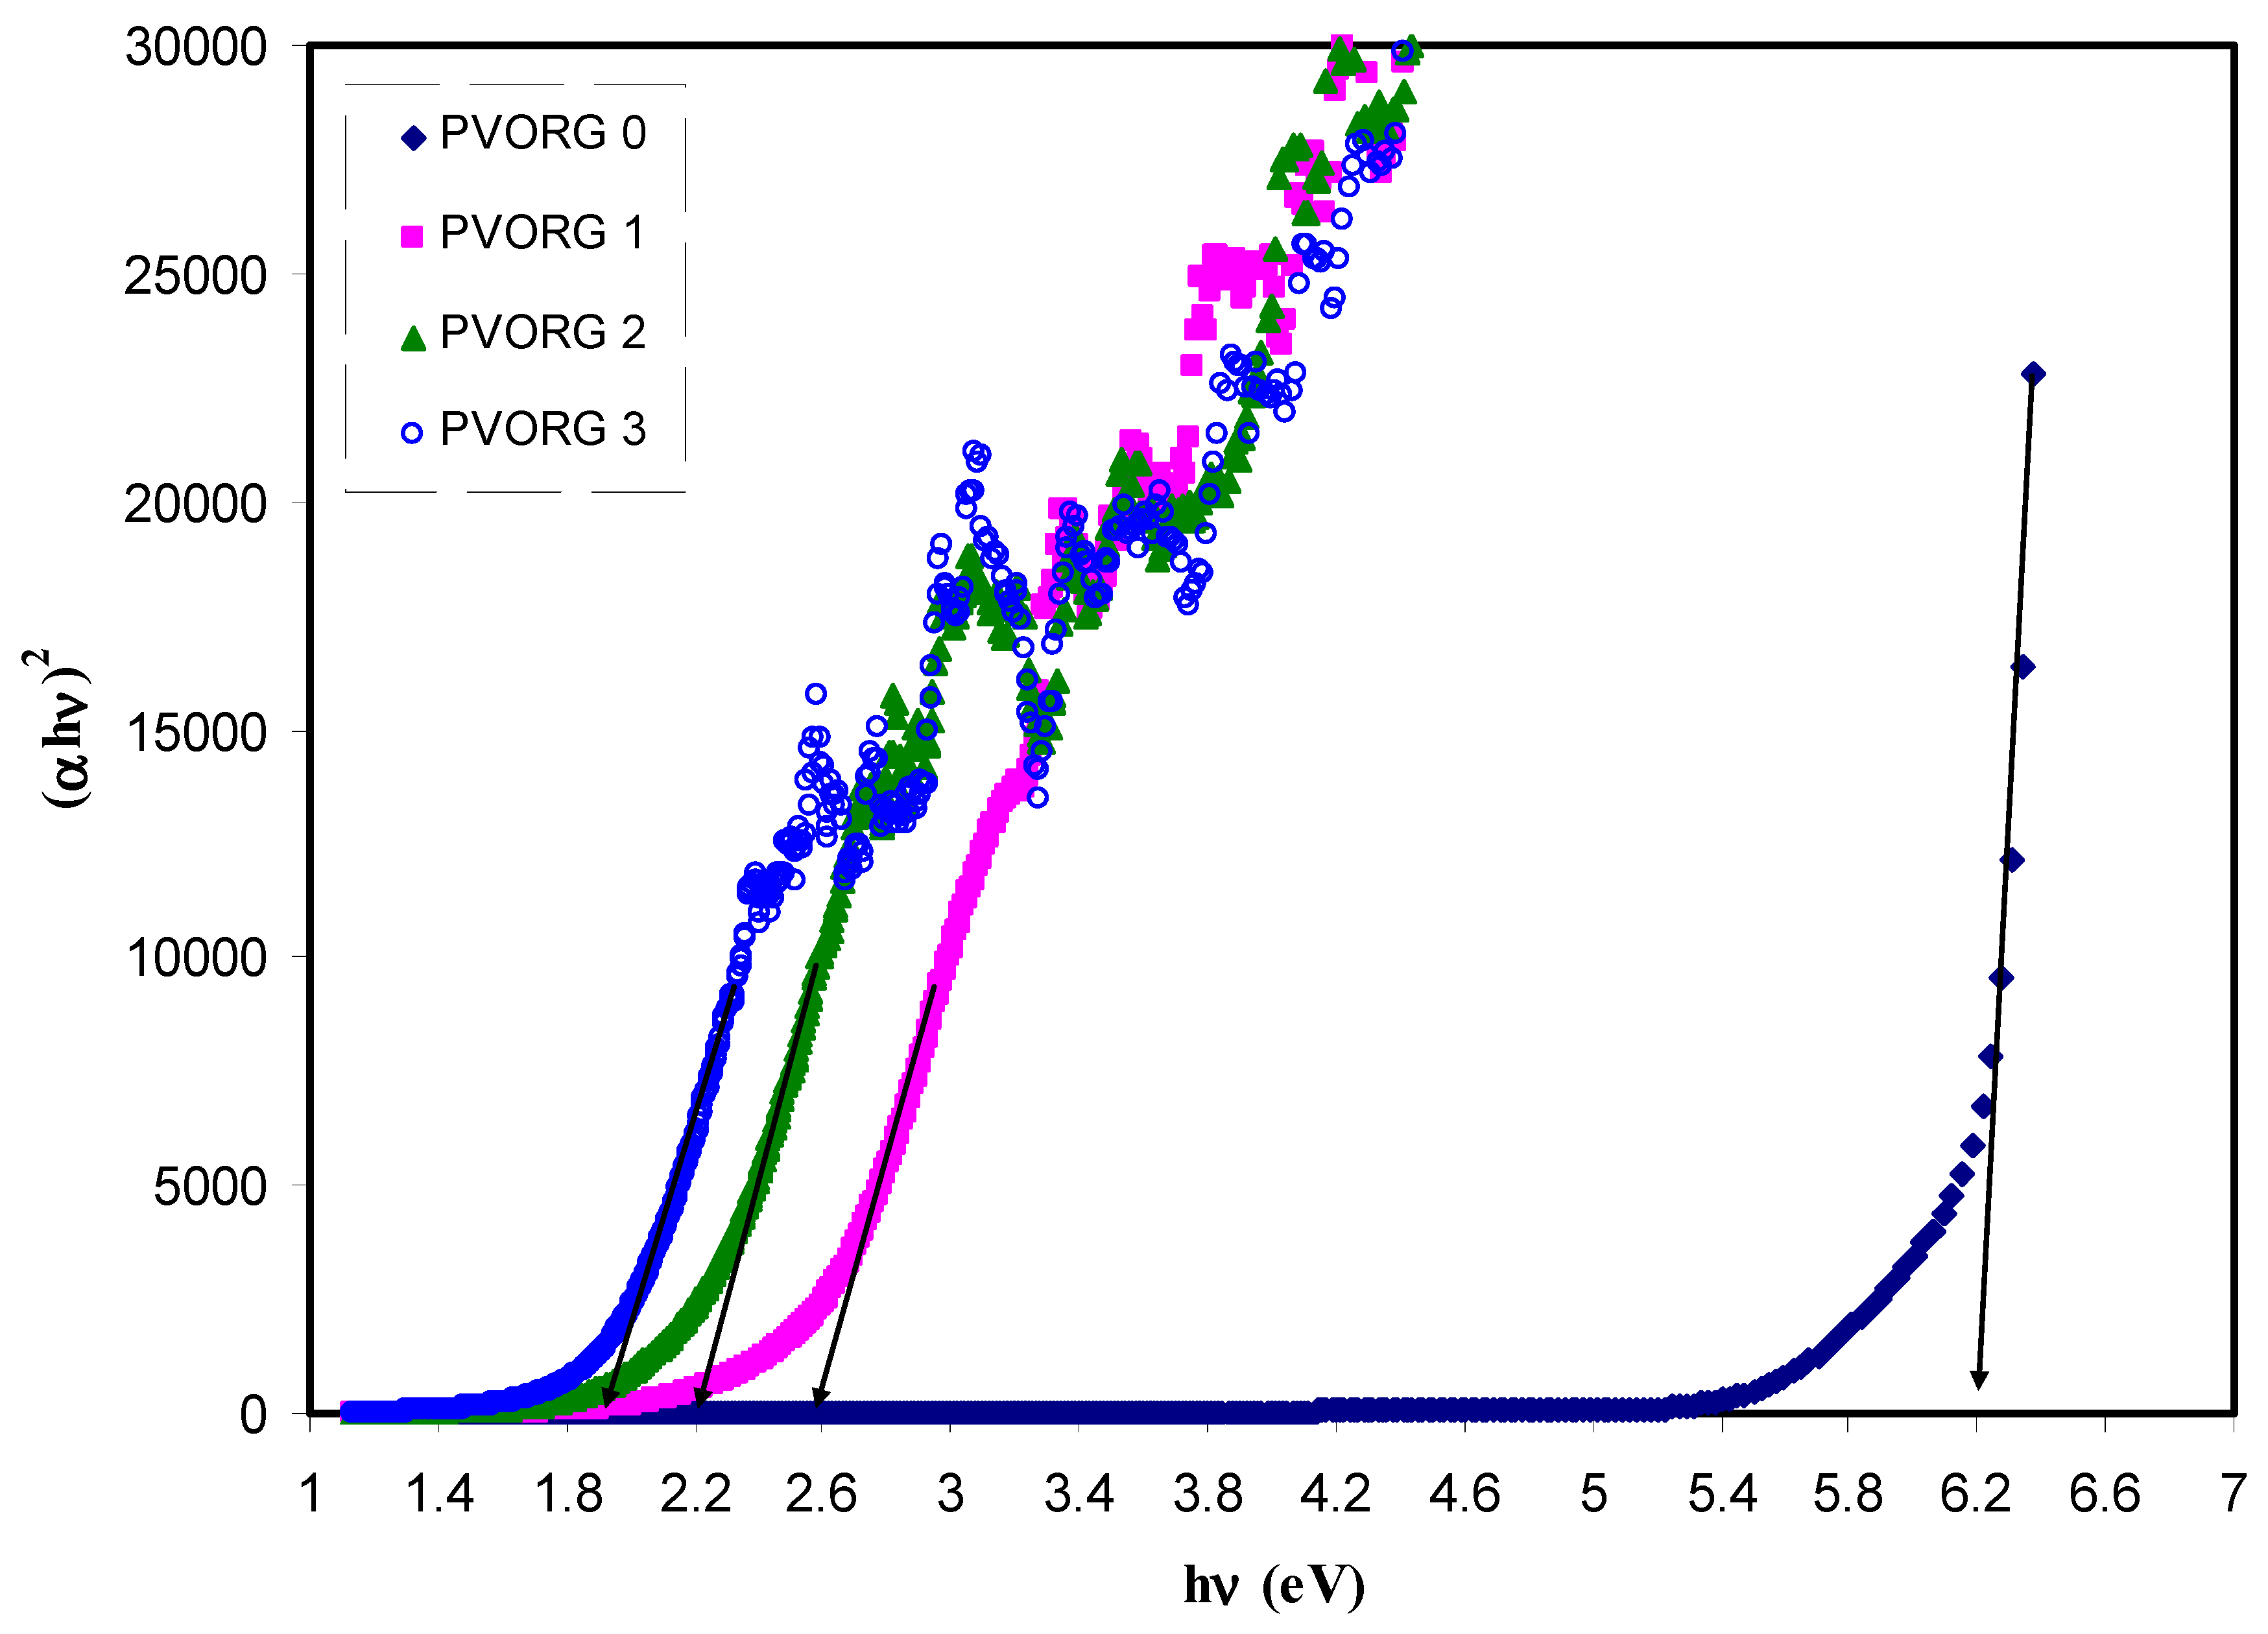
2.3.2. Band Gap Study
3. Materials and Methods
3.1. X-ray Diffraction
3.2. Fourier Transform Infrared (FTIR) Spectroscopy
3.3. UV- vis Measurement
4. Conclusions
Author Contributions
Funding
Acknowledgments
Conflicts of Interest
References
- Karman, S.B.; Diah, S.Z.M.; Gebeshuber, I.C. Raw Materials Synthesis from Heavy Metal Industry Effluents with Bioremediation and Phytomining: A Biomimetic Resource Management Approach. Adv. Mater. Sci. Eng. 2015, 2015, 1–21. [Google Scholar] [CrossRef]
- Dodson, J.R.; Parker, H.L.; García, A.M.; Hicken, A.; Asemave, K.; Farmer, T.J.; He, H.; Clark, J.H.; Hunt, A.J. Bio-derived materials as a green route for precious & critical metal recovery and re-use. Green Chem. 2015, 17, 1951–1965. [Google Scholar]
- Macek, T.; Mackova, M. Potential of biosorption technology. In Microbial Biosorption Metal; Springer: Dordrecht, The Netherlands, 2011; pp. 7–17. [Google Scholar]
- Igiri, B.E.; Okoduwa, S.I.R.; Idoko, G.O.; Akabuogu, E.P.; Adeyi, A.O.; Ejiogu, I.K. Toxicity and Bioremediation of Heavy Metals Contaminated Ecosystem from Tannery Wastewater: A Review. J. Toxicol. 2018, 2018, 1–16. [Google Scholar] [CrossRef] [PubMed]
- Jia, P.; Ouyang, R.; Cao, P.; Tong, X.; Zhou, X.; Lei, T.; Zhao, Y.; Guo, N.; Chang, H.; Miao, Y.; et al. Review: Recent advances and future development of metal complexes as anticancer agents. J. Coord. Chem. 2017, 70, 2175–2201. [Google Scholar] [CrossRef]
- Santos, A.F.; Brotto, D.F.; Favarin, L.R.V.; Cabeza, N.A.; Andrade, G.R.; Batistote, M.; Cavalheiro, A.A.; Neves, A.; Rodrigues, D.C.M.; dos Anjos, A. Study of the antimicrobial activity of metal complexes and their ligands through bioassays applied to plant extracts. Rev. Bras. Farmacogn. 2014, 24, 309–315. [Google Scholar] [CrossRef]
- Hossain, S.; Zakaria, C.M.; E-Zahan, K. Metal Complexes as Potential Antimicrobial Agent: A Review. Am. J. Heterocycl. Chem. 2018, 4, 1–21. [Google Scholar] [CrossRef]
- Ndagi, U.; Mhlongo, N.; Soliman, M.E. Metal complexes in cancer therapy—An update from drug design perspective. Drug Des. Devel. Ther. 2017, 11, 599–616. [Google Scholar] [CrossRef]
- Baysal, A.; Ozbek, N.; Akman, U. Determination of Trace Metals in Waste Water and Their Removal Processes. In Waste Water–Treatment Technologies and Recent Analytical Developments; INTECH: Rijeka, Croatia, 2013; pp. 145–171. [Google Scholar]
- Creighton, J.A.; Eadon, D.G. Ultraviolet–visible absorption spectra of the colloidal metallic elements. J. Chem. Soc. Faraday Trans. 1991, 87, 3881–3891. [Google Scholar] [CrossRef]
- Parola, S.; Julián-López, B.; Carlos, L.D.; Sanchez, C. Optical Properties of Hybrid Organic-Inorganic Materials and their Applications. Adv. Funct. Mater. 2016, 26, 6506–6544. [Google Scholar] [CrossRef]
- Zeranska-Chudek, K.; Lapinska, A.; Wroblewska, A.; Judek, J.; Duzynska, A.; Pawlowski, M.; Witowski, A.M.; Zdrojek, M. Study of the absorption coefficient of graphene-polymer composites. Sci. Rep. 2018, 8, 1–8. [Google Scholar] [CrossRef]
- Guggillia, P.; Chilvery, A.; Powell, R. Reducing the Bandgap Energy via Doping Process in Lead-Free Thin Film Nanocomposites. J. Mater. Sci. 2017, 5, 34–44. [Google Scholar]
- Lee, Y.H.; Hwang, E.K.; Kim, H.D. Colorimetric Assay and Antibacterial Activity of Cotton, Silk, and Wool Fabrics Dyed with Peony, Pomegranate, Clove, Coptischinenis and Gallnut Extracts. Materials 2009, 2, 10–21. [Google Scholar] [CrossRef]
- Hwang, E.K.; Lee, Y.H.; Kim, H.D. Dyeing, Fastness, and Deodorizing Properties of Cotton, Silk, and Wool Fabrics Dyed with Gardenia, Coffee Sludge, Cassia tora. L., and Pomegranate Extracts. Fibers Polym. 2008, 9, 334–340. [Google Scholar] [CrossRef]
- Loo, Y.Y.; Chieng, B.W.; Nishibuchi, M.; Radu, S. Synthesis of silver nanoparticles by using tea leaf extract from Camellia Sinensis. Int. J. Nanomed. 2012, 7, 4263–4267. [Google Scholar]
- Senthilkumar, S.R.; Sivakumar, T. Green tea (Camellia Sinensis) mediated synthesis of zinc oxide (ZnO) nanoparticles and studies on their antimicrobial activities. Int. J. Pharm. Pharm. Sci. 2014, 6, 461–465. [Google Scholar]
- Madeja, A.S.; Welna, M.; Zyrnicki, W. Multi-element analysis, bioavailability and fractionation of herbal tea products. J. Braz. Chem. Soc. 2013, 24, 777–787. [Google Scholar]
- Dubey, S.P.; Sillanpaa, M.; Varma, R.S. Reduction of Hexavalent Chromium Using Sorbariasorbifolia Aqueous Leaf Extract. Appl. Sci. 2017, 7, 715. [Google Scholar] [CrossRef]
- ÓCoinceanainn, M.; Astill, C.; Schumm, S. Potentiometric, FTIR and NMR studies of the complexation of metals with theaflavin. Dalton Trans. 2003, 5, 801–807. [Google Scholar] [CrossRef]
- Huang, L.; Weng, X.; Chen, Z.; Megharaj, M.; Naidu, R. Synthesis of iron-based nanoparticles using oolong tea extract for thedegradation of malachite green. Spectrochim. Acta Part A 2014, 117, 801–804. [Google Scholar] [CrossRef]
- Weng, X.; Huang, L.; Chen, Z.; Megharaj, M.; Naidu, R. Synthesis of iron-based nanoparticles by green tea extract and their degradation of malachite. Ind. Crop Prod. 2013, 51, 342–347. [Google Scholar] [CrossRef]
- Li, X.; Zhang, Y.; He, Y. Rapid detection of talcum powder in tea using FT-IR spectroscopy coupled with chemometrics. Sci. Rep. 2016, 6, 30313. [Google Scholar] [CrossRef]
- Ucun, F.; Saglam, A.; Guclu, V. Molecular structures and vibrational frequencies of Xanthine and its methyl derivatives (caffeine and theobromine) by ab initio Hatree-Fock and density functional theory calculations. Spectrochim. Acta Part A 2007, 67, 342–349. [Google Scholar] [CrossRef]
- Amane, E.L.M.; Hicham, E.H. Synthesis and Characterization of caffeine Complexes [M (caf) 4X2] M = Ni(II), Cu(II), Zn(II), Cd(II) X = SCN−, CN−; caf: Caffeine. Res. J. Chem. Sci. 2014, 4, 42–48. [Google Scholar]
- Wu, D.; Bird, M.R. The interaction of protein and polyphenol species in ready to drink black tea liquor production. J. Food Process Eng. 2010, 33, 481–505. [Google Scholar] [CrossRef]
- Goodman, B.A.; Severino, J.F.; Pirker, K.F. Reactions of green and black teas with Cu(II). Food Funct. 2012, 3, 399–409. [Google Scholar] [CrossRef]
- Acácio, A.F.Z.; Charles, W.I.H.; Aline, A.; Alessandro, N.; Ivo, M.D.; Daniel, G. A comparative study of the phenolic compounds and the in vitro antioxidant activity of different Brazilian teas usingmultivariate statistical techniques. Food Res. Int. 2014, 60, 246–254. [Google Scholar]
- Kolaylı, S.; Ocak, M.; Kucuk, M.; Abbasoglu, R. Does caffeine bind to metal ions? Food Chem. 2004, 84, 383–388. [Google Scholar] [CrossRef]
- Li, S.; Lo, C.-Y.; Pan, M.-H.; Lai, C.-S.; Ho, C.-T. Black tea: Chemical analysis and stability. Food Funct. 2013, 4, 10–18. [Google Scholar] [CrossRef]
- Hemaa, M.; Selvasekerapandian, S.; Sakunthala, A.; Arunkumar, D.; Nithya, H. Structural, vibrational and electrical characterization of PVA–NH4Br polymer electrolyte system. Phys. B Condensed Matter 2008, 403, 2740–2747. [Google Scholar] [CrossRef]
- Malathi, J.; Kumaravadivel, M.; Brahmanandhan, G.M.; Hema, M.; Baskaran, R.; Selvasekarapandian, S. Structural, thermal and electrical properties of PVA–LiCF3SO3 polymer electrolyte. J. Non-Cryst. Solids 2010, 356, 2277–2281. [Google Scholar] [CrossRef]
- Makled, M.H.; Sheha, E.; Shanap, T.S.; El-Mansy, M.K. Electrical conduction and dielectric relaxation in p-type PVA/CuI polymer composite. J. Adv. Res. 2013, 4, 531–538. [Google Scholar] [CrossRef]
- Jiang, L.; Yang, T.; Peng, L.; Dan, Y. Acrylamide modified poly(vinyl alcohol): Crystalline and enhanced water solubility. RSC Adv. 2015, 5, 86598–86605. [Google Scholar] [CrossRef]
- Aziz, S.B.; Rasheed, M.A.; Hussein, A.M.; Ahmed, H.M. Fabrication of polymer blend composites based on [PVA-PVP](1 − x):(Ag2S) x (0.01 ≤ x ≤ 0.03) with small optical band gaps: Structural and optical properties. Mater. Sci. Semicond. Process 2017, 71, 197–203. [Google Scholar] [CrossRef]
- Ahad, N.; Saion, E.; Gharibshahi, E. Structural, Thermal, and Electrical Properties of PVA-Sodium Salicylate Solid Composite Polymer Electrolyte. J. Nanomater. 2012, 2012, 8. [Google Scholar] [CrossRef]
- Aziz, S.B. Modifying Poly (Vinyl Alcohol) (PVA) from Insulator to Small- Bandgap Polymer: A Novel Approach for Organic Solar Cells and Optoelectronic Devices. J. Electron. Mater. 2015, 45, 736–745. [Google Scholar] [CrossRef]
- Hema, M.; Selvasekarapandian, S.; Arunkumar, A.; Sakunthala, A.; Nithya, H. FTIR, XRD and ac impedance spectroscopic study on PVA based polymer electrolyte doped with NH4X (X = Cl, Br, I). J. Non-Cryst. Solids 2009, 355, 84–90. [Google Scholar] [CrossRef]
- El-Nahass, M.M.; Farid, A.M.; Atta, A.A. Structural and optical properties of Tris(8-hydroxyquinoline) aluminum (III)(Alq3) thermal evaporated thin films. J. Alloy. Compd. 2010, 507, 112–119. [Google Scholar] [CrossRef]
- Xu, H.; Chen, R.; Sun, Q.; Lai, W.; Su, Q.; Huang, W.; Liu, X. Recent progress in metal–organic complexes for optoelectronic applications. Chem. Soc. Rev. 2014, 43, 3259–3302. [Google Scholar] [CrossRef]
- Malzner, F.J.; Prescimone, A.; Constable, E.C.; Housecroft, C.E.; Willgert, M. Exploring simple ancillary ligands in copper-based dyesensitized solar cells: Effects of a heteroatom switch and of co-sensitization. J. Mater. Chem. A 2017, 5, 4671–4685. [Google Scholar] [CrossRef]
- Molla, R.A.; Ghosh, K.; Tuhina, K.; Islam, S.M. Aerobic Oxidative Synthesis of Aryl Nitriles and Primary Aryl Amides from Benzylic Alcohols Catalyzed by Polymer Supported Cu(II) Complex. New J. Chem. 2015, 39, 921–930. [Google Scholar] [CrossRef]
- Aziz, S.B. Morphological and Optical Characteristics of Chitosan (1 − x): Cuox (4 ≤ x ≤ 12) Based Polymer Nano-Composites: Optical Dielectric Loss as an Alternative Method for Tauc’s Model. Nanomaterials 2017, 7, 444. [Google Scholar] [CrossRef]
- Henglein, A. Formation and Absorption Spectrum of Copper Nanoparticles from the Radiolytic Reduction of Cu(CN)2-. J. Phys. Chem. B. 2000, 104, 1206–1211. [Google Scholar] [CrossRef]
- Zhuo, H.Y.; Hu, A.Y.; Feng, L.; Liu, Q.Y.; Wang, X.P.; Sun, D. A Tetradecanuclear Organometallic Copper(I)-Alkynide Cluster: Synthesis, Crystal Structure, and Luminescent Property. J. Clust. Sci. 2018, 29, 1017–1022. [Google Scholar] [CrossRef]
- Aziz, S.B.; Abidin, Z.H.Z.; Arof, A.K. Influence of silver ion reduction on electrical modulus parameters of solid polymer electrolyte based on chitosan- silver triflate electrolyte membrane. Expresspolym. Lett. 2010, 4, 300–310. [Google Scholar] [CrossRef]
- Aziz, S.B.; Abidin, Z.H.Z.; Arof, A.K. Effect of silver nanoparticles on the DC conductivity in chitosan—Silver triflate polymer electrolyte. Phys. B 2010, 405, 4429–4433. [Google Scholar] [CrossRef]
- Aziz, S.B.; Hazrin, Z.; Abidin, Z.H.Z. Electrical and morphological analysis of chitosan: AgTf solid electrolyte. Mater. Chem. Phys. 2014, 144, 280–286. [Google Scholar] [CrossRef]
- Aziz, S.B.; Abidin, Z.H.Z.; Kadir, M.F.Z. Innovative method to avoid the reduction of silver ions to silver nanoparticles (Ag + → Ago) in silver ion conducting based polymer electrolytes. Phys. Scr. 2015, 90, 35808. [Google Scholar] [CrossRef]
- Aziz, S.B.; Abdullah, R.M. Crystalline and amorphous phase identification from the tanδ relaxation peaks and impedance plots in polymer blend electrolytes based on [CS:AgNt]x: PEO (x-1) (10 ≤ x ≤ 50). Electrochim. Acta 2018, 285, 30–46. [Google Scholar] [CrossRef]
- Aziz, S.B.; Abdullah, R.M.; Kadir, M.F.Z.; Ahmed, H.M. Non suitability of silver ion conducting polymer electrolytes based on chitosan mediated by barium titanate (BaTiO3) for electrochemical device applications. Electrochim. Acta 2019, 296, 494–507. [Google Scholar] [CrossRef]
- Aziz, S.B. The Mixed Contribution of Ionic and Electronic Carriers to Conductivity in Chitosan Based Solid Electrolytes Mediated by CuNt Salt. J. Inorg. Organomet. Polym. Mater. 2018, 28, 1942–1952. [Google Scholar] [CrossRef]
- Yakuphanoglu, F.; Kandaz, M.; Yaraşir, M.N.; Senkal, F.B. Electrical transport and optical properties of an organic semiconductor based on phthalocyanine. Phys. B 2007, 393, 235–238. [Google Scholar] [CrossRef]
- Sa’nchez Vergara, M.E.; Ortiz Rebollo, A.; Alvarez, J.R.; Rivera, M. Molecular materials derived from MPc (M = Fe, Pb, Co) and 1,8-dihydroxiantraquinone thin films: Formation, electrical and optical properties. J. Phys. Chem. Solids 2008, 69, 1–7. [Google Scholar] [CrossRef]
- Aziz, S.B.; Hamsan, M.H.; Kadir, M.F.Z.; Karim, W.O.; Abdullah, R.M. Development of Polymer Blend Electrolyte Membranes Based on Chitosan: Dextran with High Ion Transport Properties for EDLC Application. Int. J. Mol. Sci. 2019, 20, 3369. [Google Scholar] [CrossRef]
- Li, X.-Y.; Zhang, C.-R.; Wu, Y.-Z.; Zhang, H.-M.; Wang, W.; Yuan, L.-H.; Yang, H.; Liu, Z.-J.; Chen, H.-S. The Role of Porphyrin-Free-Base in the Electronic Structures and Related Properties of N-Fused Carbazole-Zinc Porphyrin Dye Sensitizers. Int. J. Mol. Sci. 2015, 16, 27707–27720. [Google Scholar] [CrossRef]
- El-Shishtawy, R.M.; Elroby, S.A.; Asiri, A.M.; Müllen, K. Optical Absorption Spectra and Electronic Properties of Symmetric and Asymmetric Squaraine Dyes for Use in DSSC Solar Cells: DFT and TD-DFT Studies. Int. J. Mol. Sci. 2016, 17, 487. [Google Scholar] [CrossRef]
- Mohamed, S.A.; Al-Ghamdi, A.A.; Sharma, G.D.; Mansy, M.K.E. Effect of ethylene carbonate as a plasticizer on CuI/PVA nanocomposite: Structure, optical and electrical properties. J. Adv. Res. 2014, 5, 79–86. [Google Scholar] [CrossRef]
- Soylu, M.; Al-Ghamdi, A.A.; Yakuphanoglu, F. Transparent CdO/n-GaN(0001) heterojunction for optoelectronic applications. J. Phys. Chem. Solids 2015, 85, 26–33. [Google Scholar] [CrossRef]
- Abdullah, R.M.; Aziz, S.B.; Mamand, S.M.; Hassan, A.Q.; Hussein, S.A.; Kadir, M.F.Z. Reducing the Crystallite Size of Spherulites in PEO-Based Polymer Nanocomposites Mediated by Carbon Nanodots and Ag Nanoparticles. Nanomaterials 2019, 9, 874. [Google Scholar] [CrossRef]
- Yakuphanoglu, F.; Arslan, M. The fundamental absorption edge and optical constants of some charge transfer compounds. Opt. Mater. 2004, 27, 29–37. [Google Scholar] [CrossRef]
- Siddaiaha, T.; Ojhaa, P.; Kumara, N.O.G.V.R.; Ramua, C. Structural, Optical and Thermal Characterizations of PVA/MAA: EA Polyblend Films. Mater. Res. 2018, 21, 1–10. [Google Scholar]
- Mansouri, S.; Bourguiga, R.; Yakuphanoglu, F. Modeling of organic thin film field-effect transistors based on pentacenein saturation regime: Effect of light illumination. Microelectron. Reliab. 2012, 52, 2585–2591. [Google Scholar] [CrossRef]
- Gunduz, B.; Yahia, I.S.; Yakuphanoglu, F. Electrical and photoconductivity properties of p-Si/P3HT/Al and p-Si/P3HT:MEH-PPV/Al organic devices: Comparison study. Microelectron. Eng. 2012, 98, 41–57. [Google Scholar] [CrossRef]
- Yakuphanoglua, F.; Sekerci, M. Determination of the optical constants of Co(II) complex of schiff base obtained from 1,8-diaminonaphthalene thin film by infrared spectra. J. Mol. Struct. 2005, 751, 200–203. [Google Scholar] [CrossRef]
- Yakuphanoglua, F.; Arslan, M. Determination of thermo-optic coefficient, refractive index, optical dispersion and group velocity parameters of an organic thin film. Phys. B 2007, 393, 304–309. [Google Scholar] [CrossRef]
- Aziz, S.B.; Hussein, S.; Hussein, A.M.; Saeed, S.R. Optical characteristics of polystyrene based solid polymer composites: Effect of metallic copper powder. Int. J. Met. 2013, 2013, 1–6. [Google Scholar] [CrossRef]
- Li, S.; Lin, M.M.; Toprak, M.S.; Kim, D.K.; Muhammed, M. Nanocomposites of polymer and inorganic nanoparticles for optical and magnetic applications. Nano. Rev. 2010, 1, 5214. [Google Scholar] [CrossRef]
- Saini, I.; Rozra, J.; Chandak, N.; Aggarwal, S.; Sharma, P.K.; Sharma, A. Tailoring of electrical, optical and structural properties of PVA by addition of Ag nanoparticles. Mater. Chem. Phys. 2013, 139, 802–810. [Google Scholar] [CrossRef]
- Biskri, Z.E.; Rached, H.; Bouchear, M.; Rached, D.; Aida, M.S. A Comparative Study of Structural Stability and Mechanical and Optical Properties of Fluorapatite (Ca5(PO4)3F) and Lithium Disilicate (Li2Si2O5) Components Forming Dental Glass-Ceramics: First Principles Study. J. Electron. Mater. 2016, 45, 5082–5095. [Google Scholar] [CrossRef]
- Ravindra, N.M.; Ganapathy, P.; Choi, J. Energy gap-refractive index relations in semiconductors—An overview. Infrared Phys. Technol. 2007, 50, 21–29. [Google Scholar] [CrossRef]
- Plass, M.F.; Popov, C.; Ivanov, B.; Mänd, S.; Jelinek, M.; Zambov, L.M.; Kulisch, W. Correlation between photoluminescence, optical and structuralproperties of amorphous nitrogen-rich carbon nitride films. Appl. Phys. A 2001, 72, 21–27. [Google Scholar] [CrossRef]
- Cardona, M. Optical Properties and Electronic Density of States. J. Res. Nat. Bur. Stand. A Phys. Chem. 1970, 74A, 253–265. [Google Scholar] [CrossRef]
- Kroon, R.; Lenes, M.C.; Hummelen, J.; Blom, P.W.M.; DeEBoer, B. Small Band gap Polymers for Organic Solar Cells. Polym. Rev. 2008, 48, 531–582. [Google Scholar] [CrossRef]
- Yakuphanoglua, F.; Arslan, M. Determination of electrical conduction mechanism and optical band gap of a new charge transfer complex: TCNQ-PANT. Solid State Commun. 2004, 132, 229–234. [Google Scholar] [CrossRef]
- Aziz, S.B.; Abdullah, O.G.; Hussein, A.M.; Ahmed, H.M. From Insulating PMMA Polymer to Conjugated Double Bond Behavior: Green Chemistry as a Novel Approach to Fabricate Small Band Gap Polymers. Polymers 2017, 9, 626. [Google Scholar] [CrossRef]
- Aziz, S.B.; Rasheed, M.A.; Ahmed, H.M. Synthesis of Polymer Nanocomposites Based on [Methyl Cellulose](1 − x):(CuS) x (0.02 M ≤ x ≤ 0.08 M) with Desired Optical Band Gaps. Polymers 2017, 9, 194. [Google Scholar] [CrossRef]
- Aziz, S.B.; Abdullah, O.G.; Rasheed, M.A. A novel polymer composite with a small optical band gap: New approaches for photonics and optoelectronics. J. Appl. Polym. Sci. 2017, 134, 44847. [Google Scholar] [CrossRef]
- Aziz, S.B.; Abdullah, O.G.; Hussein, A.M.; Abdulwahid, R.T.; Rasheed, M.A.; Ahmed, H.M.; Abdalqadir, S.W.; Mohammed, A.R. Optical properties of pure and doped PVA: PEO based solid polymer blend electrolytes: Two methods for band gap study. J. Mater. Sci. Mater. Electron. 2017, 28, 7473–7479. [Google Scholar] [CrossRef]
- Aziz, S.B.; Rasheed, M.A.; Abidin, Z.H.Z. Optical and electrical characteristics of silver ion conducting nanocomposite solid polymer electrolytes based on chitosan. J. Electron. Mater. 2017, 46, 6119–6130. [Google Scholar] [CrossRef]
- Aziz, S.B.; Mamand, S.M.; Saeed, S.R.; Abdullah, R.M.; Hussein, S.A. New Method for the Development of Plasmonic Metal-Semiconductor Interface Layer: Polymer Composites with Reduced Energy Band Gap. J. Nanomater. 2017, 2017, 1–9. [Google Scholar] [CrossRef]
- Aziz, S.B.; Ahmed, H.M.; Hussein, A.M.; Fathulla, A.B.; Wsw, R.M.; Hussein, R.T. Tuning the absorption of ultraviolet spectra and optical parameters of aluminum doped PVA based solid polymer composites. J. Mater. Sci. Mater. Electron. 2015, 26, 8022–8028. [Google Scholar] [CrossRef]
- Guo, M.; Du, J. First-principles study of electronic structures and optical properties of Cu, Ag, and Au-doped anatase TiO2. Phys. B 2012, 407, 1003–1007. [Google Scholar] [CrossRef]
- Bouzidi, C.; Horchani-Naifer, K.; Khadraoui, Z.; Elhouichet, H.; Ferid, M. Synthesis, characterization and DFT calculations of electronic and optical properties of CaMoO4. Phys. B 2016, 497, 34–38. [Google Scholar] [CrossRef]
- Feng, J.; Xiao, B.; Chen, J.C.; Zhou, C.T.; Du, Y.P.; Zhou, R. Optical properties of new photovoltaic materials: AgCuO2 and Ag2Cu2O3. Solid State Commun. 2009, 149, 1569–1573. [Google Scholar] [CrossRef]
- Logothetidis, S. Optical and electronic properties of amorphous carbon materials. Diam. Relat. Mater. 2003, 12, 141–150. [Google Scholar] [CrossRef]
- Yu, L.; Li, D.; Zhao, S.; Li, G.; Yang, K. First Principles Study on Electronic Structure and Optical Properties of Ternary GaAs: Bi Alloy. Materials 2012, 5, 2486–2497. [Google Scholar] [CrossRef]
- Dresselhaus, M.S. Solid State Physics Part II Optical Properties of Solids; Wiley: New York, NY, USA, 2001. [Google Scholar]
- Yakuphanoglu, F.; Sekerci, M.; Ozturk, O.F. The determination of the optical constants of Cu(II) compound having 1-chloro-2,3-o-cyclohexylidinepropane thin film. Opt. Commun. 2004, 239, 275–280. [Google Scholar] [CrossRef]
- Ahmed, N.M.; Sauli, Z.; Hashim, U.; Al-Douri, Y. Investigation of the absorption coefficient, refractive index, energy band gap, and film thickness for Al0.11Ga0.89N, Al0.03Ga0.97N, and GaN by optical transmission method. Int. J. Nanoelectron. Mater. 2009, 2, 189–195. [Google Scholar]
- Baishya, U.; Sarkar, D. Structural and optical properties of zinc sulphide-polyvinyl alcohol (ZnS-PVA) nanocomposite thin films: Effect of Zn source concentration. Bull. Mater. Sci. 2011, 34, 1285–1288. [Google Scholar] [CrossRef]
- Mansour, S.A.; Yakuphanoglu, F. Electrical-optical properties of nanofiber ZnO film grown by sol gel method and fabrication of ZnO/p-Si heterojunction. Solid State Sci. 2012, 14, 121–126. [Google Scholar] [CrossRef]
- Meftah, A.M.; Gharibshahi, E.; Soltani, N.; Yunus, W.M.M.; Saion, E. Structural, Optical and Electrical Properties of PVA/PANI/Nickel Nanocomposites Synthesized by Gamma Radiolytic Method. Polymers 2014, 6, 2435–2450. [Google Scholar] [CrossRef]


| Sample Code | Absorption Edge (eV) |
|---|---|
| PVORG0 | 6.21 |
| PVORG1 | 2.04 |
| PVORG2 | 1.62 |
| PVORG3 | 1.41 |
| Sample Code | Eg for γ = 1/2 | Eg for γ = 3/2 | Eg from ɛi Plot |
|---|---|---|---|
| PVORG0 | 6.2 | 6.06 | 6.2 |
| PVORG1 | 2.6 | 2 | 2 |
| PVORG2 | 2.2 | 1.61 | 1.6 |
| PVORG3 | 1.9 | 1.4 | 1.4 |
© 2019 by the authors. Licensee MDPI, Basel, Switzerland. This article is an open access article distributed under the terms and conditions of the Creative Commons Attribution (CC BY) license (http://creativecommons.org/licenses/by/4.0/).
Share and Cite
Brza, M.A.; Aziz, S.B.; Anuar, H.; Al Hazza, M.H.F. From Green Remediation to Polymer Hybrid Fabrication with Improved Optical Band Gaps. Int. J. Mol. Sci. 2019, 20, 3910. https://doi.org/10.3390/ijms20163910
Brza MA, Aziz SB, Anuar H, Al Hazza MHF. From Green Remediation to Polymer Hybrid Fabrication with Improved Optical Band Gaps. International Journal of Molecular Sciences. 2019; 20(16):3910. https://doi.org/10.3390/ijms20163910
Chicago/Turabian StyleBrza, M. A., Shujahadeen B. Aziz, H. Anuar, and Muataz Hazza F. Al Hazza. 2019. "From Green Remediation to Polymer Hybrid Fabrication with Improved Optical Band Gaps" International Journal of Molecular Sciences 20, no. 16: 3910. https://doi.org/10.3390/ijms20163910
APA StyleBrza, M. A., Aziz, S. B., Anuar, H., & Al Hazza, M. H. F. (2019). From Green Remediation to Polymer Hybrid Fabrication with Improved Optical Band Gaps. International Journal of Molecular Sciences, 20(16), 3910. https://doi.org/10.3390/ijms20163910