The RND1 Small GTPase: Main Functions and Emerging Role in Oncogenesis

 ,
,
Abstract
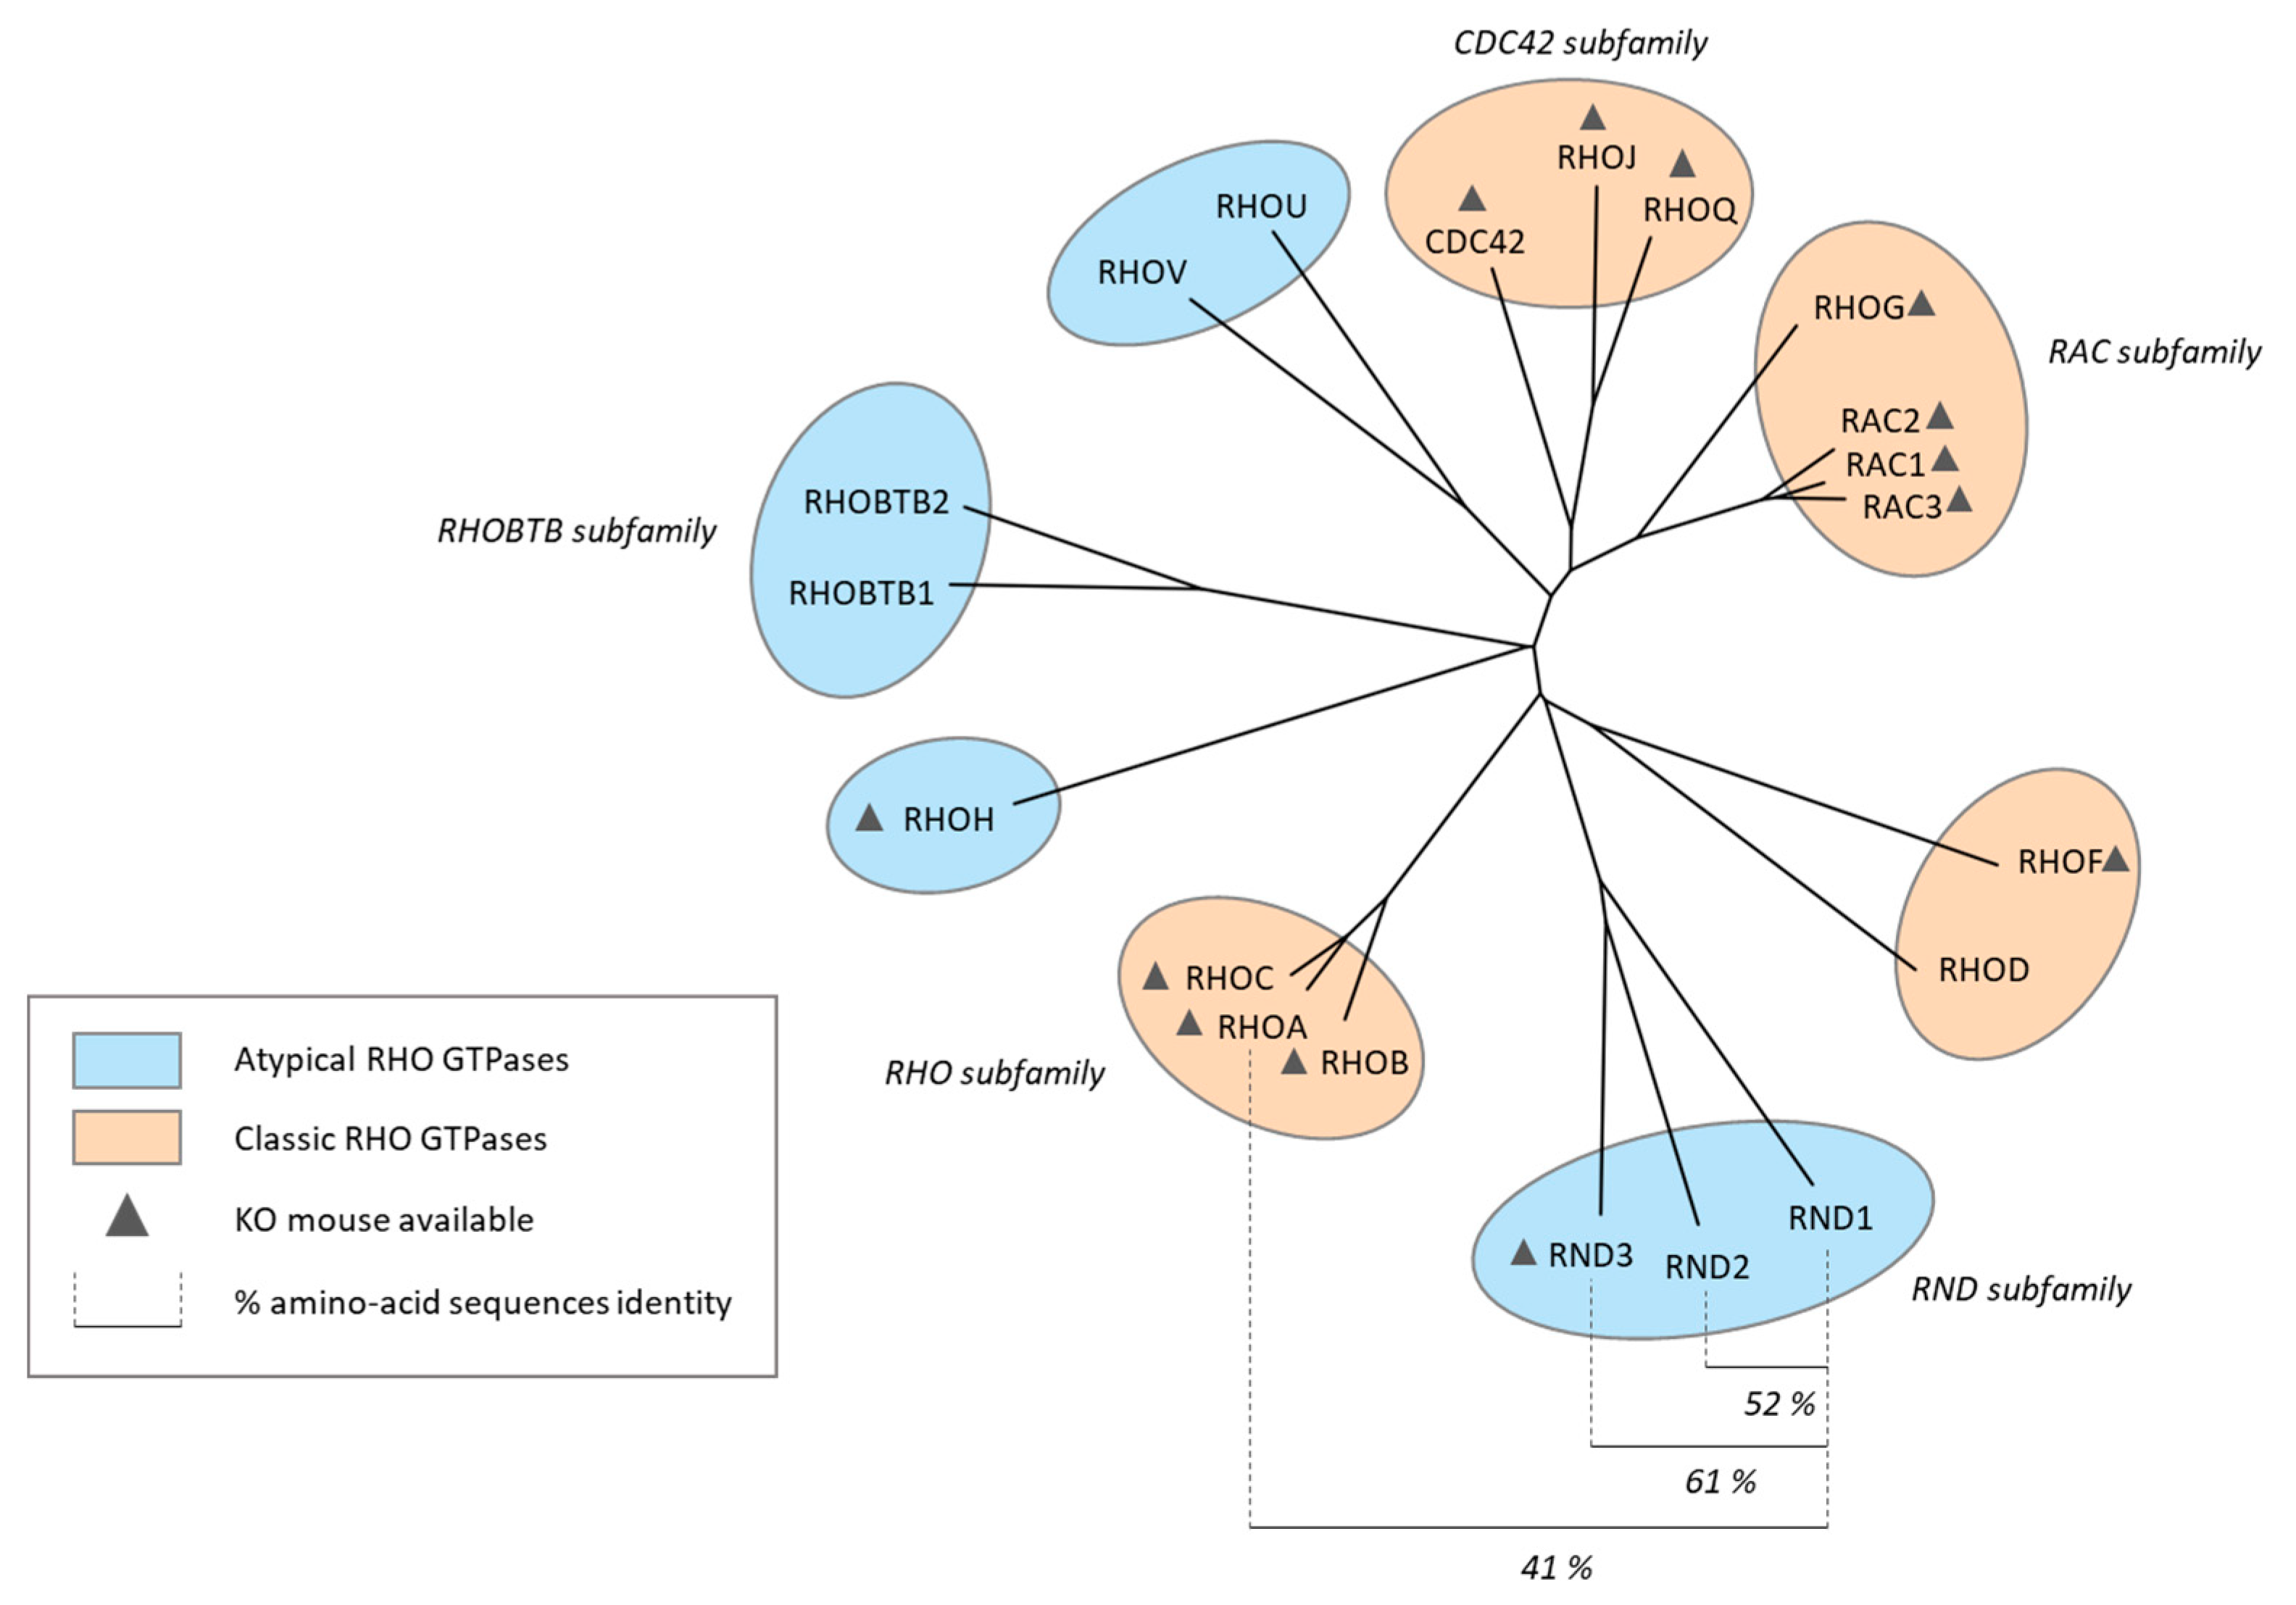
1. Introduction
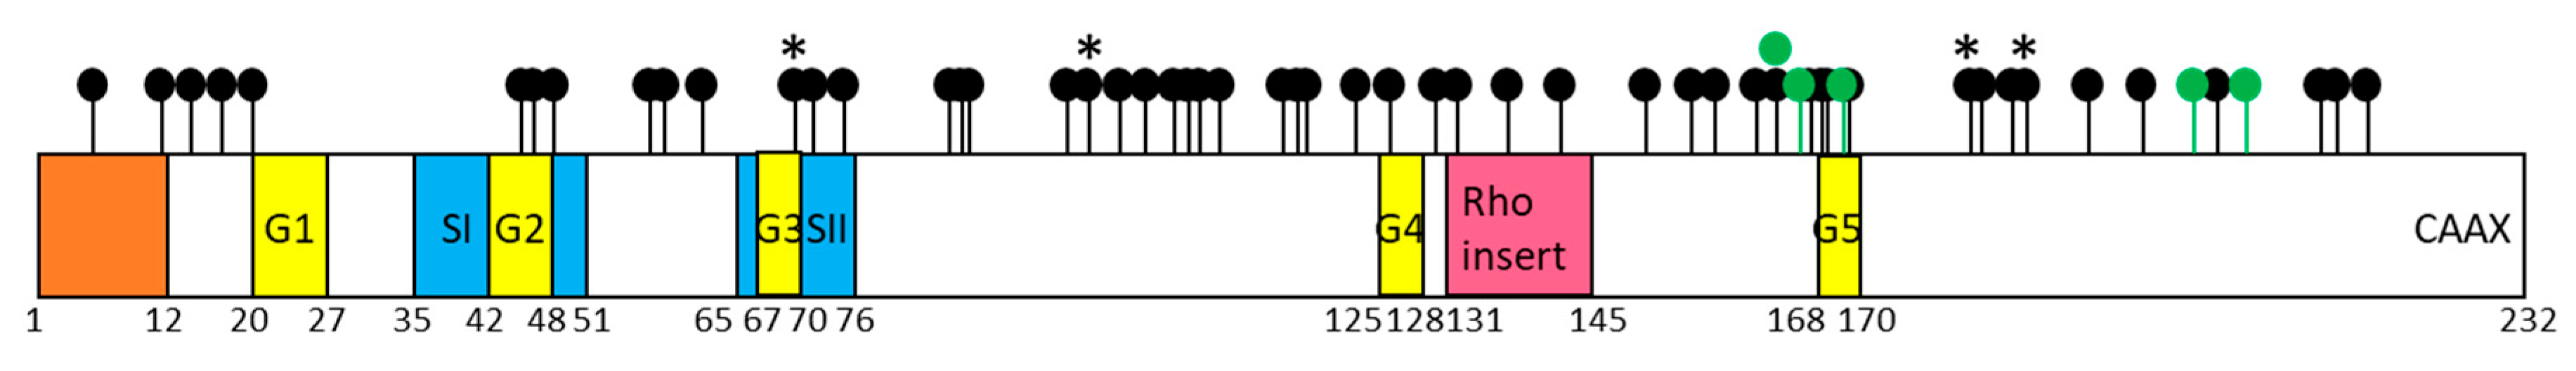
RND1, an Atypical Rho GTPase
2. RND1 Expression in Healthy Tissues
3. Subcellular Localization of RND1
Subcellular Localization
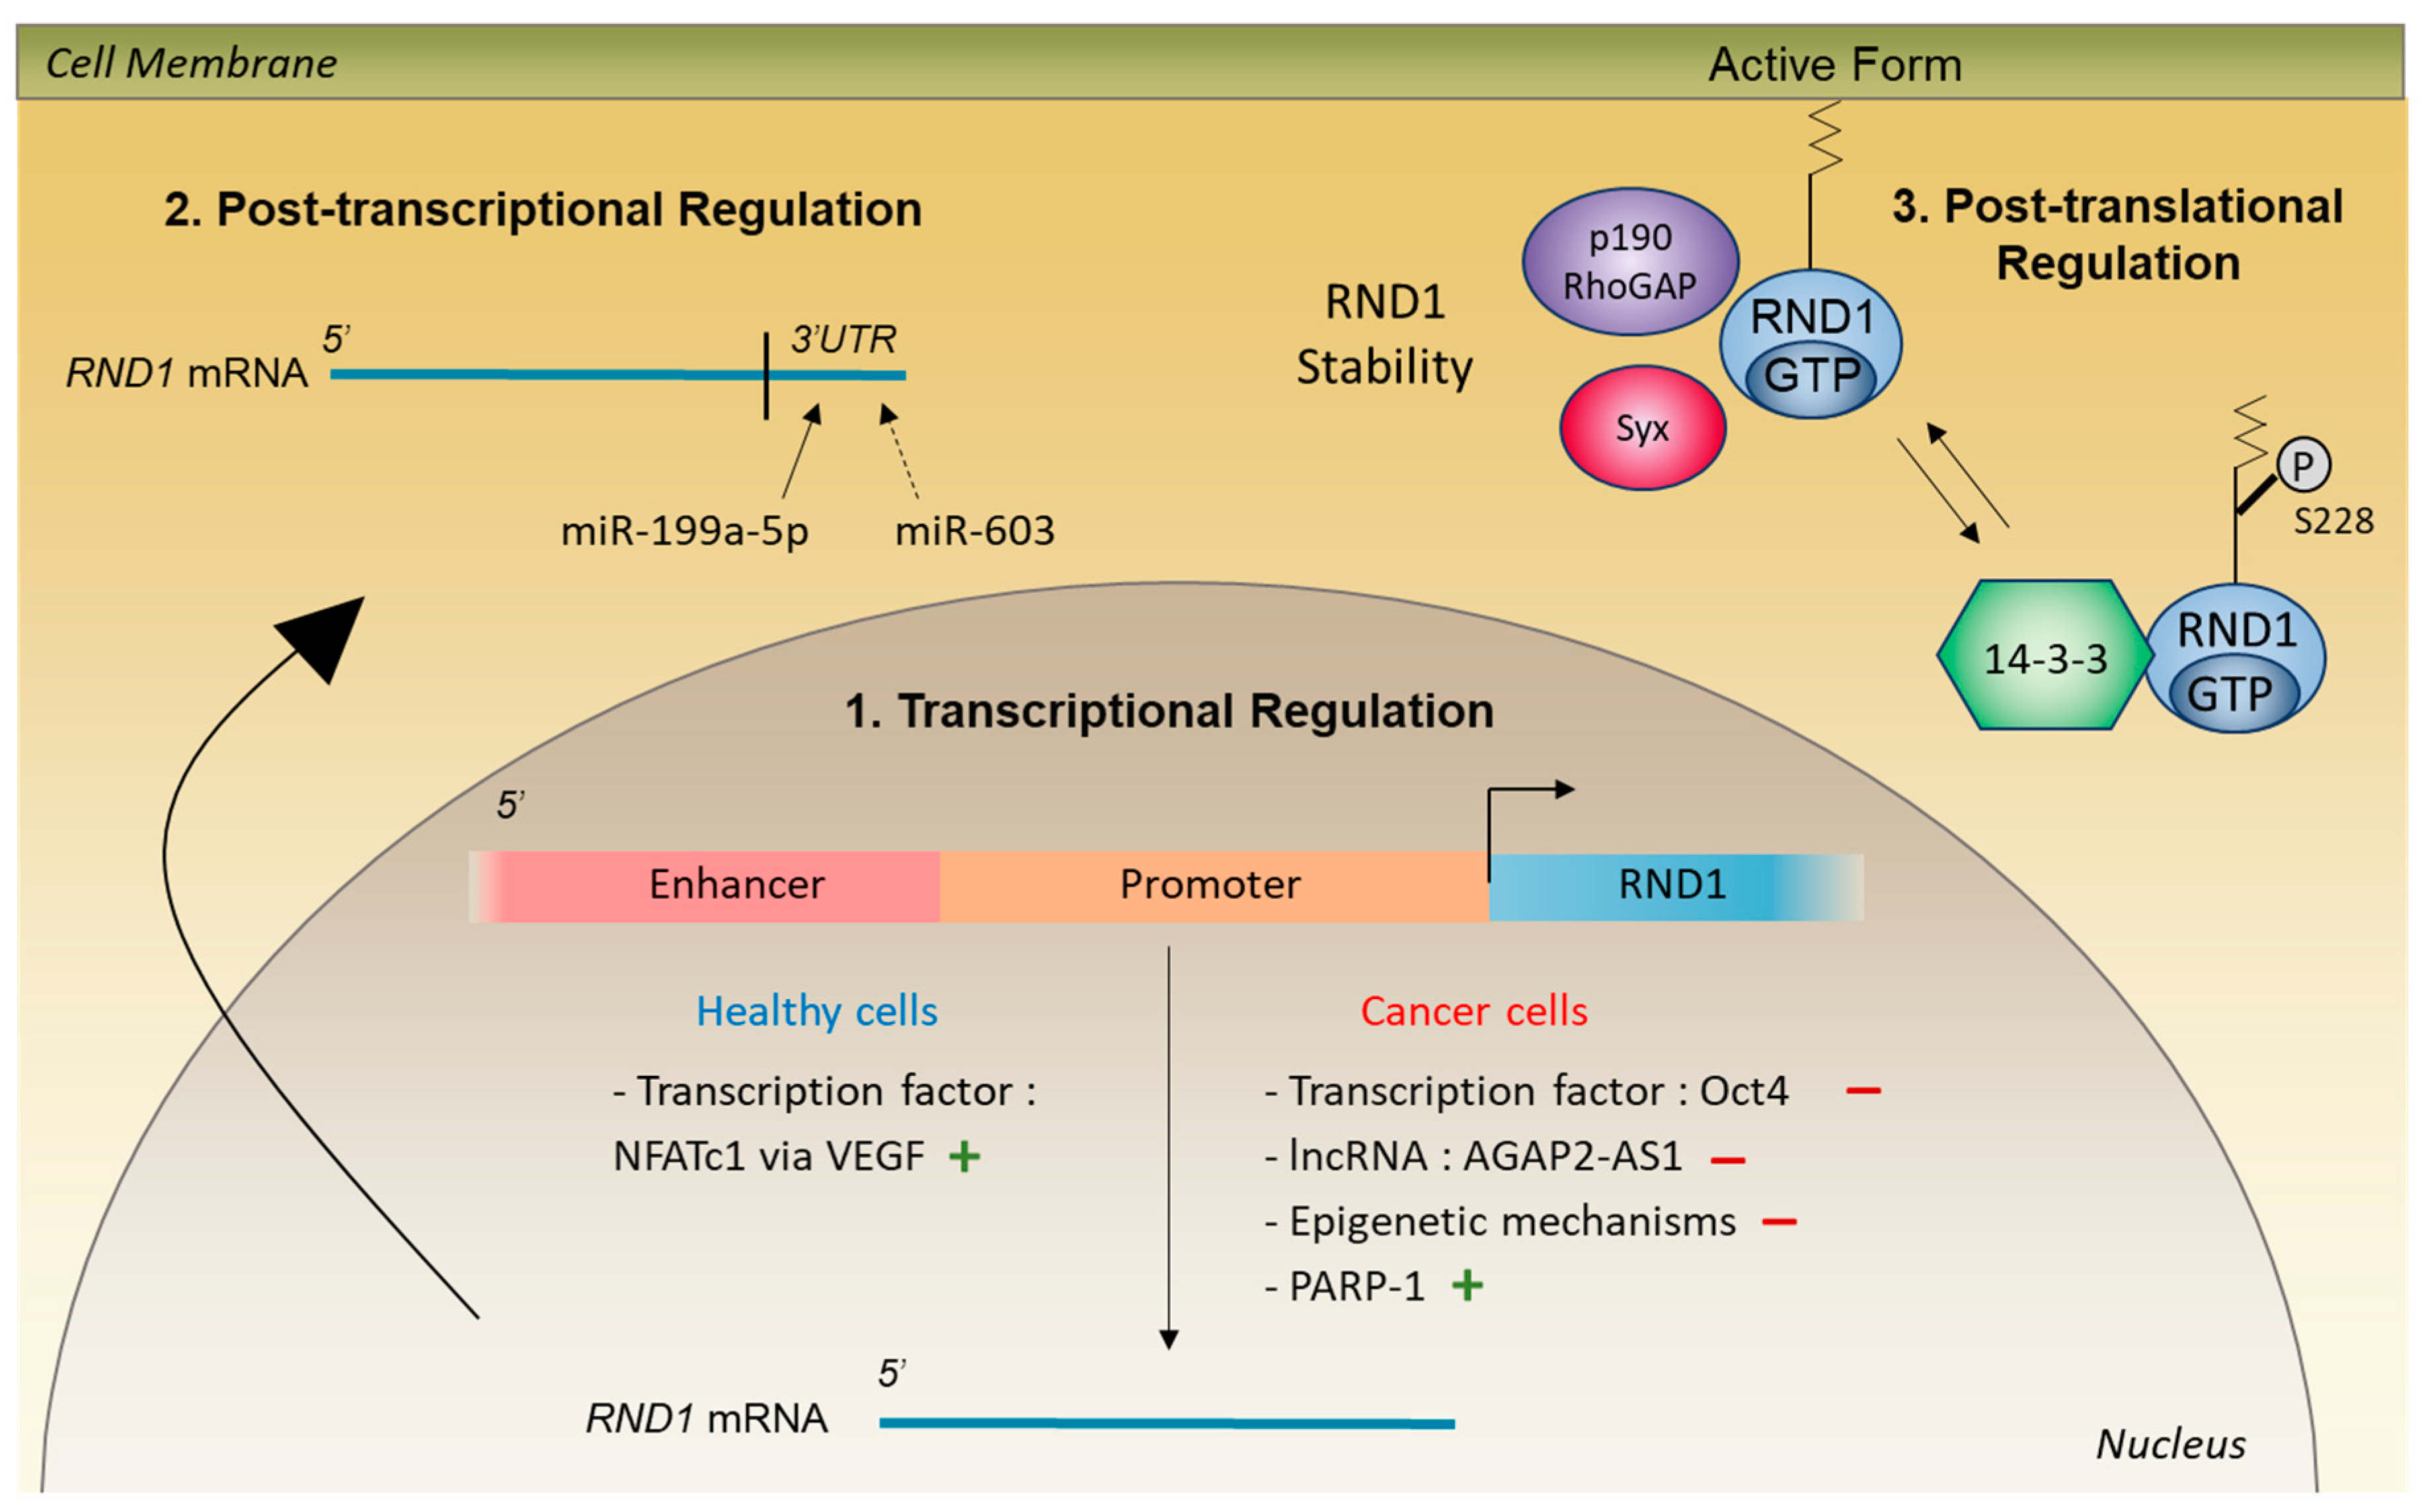
4. Control of RND1 Expression in Healthy Cells
4.1. Transcriptional and Post-Transcriptional Regulation
4.2. Post-Translational Regulation
5. Biological Functions of RND1
5.1. Regulation of Cell Morphology and Actin Cytoskeleton
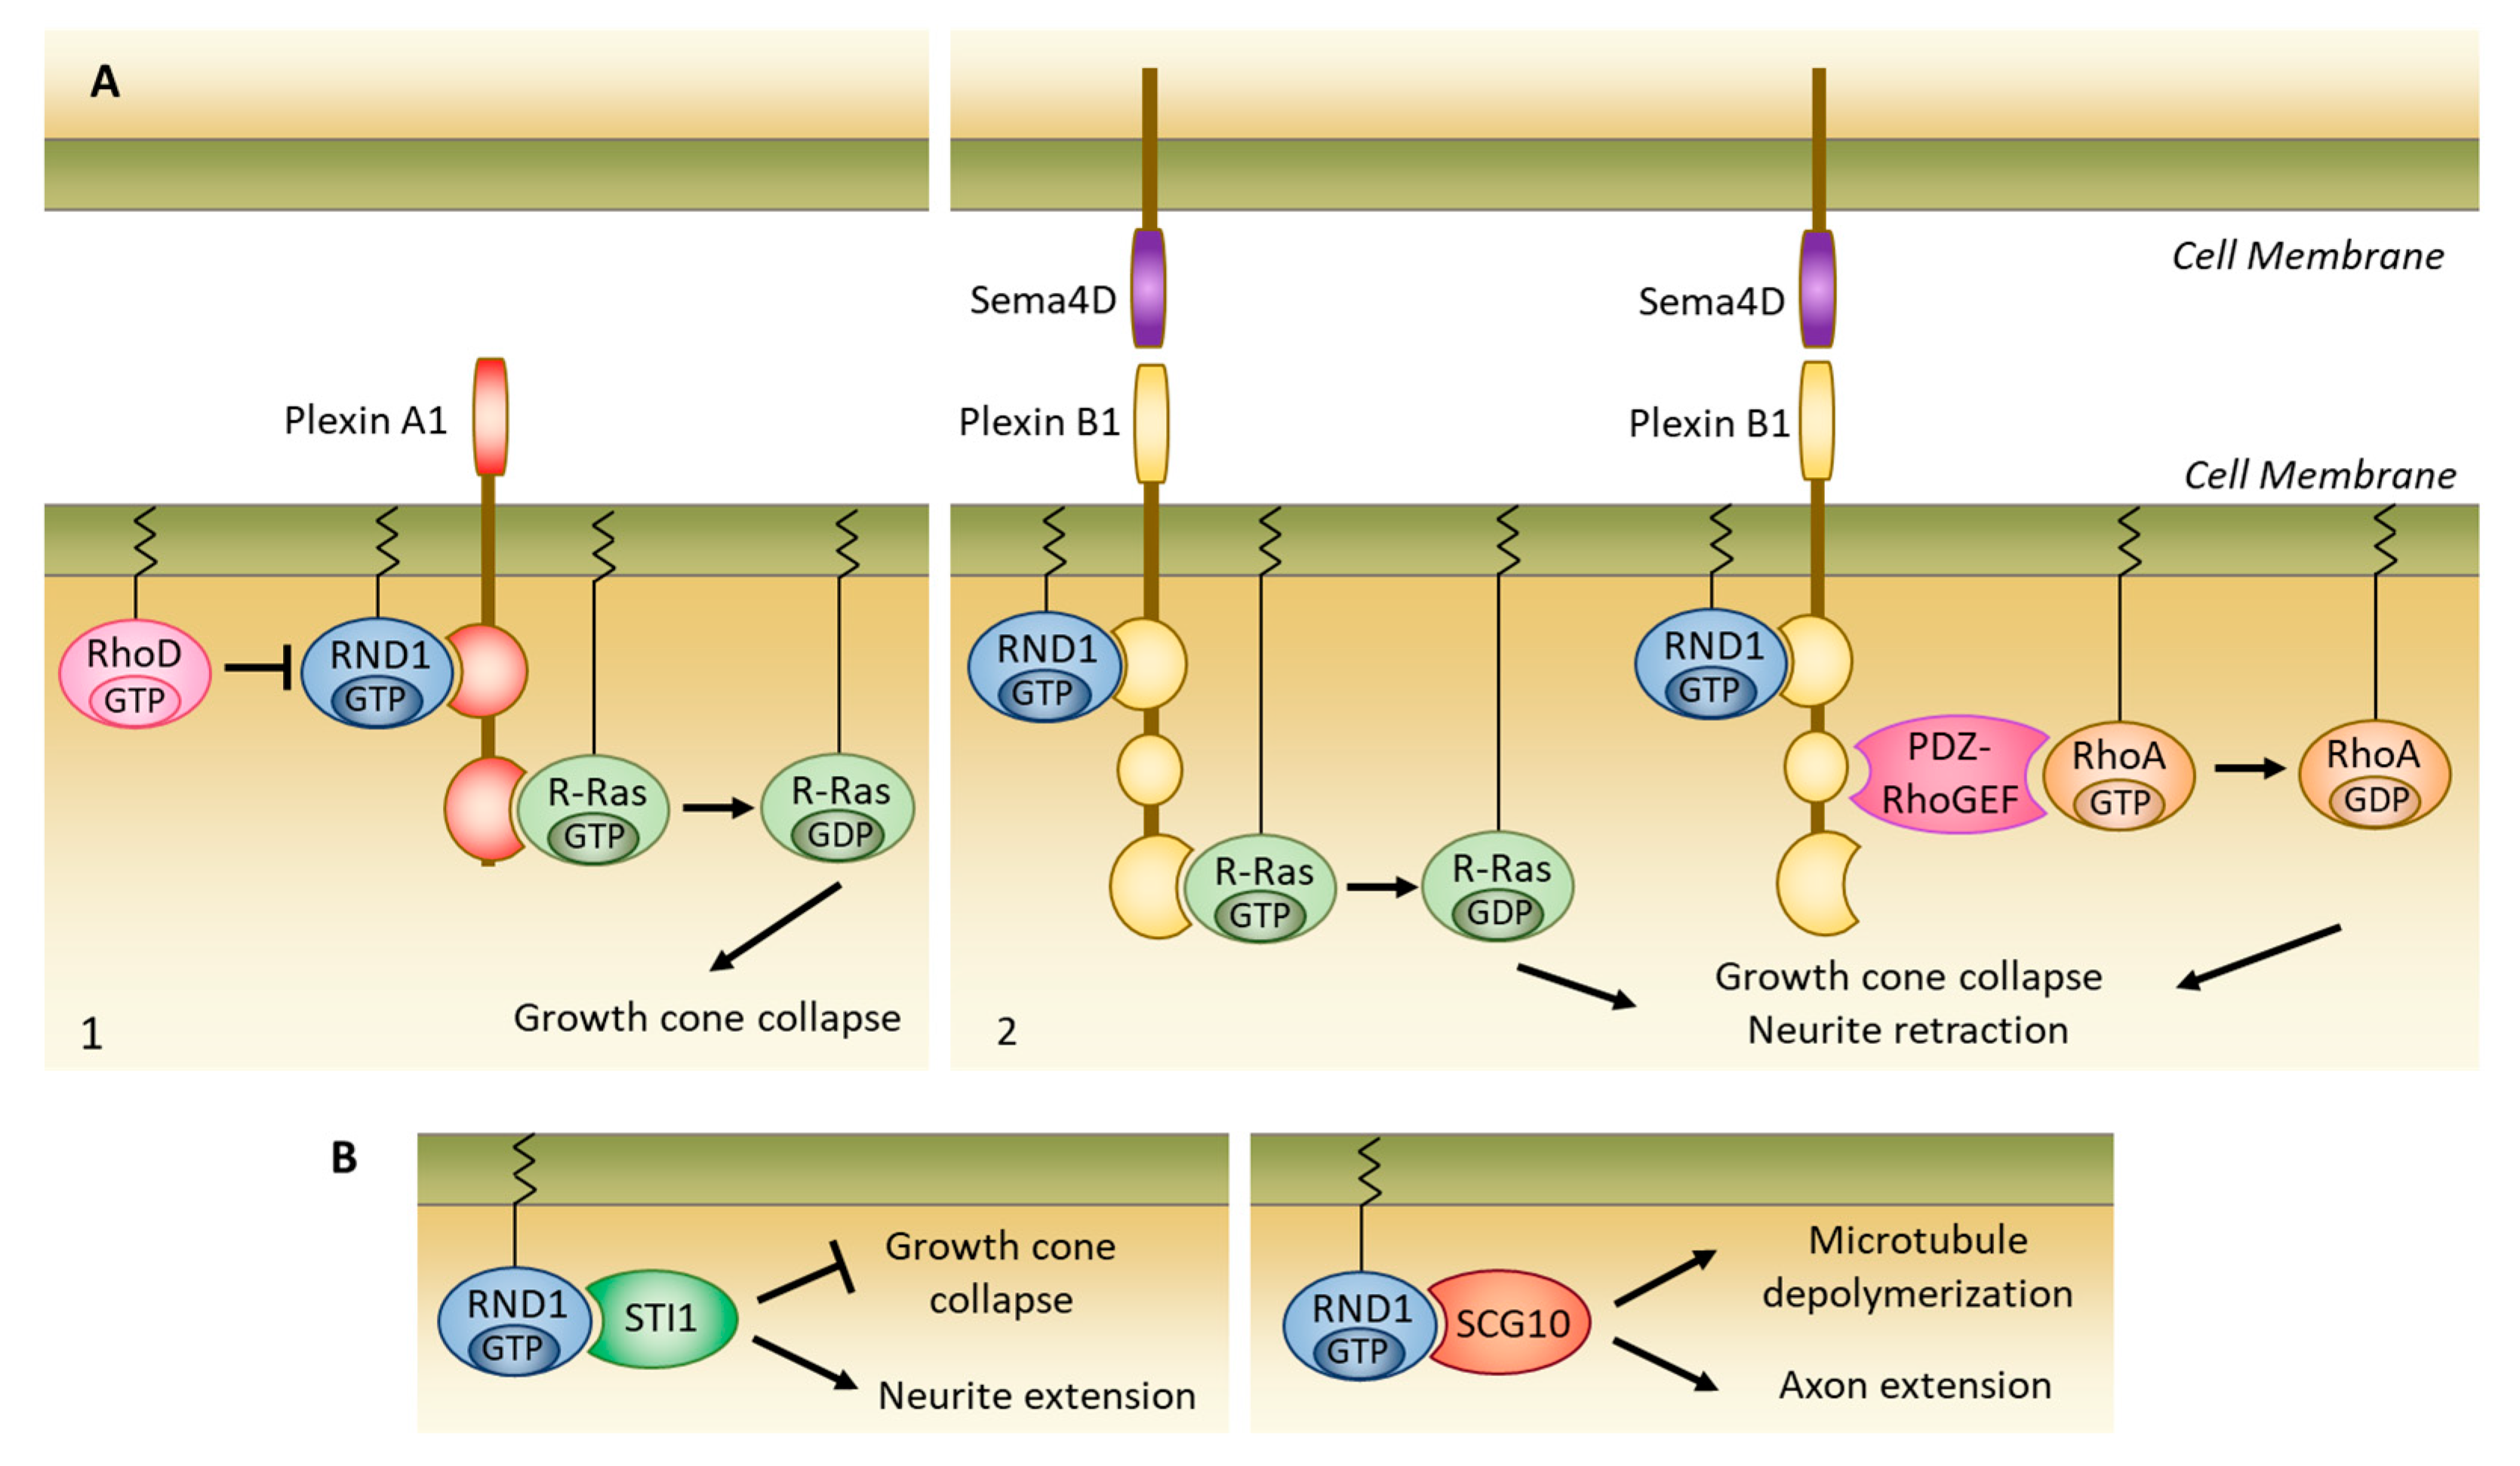
5.2. Formation of Nerve Connections
5.2.1. Interaction with Plexins
5.2.2. Interaction with Other Partners
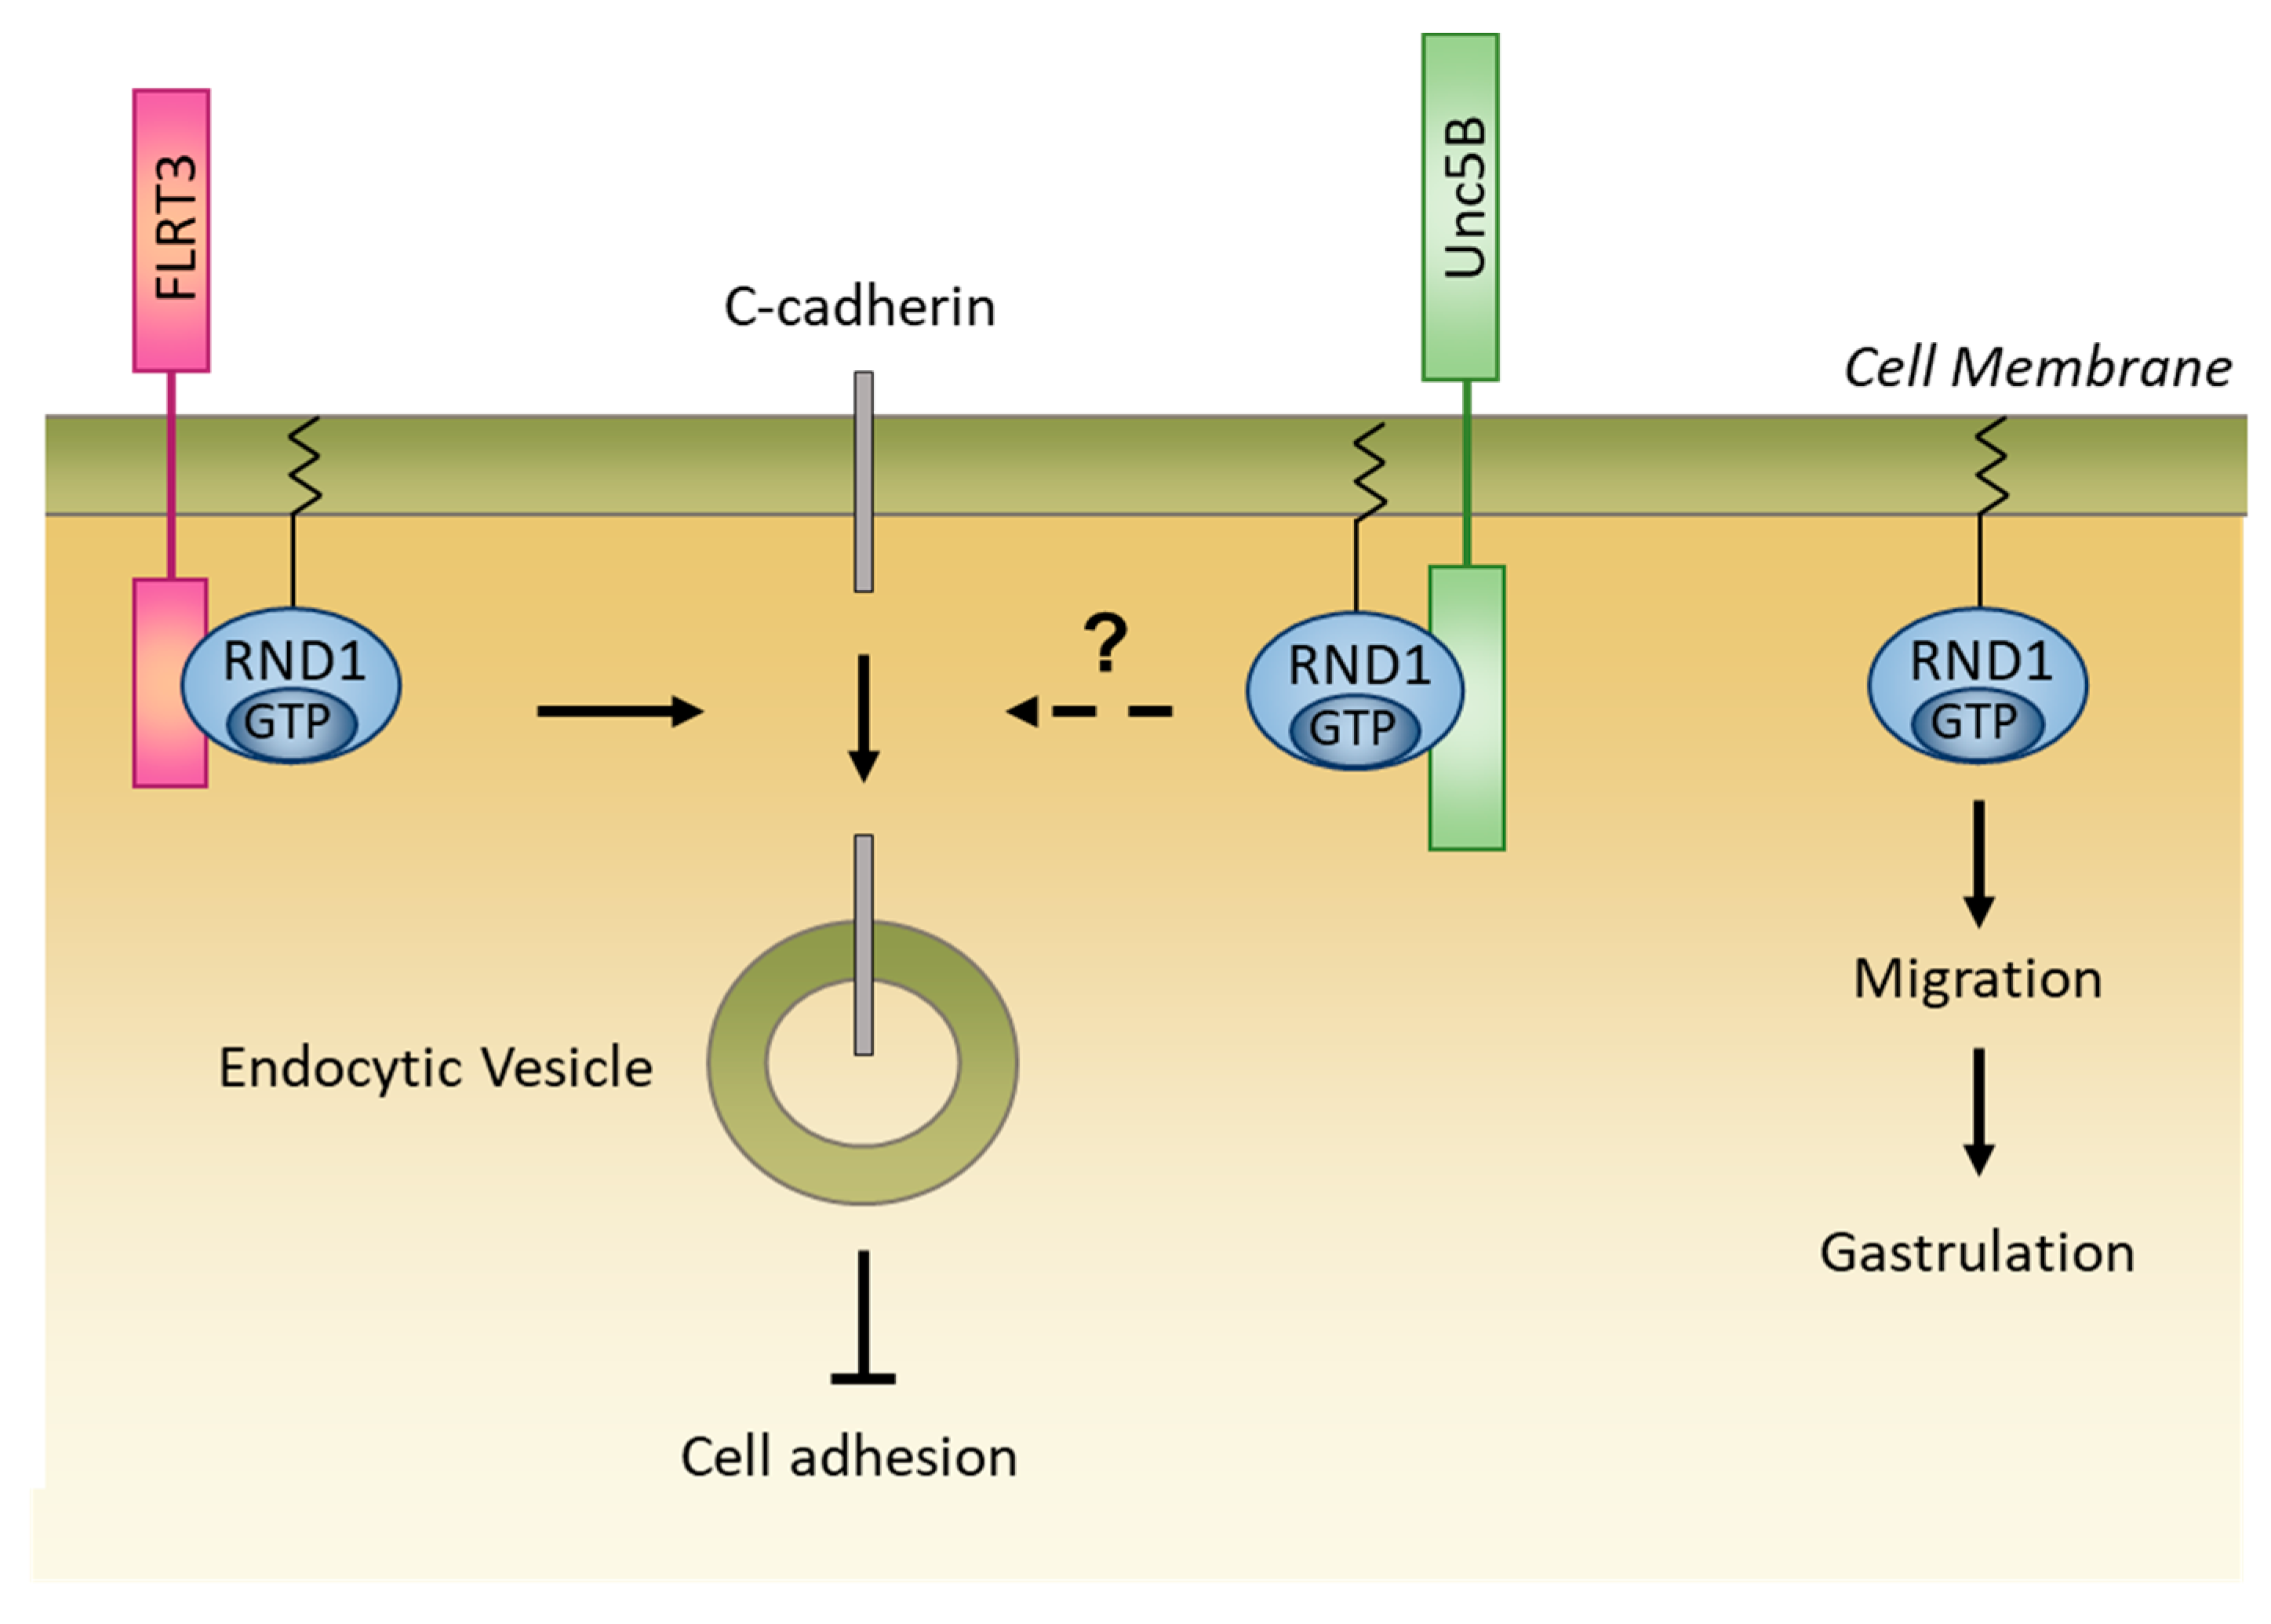
5.2.3. Role in Embryonic Development
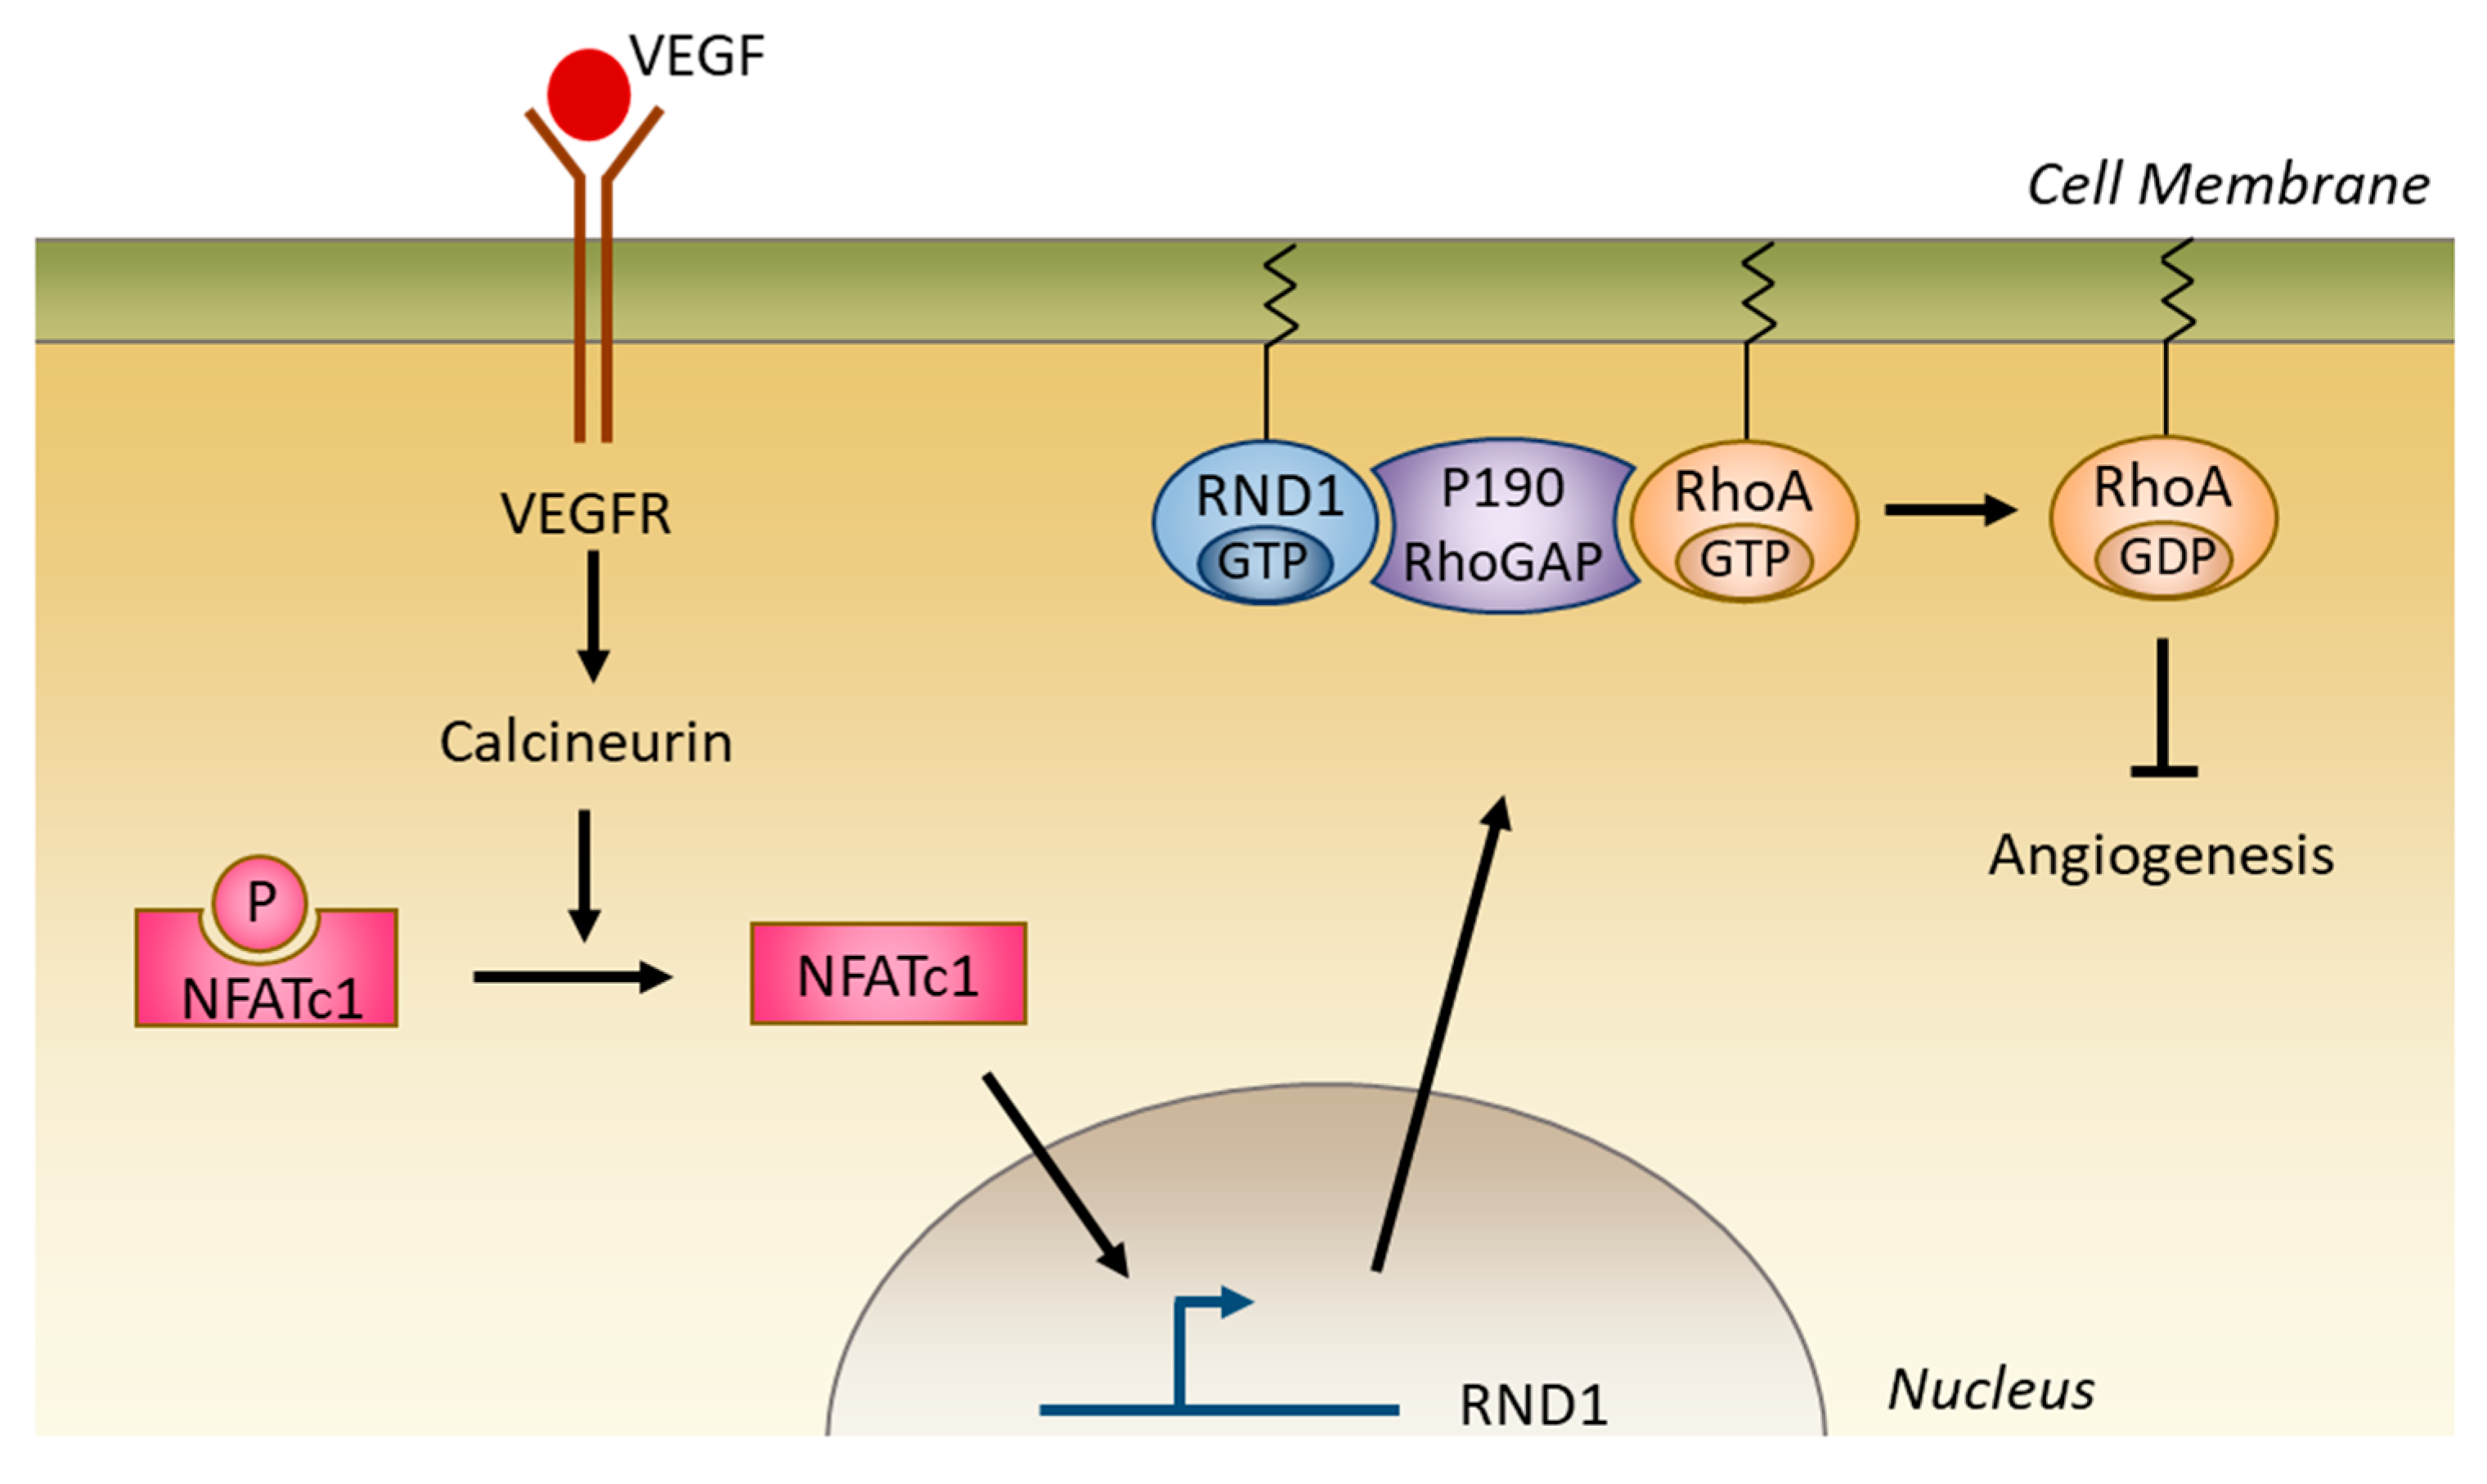
5.2.4. Role in Angiogenesis
6. RND1 Expression in Cancers
RND1 Expression is Altered in Cancers
7. RND1 in Oncogenesis
8. RND1 In Vital Prognosis
9. RND1 in Response to Anticancer Agents
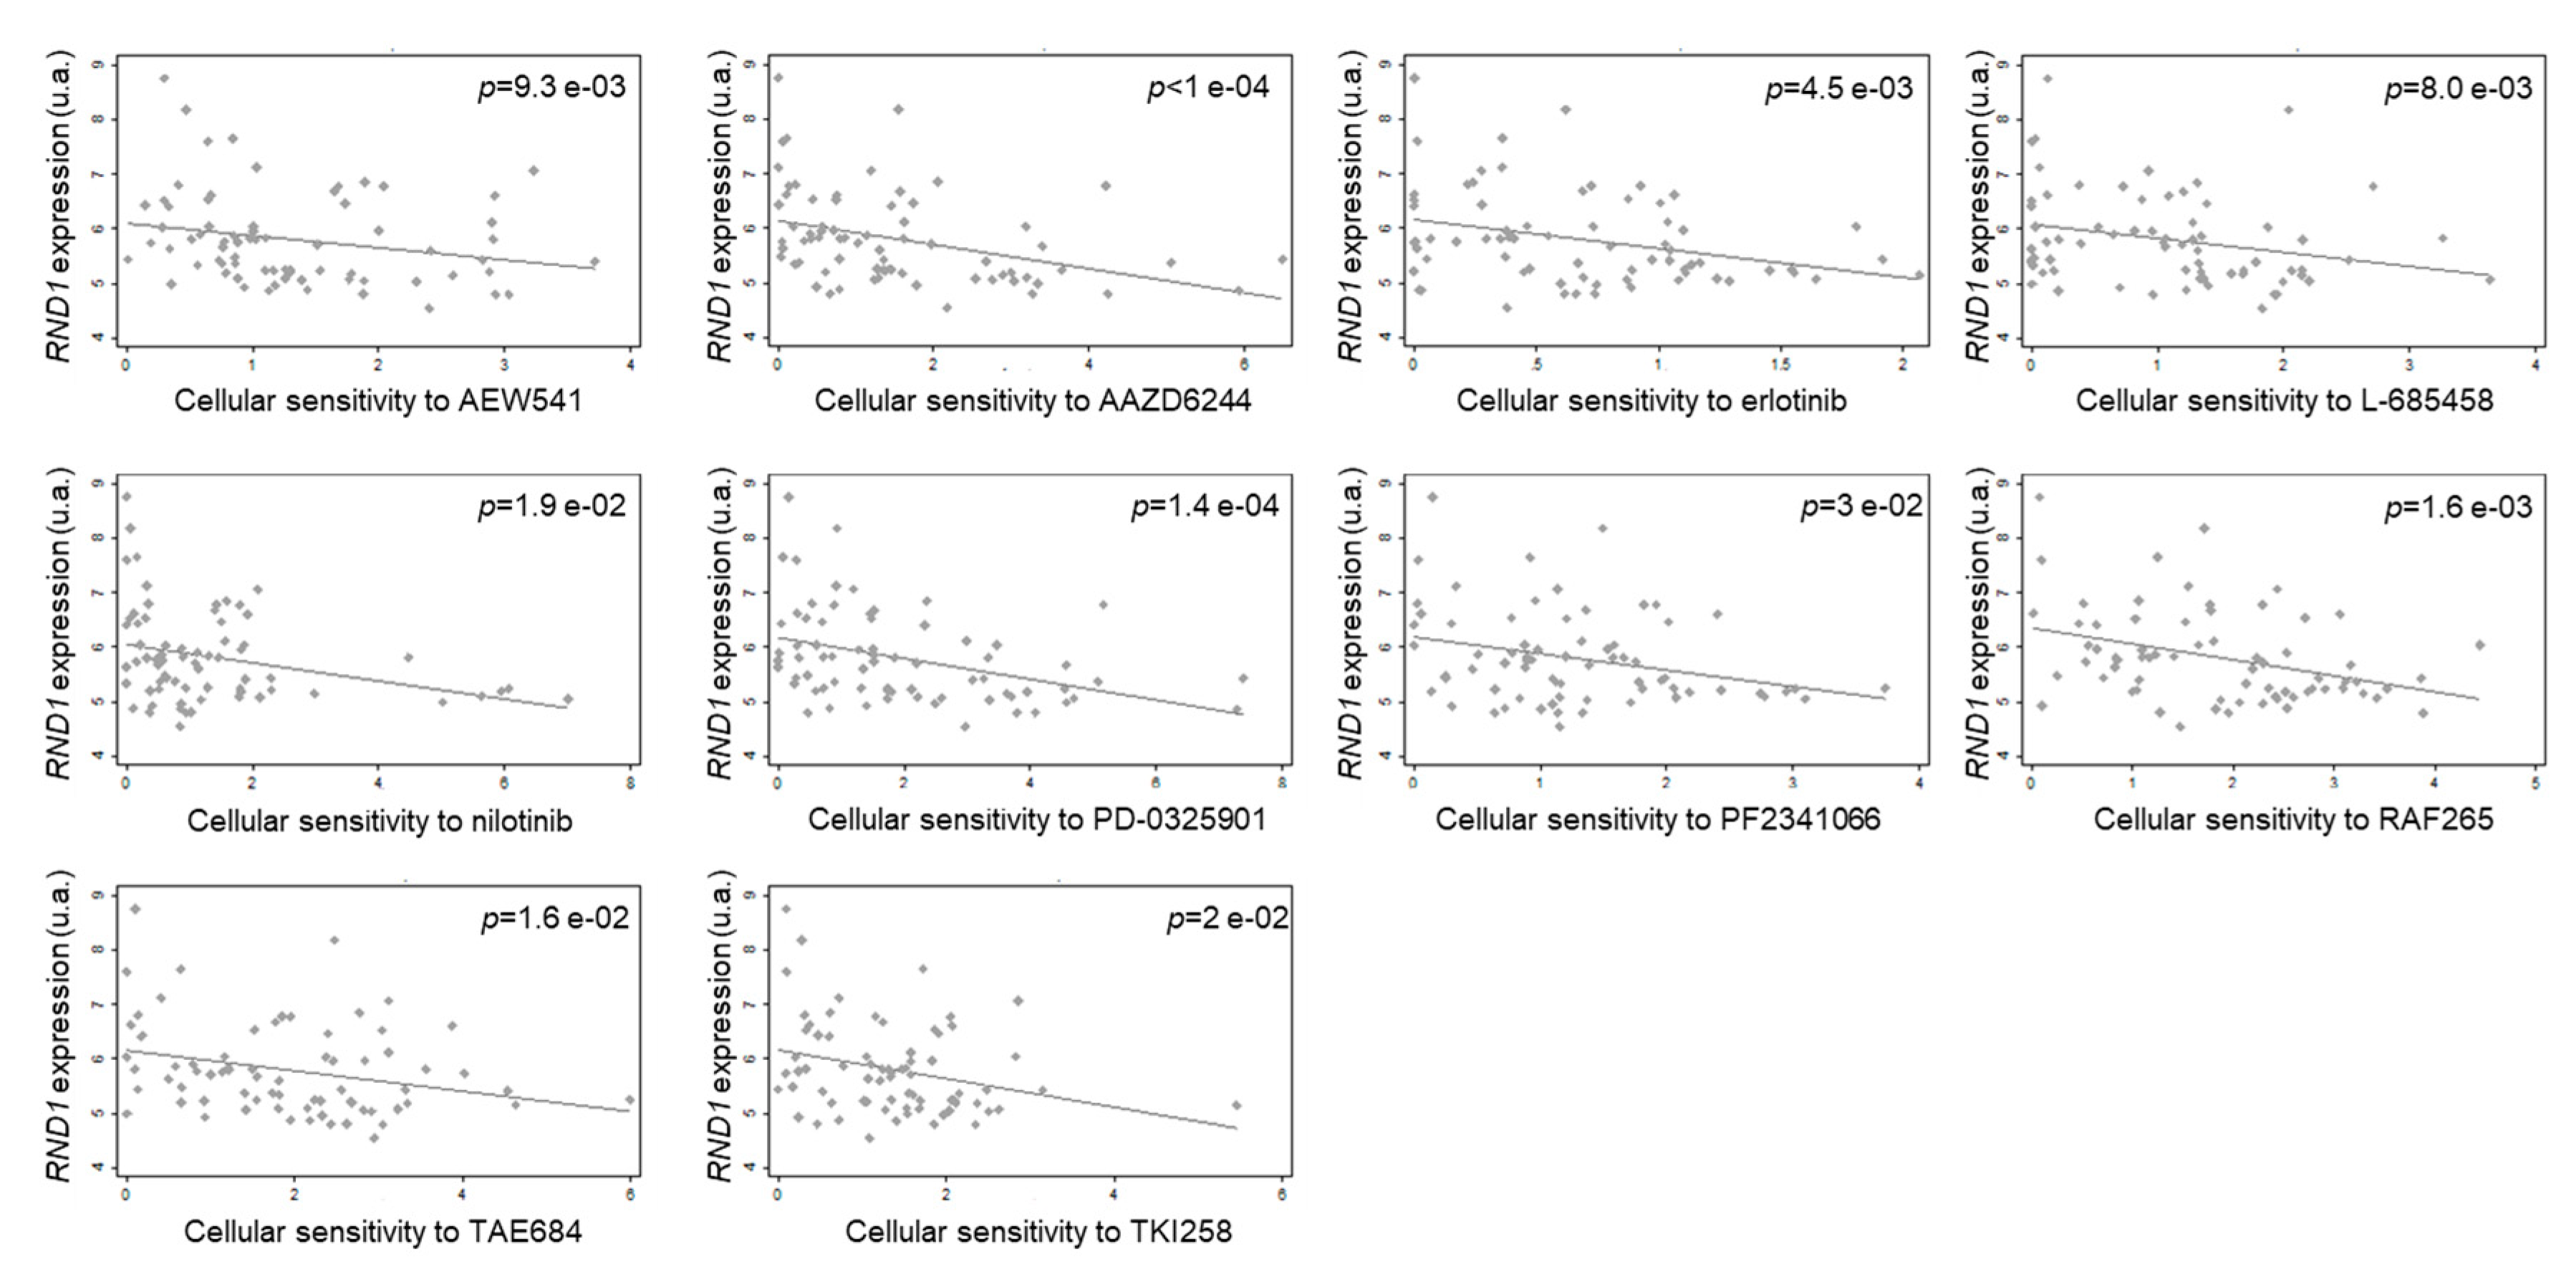
RND1 Expression and Its Role in Response to Anticancer Agents
10. Conclusions
Author Contributions
Funding
Acknowledgments
Conflicts of Interest
Abbreviations
| EMT | Epithelial to mesenchymal transition |
| FGF | Fibroblast growth factor |
| FRS2β | FGFR substrate 2 β |
| FLRT3 | Fibronectin Leucine Rich Transmembrane 3 |
| GAP | GTPase-activating protein |
| GDI | GDP-dissociation inhibitors |
| GEF | Guanine nucleotide Exchange Factor |
| Grb7 | Growth factor receptor-bound protein 7 |
| lncRNA | Long non-coding RNA |
| MO | Morpholino antisense oligonucleotide |
| NFATc1 | Nuclear Factor of Activated T Cells |
| NRP1 | Neuropilin 1 |
| PARP-1 | Poly (ADP-ribose) polymerase |
| SCG10 | Superior Cervical Ganglion 10 |
| Sema | Semaphorin |
| STI1 | Stress-Inducible Protein |
| TGF-β | Transforming growth factor beta |
| VEGF | Vascular endothelial growth factor |
References
- Heasman, S.J.; Ridley, A.J. Mammalian Rho GTPases: New insights into their functions from in vivo studies. Nat. Rev. Mol. Cell Biol. 2008, 9, 690–701. [Google Scholar] [CrossRef] [PubMed]
- Bustelo, X.R. RHO GTPases in cancer: Known facts, open questions, and therapeutic challenges. Biochem. Soc. Trans. 2018, 46, 741–760. [Google Scholar] [CrossRef] [PubMed]
- Nobes, C.D.; Lauritzen, I.; Mattei, M.-G.; Paris, S.; Hall, A.; Chardin, P. A New Member of the Rho Family, Rnd1, Promotes Disassembly of Actin Filament Structures and Loss of Cell Adhesion. J. Cell Boil. 1998, 141, 187–197. [Google Scholar] [CrossRef] [PubMed]
- Shutes, A.; Berzat, A.C.; Cox, A.D.; Der, C.J. Atypical Mechanism of Regulation of the Wrch-1 Rho Family Small GTPase. Curr. Boil. 2004, 14, 2052–2056. [Google Scholar] [CrossRef] [PubMed]
- Oinuma, I.; Kawada, K.; Tsukagoshi, K.; Negishi, M. Rnd1 and Rnd3 targeting to lipid raft is required for p190 RhoGAP activation. Mol. Biol. Cell 2012, 23, 1593–1604. [Google Scholar] [CrossRef] [PubMed]
- Riou, P.; Villalonga, P.; Ridley, A.J. Rnd proteins: Multifunctional regulators of the cytoskeleton and cell cycle progression. BioEssays 2010, 32, 986–992. [Google Scholar] [CrossRef]
- Jaffe, A.B.; Hall, A. RHO GTPASES: Biochemistry and Biology. Annu. Rev. Cell Dev. Boil. 2005, 21, 247–269. [Google Scholar] [CrossRef] [PubMed]
- Ridley, A.J. Rho GTPase signalling in cell migration. Curr. Opin. Cell Biol. 2015, 36, 103–112. [Google Scholar] [CrossRef]
- Zandvakili, I.; Lin, Y.; Morris, J.C.; Zheng, Y. Rho GTPases: Anti- or pro-neoplastic targets? Oncogene 2017, 36, 3213–3222. [Google Scholar] [CrossRef]
- Okada, T.; Sinha, S.; Esposito, I.; Schiavon, G.; Lopez-Lago, M.A.; Su, W.; Pratilas, C.A.; Abele, C.; Hernandez, J.M.; Ohara, M.; et al. The Rho GTPase Rnd1 suppresses mammary tumorigenesis and EMT by restraining Ras-MAPK signalling. Nat. Cell Biol. 2015, 17, 81–94. [Google Scholar] [CrossRef]
- Clarke, K.; Daubon, T.; Turan, N.; Soulet, F.; Mohd Zahari, M.; Ryan, K.R.; Durant, S.; He, S.; Herbert, J.; Ankers, J.; et al. Inference of Low and High-Grade Glioma Gene Regulatory Networks Delineates the Role of Rnd3 in Establishing Multiple Hallmarks of Cancer. PLoS Genet. 2015, 11, e1005325. [Google Scholar] [CrossRef] [PubMed]
- Grise, F.; Sena, S.; Bidaud-Meynard, A.; Baud, J.; Hiriart, J.-B.; Makki, K.; Dugot-Senant, N.; Staedel, C.; Bioulac-Sage, P.; Zucman-Rossi, J.; et al. Rnd3/RhoE Is down-regulated in hepatocellular carcinoma and controls cellular invasion. Hepatology 2012, 55, 1766–1775. [Google Scholar] [CrossRef] [PubMed]
- Paysan, L.; Piquet, L.; Saltel, F.; Moreau, V. Rnd3 in Cancer: A Review of the Evidence for Tumor Promoter or Suppressor. Mol. Cancer Res. 2016, 14, 1033–1044. [Google Scholar] [CrossRef] [PubMed]
- Wünnenberg-Stapleton, K.; Blitz, I.L.; Hashimoto, C.; Cho, K.W. Involvement of the small GTPases XRhoA and XRnd1 in cell adhesion and head formation in early Xenopus development. Development 1999, 126, 5339–5351. [Google Scholar] [PubMed]
- Ishikawa, Y.; Katoh, H.; Negishi, M. A Role of Rnd1 GTPase in Dendritic Spine Formation in Hippocampal Neurons. J. Neurosci. 2003, 23, 11065–11072. [Google Scholar] [CrossRef] [PubMed]
- Kim, Y.-S.; Hori, M.; Yasuda, K.; Ozaki, H. Differences in the gestational pattern of mRNA expression of the Rnd family in rat and human myometria. Comp. Biochem. Physiol. Part A Mol. Integr. Physiol. 2005, 142, 410–415. [Google Scholar] [CrossRef]
- Kim, Y.S.; Kim, B.; Karaki, H.; Hori, M.; Ozaki, H. Up-regulation of Rnd1 during pregnancy serves as a negative-feedback control for Ca2+ sensitization of contractile elements in rat myometrium. Biochem. Biophys. Res. Commun. 2003, 311, 972–978. [Google Scholar] [CrossRef]
- Katoh, H.; Harada, A.; Mori, K.; Negishi, M. Socius Is a Novel Rnd GTPase-Interacting Protein Involved in Disassembly of Actin Stress Fibers. Mol. Cell. Biol. 2002, 22, 2952–2964. [Google Scholar] [CrossRef]
- Roberts, P.J.; Mitin, N.; Keller, P.J.; Chenette, E.J.; Madigan, J.P.; Currin, R.O.; Cox, A.D.; Wilson, O.; Kirschmeier, P.; Der, C.J. Rho Family GTPase modification and dependence on CAAX motif-signaled posttranslational modification. J. Biol. Chem. 2008, 283, 25150–25163. [Google Scholar] [CrossRef]
- Riou, P.; Kjær, S.; Garg, R.; Purkiss, A.; George, R.; Cain, R.J.; Bineva, G.; Reymond, N.; McColl, B.; Thompson, A.J.; et al. 14-3-3 Proteins Interact with a Hybrid Prenyl-Phosphorylation Motif to Inhibit G Proteins. Cell 2013, 153, 1164. [Google Scholar] [CrossRef]
- Song, R.; Gu, J.; Liu, X.; Zhu, J.; Wang, Q.; Gao, Q.; Zhang, J.; Cheng, L.; Tong, X.; Qi, X.; et al. Inhibition of osteoclast bone resorption activity through osteoprotegerin-induced damage of the sealing zone. Int. J. Mol. Med. 2014, 34, 856–862. [Google Scholar] [CrossRef] [PubMed]
- Suehiro, J.-I.; Kanki, Y.; Makihara, C.; Schadler, K.; Miura, M.; Manabe, Y.; Aburatani, H.; Kodama, T.; Minami, T. Genome-wide Approaches Reveal Functional Vascular Endothelial Growth Factor (VEGF)-inducible Nuclear Factor of Activated T Cells (NFAT) c1 Binding to Angiogenesis-related Genes in the Endothelium. J. Biol. Chem. 2014, 289, 29044–29059. [Google Scholar] [CrossRef] [PubMed]
- Loirand, G.; Cario-Toumaniantz, C.; Chardin, P.; Pacaud, P. The Rho-related protein Rnd1 inhibits Ca2+ sensitization of rat smooth muscle. J. Physiol. 1999, 516, 825–834. [Google Scholar] [CrossRef] [PubMed]
- Monastyrskaya, K.; Sanchez-Freire, V.; Gheinani, A.H.; Klumpp, D.J.; Babiychuk, E.B.; Draeger, A.; Burkhard, F.C. miR-199a-5p Regulates Urothelial Permeability and May Play a Role in Bladder Pain Syndrome. Am. J. Pathol. 2013, 182, 431–448. [Google Scholar] [CrossRef] [PubMed]
- Zhang, C.; Lu, J.; Liu, B.; Cui, Q.; Wang, Y. Primate-specific miR-603 is implicated in the risk and pathogenesis of Alzheimer’s disease. Aging (Albany N. Y.) 2016, 8, 272–290. [Google Scholar] [CrossRef] [PubMed][Green Version]
- Hodge, R.G.; Ridley, A.J. Regulating Rho GTPases and their regulators. Nat. Rev. Mol. Cell Biol. 2016, 17, 496–510. [Google Scholar] [CrossRef] [PubMed]
- Goh, L.L.; Manser, E. The GTPase-deficient Rnd Proteins Are Stabilized by Their Effectors. J. Biol. Chem. 2012, 287, 31311–31320. [Google Scholar] [CrossRef] [PubMed]
- Wennerberg, K.; Forget, M.-A.; Ellerbroek, S.M.; Arthur, W.T.; Burridge, K.; Settleman, J.; Der, C.J.; Hansen, S.H. Rnd Proteins Function as RhoA Antagonists by Activating p190 RhoGAP. Curr. Biol. 2003, 13, 1106–1115. [Google Scholar] [CrossRef]
- Mori, K.; Amano, M.; Takefuji, M.; Kato, K.; Morita, Y.; Nishioka, T.; Matsuura, Y.; Murohara, T.; Kaibuchi, K. Rho-kinase contributes to sustained RhoA activation through phosphorylation of p190A RhoGAP. J. Biol. Chem. 2009, 284, 5067–5076. [Google Scholar] [CrossRef]
- Goh, L.L.; Manser, E. The RhoA GEF Syx Is a Target of Rnd3 and Regulated via a Raf1-Like Ubiquitin-Related Domain. PLoS ONE 2010, 5, e12409. [Google Scholar] [CrossRef] [PubMed]
- Vayssière, B.; Zalcman, G.; Mahé, Y.; Mirey, G.; Ligensa, T.; Weidner, K.; Chardin, P.; Camonis, J. Interaction of the Grb7 adapter protein with Rnd1, a new member of the Rho family. FEBS Lett. 2000, 467, 91–96. [Google Scholar] [CrossRef]
- García-Palmero, I.; Villalobo, A. Deletion of the calmodulin-binding domain of Grb7 impairs cell attachment to the extracellular matrix and migration. Biochem. Biophys. Res. Commun. 2013, 436, 271–277. [Google Scholar] [CrossRef] [PubMed]
- Prokop, A.; Beaven, R.; Qu, Y.; Sánchez-Soriano, N. Using fly genetics to dissect the cytoskeletal machinery of neurons during axonal growth and maintenance. J. Cell Sci. 2013, 126, 2331–2341. [Google Scholar] [CrossRef] [PubMed]
- Zanata, S.M.; Hovatta, I.; Rohm, B.; Püschel, A.W. Antagonistic Effects of Rnd1 and RhoD GTPases Regulate Receptor Activity in Semaphorin 3A-Induced Cytoskeletal Collapse. J. Neurosci. 2002, 22, 471–477. [Google Scholar] [CrossRef] [PubMed]
- Oinuma, I. The Semaphorin 4D Receptor Plexin-B1 Is a GTPase Activating Protein for R-Ras. Science 2004, 305, 862–865. [Google Scholar] [CrossRef] [PubMed]
- Oinuma, I.; Katoh, H.; Harada, A.; Negishi, M. Direct Interaction of Rnd1 with Plexin-B1 Regulates PDZ-RhoGEF-mediated Rho Activation by Plexin-B1 and Induces Cell Contraction in COS-7 Cells. J. Biol. Chem. 2003, 278, 25671–25677. [Google Scholar] [CrossRef] [PubMed]
- Oinuma, I.; Katoh, H.; Negishi, M. Molecular Dissection of the Semaphorin 4D Receptor Plexin-B1-Stimulated R-Ras GTPase-Activating Protein Activity and Neurite Remodeling in Hippocampal Neurons. J. Neurosci. 2004, 24, 11473–11480. [Google Scholar] [CrossRef] [PubMed]
- Yukawa, K.; Tanaka, T.; Yoshida, K.; Takeuchi, N.; Ito, T.; Takamatsu, H.; Kikutani, H.; Kumanogoh, A. Sema4A induces cell morphological changes through B-type plexin-mediated signaling. Int. J. Mol. Med. 2010, 25, 225–230. [Google Scholar] [CrossRef] [PubMed]
- Harada, A.; Katoh, H.; Negishi, M. Direct interaction of Rnd1 with FRS2 beta regulates Rnd1-induced down-regulation of RhoA activity and is involved in fibroblast growth factor-induced neurite outgrowth in PC12 cells. J. Biol. Chem. 2005, 280, 18418–18424. [Google Scholar] [CrossRef]
- Chardin, P. Function and regulation of Rnd proteins. Nat. Rev. Mol. Cell Biol. 2006, 7, 54–62. [Google Scholar] [CrossRef]
- De Souza, L.E.R.; Costa, M.D.M.; Bilek, E.S.; Lopes, M.H.; Martins, V.R.; Püschel, A.W.; Mercadante, A.F.; Nakao, L.S.; Zanata, S.M. STI1 antagonizes cytoskeleton collapse mediated by small GTPase Rnd1 and regulates neurite growth. Exp. Cell Res. 2014, 324, 84–91. [Google Scholar] [CrossRef] [PubMed]
- Li, Y.-H.; Ghavampour, S.; Bondallaz, P.; Will, L.; Grenningloh, G.; Püschel, A.W. Rnd1 regulates axon extension by enhancing the microtubule destabilizing activity of SCG10. J. Biol. Chem. 2009, 284, 16060. [Google Scholar]
- Ogata, S.; Morokuma, J.; Hayata, T.; Kolle, G.; Niehrs, C.; Ueno, N.; Cho, K.W. TGF-beta signaling-mediated morphogenesis: Modulation of cell adhesion via cadherin endocytosis. Genes Dev. 2007, 21, 1817–1831. [Google Scholar] [CrossRef] [PubMed]
- Karaulanov, E.; Böttcher, R.T.; Stannek, P.; Wu, W.; Rau, M.; Ogata, S.; Cho, K.W.Y.; Niehrs, C. Unc5B Interacts with FLRT3 and Rnd1 to Modulate Cell Adhesion in Xenopus Embryos. PLoS ONE 2009, 4, 5742. [Google Scholar] [CrossRef]
- Komatsu, H.; Iguchi, T.; Masuda, T.; Hirata, H.; Ueda, M.; Kidogami, S.; Ogawa, Y.; Sato, K.; Hu, Q.; Nambara, S.; et al. Attenuated RND1 Expression Confers Malignant Phenotype and Predicts Poor Prognosis in Hepatocellular Carcinoma. Ann. Surg. Oncol. 2017, 24, 850–859. [Google Scholar] [CrossRef]
- Qin, C.-D.; Ma, D.-N.; Zhang, S.-Z.; Zhang, N.; Ren, Z.-G.; Zhu, X.-D.; Jia, Q.-A.; Chai, Z.-T.; Wang, C.-H.; Sun, H.-C.; et al. The Rho GTPase Rnd1 inhibits epithelial–mesenchymal transition in hepatocellular carcinoma and is a favorable anti-metastasis target. Cell Death Dis. 2018, 9, 486. [Google Scholar] [CrossRef]
- Boyrie, S.; Delmas, C.; Lemarié, A.; Lubrano, V.; Dahan, P.; Malric, L.; Luis, J.; Gilhodes, J.; Tosolini, M.; Mouly, L.; et al. RND1 regulates migration of human glioblastoma stem-like cells according to their anatomical localization and defines a prognostic signature in glioblastoma. Oncotarget 2018, 9, 33788–33803. [Google Scholar] [CrossRef][Green Version]
- Jiang, W.G.; Watkins, G.; Lane, J.; Cunnick, G.H.; Douglas-Jones, A.; Mokbel, K.; Mansel, R.E. Prognostic value of rho GTPases and rho guanine nucleotide dissociation inhibitors in human breast cancers. Clin. Cancer Res. 2003, 9, 6432–6440. [Google Scholar]
- Nishigaki, M.; Aoyagi, K.; Danjoh, I.; Fukaya, M.; Yanagihara, K.; Sakamoto, H.; Yoshida, T.; Sasaki, H. Discovery of aberrant expression of R-RAS by cancer-linked DNA hypomethylation in gastric cancer using microarrays. Cancer Res. 2005, 65, 2115–2124. [Google Scholar] [CrossRef]
- Xiang, G.; Yi, Y.; Weiwei, H.; Weiming, W. RND1 is up-regulated in esophageal squamous cell carcinoma and promotes the growth and migration of cancer cells. Tumour Biol. 2016, 37, 773–779. [Google Scholar] [CrossRef]
- Aguirre, A.J.; Brennan, C.; Bailey, G.; Sinha, R.; Feng, B.; Leo, C.; Zhang, Y.; Zhang, J.; Gans, J.D.; Bardeesy, N.; et al. High-resolution characterization of the pancreatic adenocarcinoma genome. Proc. Natl. Acad. Sci. USA 2004, 101, 9067–9072. [Google Scholar] [CrossRef] [PubMed]
- Rutherford, S.; Hampton, G.M.; Frierson, H.F.; Moskaluk, C.A. Mapping of candidate tumor suppressor genes on chromosome 12 in adenoid cystic carcinoma. Lab. Investig. 2005, 85, 1076–1085. [Google Scholar] [CrossRef] [PubMed]
- Mouly, L.; Mamouni, K.; Gence, R.; Cristini, A.; Cherier, J.; Castinel, A.; Legrand, M.; Favre, G.; Sordet, O.; Monferran, S. PARP-1-dependent RND1 transcription induced by topoisomerase I cleavage complexes confers cellular resistance to camptothecin. Cell Death Dis. 2018, 9, 931. [Google Scholar] [CrossRef] [PubMed]
- Nishigaki, R.; Osaki, M.; Hiratsuka, M.; Toda, T.; Murakami, K.; Jeang, K.-T.; Ito, H.; Inoue, T.; Oshimura, M. Proteomic identification of differentially-expressed genes in human gastric carcinomas. Proteomics 2005, 5, 3205–3213. [Google Scholar] [CrossRef] [PubMed]
- Soheili, S.; Asadi, M.H.; Farsinejad, A. Distinctive expression pattern of OCT4 variants in different types of breast cancer. Cancer Biomark. 2017, 18, 69–76. [Google Scholar] [CrossRef] [PubMed]
- Kar, S.; Patra, S.K. Overexpression of OCT4 induced by modulation of histone marks plays crucial role in breast cancer progression. Gene 2018, 643, 35–45. [Google Scholar] [CrossRef]
- Shen, L.; Qin, K.; Wang, D.; Zhang, Y.; Bai, N.; Yang, S.; Luo, Y.; Xiang, R.; Tan, X. Overexpression of Oct4 suppresses the metastatic potential of breast cancer cells via Rnd1 downregulation. Biochim. Biophys. Acta (BBA) Mol. Basis Dis. 2014, 1842, 2087–2095. [Google Scholar] [CrossRef]
- Li, W.; Sun, M.; Zang, C.; Ma, P.; He, J.; Zhang, M.; Huang, Z.; Ding, Y.; Shu, Y. Upregulated long non-coding RNA AGAP2-AS1 represses LATS2 and KLF2 expression through interacting with EZH2 and LSD1 in non-small-cell lung cancer cells. Cell Death Dis. 2016, 7, e2225. [Google Scholar] [CrossRef]
- Qi, F.; Liu, X.; Wu, H.; Yu, X.; Wei, C.; Huang, X.; Ji, G.; Nie, F.; Wang, K. Long noncoding AGAP2-AS1 is activated by SP1 and promotes cell proliferation and invasion in gastric cancer. J. Hematol. Oncol. 2017, 10, 11. [Google Scholar] [CrossRef]
- Chen, L.; Zhang, Y.-H.; Zhang, Z.; Huang, T.; Cai, Y.-D. Inferring Novel Tumor Suppressor Genes with a Protein-Protein Interaction Network and Network Diffusion Algorithms. Mol. Ther. Methods Clin. Dev. 2018, 10, 57–67. [Google Scholar] [CrossRef]
- Bianchini, M.; Martinelli, G.; Renzulli, M.; Gonzalez Cid, M.; Larripa, I. cDNA microarray study to identify expression changes relevant for apoptosis in K562 cells co-treated with amifostine and imatinib. Cancer Chemother. Pharmacol. 2007, 59, 349–360. [Google Scholar] [CrossRef] [PubMed]
- Turtoi, A.; Brown, I.; Oskamp, D.; Schneeweiss, F.H.A. Early gene expression in human lymphocytes after gamma-irradiation—A genetic pattern with potential for biodosimetry. Int. J. Radiat. Biol. 2008, 84, 375–387. [Google Scholar] [CrossRef] [PubMed]


| Mutation Type | Cancer Type | Mutation Type | Cancer Type |
|---|---|---|---|
| Missense | Missense | ||
| R5G | Renal Clear Cell C | M137I | Cutaneous Melanoma |
| V11A | Stomach A. Diffuse Type Stomach AdenoC | Q142H | Adrenocortical C |
| V11M | Prostate Neuroendocrine C. Prostate AdenoC | E150D | High-Grade Serous Ovarian Cancer. Serous Ovarian Cancer |
| C14F | Renal Clear Cell C with sarcomatoid features. High-Grade Serous Ovarian C. Serous Ovarian C | A154T | Uterine Endometrioid C |
| C14S | Bladder Urothelial C | A156S | Uterine Endometrioid C |
| V17I | Bladder Urothelial C | G160S | Cutaneous Melanoma |
| G20V | Cutaneous Melanoma | E162D | Intestinal Type Stomach AdenoC |
| T45I | Hepatocellular C. Cutaneous Melanoma | L165P | Colorectal AdenoC |
| V46M | Colorectal AdenoC. Uterine Endometrioid C | E166K | Cutaneous melanoma |
| E48K | Cutaneous Melanoma | G167D | Astrocytoma |
| E57G | Acute Myeloid Leukemia | A169V | Cutaneous melanoma |
| E57K | Lung AdenoC | F180C | Breast C |
| E58K | Bladder Urothelial C | R181W | Cutaneous melanoma |
| E62V | Lung Squamous Cell C | S184F | Melanoma |
| G70R | Breast C | S184T | Renal Clear Cell C |
| P72S | Cutaneous Squamous Cell C | S184Y | Uterine Endometrioid C |
| D75H | Breast Invasive Ductal C | M185V | Breast C |
| D75N | Colorectal AdenoC. Cutaneous Melanoma | P191S | Colorectal AdenoC |
| S85L | Uterine Endometrioid C | Q196H | Hepatocellular C |
| D86N | Cutaneous Melanoma | L203F | Lung Squamous Cell C |
| A87V | Uterine Endometrioid C | R213H | Uterine Carcinosarcoma. Colorectal AdenoC |
| R96H | Prostate Neuroendocrine C. Uterine Endometrioid C. Colon AdenoC | S214F | Uterine Endometrioid C |
| E98D | Breast C | I217M | Invasive Breast C. Breast Mixed Ductal and Lobular C. Breast Invasive Ductal C |
| D101N | Bladder Urothelial C | Truncating | |
| A103T | Stomach AdenoC. Uterine Endometrioid C | A6Pfs * 28 | Mucinous AdenoC of the colon and rectum |
| K106Q | Uterine Endometrioid C | Q8Pfs * 8 | Renal Clear Cell C. Stomach AdenoC |
| W107G | Cutaneous Melanoma | X70_splice | Pancreatic AdenoC |
| R108K | Cutaneous Melanoma | X107_splice | Esophagogastric AdenoC |
| R108M | Cutaneous Melanoma | E162 * | Uterine Endometrioid C |
| E110K | Cutaneous Melanoma | Y164 * | Lung AdenoC |
| P116S | Bladder Urothelial C | S168 * | Bladder Urothelial C |
| S117N | Glioblastoma Multiforme | R201 * | Colon AdenoC |
| T118A | Colorectal AdenoC | R206 * | Uterine Serous/Papillary Serous C |
| I123F | Pancreatic AdenoC | ||
| K126N | Cervical Squamous Cell C | Fusion protein | |
| R130Q | Uterine Endometrioid C. Colorectal AdenoC. Mucinous AdenoC of the colon and rectum | MLL2-RND1 | Esophageal AdenoC |
| D132G | Mucinous AdenoC of the colon and rectum | DDX23-RND1 | Hepatocellular C |
| Anticancer Agents | Drug Target | Auton Ganglia | Bone | Breast | Endom | Hematopoietic | Kidney | Large Intestine | Liver | Lung | Ovary | Pancreas | Pleura | Skin | Aero Digestive |
|---|---|---|---|---|---|---|---|---|---|---|---|---|---|---|---|
| 17AAG | Hsp90 | ns | ns | ns | ns | ns | ns | ns | ns | ns | ns | ns | ns | ns | ns |
| AEW541 | IGFR1 | ns | 0.6273, p = 0.039 | ns | ns | −0.3068, p = 0.009 | ns | ns | ns | 0.2936, p = 0.005 | ns | ns | ns | ns | ns |
| AZD0530 | Src | ns | ns | ns | ns | ns | ns | ns | ns | ns | ns | ns | −0.8214, p = 0.023 | ns | ns |
| AZD6244 | MEK | ns | ns | ns | ns | −0.4611, p = 10−4 | ns | ns | ns | ns | ns | ns | ns | ns | ns |
| Erlotinib | EGFR | ns | ns | ns | ns | −0.3332, p = 0.005 | ns | −0.4383, p = 0.036 | ns | ns | ns | ns | ns | ns | ns |
| Irinotecan | Topo I | ns | ns | ns | ns | ns | ns | ns | ns | ns | ns | ns | ns | ns | ns |
| L-685458 | γ secretase | ns | ns | ns | ns | −0.3147, p = 0.008 | ns | −0.4230, p = 0.049 | ns | ns | −0.4225, p = 0.025 | ns | ns | −0.3957, p = 0.013 | ns |
| LBW242 | IAP | ns | ns | ns | ns | ns | ns | ns | ns | ns | ns | ns | ns | ns | ns |
| Lapatinib | EGFR | ns | ns | ns | ns | ns | 0.800, p = 0.010 | ns | ns | 0.2649, p = 0.011 | ns | ns | ns | ns | ns |
| Nilotinib | Abl | ns | 0.7, p = 0.036 | ns | ns | −0.2816, p = 0.019 | ns | ns | 0.7088, p = 0.007 | ns | ns | ns | ns | ns | ns |
| Nutlin-3 | p53-mdm2 | ns | ns | ns | ns | ns | ns | ns | ns | ns | ns | ns | ns | ns | ns |
| PD-0325901 | MEK | ns | ns | ns | ns | −0.4359, p = 0.0001 | ns | ns | ns | 0.2592, p = 0.013 | ns | ns | ns | ns | ns |
| PD-0332991 | cdk 4/6 | −0.8214, p = 0.023 | ns | ns | 0.6571, p = 0.008 | ns | ns | ns | ns | ns | ns | ns | ns | ns | ns |
| PF2341066 | c-met | ns | ns | ns | ns | −0.2580, p = 0.030 | ns | ns | ns | ns | ns | ns | ns | ns | ns |
| PHA-665752 | c-met | ns | ns | ns | ns | ns | ns | ns | ns | ns | ns | ns | ns | ns | ns |
| PLX4720 | B-RafV600E | ns | ns | ns | ns | ns | ns | ns | ns | ns | ns | −0.4286, p = 0.026 | ns | ns | ns |
| Paclitaxel | Microtubules | ns | ns | ns | ns | ns | ns | ns | ns | ns | ns | ns | ns | ns | 0.9286, p = 0.003 |
| Panobinostat | HDAC | ns | ns | ns | ns | ns | ns | −0.4200, p = 0.046 | ns | ns | ns | ns | 0.9286, p = 0.003 | ns | ns |
| RAF265 | B-Raf | ns | ns | ns | ns | −0.3737, p = 0.002 | ns | ns | ns | ns | ns | ns | ns | ns | ns |
| Sorafenib | Tyrosine kinase | ns | ns | ns | ns | ns | ns | ns | ns | ns | ns | ns | ns | ns | ns |
| TAE684 | Alk | ns | ns | −0.4084, p = 0.028 | ns | −0.2847, p = 0.016 | ns | ns | ns | ns | ns | ns | ns | ns | ns |
| TKI258 | Receptor tyrosine kinase | ns | ns | ns | ns | −0.2764, p = 0.020 | −0.8333, p = 0.005 | ns | ns | ns | ns | −0.3996, p = 0.035 | ns | ns | ns |
| Topotecan | Topo I | ns | ns | ns | ns | ns | ns | ns | ns | ns | ns | ns | ns | ns | ns |
| ZD-6474 | VEGFR | ns | ns | ns | ns | ns | ns | ns | ns | ns | ns | ns | ns | ns | ns |
| Anticancerous Agents | Correlation Coefficient | p Value |
|---|---|---|
| 17-AAG | 0.1237 | 0.3040 |
| AEW541 | 0.1882 | 0.1160 |
| AZD0530 | 0.0841 | 0.4855 |
| AZD6244 | 0.0554 | 0.6464 |
| Erlotinib | −0.1070 | 0.3743 |
| Irinotecan | 0.0493 | 0.7311 |
| L-685458 | −0.0054 | 0.9648 |
| LBW242 | 0.0479 | 0.6917 |
| Lapatinib | 0.1342 | 0.2646 |
| Nilotinib | 0.1233 | 0.3130 |
| Nutlin-3 | 0.0628 | 0.6026 |
| PD-0325901 | 0.0478 | 0.6923 |
| PD-0332991 | 0.2655 * | 0.0275 |
| PF2341066 | 0.1118 | 0.3532 |
| PHA-665752 | 0.1113 | 0.3553 |
| PLX4720 | 0.0846 | 0.4831 |
| Paclitaxel | 0.0959 | 0.4262 |
| Panobinostat | −0.0325 | 0.7879 |
| RAF265 | −0.0446 | 0.7159 |
| Sorafenib | 0.0902 | 0.4544 |
| TAE684 | 0.1848 | 0.1229 |
| TKI258 | −0.0148 | 0.9026 |
| Topotecan | 0.0772 | 0.5224 |
| ZD-6474 | 0.0897 | 0.4571 |
© 2019 by the authors. Licensee MDPI, Basel, Switzerland. This article is an open access article distributed under the terms and conditions of the Creative Commons Attribution (CC BY) license (http://creativecommons.org/licenses/by/4.0/).
Share and Cite
Mouly, L.; Gilhodes, J.; Lemarié, A.; Cohen-Jonathan Moyal, E.; Toulas, C.; Favre, G.; Sordet, O.; Monferran, S. The RND1 Small GTPase: Main Functions and Emerging Role in Oncogenesis. Int. J. Mol. Sci. 2019, 20, 3612. https://doi.org/10.3390/ijms20153612
Mouly L, Gilhodes J, Lemarié A, Cohen-Jonathan Moyal E, Toulas C, Favre G, Sordet O, Monferran S. The RND1 Small GTPase: Main Functions and Emerging Role in Oncogenesis. International Journal of Molecular Sciences. 2019; 20(15):3612. https://doi.org/10.3390/ijms20153612
Chicago/Turabian StyleMouly, Laetitia, Julia Gilhodes, Anthony Lemarié, Elizabeth Cohen-Jonathan Moyal, Christine Toulas, Gilles Favre, Olivier Sordet, and Sylvie Monferran. 2019. "The RND1 Small GTPase: Main Functions and Emerging Role in Oncogenesis" International Journal of Molecular Sciences 20, no. 15: 3612. https://doi.org/10.3390/ijms20153612
APA StyleMouly, L., Gilhodes, J., Lemarié, A., Cohen-Jonathan Moyal, E., Toulas, C., Favre, G., Sordet, O., & Monferran, S. (2019). The RND1 Small GTPase: Main Functions and Emerging Role in Oncogenesis. International Journal of Molecular Sciences, 20(15), 3612. https://doi.org/10.3390/ijms20153612