Article

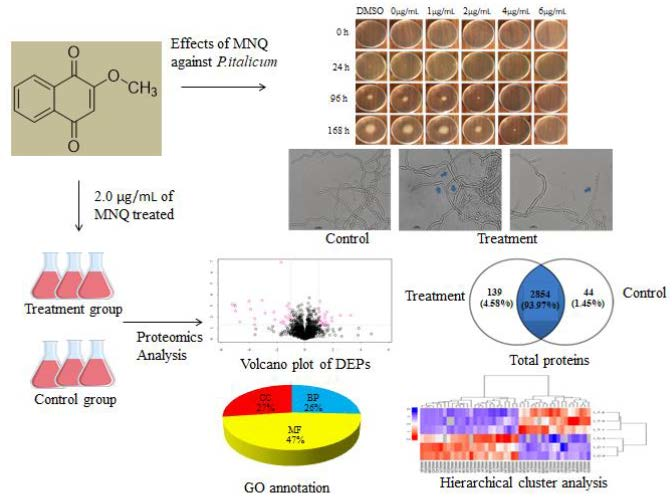
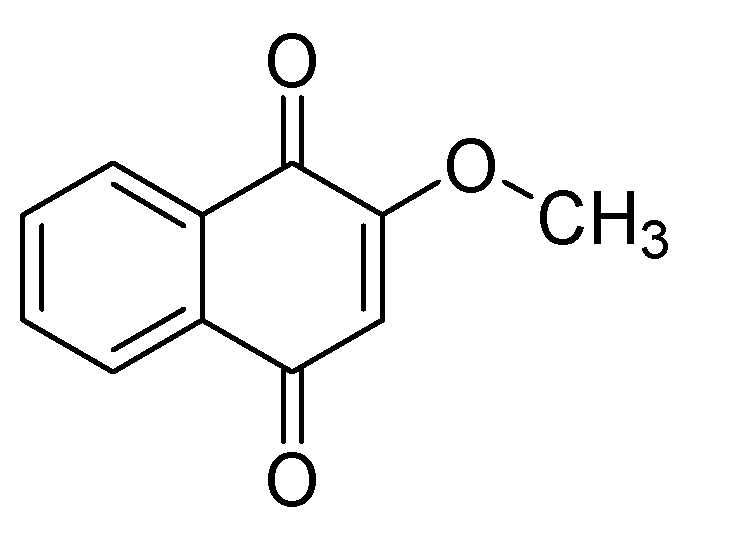
Label-Free Proteomic Analysis of Molecular Effects of 2-Methoxy-1,4-naphthoquinone on Penicillium italicum

1
Guangdong Provincial Key Laboratory of Food Quality and Safety, College of Food Science, South China Agricultural University, Guangzhou 510642, China
2
Joint Laboratory of Guangdong Province and Hong Kong Region on Marine Bioresource Conservation and Exploitation, College of Marine Sciences, South China Agricultural University, Guangzhou 510642, China
3
Guangdong Provincial Key Laboratory of Applied Botany, South China Botanical Garden, Chinese Academy of Sciences, Guangzhou 510650, China
4
College of Veterinary Medicine, South China Agricultural University, Guangzhou 510642, China
*
Authors to whom correspondence should be addressed.
Int. J. Mol. Sci. 2019, 20(14), 3459; https://doi.org/10.3390/ijms20143459
Submission received: 22 May 2019 / Revised: 6 July 2019 / Accepted: 10 July 2019 / Published: 14 July 2019
(This article belongs to the Special Issue Drug Resistance Mechanisms in Bacteria)

Abstract

:
Penicillium italicum is the principal pathogen causing blue mold of citrus. Searching for novel antifungal agents is an important aspect of the post-harvest citrus industry because of the lack of higher effective and low toxic antifungal agents. Herein, the effects of 2-methoxy-1,4-naphthoquinone (MNQ) on P. italicum and its mechanism were carried out by a series of methods. MNQ had a significant anti-P. italicum effect with an MIC value of 5.0 µg/mL. The label-free protein profiling under different MNQ conditions identified a total of 3037 proteins in the control group and the treatment group. Among them, there were 129 differentially expressed proteins (DEPs, up-regulated > 2.0-fold or down-regulated < 0.5-fold, p < 0.05), 19 up-regulated proteins, 26 down-regulated proteins, and 67 proteins that were specific for the treatment group and another 17 proteins that were specific for the control group. Of these, 83 proteins were sub-categorized into 23 hierarchically-structured GO classifications. Most of the identified DEPs were involved in molecular function (47%), meanwhile 27% DEPs were involved in the cellular component and 26% DEPs were involved in the biological process. Twenty-eight proteins identified for differential metabolic pathways by KEGG were sub-categorized into 60 classifications. Functional characterization by GO and KEGG enrichment results suggests that the DEPs are mainly related to energy generation (mitochondrial carrier protein, glycoside hydrolase, acyl-CoA dehydrogenase, and ribulose-phosphate 3-epimerase), NADPH supply (enolase, pyruvate carboxylase), oxidative stress (catalase, glutathione synthetase), and pentose phosphate pathway (ribulose-phosphate 3-epimerase and xylulose 5-phosphate). Three of the down-regulated proteins selected randomly the nitro-reductase family protein, mono-oxygenase, and cytochrome P450 were verified using parallel reaction monitoring. These findings illustrated that MNQ may inhibit P. italicum by disrupting the metabolic processes, especially in energy metabolism and stimulus response that are both critical for the growth of the fungus. In conclusion, based on the molecular mechanisms, MNQ can be developed as a potential anti-fungi agent against P. italicum.

Graphical Abstract

1. Introduction

Plant pathogenic fungi negatively affects a large number of important fruits during the growing season and throughout post-harvest storage that cause serious losses of yield and quality for a number of fruits worldwide [1,2]. For instance, 10% to 30% of citrus fruit loss is caused by blue mold disease throughout the world [3]. One of the most usual post-harvest fungal diseases of citrus fruits is blue mold caused by Penicillium italicum. Agricultural practices and biological measures only provided limited relief against this disease. Thus, a large number of commercial fungicides were used to control the blue mold [4]. Application of numerous chemical synthetic fungicides is the major method to control P. italicum of citrus. However, the application of synthetic fungicides has been increasingly restricted because of a series of severe issues that arose from these chemical synthetic fungicides, such as residues of toxic compounds, environmental pollution, pathogen resistant development, and health hazard problems [4]. Compared to chemical synthetic antifungal agents, natural compounds are generally found to be safe due to less toxicity or no toxicity. It is, therefore, urgent to explore novel effective and non-toxic or less toxic antifungal agents with new modes of action. The numbers of research studies have reported the antifungal effects of natural antifungal compounds for restraining postharvest blue mold caused by P. italicum [3,5,6,7,8].
A 2-methoxy-1,4-naphthoquinone (MNQ) (Figure 1) is a naturally occurring phytochemical isolated from a traditional Chinese medicinal plant, Impatiens balsamina Linn [9]. Previous studies showed that MNQ possessed diverse biological activities including anti-cancer [10], anti-metastatic [11] , and anti-bacterial [12] properties. However, there is still a lack of more data about the antifungal activities of this 1,4-naphthoquinone derivative [10,13]. Nonetheless, our present investigation indicated that the MNQ had a significant anti-fungal activity against P. italicum as a promising anti-fungal precursor. However, the possible antifungal molecular mechanisms of MNQ P. italicum have not been investigated yet. Thus, the possible mechanisms involving changes of morphological, changes of proteins and pathways, and the energy deficit in P. italicum should be further investigated because the biomolecules functionally govern cellular processes and, ultimately, dictate the biological phenotypes, proteins that are primary targets of drug discovery [11], and the differentially expressed proteins (DEPs). These offer clues on the proteins and pathways affected by a drug treatment [14].
In this study, we aimed to investigate the modulatory effects of MNQ toward the P. italicum proteome by using a label-free quantitative proteomic approach to identify proteins with significantly changed expression profiles, to confirm their functions in the MNQ-treated P. italicum. Moreover, three selected proteins related to oxidative stress and polycyclic aromatic hydrocarbon degradation were also confirmed using parallel reaction monitoring (PRM) analysis. Ultimately, these findings will contribute to our further understanding of the possible new molecular action of MNQ against P. italicum.

2. Results

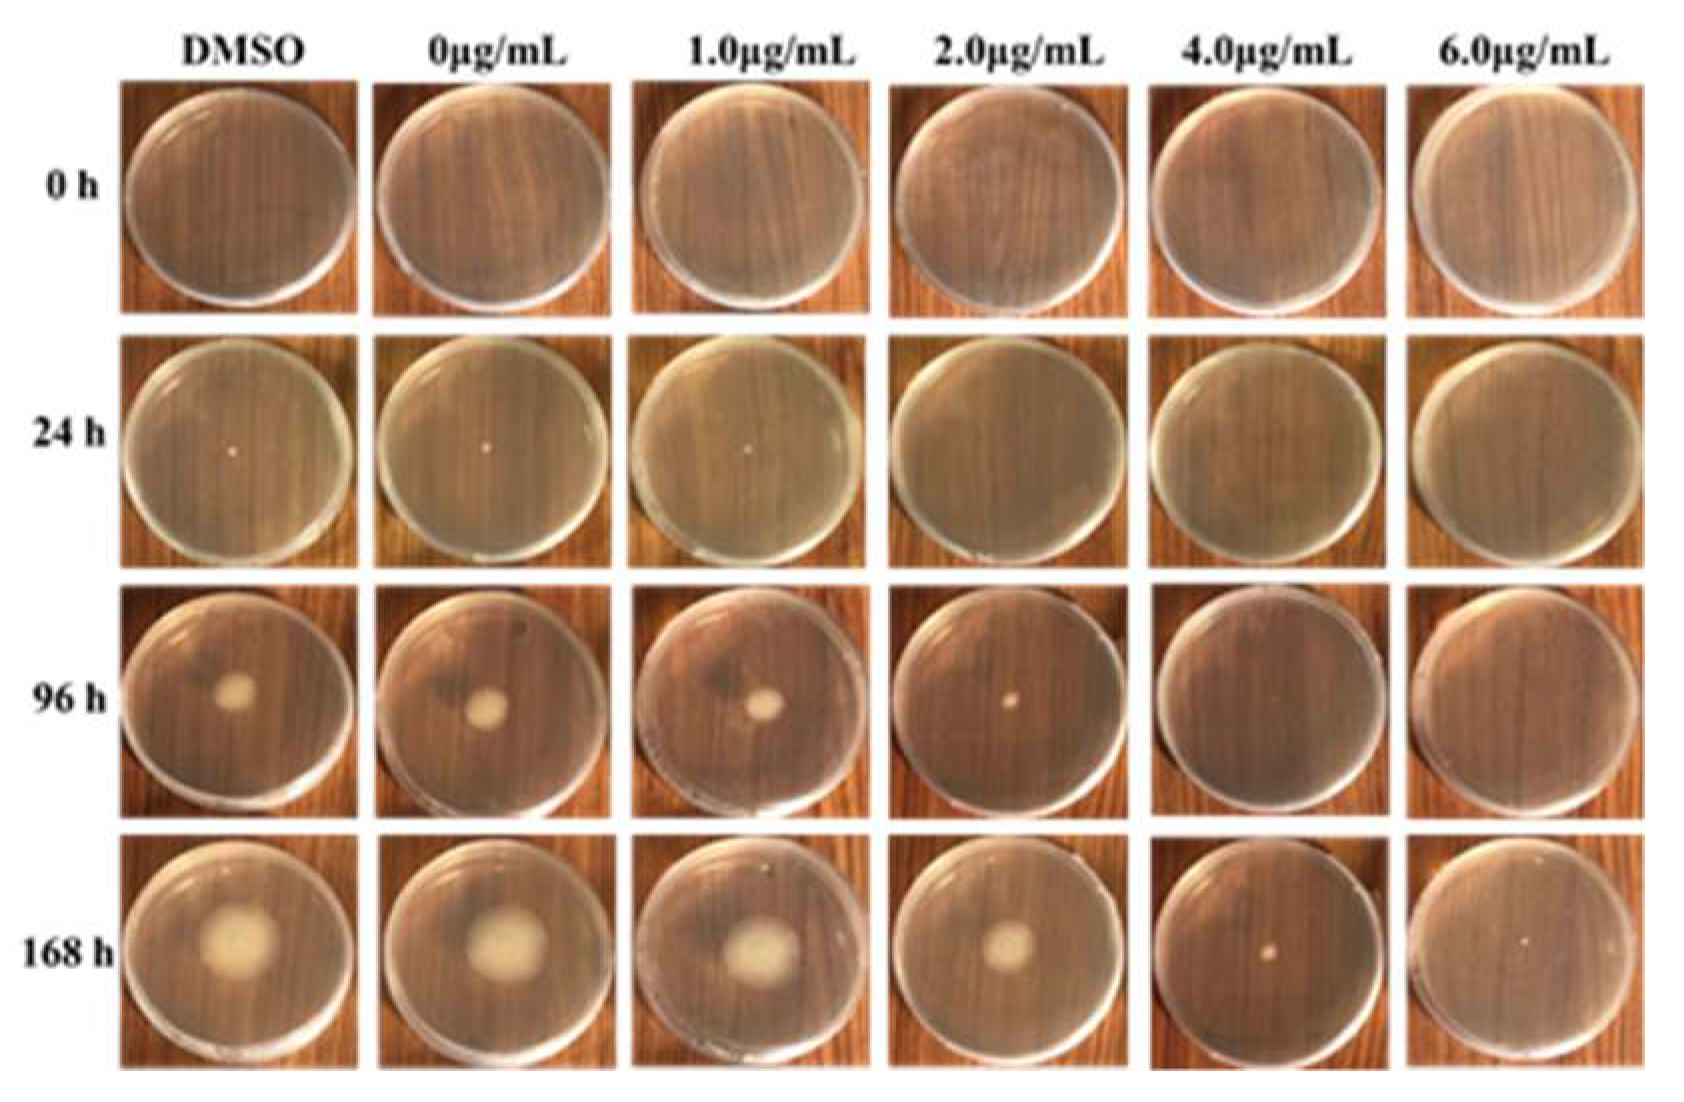
2.1. Effects of MNQ on P. italicum

The inhibitory effect of MNQ on P. italicum was carried out using a mycelial growth rate method. As shown in Table 1, MNQ at 1.0 μg/mL showed a blank antifungal activity against P. italicum. When the concentrations of MNQ are at 2.0, 4.0, and 6.0 μg/mL, MNQ displayed a high anti-fungal activity against P. italicum. Among them, MNQ at 6.0 μg/mL exhibited a stronger antifungal activity against P. italicum. As depicted in Figure 2, P. italicum mycelial growth showed a declining tendency with the increasing concentrations of MNQ. The MIC value was defined as the lowest MNQ concentration that completely inhibited the growth of P. italicum after 48 hours of incubation at 28 °C [15]. MNQ showed a significant anti-P. italicum effect with an MIC value of 5.0 µg/mL (Figure S1).

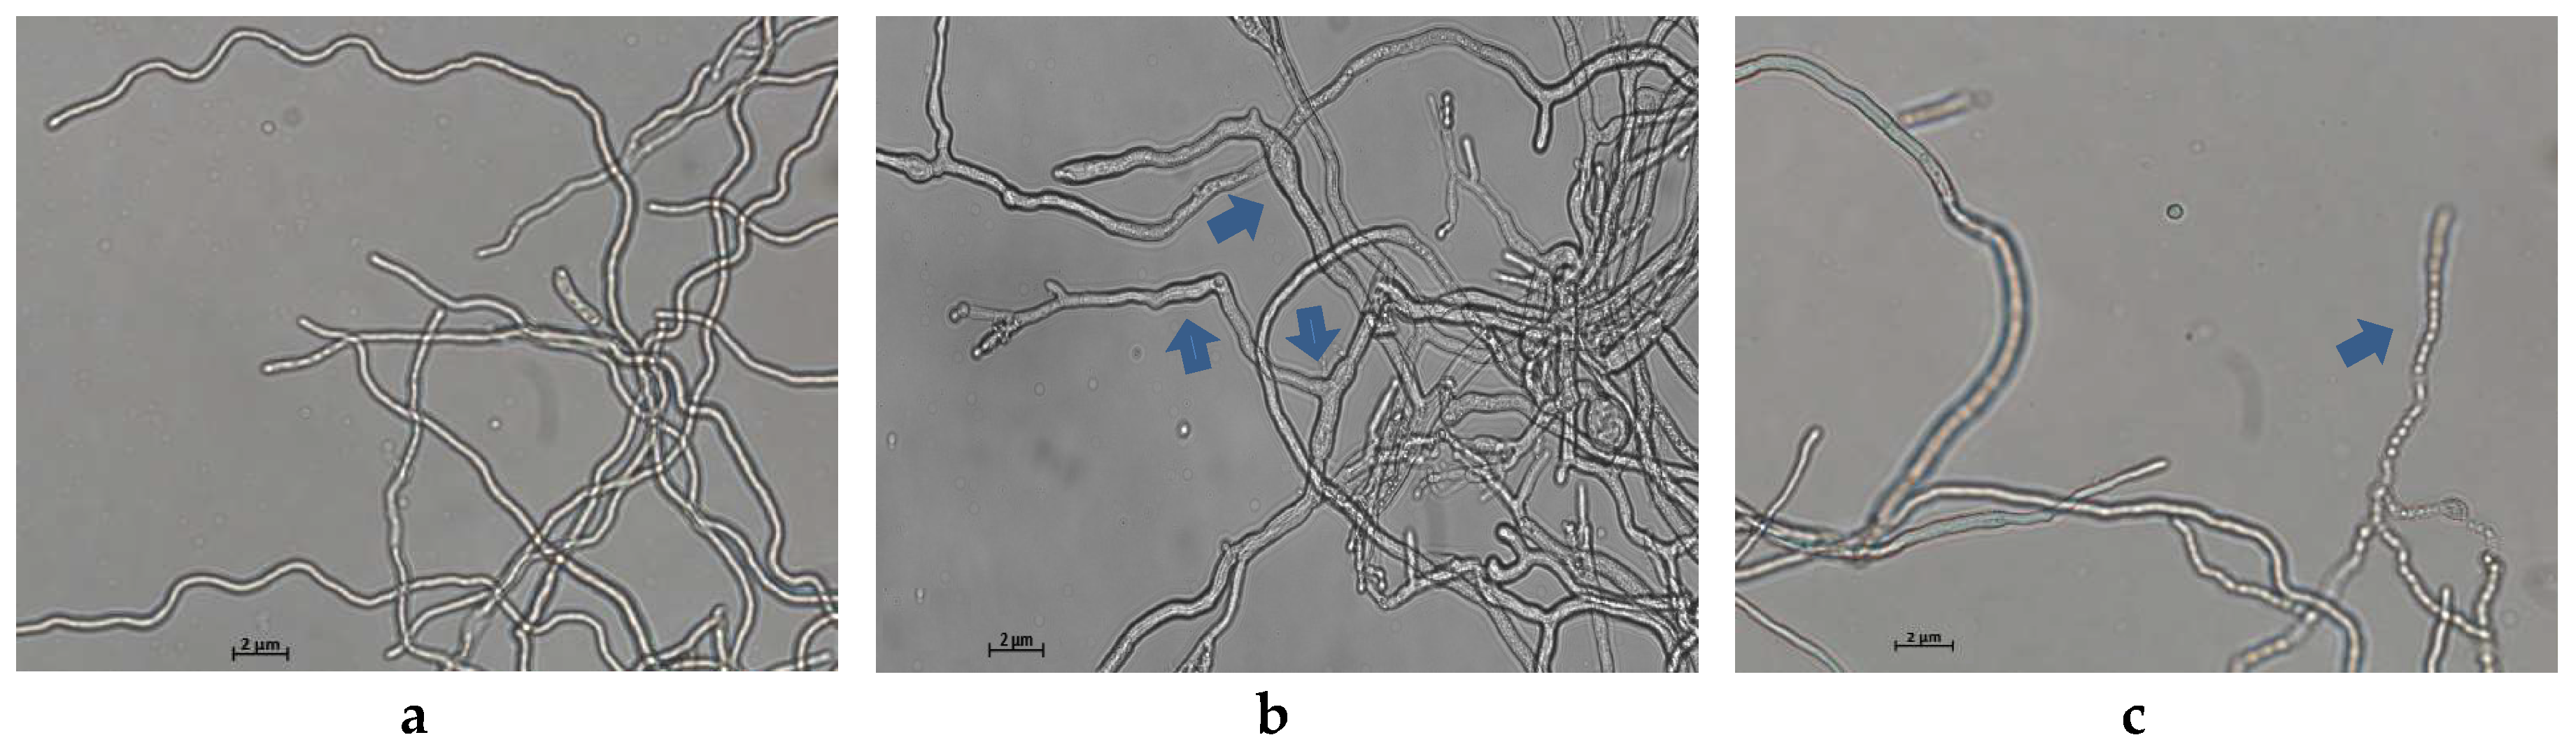
2.2. Light Microscopy Observation

Light microscopy of the control P. italicum mycelia grown on PDB showed a normal, filamentous, and homogeneous mycelial morphology (Figure 3a). By contrast, the mycelia treated with 2.0 μg/mL of MNQ showed a massive distortion and abnormal enlargement of the growing point. Meanwhile, Figure 3b,c showed that the MNQ-treated mycelia significantly altered the mycelial morphology of P. italicum, including breakage and malformation (highlighted with blue arrows). Clearly, MNQ treatment resulted in the damage to P. italicum mycelia (magnification is 400 times).

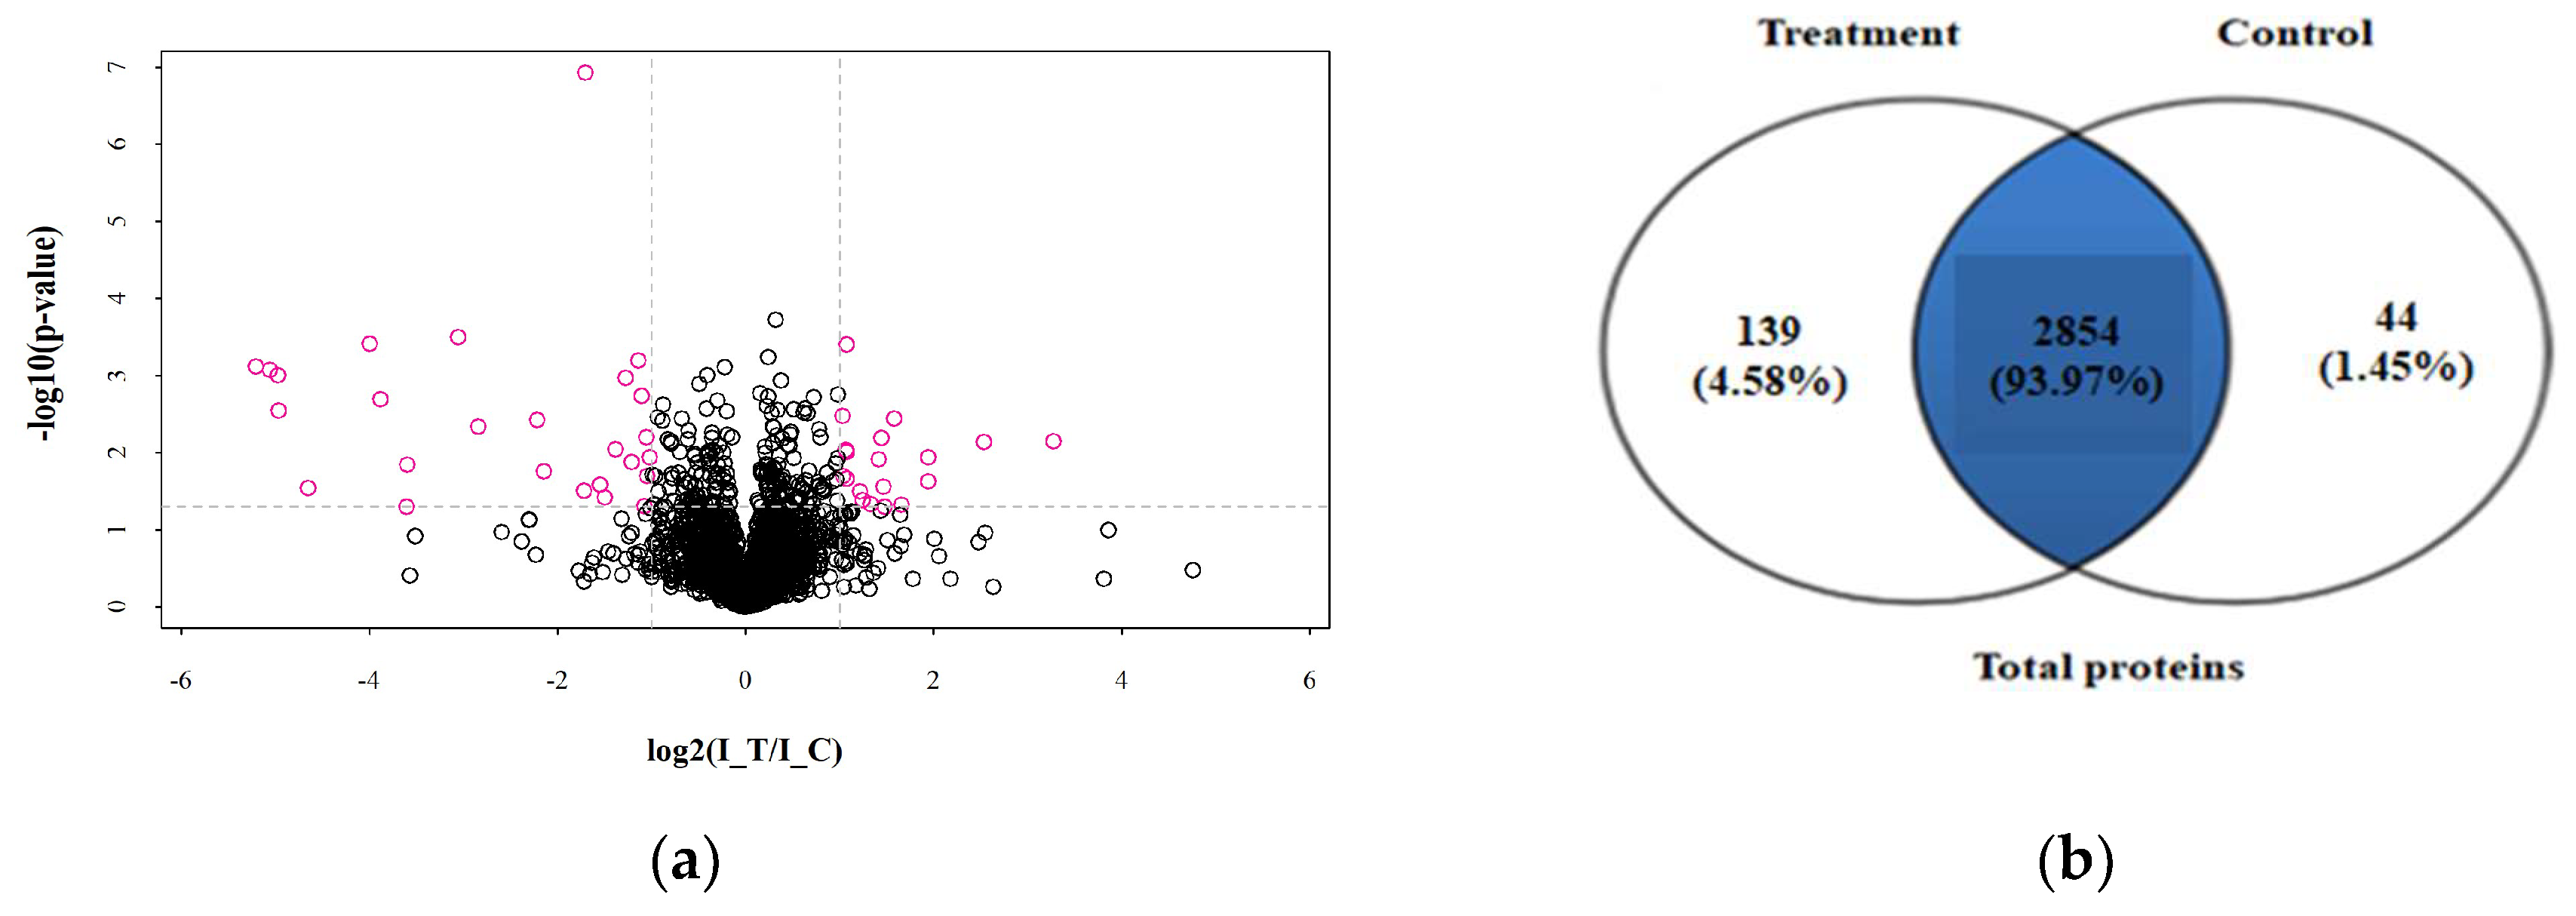
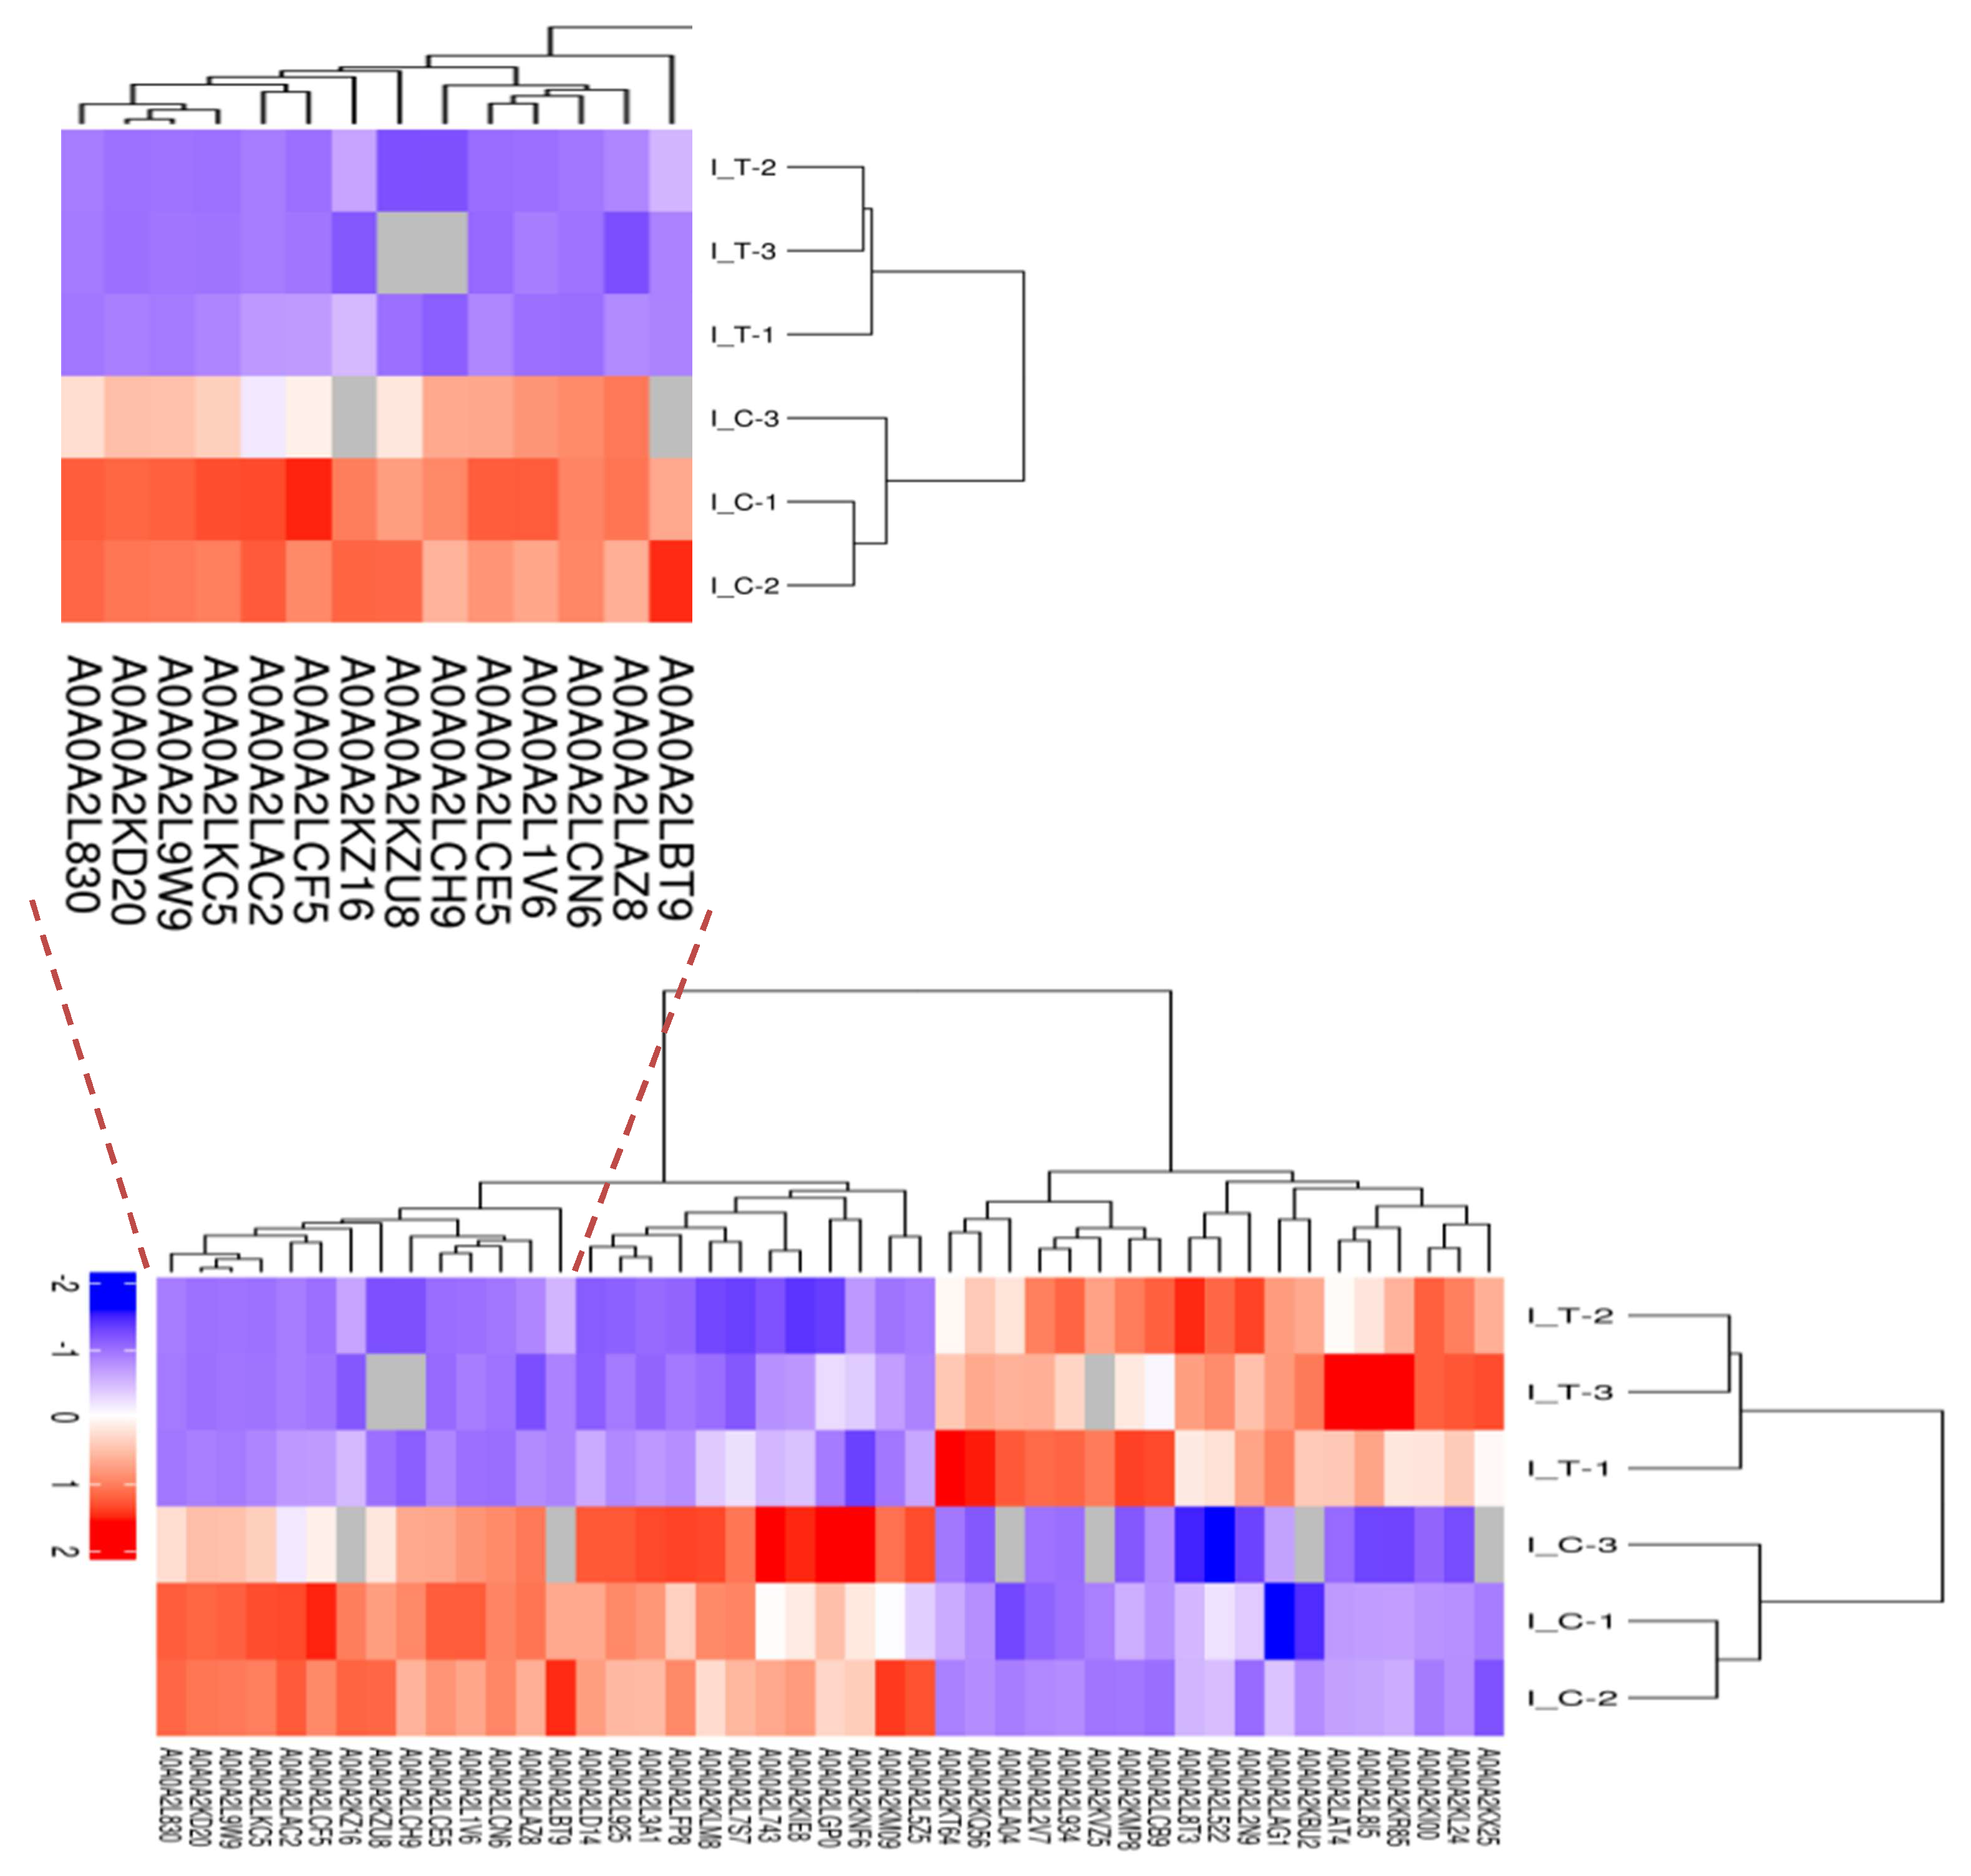
2.3. Label-Free Proteomic Based Protein Identification in the Treatment Group and Control Group

Quantitative proteomic analysis of mycelia samples from the treatment group and control group was performed using the label-free proteomic analysis method. In total, 3037 proteins were identified with a 1% false discovery rate (FDR) (Table S1). Figure 4 shows the total numbers of differentially expressed proteins in the treatment group and the control group. Figure 4a shows the volcano plot for the differentially expressed proteins (DEPs) in the treatment group and the DEPs (up-regulated > 2.0-fold or down-regulated < 0.5-fold, p < 0.05) highlight in a pink color. All the DEPs are listed in Table 2. The Venn diagram in Figure 4b shows the number of proteins that are unique to the treatment group or the control group. As shown in Figure 4b, there were 2854 proteins both expressed in the treatment group and the control group, 139 proteins were unique to the treatment group when compared to 44 for the control group. A total of 129 proteins showed significant changes in expression. Compared with the control group, 45 proteins (19 up-regulated and 26 down-regulated) were significantly changed in abundance in the treatment group (Table 3). Meanwhile, 67 newly arising proteins were identified in the treatment group, but not found in the control group, and 17 proteins were undetectable in the treatment group while observed in the control group. Hierarchical cluster analysis was performed for all the DEPs for the treatment group and the control group (Figure 5). As shown in Figure 5, it was easy to note that the differentially expressed proteins in the treatment group did not cluster together with the one in the control group.

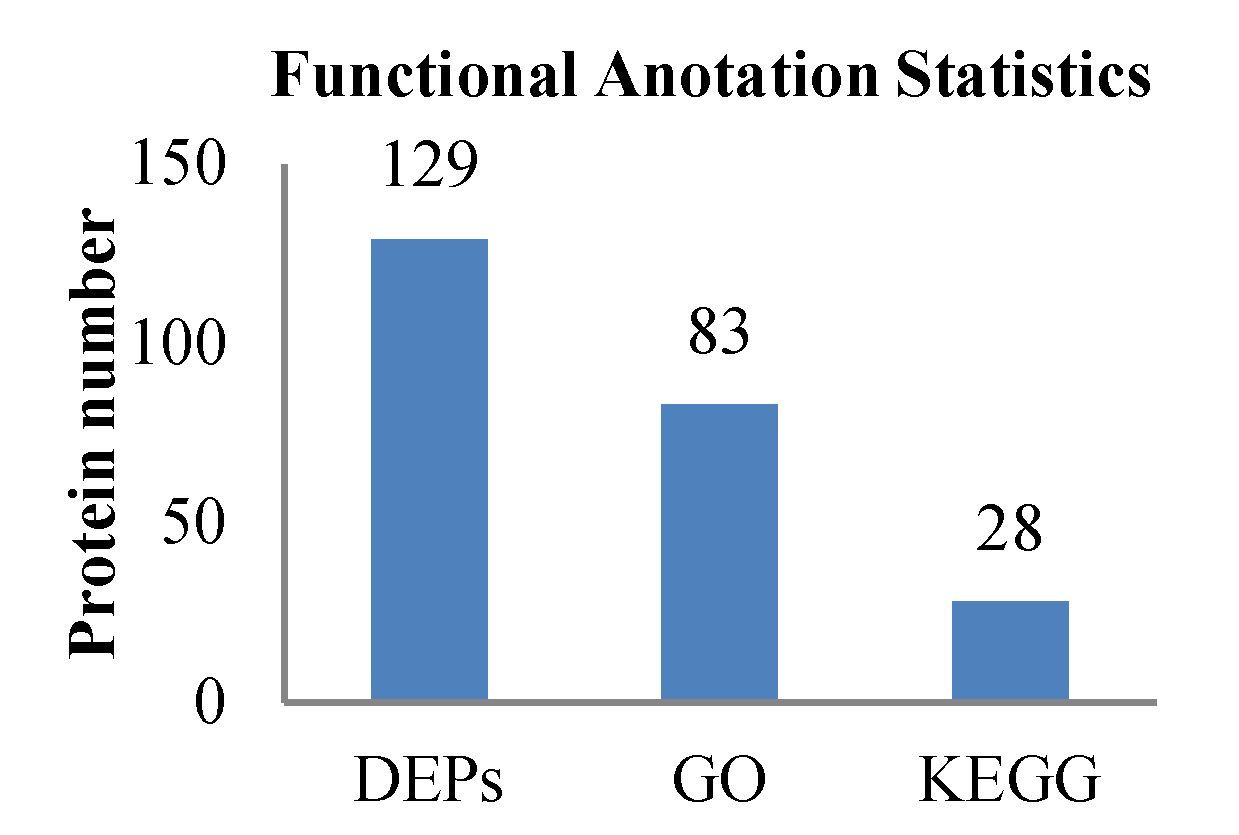
2.4. Functional Annotation of Proteins

To deduce the functionality and biological processes associated with the identified DEPs in the treatment group and control group, gene ontology (GO) analysis and Kyoto Encyclopedia of Genes and Genomes (KEGG) enrichments were performed. The GO and KEGG annotation of the identified proteins were carried out to comprehensively reflect the biological functions and significance of these proteins in various life activities. Functional annotation of all proteins obtained from the treatment group and control group revealed a sum of 129 differential proteins. Of these, 83 proteins were sub-categorized into 23 hierarchically-structured GO classifications. Twenty-eight proteins identified for differential metabolic pathways by KEGG were sub-categorized into 60 classifications (Figure 6).

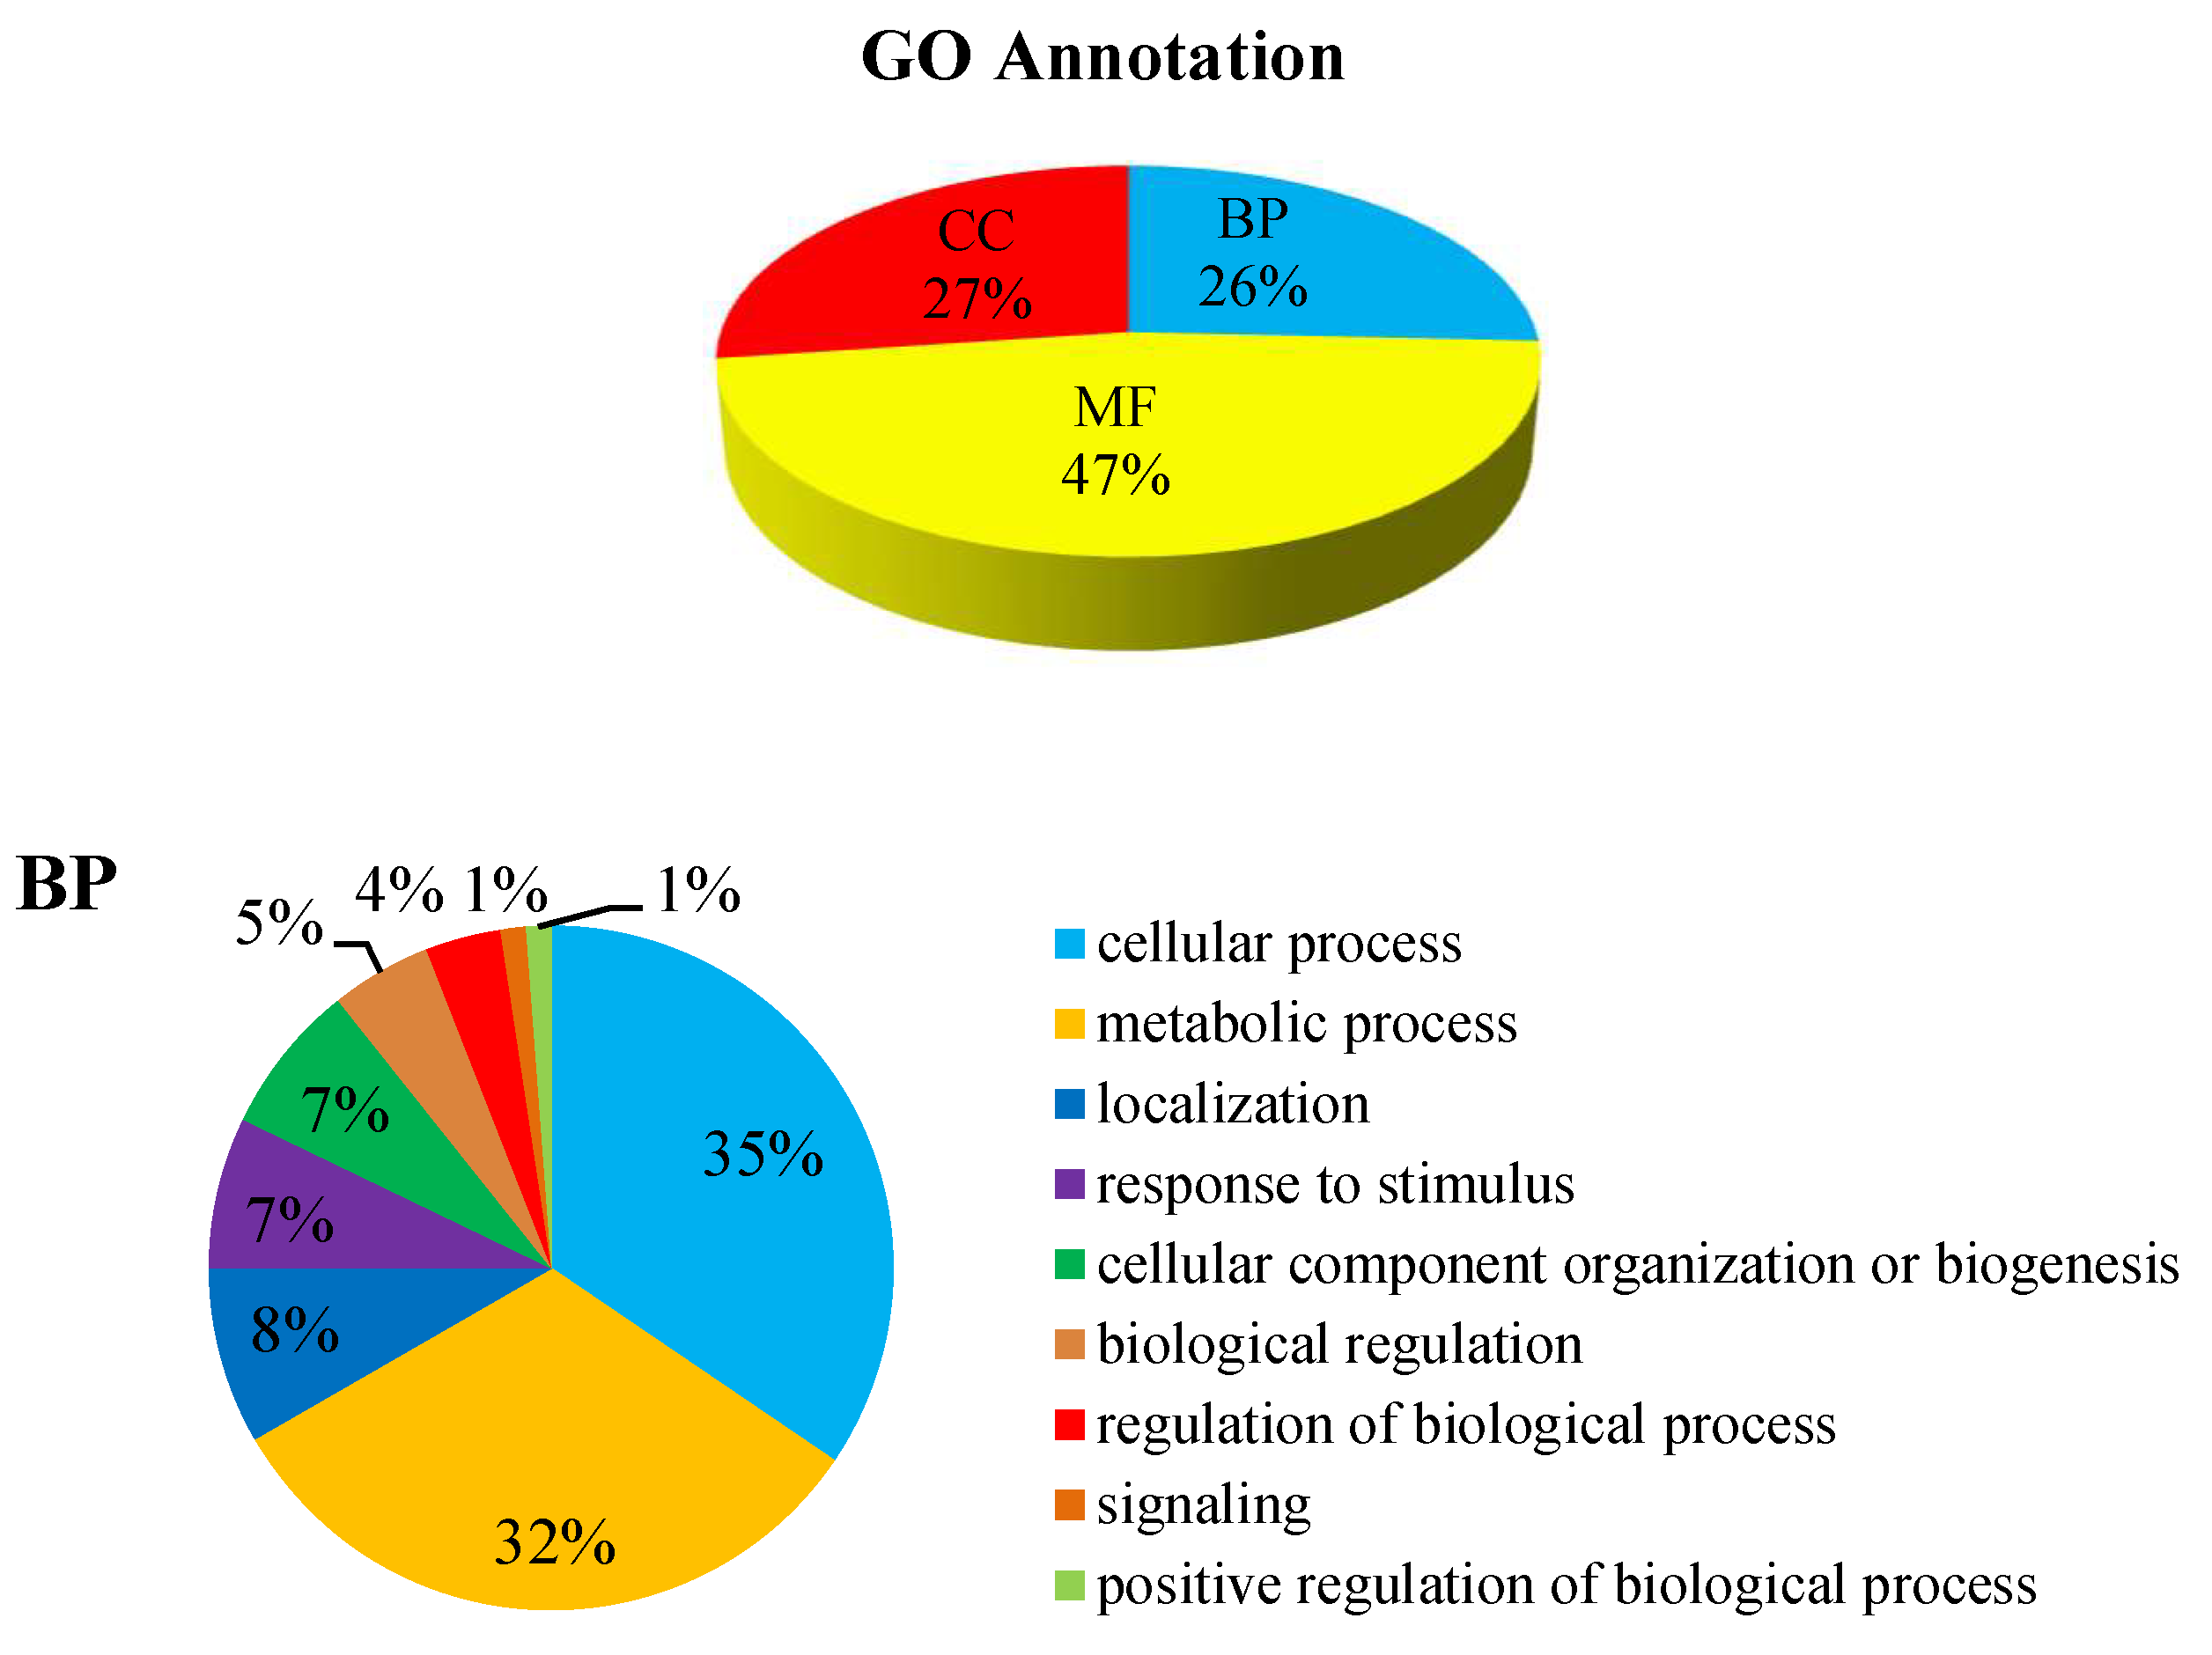
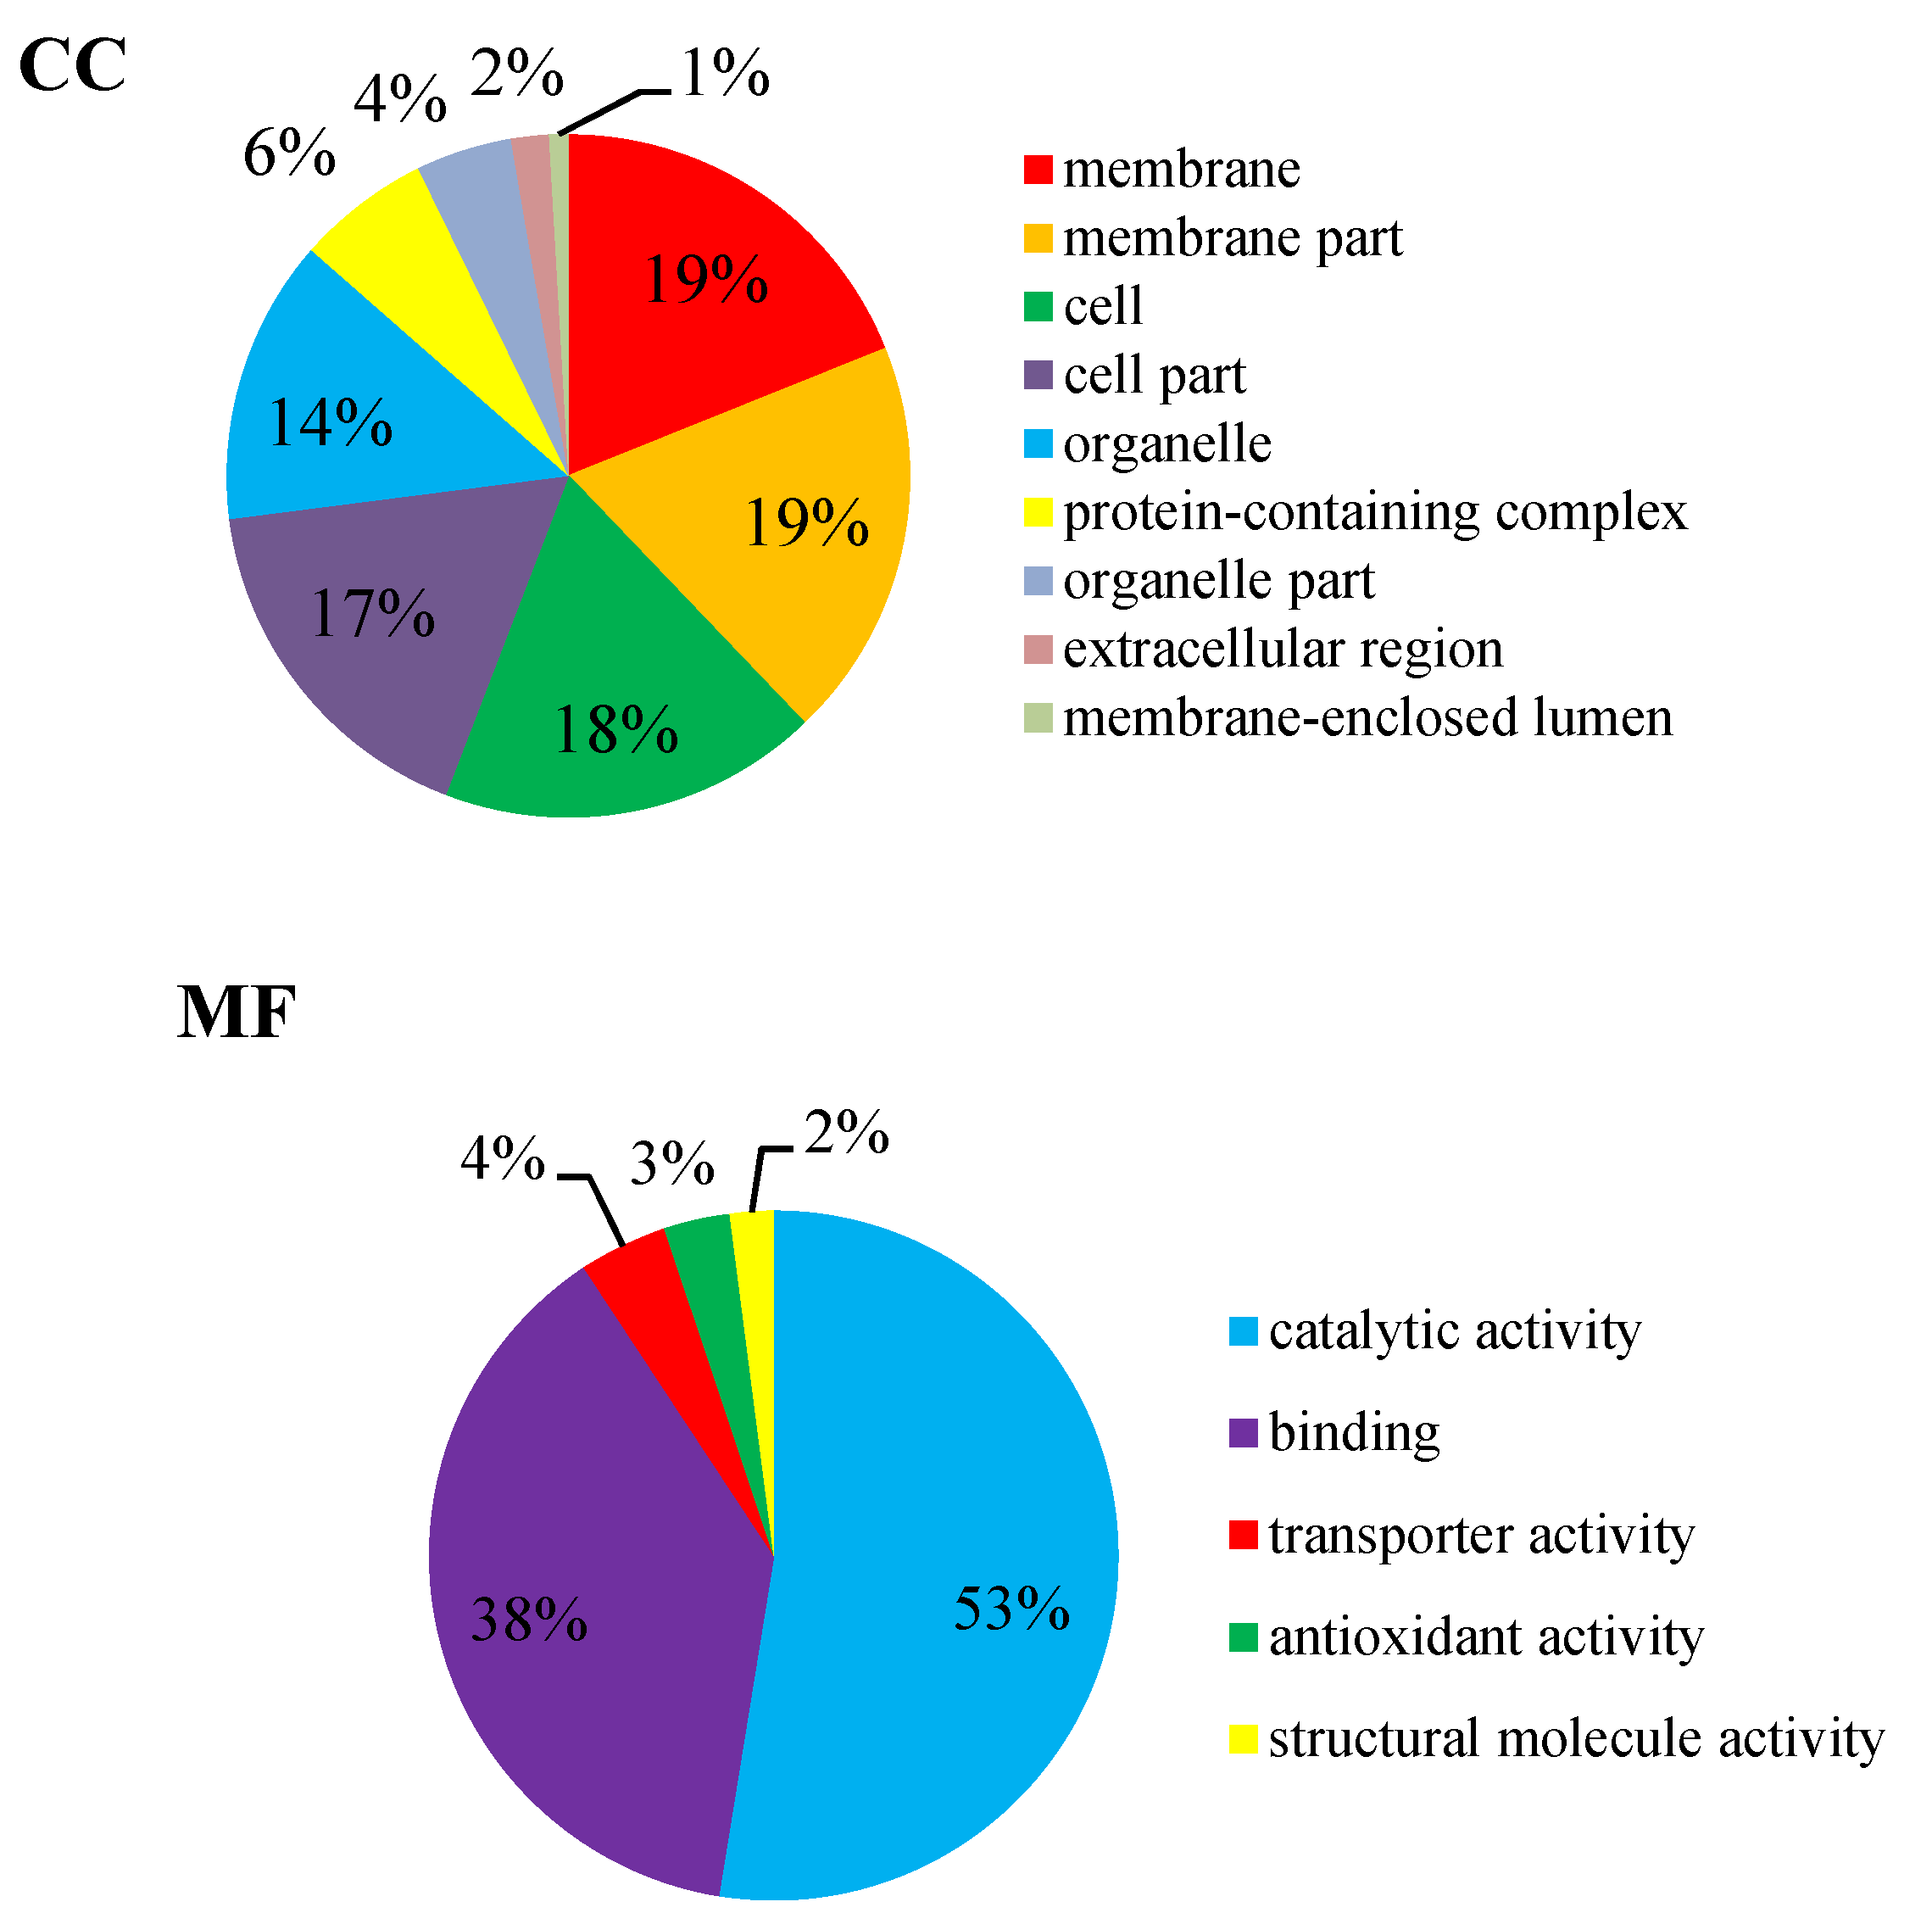
2.4.1. Gene Ontology (GO) Annotation

GO annotation gives a priority for a systematical analysis of the protein properties of targeted proteins [16]. In order to get a detailed description, GO was further categorized into three components e.g., biological process (BP), cellular component (CC), and molecular function (MF). The GO analysis revealed that the identified DEPs were associated with different molecular and biological processes. Most of the identified DEPs were involved in molecular function (47%). Meanwhile 27% DEPs were involved in the cellular component and 26% DEPs were involved in the biological process (Figure 7). The biological process was found to be highly enriched in the cellular process (35%) and the metabolic process (32%). At the cellular component level, the identified DEPs were linked to the membrane (19%), membrane part (19%), cell (18%), cell part (17%), and organelle (14%). Similarly, catalytic activity (53%) and binding (38%) were most significantly expressed in the molecular function. Altogether, these results suggest that many proteins in P. italicum under MNQ treated might be involved in different metabolic and cellular processes and localize in different cell parts and organelles.

2.4.2. Metabolic Pathway Annotation

The DEPs coordinate with each other to express their biological behavior. Thus, the pathway-based annotation broadens further exploration of their biological functions. The pathway analysis can determine important biochemical, ametabolic, and signaling pathways regulated by proteins. The KEGG database results indicated that the differential proteins participated in a total of 60 signaling pathways (Table 4). From these, the top 10 metabolic pathways were dioxin degradation, polycyclic aromatic hydrocarbon degradation, linoleic acid metabolism, betalain biosynthesis, sphingolipid metabolism, mineral absorption, longevity regulating pathway, pentose and glucuronate interconversions, MAPK signaling pathway–yeast, and the mRNA surveillance pathway (Figure S2).

2.5. PRM Verification of DEPs

The PRM assay was applied to validate the selected proteins obtained in the label-free quantitative proteomics analysis. Only proteins that possessed unique peptide sequences were selected for PRM analysis because the signature peptides for target proteins must exhibit uniqueness [17]. Three of the proteins were selected at random for further verification. The PRM results showed that the abundance of nitroreductase family protein (from Metarhizium brunneum, identity 90.4%), cytochrome P450, and monooxygenase changed in a consistent way with the proteomics results (Table 5). In general, three of the candidate proteins detected by PRM had changes consistent with the proteomics results.

3. Discussion

3.1. Effects of MNQ on the Mycelial Growth and Morphology of P. italicum

For a pathogen, a drug may prove fatal depending on the level of drug exposure (time and concentration). Our present study showed that the mycelial growths of P. italicum were decreased in a dose-dependent manner. MNQ treatment significantly reduced the mycelial growth of P. italicum (Table 1). However, microorganisms are extremely adaptable because their lifestyles require the swift phenotypic adaptation with a variety of changing environmental factors [18]. If the pathogenic fungi are not inhibited or killed by drug exposure, its will render the organism less susceptible to drug toxicity because the drug challenge may be met by adaptive responses [19].
Microscopic analyses showed a clear difference between the treatment group and control group mycelia of P. italicum. The MNQ (2.0 μg/mL) treated mycelia were inflated at the growing point. Meanwhile, those mycelia exposed to MNQ treatment were malformation and collapsed. The present study revealed that the prominence of mycelia decreased the mycelia grew, and the changes of mycelia may have been attributed to amplifying membrane permeability. It would result in the swelling of the mycelial tips, collapse of the cell wall, leakage of cell constituents, and, ultimately, mycelia growth was restricted or cell death (Figure 2 and Figure 3). In a word, microscopy observation showed that MNQ resulted in an irregular variation of P. italicum mycelia, which indicates that the inhibitory effect of MNQ on P. italicum could be linked with membrane permeability changes modulated by the membrane lipid composition. Ergosterol is one of the main lipid molecules in the fungi cell membrane. It regulates membrane fluidity, permeability, and the activity of many membrane-bound enzymes [20]. Furthermore, the inhibition on ergosterol synthesis may result in changes of the cell wall structure and morphology [21]. Under the stress of the MNQ, it is more difficult for P. italicum to maintain cell wall integrity or to produce a new cell wall. The change of mycelial morphology suggested that MNQ can play an important role in destroying P. italicum viability.

3.2. Proteins Related to Energy Generation and the NADPH Supply and Other Functions

Proteomics results suggested that MNQ elicited a cellular response and some peculiar mechanisms that were very different between the treatment group and control group due to MNQ exposure is an environmental stress to a pathogen who must raise the response [19]. A fitting response to these adversities that might be caused by MNQ includes physiological and developmental changes, reprogramming of the resistance gene or proteins, the affection of energy generation, and the NADPH supply. Proteomics analysis revealed that MNQ treatment significantly up-regulated four energy generation related proteins including the mitochondrial carrier protein, glycoside hydrolase, acyl-CoA dehydrogenase, and ribulose-phosphate 3-epimerase (Table 2). The results showed that the mitochondrial carrier protein increased by 2.51-fold in the treatment group. The increase of the mitochondrial carrier protein may lead to accelerated material transport, which suggests that the biosynthesis and degradation rate in the mitochondria of cells were accelerated [22] because mitochondria play an important metabolic role in eukaryotes that generate the energy in the form of ATP [23]. In addition, the acyl-CoA dehydrogenase (ACAD) can catalyze α, β-acyl-CoA esters dehydrogenation in the amino acid, and fatty acid catabolism [24]. Both acyl-CoA oxidases and ACAD that is bona fide peroxisomal proteins in fungi are the basic enzymatic repertoire of peroxisomes [25]. The increase of ACAD indicated that fatty acid and amino acid catabolism were active in the treatment group.
Meanwhile, there were five proteins up-regulated including enolase, pyruvate carboxylase, ATP-dependent 6-phosphofructokinase, malate synthase, and phosphoenolpyruvate carboxykinase that play a role in the NADPH supply (Table S1). Enolase, as a significant metabolic intermediate for ATP and NADH production, is a ubiquitous glycolytic enzyme involved in the glycolysis and gluconeogenesis pathways, and it catalyzes the reversible dehydration conversion of 2-phosphoglyceric acid into phosphoenolpyruvate [26]. In our study, the up-regulated enolase may play an important role in energy generation and cell apoptosis. NADPH plays a vital role in fatty acid synthesis. The change of NADPH may affect the cell integrity because phospholipids are the main content factors of the cell membrane [27]. Some of these enzymes including malic enzyme (ME) and 6-phosphogluconate dehydrogenase (6PGDH) also play important roles in generating NADPH/NADH. ME is a primary source of NADPH for de novo lipid biosynthesis and desaturation. Meanwhile, 6PGDH is one of the enzymes that catalyzes reactions generating NADPH in the oxidative pentose phosphate pathway [28]. We found that ME and 6PGDH increased 1.03-fold and 1.15-fold, but the expression difference was not consistent with the significance criteria (Table S1). It is reported that NADPH could prevent oxidative stress in the cell. For example, NADPH reduces glutathione through glutathione reductase because NADPH could convert H2O2 into H2O by glutathione peroxidase. If NADPH is absent, the H2O2 would be converted to hydroxyl-free radicals to attack the cell [27]. NADPH in the P. italicum might increase the fatty acid synthesis and oxidation resistance that may improve the defense during treated MNQ.
The stress condition tends to disrupt cell and organelle membranes and cause an ionic imbalance that stimulates the generation of reactive oxygen species (ROS) [29]. The generation of ROS leads to apoptosis [30]. Previous studies indicated that the antioxidant proteins were the first cellular defense against the oxidative stress. Glutathione transferase and dioxygenases may be related to the response of the fungus to oxidative stress caused by an ROS increase and ATP production [31]. Our proteomics analysis revealed that MNQ treatment up-regulated seven oxidative stress related proteins including catalase (CAT), acyl transferase, glutathione synthetase carboxymuconolactone decarboxylase, tRNA-dihydrouridine (47) synthase [NAD(P)(+)], polyketide synthase, and aldolase-type TIM barrel (Table 2). Antioxidant enzymes such as CAT was up-regulated when exposed to MNQ, which shows its important role in detoxification of ROS. In addition, antioxidant enzymes against ROS, such as peroxidase and alcohol dehydrogenase were also up-regulated, but the expression difference did not meet the significance criteria when exposed to MNQ stress as compared to the control group (Table S1). Glutathione in fungi and some bacteria is an important antioxidant with a capability of preventing damage to important cellular constituents caused by ROS [32]. Glutathione as a substrate, is also contributed to the regeneration of other antioxidants [33]. Glutathione biosynthesis involves two sequential ATP dependent reactions, and is mediated by two enzymes γ-glutamylcysteine synthetase and glutathione synthetase (GS). Energy generation enhanced and GS increased 1.09-fold meant that glutathione increased in the treatment group. We hypothesized that the change of energy generation, NADPH supply, and oxidative stress affected the cell growth and mycelial morphology that was also confirmed by the P. italicum mycelial growth curve and microscopic analyses (Figure 2 and Figure 4).
Among the pentose phosphate pathway (PPP), two enzymes called ribulose-phosphate 3-epimerase (RPE) and xylulose 5-phosphate were up-regulated. RPE can play a vital role in the development of a pool of NADPH, in the PPP that can convert monosaccharides, such as glucose, into the nucleotide precursor of pentose sugars. In addition, RPE can convert the ribulose-5-phosphate into xylulose 5-phosphate in the Calvin cycle [34]. RPE was identified with reversibly oxidized cysteines, which was another enzyme that uses ribulose-5-phosphate as the substrate. We found other published sources that reported the rpe (ribulose phosphate 3-epimerase gene)-disrupted mutant resulted in low cell growth and low inosine production on glucose and on gluconate [35]. Furthermore, RPE was up-regulated significantly, which suggests that PPP was significantly active in the treatment group. This pathway has been suggested as a drug target in trypanosomes [34].
According to the above analysis, we speculated that MNQ inhibited the growth of P. italicum by affecting the generation of energy and NADPH, which, thereby, affects the synthesis of fatty acids and amino acids. Meanwhile, PPP may be the target of MNQ for P. italicum, but the actual situation still needs to be further investigated.

4. Materials and Methods

4.1. Microorganism and Medium

P. italicum was provided by the South China Botanical Garden, Chinese Academy of Sciences (Guangzhou, China). P. italicum was cultured on potato dextrose agar (PDA, potato 200 g/L, agar 20 g/L, and dextrose 20 g/L) or potato dextrose broth (PDB, potato 200 g/L and dextrose 20 g/L).

4.2. MNQ Inhibition of P. italicum

4.2.1. Antifungal Assay

The effects of MNQ on mycelial growth were measured as described by Myresiotis et al. [36]. MNQ was suspended in DMSO and the stock solution of MNQ (10,000 μg/mL) was added to the PDA media (50 mL) contained in conical flasks to obtain the desired concentrations of MNQ (0, 1.0, 2.0, 4.0, and 6.0 μg/mL) in the media. The medium was poured into a set of three Petri dishes (90 mm in diameter) under aseptic conditions. Then the plates were placed under UV light for solidification of the media. Meanwhile, we transferred the mycelia of P. italicum grown on PDA (about 7 days) to PDB in order to obtain conidial suspensions (about 1 × 10⁵ CFU/mL). After that, 1 μL of P. italicum (1 × 10⁵ CFU/mL conidial suspensions) were transferred to the center of the PDA plates. PDA media amended with DMSO (20 μL) was used as the control. Each treatment in the experiment had three replicate plates, and was repeated twice. All cultivations were carried out at 28 °C. The inhibition of mycelial growth rate (%) was calculated using the following formula [37].
I (%) = (C−T) / C × 100%
where C and T were the mean mycelium colony diameters of the control and the treatment and I was the inhibition of the mycelial growth rate (%).

4.2.2. Minimum Inhibitory Concentration (MIC) Tests

The effects of MNQ on P. italicum were performed with a minimum inhibitory concentration (MIC) value [38]. MNQ was tested against P. italicum at different concentrations of 40.0, 20.0, 10.0, 5.0, 2.5, 1.25, 0.625, and 0.3125 μg/mL. The stock solution of MNQ (10,000 μg/mL) was first diluted to the highest concentration (40 μg/mL), and then serial two-fold dilution was made in a concentration range from 40.0 to 0.3125 μg/mL. The solutions poured into 50 mL conical flasks containing melted PDA medium. Then the medium was poured into a set of three Petri dishes (60 mm in diameter) under aseptic conditions. The plates were placed under UV light for solidification of the media. After solidification, 20 μL of conidial suspensions (about 1 × 10⁵ CFU/mL) were then smeared evenly onto the surface of the plates, aseptically. Lastly, all the culture plates were incubated at 28 °C for 48 h. Each treatment had three replicate plates, and the experiment was repeated twice.

4.3. Cell Culture and MNQ Treatment

Two milliliters of the conidial suspensions (about 1 × 10⁵ CFU/mL) were added into a 1000 mL conical flask containing 200 mL of PDB. Then all the cultivations were carried out on a rotary shaker at 140 rpm at 28 °C. After two days of incubation, 40 µL of MNQ stock solution (10,000 μg/mL) was added to the three bottles of cultivations as the treatment group (2 µg/mL of MNQ), aseptically. The cultivations without dosing any MNQ were considered to be the control group. Then, all cultivations were carried out on a rotary shaker at 140 rpm at 28 °C for another 2 days. For the treatment group, 2.0 μg/mL of MNQ was used in this work, and, without dosing, any MNQ was considered to be the control group. Three biological replicates were carried out for each condition. In this cases, sub-MIC doses of MNQ were applied to P. italicum, in order to impose stress to the cells but not induce non-specific effects associated with cell death [15]. The P. italicum mycelia were harvested after four days of cultivation. The mycelia were collected by centrifugation after being washed in three 5-minute steps with 0.1 M PBS (pH 7.4). Part of the mycelia is used for microscopic observation and part of it is used for proteomics analysis.

4.4. Label-Free Quantitative Proteomics

4.4.1. Sample Preparation

The mycelia were obtained through centrifugation at 5000 g for 3 min, and then washed with PBS buffer three times. The cell pellets were suspended on ice in 200 μL of lysis buffer (4% SDS, 100 mM DTT, 150 mM TrisHCl, pH 8.0). Cells were disrupted by a homogenizer agitated (Fastprep-24®, MP Biomedical, USA), and the lysates were boiled for 5 min. The samples were further homogenized using ultra-sonication, and then boiled for another 5 min. Undissolved cellular debris were removed by centrifugation at 14,000 rpm for 15 min and the supernatants were collected for further investigation and quantified with a BCA Protein Assay Kit (Bio-Rad, Hercules, CA, USA).

4.4.2. Protein Digestion

Digestion of protein (250 μg for each sample) was performed according to the FASP procedure [39]. In brief, the detergent, DTT, and low-molecular-weight constituents were removed using a 200 μL UA buffer (8 M Urea, 150 mM Tris-HCl pH 8.0) by repeated ultra-filtration (Microcon units, 30 kDa) facilitated by centrifugation. In order to reduce cysteine residues, 100 μL 0.05 M iodoacetamide added in UA buffer was to block reduced cysteine residues. These samples were incubated in the dark within 20 min. The filter was washed with a 100 μL UA buffer three times and then with a 100 μL 25 mM NH4HCO3 two times. The resulting proteins were digested using 3 μg trypsin (Promega, Madison, WI, USA) in 40 μL 25 mM NH4HCO3 overnight at 37 °C, and the resulting peptides were collected as a filtrate. The peptide content was estimated by a UV light spectral density of 280 nm.

4.4.3. Liquid Chromatography (LC)-Electrospray Ionization (ESI) Tandem MS (MS/MS) Analysis

The peptide in each sample was desalted on C18 Cartridges (Sigma, St. Louis, MO, USA). It was then concentrated by a vacuum centrifugation and was reconstituted in 40 µL of 0.1% (v/v) trifluoroacetic acid. MS experiments were performed on a Q Exactive mass spectrometer coupled to an Easy nLC (ThermoFisher Scientific, Waltham, MA, USA). An aliquot comprising 5 μg peptide was loaded onto a C18-reversed phase column (Thermo Scientific Easy Column, 10 cm long, 75 μm inner diameter, 3 μm resin) in buffer A (2% acetonitrile and 0.1% formic acid) and was separated with a linear gradient of buffer B (80% acetonitrile and 0.1% Formic acid) at a flow rate of 250 nL/min controlled by an IntelliFlow technology over 120 min. A data-dependent top 10 method dynamically choosing the most abundant precursor ions from the survey scan (300–1800 m/z) for HCD fragmentation was carried out to obtain the MS data. Determination of the target value is on the basis of the predictive Automatic Gain Control (pAGC). Each sample was carried out in MS experiments three times.

4.4.4. Sequence Database Searching and Data Analysis

The MS data were searched against the UniProtKB P. italicum database and were analyzed using a MaxQuant software (version 1.3.0.5). An initial search was set at a precursor mass window of 6 ppm. An enzymatic cleavage rule of Trypsin/P and a maximum of two missed cleavage sites were perform in this research. Cysteines carbamidomethylation was defined as fixed modification. Meanwhile, protein N-terminal acetylation and methionine oxidation were defined as variable modifications. The cutoff of global FDR for peptide and protein identification was set to 0.01. Label-free quantification was performed in MaxQuant, as preceding studies reported [40]. Protein abundance was calculated on the basis of the normalized spectral protein intensity (LFQ intensity). The fellow data of the target proteins were retrieved from the UniProtKB database in batches. Each query sequence was retrieved and loaded into Blast2GO (version 2.7.2) for GO annotation and KEGG pathway analysis.
The protein sequences of the DEPs were in batches retrieved in the FASTA format from UniProtKB database. The retrieved sequences were searched from the SwissProt database using the NCBI BLAST+ client software to find homologue sequences from which the functional annotation can be transferred to the studied sequences. The top 10 blast hits in each query sequence with E-value less than 1e−3 were retrieved and loaded into Blast2GO [41] for GO mapping and annotation. An annotation configuration with an E-value filter of 1e−6, default gradual EC weights, a GO weight of 5, and an annotation cutoff of 75 were chosen. The unannotated sequences were then reannotated with more permissive parameters. Then, we used the looser parameters to reannotate the unannotated sequence. Lastly, the unannotated sequences and sequences without BLAST hits were then selected to go through an InterProScan [42] against EBI databases to retrieve functional annotations of protein and merge the InterProScan GO terms to the annotation set. As for the KEGG pathway analysis, the FASTA protein sequences of DEPs were blasted against the online KEGG database (http://geneontology.org/) to retrieve their KOs and were, subsequently, mapped to pathways in KEGG [43].

4.5. Parallel Reaction Monitoring (PRM) Analysis

In order to confirm the protein expression levels identified by label-free quantitative proteomics analysis, we further quantified the expression levels of selected proteins. Based on femtomole peptide/microgram total protein, samples were added with known amounts of each standard to determine the number of respective proteins in the sample. We used parallel reaction monitoring (PRM) to analyzed samples [44,45]. All fragment ions were quantified in the orbitrap after each precursor ion (light and heavy masses) was selected by the fragmented quadrupole [46]. Skyline (MacCoss Lab Software version 3.1) was used for data analysis to estimate peptide signal intensity. According to the ratio of the heavy peptide standards that were added in the known quantity, peptide concentration was calculated. Ion activation/dissociation was acted at a normalized collision energy of 27 in the HCD collision cell [47]. Skyline were used to analyzed the raw data where signal intensities for individual peptide sequences for each of the significantly changed proteins were quantified relative to every sample and normalized to a standard reference.

4.6. Statistical Analysis

Statistical analysis was performed with a one-way ANOVA in Origin 6.1 software. The statistical analysis (Student’s t-test and G-test) was conducted by PepC44 on two conditions: the treatment group and the control group. The DEPs were filtered by the following cutoff: up-regulated > 2.0-fold or down-regulated < 0.5-fold, p < 0.05.

5. Conclusions

Overall, our present investigation revealed that MNQ had a significant anti-P. italicum activity with a MIC value of 5.0 µg/mL. The label-free protein profiling under different MNQ conditions identified a total of 3037 proteins in the control group and the treatment group. Among them, there were 129 DEPs, including 19 up-regulated proteins, 26 down-regulated proteins, and 67 proteins that were specific for the treatment group and another 17 proteins that were specific for the control group. Functional characterization by GO and KEGG enrichment results suggests that the DEPs are mainly related to energy generation, the NADPH supply, oxidative stress, and PPP. The PRM assay confirmed that the expression of the nitroreductase family protein, monooxygenase, and cytochrome P450 are significantly down-regulated in the P. italicum with MNQ treatment. Based on the microscopic observation and the proteomics results mentioned above, we speculated that the proteins associated with energy production, NADPH supply, and other functions in P. italicum were altered to reduce the damage caused by MNQ. Thus, these findings will contribute to further understanding of the possible new molecular action of MNQ against P. italicum.

Supplementary Materials

Supplementary materials can be found at https://www.mdpi.com/1422-0067/20/14/3459/s1. Table S1. The proteins identified in the treatment group and the control group. Figure S1. Effects of MNQ against P. italicum in different concentrations. Figure S2. Top 10 pathway enrichments of the identified DEPs.

Author Contributions

Conceptualization, R.H. and L.H.; methodology, M.G.; X.Z.; R.H.; L.H. and M.L. validation, M.G. and X.D.; formal analysis, D.Z.; investigation, M.G.; X.Z.; T.L. and X.D.; data curation, M.L. and T.L.; writing—original draft preparation, X.Z.; writing—review and editing, M.G.; and funding acquisition, R.H. and L.H.

Funding

The Science and Technology Planning Project of Guangdong Province, Guangzhou Planned Program in Science and Technology, Program of Department of Ocean and Fisheries of Guangdong Province, Natural Science Foundation of Guangdong, Guangdong Provincial Key Laboratory of Applied Botany, South China Botanical Garden, Chinese Academy of Sciences, Finance Special Project of Zhanjiang City, Natural Science Foundation of Guangdong, grant number 2017A020217002, 201803020003, GDME2018C014, 2016A030313151, AB2018004, 2018A01044, and 2018A0303070018, funded this research.

Conflicts of Interest

The authors declare no conflict of interest.

Abbreviations

MNQ2-Methoxy-1,4-naphthoquinone
MICMinimum inhibitory concentration
PRMParallel reaction monitoring
FDRFalse discovery rate
DEPsDifferentially expressed proteins
GO Gene ontology
KEGGKyoto encyclopedia of genes and genomes
BPBiological process
CCCellular component
MFMolecular function
ACADAcyl-CoA dehydrogenase
MEMalic enzyme
6PGDH6-Phosphogluconate dehydrogenase
ROSReactive oxygen species
CATCatalase
GSGlutathione synthetase
PPPPentose phosphate pathway
RPERibulose-phosphate 3-epimerase
KOsProtein number at KEGG database
PDAPotato dextrose agar
PDBPotato dextrose broth
HCDHigher energy dissociation
pAGCPredictive automatic gain control
DMSODimethylsulfoxide
PBSPhosphate buffered saline

References

  1. Rabea, E.I.; Badawy, M.E.I.; Steurbaut, W.; Stevens, C.V. In vitro assessment of N-(benzyl)chitosan derivatives against some plant pathogenic bacteria and fungi. Eur. Polym. J. 2009, 45, 237–245. [Google Scholar] [CrossRef]
  2. Gao, Y.Y.; He, L.F.; Li, X.X.; Lin, J.; Mu, W.; Liu, F. Toxicity and biochemical action of the antibiotic fungicide tetramycin on Colletotrichum scovillei. Pestic. Biochem. Phys. 2018, 147, 51–58. [Google Scholar] [CrossRef] [PubMed]
  3. Chen, C.Y.; Qi, W.W.; Peng, X.; Chen, J.Y.; Wan, C.P. Inhibitory effect of 7-demethoxytylophorine on Penicillium italicum and its possible mechanism. Microorganisms 2019, 7, 36. [Google Scholar] [CrossRef] [PubMed]
  4. Talibi, I.; Boubaker, H.; Boudyach, E.H.; Ben Aoumar, A.A. Alternative methods for the control of postharvest citrus diseases. J. Appl. Microbiol. 2014, 117, 1–17. [Google Scholar] [CrossRef] [PubMed]
  5. Wan, C.P.; Li, P.; Chen, C.Y.; Peng, X.; Li, M.X.; Chen, M.; Wang, J.S.; Chen, J.Y. Antifungal activity of Ramulus cinnamomi explored by 1H-NMR based metabolomics approach. Molecules 2017, 22, 2237. [Google Scholar] [CrossRef] [PubMed]
  6. Tao, N.G.; Jia, L.; Zhou, H.E.; He, X.L. Effect of octanal on the mycelial growth of Penicillium italicum and P-digitatum. World J. Microb. Biot. 2014, 30, 1169–1175. [Google Scholar] [CrossRef]
  7. Tao, N.G.; OuYang, Q.L.; Jia, L. Citral inhibits mycelial growth of Penicillium italicum by a membrane damage mechanism. Food Control 2014, 41, 116–121. [Google Scholar] [CrossRef]
  8. Yang, S.Z.; Zhou, J.; Li, D.M.; Shang, C.Y.; Peng, L.T.; Pan, S.Y. The structure-antifungal activity relationship of 5,7-dihydroxyflavonoids against Penicillium italicum. Food Chem. 2017, 224, 26–31. [Google Scholar] [CrossRef]
  9. Jiang, H.F.; Zhuang, Z.H.; Hou, B.W.; Shi, B.J.; Shu, C.J.; Chen, L.; Shi, G.X.; Zhang, W.M. Adverse effects of hydroalcoholic extracts and the major components in the stems of Impatiens balsamina L. on Caenorhabditis elegans. Evid. Based Complement. Altern. Med. 2017, 2017, 4245830. [Google Scholar] [CrossRef]
  10. Wang, Y.C.; Lin, Y.H. Anti-gastric adenocarcinoma activity of 2-methoxy-1,4-naphthoquinone, an anti-Helicobacter pylori compound from Impatiens balsamina L. Fitoterapia 2012, 83, 1336–1344. [Google Scholar] [CrossRef]
  11. Liew, K.; Yong, P.V.C.; Navaratnam, V.; Lim, Y.M.; Ho, A.S.H. Differential proteomic analysis on the effects of 2-methoxy-1,4-naphthoquinone towards MDA-MB-231 cell line. Phytomedicine 2015, 22, 517–527. [Google Scholar] [CrossRef] [PubMed]
  12. Colwell, C.A.; Mccall, M. Studies on the mechanism of antibacterial action of 2-methyl-1,4-naphthoquinone. Science 1945, 101, 592–594. [Google Scholar] [CrossRef] [PubMed]
  13. Ding, Z.S.; Jiang, F.S.; Chen, N.P.; Lv, G.Y.; Zhu, C.G. Isolation and identification of an anti-tumor component from leaves of Impatiens balsamina. Molecules 2008, 13, 220–229. [Google Scholar] [CrossRef] [PubMed]
  14. Guo, S.C.; Zou, J.; Wang, G.D. Advances in the proteomic discovery of novel therapeutic targets in cancer. Drug Des. Dev. Ther. 2013, 7, 1259–1271. [Google Scholar] [CrossRef] [PubMed]
  15. Liu, X.F.; Pai, P.J.; Zhang, W.P.; Hu, Y.W.; Dong, X.J.; Qian, P.Y.; Chen, D.J.; Lam, H. Proteomic response of methicillin-resistant S. aureus to a synergistic antibacterial drug combination: A novel erythromycin derivative and oxacillin. Sci. Rep. 2016, 6, 19841. [Google Scholar] [CrossRef] [PubMed]
  16. Ashburner, M.; Ball, C.A.; Blake, J.A.; Botstein, D.; Butler, H.; Cherry, J.M.; Davis, A.P.; Dolinski, K.; Dwight, S.S.; Eppig, J.T.; et al. Gene ontology: Tool for the unification of biology. Nat. Genet. 2000, 25, 25–29. [Google Scholar] [CrossRef] [PubMed]
  17. Du, C.; Liu, H.F.; Lin, Y.Z.; Wang, X.F.; Ma, J.; Li, Y.J.; Wang, X.J.; Zhou, J.H. Proteomic alteration of equine monocyte-derived macrophages infected with equine infectious anemia virus. Proteomics 2015, 15, 1843–1858. [Google Scholar] [CrossRef]
  18. Wenzel, M.; Bandow, J.E. Proteomic signatures in antibiotic research. Proteomics 2011, 11, 3256–3268. [Google Scholar] [CrossRef]
  19. Burchmore, R. Mapping pathways to drug resistance with proteomics. Expert Rev. Proteom. 2014, 11, 1–3. [Google Scholar] [CrossRef]
  20. Parveen, M.; Hasan, M.K.; Takahashi, J.; Murata, Y.; Kitagawa, E.; Kodama, O.; Iwahashi, H. Response of Saccharomyces cerevisiae to a monoterpene: Evaluation of antifungal potential by DNA microarray analysis. J. Antimicrob. Chemoth. 2004, 54, 46–55. [Google Scholar] [CrossRef]
  21. Han, Q. Control Effect and mechanism of triazole fungicides folicur and caramba on Fusarium head blight and wheat Stripe Rust. Northwest Sci-Tech Univ. Agric. For. 2003, 96, 1712–1728. [Google Scholar]
  22. Cai, T.T.; Hua, B.X.; Luo, D.W.; Xu, L.R.; Cheng, Q.Y.; Yuan, G.S.; Yan, Z.Q.; Sun, N.; Hua, L.C.; Lu, C. The circadian protein CLOCK regulates cell metabolism via the mitochondrial carrier SLC25A10. Biochim. Biophys. Acta Mol. Cell Res. 2019, 1866, 1310–1321. [Google Scholar] [CrossRef] [PubMed]
  23. Anwar, A.; She, M.Y.; Wang, K.; Riaz, B.; Ye, X.G. Biological roles of ornithine aminotransferase (OAT) in plant stress tolerance: Present progress and future perspectives. Int. J. Mol. Sci. 2018, 19, 3681. [Google Scholar] [CrossRef] [PubMed]
  24. Swigonova, Z.; Mohsen, A.W.; Vockley, J. Acyl-CoA dehydrogenases: Dynamic history of protein family evolution. J. Mol. Evol. 2009, 69, 176–193. [Google Scholar] [CrossRef] [PubMed]
  25. Camoes, F.; Islinger, M.; Guimaraes, S.C.; Kilaru, S.; Schuster, M.; Godinho, L.F.; Steinberg, G.; Schrader, M. New insights into the peroxisomal protein inventory: Acyl-CoA oxidases and -dehydrogenases are an ancient feature of peroxisomes. Biochim. Biophys. Acta Mol. Cell Res. 2015, 1853, 111–125. [Google Scholar] [CrossRef] [Green Version]
  26. Rodriguez, E.; Romaris, F.; Lorenzo, S.; Moreno, J.; Bonay, P.; Ubeira, F.M.; Garate, T. A recombinant enolase from Anisakis simplex is differentially recognized in natural human and mouse experimental infections. Med. Microbiol. Immun. 2006, 195, 1–10. [Google Scholar] [CrossRef] [PubMed]
  27. Ye, C.X.; Wan, F.; Sun, Z.Z.; Cheng, C.H.; Ling, R.Z.; Fan, L.F.; Wang, A.L. Effect of phosphorus supplementation on cell viability, anti-oxidative capacity and comparative proteomic profiles of puffer fish (Takifugu obscurus) under low temperature stress. Aquaculture 2016, 452, 200–208. [Google Scholar] [CrossRef]
  28. Ito, S.; Osanai, T. Single amino acid change in 6-phosphogluconate dehydrogenase from Synechocystis conveys higher affinity for NADP(+) and altered mode of inhibition by NADPH. Plant Cell Physiol. 2018, 59, 2452–2461. [Google Scholar] [CrossRef]
  29. Khan, A.R.; Ullah, I.; Waqas, M.; Shahzad, R.; Hong, S.J.; Park, G.S.; Jung, B.K.; Lee, I.J.; Shin, J.H. Plant growth-promoting potential of endophytic fungi isolated from Solanum nigrum leaves. World J. Microb. Biot. 2015, 31, 1461–1466. [Google Scholar] [CrossRef]
  30. Delgado, J.; Owens, R.A.; Doyle, S.; Asensio, M.A.; Nunez, F. Impact of the antifungal protein PgAFP from Penicillium chrysogenum on the protein profile in Aspergillus flavus. Appl. Microbiol. Biot. 2015, 99, 8701–8715. [Google Scholar] [CrossRef]
  31. Lopez-Moya, F.; Suarez-Fernandez, M.; Lopez-Llorca, L.V. Molecular mechanisms of chitosan interactions with fungi and plants. Int. J. Mol. Sci. 2019, 20, 332. [Google Scholar] [CrossRef] [PubMed]
  32. Pompella, A.; Visvikis, A.; Paolicchi, A.; De Tata, V.; Casini, A.F. The changing faces of glutathione, a cellular protagonist. Biochem. Pharmacol. 2003, 66, 1499–1503. [Google Scholar] [CrossRef]
  33. Khullar, S.; Reddy, M.S. Cadmium and arsenic responses in the ectomycorrhizal fungus Laccaria bicolor: Glutathione metabolism and its role in metal(loid) homeostasis. Environ. Microbiol. Rep. 2019, 11, 53–61. [Google Scholar] [CrossRef] [PubMed]
  34. Lykins, J.D.; Filippova, E.V.; Halavaty, A.S.; Minasov, G.; Zhou, Y.; Dubrovska, I.; Flores, K.J.; Shuvalova, L.A.; Ruan, J.P.; El Bissati, K.; et al. CSGID solves structures and identifies phenotypes for five enzymes in Toxoplasma gondii. Front Cell Infect. Microbiol. 2018, 8, 352. [Google Scholar] [CrossRef] [PubMed]
  35. Shimaoka, M.; Kawasaki, H.; Takenaka, Y.; Kurahashi, O.; Matsui, H. Effects of edd and pgi disruptions on inosine accumulation in Escherichia coli. Biosci. Biotechnol. Biochem. 2005, 69, 1248–1255. [Google Scholar] [CrossRef] [PubMed]
  36. Myresiotis, C.K.; Karaoglanidis, G.S.; Tzavella-Monari, K. Resistance of Botrytis cinerea isolates from vegetable crops to anilinopyrimidine, phenylpyrrole, hydroxyanilide, benzimidazole, and dicarboximide fungicides. Plant Dis. 2007, 91, 407–413. [Google Scholar] [CrossRef] [PubMed]
  37. Agarwal, M.; Walia, S.; Dhingra, S.; Khambay, B.P. Insect growth inhibition, antifeedant and antifungal activity of compounds isolated/derived from Zingiber offcinale Roscoe (ginger) rhizomes. Pest Manag. Sci. 2001, 57, 289–300. [Google Scholar] [CrossRef]
  38. Xing, C.; Qin, C.Q.; Li, X.Q.; Zhang, F.M.; Linhardt, R.J.; Sun, P.L.; Zhang, A.Q. Chemical composition and biological activities of essential oil isolated by HS-SPME and UAHD from fruits of bergamot. LWT Food Sci. Technol. 2019, 104, 38–44. [Google Scholar] [CrossRef]
  39. Wisniewski, J.R.; Zougman, A.; Nagaraj, N.; Mann, M. Universal sample preparation method for proteome analysis. Nat. Methods 2009, 6, 359–360. [Google Scholar] [CrossRef]
  40. Luber, C.A.; Cox, J.; Lauterbach, H.; Fancke, B.; Selbach, M.; Tschopp, J.; Akira, S.; Wiegand, M.; Hochrein, H.; O'Keeffe, M.; et al. Quantitative proteomics reveals subset-specific viral recognition in dendritic cells. Immunity 2010, 32, 279–289. [Google Scholar] [CrossRef]
  41. Gotz, S.; Garcia-Gomez, J.M.; Terol, J.; Williams, T.D.; Nagaraj, S.H.; Nueda, M.J.; Robles, M.; Talon, M.; Dopazo, J.; Conesa, A. High-throughput functional annotation and data mining with the Blast2GO suite. Nucleic Acids Res. 2008, 36, 3420–3435. [Google Scholar] [CrossRef] [PubMed]
  42. Quevillon, E.; Silventoinen, V.; Pillai, S.; Harte, N.; Mulder, N.; Apweiler, R.; Lopez, R. InterProScan: Protein domains identifier. Nucleic Acids Res. 2005, 33, 116–120. [Google Scholar] [CrossRef] [PubMed]
  43. Kanehisa, M.; Goto, S.; Sato, Y.; Furumichi, M.; Tanabe, M. KEGG for integration and interpretation of large-scale molecular data sets. Nucleic Acids Res. 2012, 40, 109–114. [Google Scholar] [CrossRef] [PubMed]
  44. Saito, M.A.; Bertrand, E.M.; Dutkiewicz, S.; Bulygin, V.V.; Moran, D.M.; Monteiro, F.M.; Follows, M.J.; Valois, F.W.; Waterbury, J.B. Iron conservation by reduction of metalloenzyme inventories in the marine diazotroph Crocosphaera watsonii. Proc. Natl. Acad. Sci. USA 2011, 108, 2184–2189. [Google Scholar] [CrossRef] [PubMed]
  45. Lange, V.; Malmstrom, J.A.; Didion, J.; King, N.L.; Johansson, B.P.; Schafer, J.; Rameseder, J.; Wong, C.H.; Deutsch, E.W.; Brusniak, M.Y.; et al. Targeted quantitative analysis of Streptococcus pyogenes virulence factors by multiple reaction monitoring. Mol. Cell. Proteom. 2008, 7, 1489–1500. [Google Scholar] [CrossRef] [PubMed]
  46. Gallien, S.; Duriez, E.; Crone, C.; Kellmann, M.; Moehring, T.; Domon, B. Targeted proteomic quantification on quadrupole-orbitrap mass spectrometer. Mol. Cell. Proteom. 2012, 11, 1709–1723. [Google Scholar] [CrossRef] [PubMed]
  47. MacLean, B.; Tomazela, D.M.; Shulman, N.; Chambers, M.; Finney, G.L.; Frewen, B.; Kern, R.; Tabb, D.L.; Liebler, D.C.; MacCoss, M.J. Skyline: An open source document editor for creating and analyzing targeted proteomics experiments. Bioinformatics 2010, 26, 966–968. [Google Scholar] [CrossRef]
Figure 1. 2-Methoxy-1,4-naphthoquinone (MNQ).
Ijms 20 03459 g001
Figure 2. Inhibition of mycelial growth of P. italicum by MNQ.
Ijms 20 03459 g002
Figure 3. Light microscopy observation of P. italicum mycelial morphology (96 h). (a) P. italicum in the control group, (b) and (c) P. italicum in the treatment group (magnification is 400 times).
Ijms 20 03459 g003
Figure 4. DEPs in different groups. (a) Volcano plot of DEPs, I-T was the treatment group. I-C was the control group. (b) Venn diagram of proteins in different groups.
Ijms 20 03459 g004
Figure 5. Hierarchical cluster analysis was conducted for all the DEPs. I-T was the treatment group. I-C was the control group. The numbers were the protein ID and could search in Table S1.
Ijms 20 03459 g005
Figure 6. Statistical results of different functional annotations.
Ijms 20 03459 g006
Figure 7. GO annotation for the DEPs.
Ijms 20 03459 g007aIjms 20 03459 g007b
Table 1. Effect of different MNQ concentrations on mycelial growth of P. italicum 1.
Concentration (μg/mL)Mycelial Diameter (mm)I (%)
CK33.83 ± 0.54 a--
0.032.67 ± 0.56 a3.45 ± 1.65 c
1.030.83 ± 0.54 a8.87 ± 1.60 c
2.017.33 ± 2.30 b48.77 ± 6.81 b
4.02.33 ± 0.80 c93.10 ± 2.37 a
6.00.83 ± 0.17 c97.54 ± 0.49 a
1 Mycelial growth was measured after incubation at 28 °C for seven days. The date presented are the means ± S.E. (n = 6). a–c The column with different lowercase letters between different concentrations indicates significant differences, according to Duncan’s test (p < 0.05).
Table 2. The DEPs in different groups.
ProteinProtein NameGene NameFold Changes 1GO Category 2
A0A0A2KI00Uncharacterized proteinPITC_0135309.66MF
A0A0A2KQ56Uncharacterized proteinPITC_0174405.80
A0A0A2LA04Ribulose-phosphate 3-epimerasePITC_0118003.84BP, MF
A0A0A2KBU2HydrophobinPITC_0156003.83MF, CC
A0A0A2KT64Uncharacterized proteinPITC_0654803.15
A0A0A2KL24Uncharacterized proteinPITC_0640102.99
A0A0A2LAT4Uncharacterized proteinPITC_0373402.79
A0A0A2KR85Uncharacterized proteinPITC_0141802.76
A0A0A2KVZ5Uncharacterized proteinPITC_0285002.72
A0A0A2KMP8Uncharacterized proteinPITC_0174002.67
A0A0A2L522Mitochondrial carrier proteinPITC_0382102.51MF, CC
A0A0A2KX25Uncharacterized proteinPITC_0513602.37
A0A0A2L8T3Uncharacterized proteinPITC_0986402.32
A0A0A2L2N9HEAT, type 2PITC_0851602.10
A0A0A2L2V7Acyl-CoA dehydrogenase, N-terminalPITC_0661602.10MF
A0A0A2LCB9Glycoside hydrolase, family 28PITC_0050002.10BP, MF, CC
A0A0A2LAG1Xylulose 5-phosphate/Fructose 6-phosphate phosphoketolase, N-terminalPITC_0038502.10BP, MF
A0A0A2L8I5Glucose-repressible protein Grg1PITC_0615802.05
A0A0A2L934Polyketide synthase, enoylreductasePITC_0304002.04MF
A0A0A2LBT9CDR ABC transporterPITC_0916400.49MF, CC
A0A0A2KM09ATPase, AAA-type, corePITC_0288500.48MF
A0A0A2KZ16Mandelate racemase/muconate lactonizing enzymePITC_0981500.48BP, MF
A0A0A2KNF6Cytochrome P450PITC_0650800.47BP, MF
A0A0A2LD14Short-chain dehydrogenase/reductase SDRPITC_0068400.46
A0A0A2LAZ8Uncharacterized proteinPITC_0235600.45CC
A0A0A2KLM8Aldo/keto reductasePITC_0489200.43MF
A0A0A2L925ABC transporter, integral membrane type 1PITC_0302500.41MF, CC
A0A0A2L7S7Reverse transcriptasePITC_0110600.38MF
A0A0A2L743Uncharacterized proteinPITC_0322400.35MF
A0A0A2KIE8Male sterility, NAD-bindingPITC_0561100.34MF
A0A0A2LCN6Short-chain dehydrogenase/reductase SDRPITC_0191300.31
A0A0A2LGP0Carbon-nitrogen hydrolasePITC_0298700.30BP, MF
A0A0A2KZU8Peptidase M20PITC_0862500.23MF
A0A0A2LFP8O-methyltransferase, family 3PITC_0254400.21MF
A0A0A2L830ThiJ/PfpIPITC_0016800.14
A0A0A2L1V6N-acyl-phosphatidylethanolamine-hydrolyzing phospholipase DPITC_0518900.12MF
A0A0A2LCF5Acyl-transferase/acyl-hydrolase/lysophospholipasePITC_0053500.08MF
A0A0A2L5Z5Uncharacterized proteinPITC_0024800.08
A0A0A2L3A1Uncharacterized proteinPITC_0383100.07
A0A0A2LCE5Uncharacterized proteinPITC_0052500.06
A0A0A2LAC2Uncharacterized proteinPITC_0053600.04
A0A0A2LKC5Monooxygenase, FAD-bindingPITC_0053700.03MF, CC
A0A0A2L9W9Uncharacterized proteinPITC_0053900.03BP, MF
A0A0A2KD20Uncharacterized proteinPITC_0081800.03BP, MF
A0A0A2LCH9Uncharacterized proteinPITC_0052800.03
A0A0A2LEG0E3 ubiquitin protein ligasePITC_068020+BP, MF, CC
A0A0A2KL74Uncharacterized proteinPITC_064410+
A0A0A2L3H1Kinetochore-Ndc80 subunit Spc24PITC_084180+
A0A0A2LNS4Zinc finger, RING-typePITC_024830+MF
A0A0A2KNZ0Translation elongation factor EF1B/ribosomal protein S6PITC_014590+MF, CC
A0A0A2KWT6Ribosome-releasing factor 2, mitochondrialMEF2+BP, MF, CC
A0A0A2LC54Peptidase C19, ubiquitin carboxyl-terminal hydrolase 2PITC_059690+BP, MF
A0A0A2LG71Pectin lyase fold/virulence factorPITC_050450+MF
A0A0A2L5T7Uncharacterized proteinPITC_001930+BP
A0A0A2K9T6Uncharacterized conserved protein UCP022603PITC_093160+
A0A0A2K9G7Glycoside hydrolase, superfamilyPITC_049080+BP, MF
A0A0A2LF07CheY-like superfamilyPITC_061050+MF
A0A0A2LN85Taxilin familyPITC_010570+MF
A0A0A2KY31Beta-glucosidasePITC_028190+BP, MF
A0A0A2KE07Chromatin-remodeling complex, RSC SWI/SNF subunit Rsc7/Swp82PITC_055960+
A0A0A2LB02RNA polymerase II subunit APITC_092370+BP, MF, CC
A0A0A2L857Transcription factor, MADS-boxPITC_001660+BP, MF, CC
A0A0A2L6J4Neurolysin/Thimet oligopeptidase, N-terminalPITC_084000+BP, MF, CC
A0A0A2KT14Monopolin complex, subunit Csm1/Pcs1PITC_066000+
A0A0A2LE82Uncharacterized proteinPITC_037500+
A0A0A2LBD7Sof1-like proteinPITC_089150+
A0A0A2L5N2Striatin, N-terminalPITC_021600+
A0A0A2L4U0tRNA-dihydrouridine(47)synthase
[NAD(P)(+)]
PITC_047170+MF
A0A0A2L4G7Phosphatidylserine decarboxylase proenzyme 1, mitochondrialPSD1+BP, MF, CC
A0A0A2KS93BolA proteinPITC_042910+
A0A0A2LEA3Uncharacterized proteinPITC_034190+
A0A0A2KWV6Sensitivity to Red Light Reduced-like, SRR1PITC_077860+
A0A0A2L4C5Poly(A) polymerasePITC_097130+BP, MF, CC
A0A0A2L1S8Heme-containing dehydratasePITC_040090+
A0A0A2L7N4Winged helix-turn-helix transcription repressor DNA-bindingPITC_006550+BP, MF, CC
A0A0A2KI48Aldolase-type TIM barrelPITC_009330+MF
A0A0A2KWA6Putative domain, di-copper centerPITC_096580+MF
A0A0A2LFQ2Uncharacterized proteinPITC_025560+CC
A0A0A2LAP4Uncharacterized proteinPITC_036940+
A0A0A2KHA2DNA polymerase III, clamp loader complex, gamma/delta/delta subunit, C-terminalPITC_071920+BP, MF
A0A0A2LFW6Catalase, mono-functional, heme-containingPITC_041140+BP, MF
A0A0A2L4V0Sas10/Utp3/C1DPITC_084500+
A0A0A2KMY7PfkBPITC_046750+
A0A0A2L452Blastomyces yeast-phase-specific proteinPITC_083580+
A0A0A2LFY2Outer membrane protein, IML2, mitochondrial/Tetratricopeptide repeat protein 39PITC_041270+CC
A0A0A2L4F0Vacuolar protein sorting-associated protein 28PITC_032200+BP, CC
A0A0A2KNJ7FerritinPITC_095310+BP, MF, CC
A0A0A2KCE3Uncharacterized proteinPITC_093200+
A0A0A2L328CheY-like superfamilyPITC_099880+BP, MF
A0A0A2KWF5Ribosomal protein L53, mitochondrialPITC_063020+CC
A0A0A2LGC1Uncharacterized proteinPITC_036010+
A0A0A2KAJ2Sec1-like proteinPITC_055020+BP, CC
A0A0A2KLU4H/ACA ribonucleoprotein complex, subunit Nop10PITC_015880+BP, MF
A0A0A2LB80Uncharacterized proteinPITC_088770+MF
A0A0A2L283Vacuole morphology and inheritance protein 14PITC_085800+BP, CC
A0A0A2LJG8Uncharacterized proteinPITC_091330+
A0A0A2LDT3Scytalone dehydratasePITC_055360+BP, MF
A0A0A2KPK9Alpha/gamma-adaptin-binding protein p34PITC_045290+
A0A0A2LF46Glutamyl-tRNA(Gln) amido-transferase subunit B, mitochondrialPITC_061230+BP, MF, CC
A0A0A2LDQ9Uncharacterized proteinPITC_055380+
A0A0A2KLL9Acyl-transferase/acyl-hydrolase/lysophospholipasePITC_048820+MF
A0A0A2KPR9Uncharacterized proteinPITC_054110+CC
A0A0A2KYQ5Magnesium transporterPITC_061420+CC
A0A0A2KM68Uncharacterized proteinPITC_079240+
A0A0A2LE28Carboxymuconolactone decarboxylasePITC_044010+MF
A0A0A2LBC3Uncharacterized proteinPITC_016760+
A0A0A2LPW9Uncharacterized proteinPITC_059180+
A0A0A2KYR5Uncharacterized proteinPITC_014450+
A0A0A2KPB6Exon junction complex, PymPITC_045720+BP
A0A0A2L3C0Uncharacterized proteinPITC_002320+
A0A0A2LDR6Translation Initiation factor eIF-4ePITC_055210+MF, CC
A0A0A2L3Q9Uncharacterized proteinPITC_035540+
A0A0A2K7Z3RTA-like proteinPITC_013070--CC
A0A0A2K9K0Uncharacterized proteinPITC_049430--CC
A0A0A2KC81Zinc finger, CCCH-typePITC_079160--MF
A0A0A2KRX9FAD dependent oxidoreductasePITC_020210--MF
A0A0A2KTM9AP-3 complex subunit deltaPITC_064680--BP, CC
A0A0A2KTQ5TRAM1-like proteinPITC_000730--CC
A0A0A2KY77MAP kinasePITC_057580--BP, MF, CC
A0A0A2L001Uncharacterized proteinPITC_075040--MF, CC
A0A0A2L1F3Membrane-associated, eicosanoid/glutathione metabolism protein (MAPEG)PITC_035700--CC
A0A0A2L3U6Uncharacterized proteinPITC_083660--MF
A0A0A2L4J0RNA recognition motif domain, eukaryotePITC_097790--BP, MF, CC
A0A0A2L843Serine hydrolase FSHPITC_001510--MF
A0A0A2L8X0Glutamyl-tRNA synthetase, class Ib, archaeal/eukaryotic cytosolicPITC_073010--BP, MF, CC
A0A0A2L929Acyl-CoA dehydrogenase, N-terminalPITC_030080--MF
A0A0A2L9E5Major facilitator superfamily domain, general substrate transporterPITC_090610--BP, CC
A0A0A2LCH4Major facilitator superfamily domain, general substrate transporterPITC_004620--MF, CC
A0A0A2LEL6Tetratricopeptide-like helicalPITC_067660--MF
1 Up-regulated proteins are highlighted in red. Down-regulated proteins are highlighted in green. “+” stands for only detected in treatment group and “--” stands for only detected in the control group. 2 BP was biological process, MF was molecular function, CC was cellular component.
Table 3. Numbers of DEPs in the treatment group compared with the control group.
ComparisonsNumber of Involved Proteins
IncreasedDecreased
Significantly changing in abundance1926
Newly arising/undetectable 16717
1 The proteins newly arising/undetectable in the treatment group were also treated as significantly up-regulated/down-regulated.
Table 4. Pathways encompassed by the DEPs 1.
Pathway Protein Name
Dioxin degradationMonooxygenase, FAD-binding
Polycyclic aromatic hydrocarbon degradationMonooxygenase, FAD-binding
Linoleic acid metabolismCytochrome P450
Betalain biosynthesisPutative domain, di-copper center
Sphingolipid metabolismTRAM1-like protein
Mineral absorptionFerritin
Longevity regulating pathwayCatalase, mono-functional, heme-containing
Translation Initiation factor eIF-4e
Pentose and glucuronate interconversionsRibulose-phosphate 3-epimerase
Glycoside hydrolase, family 28
MAPK signaling pathway - yeastTranscription factor, MADS-box;
Catalase, mono-functional, heme-containing;
MAP kinase
mRNA surveillance pathwayRNA polymerase II subunit A;
Poly(A) polymerase;
Exon junction complex, Pym
Carbon fixation in photosynthetic organismsRibulose-phosphate 3-epimerase;
Xylulose 5-phosphate/Fructose 6-phosphate phosphoketolase, N-terminal
Pentose phosphate pathwayRibulose-phosphate 3-epimerase;
Xylulose 5-phosphate/Fructose 6-phosphate phosphoketolase, N-terminal
Phenylpropanoid biosynthesisBeta-glucosidase
Naphthalene degradationMonooxygenase, FAD-binding
MAPK signaling pathway - plantCatalase, mono-functional, heme-containing
Chemical carcinogenesisMembrane-associated, eicosanoid/glutathione metabolism (MAPEG) protein
Mismatch repairDNA polymerase III, clamp loader complex, gamma/delta/delta subunit, C-terminal
FerroptosisFerritin
Isoquinoline alkaloid biosynthesisPutative domain, di-copper center
Cyanoamino acid metabolismBeta-glucosidase
EGFR tyrosine kinase inhibitor resistanceTranslation Initiation factor eIF-4e
Drug metabolism - cytochrome P450Membrane-associated, eicosanoid/glutathione metabolism (MAPEG) protein
Amyotrophic lateral sclerosis (ALS)Catalase, mono-functional, heme-containing
DNA replicationDNA polymerase III, clamp loader complex, gamma/delta/delta subunit, C-terminal
Metabolism of xenobiotics by cytochrome P450Membrane-associated, eicosanoid/glutathione metabolism (MAPEG) protein
MelanogenesisPutative domain, di-copper centre
Platinum drug resistanceMembrane-associated, eicosanoid/glutathione metabolism (MAPEG) protein
Galactose metabolismMandelate racemase/muconate lactonizing enzyme
Two-component systemMAP kinase
MAPK signaling pathway - flyStriatin, N-terminal
Nucleotide excision repairDNA polymerase III, clamp loader complex, gamma/delta/delta subunit, C-terminal
HIF-1 signaling pathwayTranslation Initiation factor eIF-4e
Hepatocellular carcinomaMembrane-associated, eicosanoid/glutathione metabolism (MAPEG) protein
LysosomeAP-3 complex subunit delta
FoxO signaling pathwayCatalase, mono-functional, heme-containing
Fluid shear stress and atherosclerosisMembrane-associated, eicosanoid/glutathione metabolism (MAPEG) protein
Longevity regulating pathway - wormCatalase, mono-functional, heme-containing
Drug metabolism - other enzymesMembrane-associated, eicosanoid/glutathione metabolism (MAPEG) protein
NecroptosisFerritin
Longevity regulating pathway–multiple speciesCatalase, mono-functional, heme-containing
Human T-cell leukemia virus 1 infectionVacuole morphology and inheritance protein 14
Glutathione metabolismMembrane-associated, eicosanoid/glutathione metabolism (MAPEG) protein
Tyrosine metabolismPutative domain, di-copper center
Tryptophan metabolismCatalase, mono-functional, heme-containing
PeroxisomeCatalase, mono-functional, heme-containing
Glycerophospholipid metabolismPhosphatidylserine decarboxylase proenzyme 1, mitochondrial
Ribosome biogenesis in eukaryotesHEAT, type 2,H/ACA ribonucleoprotein complex, subunit Nop10
Insulin signaling pathwayTranslation Initiation factor eIF-4e
Starch and sucrose metabolismBeta-glucosidase
PI3K-Akt signaling pathwayTranslation Initiation factor eIF-4e
mTOR signaling pathwayTranslation Initiation factor eIF-4e
Viral carcinogenesisVacuole morphology and inheritance protein 14
Pathways in cancerMembrane-associated, eicosanoid/glutathione metabolism (MAPEG) protein
Amino sugar and nucleotide sugar metabolismGlycoside hydrolase, superfamily
Glyoxylate and dicarboxylate metabolismCatalase, mono-functional, heme-containing
Aminoacyl-tRNA biosynthesisGlutamyl-tRNA(Gln) amidotransferase subunit B, mitochondrial
RNA transportExon junction complex, Pym;
Translation Initiation factor eIF-4e
Autophagy–yeastSec1-like protein
EndocytosisVacuolar protein sorting-associated protein 28
SpliceosomeUncharacterized protein
1 Up-regulated proteins are highlighted in red. Down-regulated proteins are highlighted in green.
Table 5. Comparison of the proteomics result and the PRM result of the three candidate proteins.
Protein NameGene NameSignature PeptidesProteomics Result 1PRM Result 2
Nitro-reductase family protein 3PITC_008180LGPLLQSHK
SISPALWEK
0.030.05
Cytochrome P450PITC_065080AVLSDAVALVR0.470.35
MonooxygenasePITC_005370GALEEALQTYSGVR
QLENYDEVDDK
SDANTSNAYWNGFHPR
0.030.16
1 Fold changes of protein abundance in proteomics result. Down-regulated proteins are highlighted in green. 2 Fold changes of protein abundance in PRM result. 3 Nitroreductase family protein (from Metarhizium brunneum, 90.4%).

