1. Introduction
Advanced prenatal screening is an important part of obstetric care. Current methods of prenatal testing, such as amniocentesis and chorionic villus sampling, involve invasive sampling of fetal material and are associated with a risk of miscarriage [
1]. Non-invasive prenatal testing based on fetal DNA analysis from maternal circulation have been developed in order to prevent such risk. In 1997, the discovery of fetal cell-free DNA (cfDNA) in maternal plasma and serum has led to new developments in the field of non-invasive prenatal diagnostic, opening up new options in the field of obstetric research [
2]. The fetal cfDNA is of placental origin [
3], and it can be reliably detected from fifth week of gestation [
4]. On average, fetal cfDNA comprises about 10% of all cfDNA fragments circulating in woman’s blood when sampling is done between 10 and 20 gestational weeks, but the dispersion is quite large [
5]. The advance of massively parallel sequencing technologies combined with the rapid development of bioinformatic algorithms and tools brought about a new era of non-invasive prenatal identification of common fetal aneuploidies, now commonly known as non-invasive prenatal testing (NIPT) [
6,
7,
8,
9,
10].
In this paper, we focus on the last part of the NIPT analysis, when a sample already underwent laboratory preparation, sequencing, and processing of the data (e.g., mapping, GC correction, etc.), namely the interpretation of the resulting data. Traditionally, a z-score—also termed normalized chromosomal value (NCV)—is used as a form of probabilistic measure of aneuploidies such as trisomies T13, T18, and T21. The form of this test is, there is a proportion of sequenced fragments from observed chromosome, and with them are the mean and standard deviation of the same value in a control population of euploid samples, respectively [
11,
12,
13,
14]; while the method proposed by [
13] appears to be the best performing among the methods of this type. Model parameters and are typically trained on a euploid population. While this is sufficient for the samples that have similar depth of sequencing, we show that false positive (FP) and false negative (FN) calls may arise, if the tested sample differs in the sequencing depth from the training set. As it is now common to offer NIPT tests in various price ranges, the sequencing depth is what is usually scaled down in the cheaper tests. A possible but less practical solution to this would be to have multiple training sets for various sequencing depths.
In this paper, we propose a mathematical formula for calculation of model parameters, and, adaptively according to the actual sequencing depth of the diagnosed sample. Although the proposed model requires some parameters to be estimated or trained from the euploid or normal population, we show that these parameters are independent of the tested sample sequencing depth and can be estimated from training samples with relatively shallow sequencing depth.
2. Results
2.1. Low Coverage in Training Samples Leads to Underestimation of Z-Score in High Coverage Samples
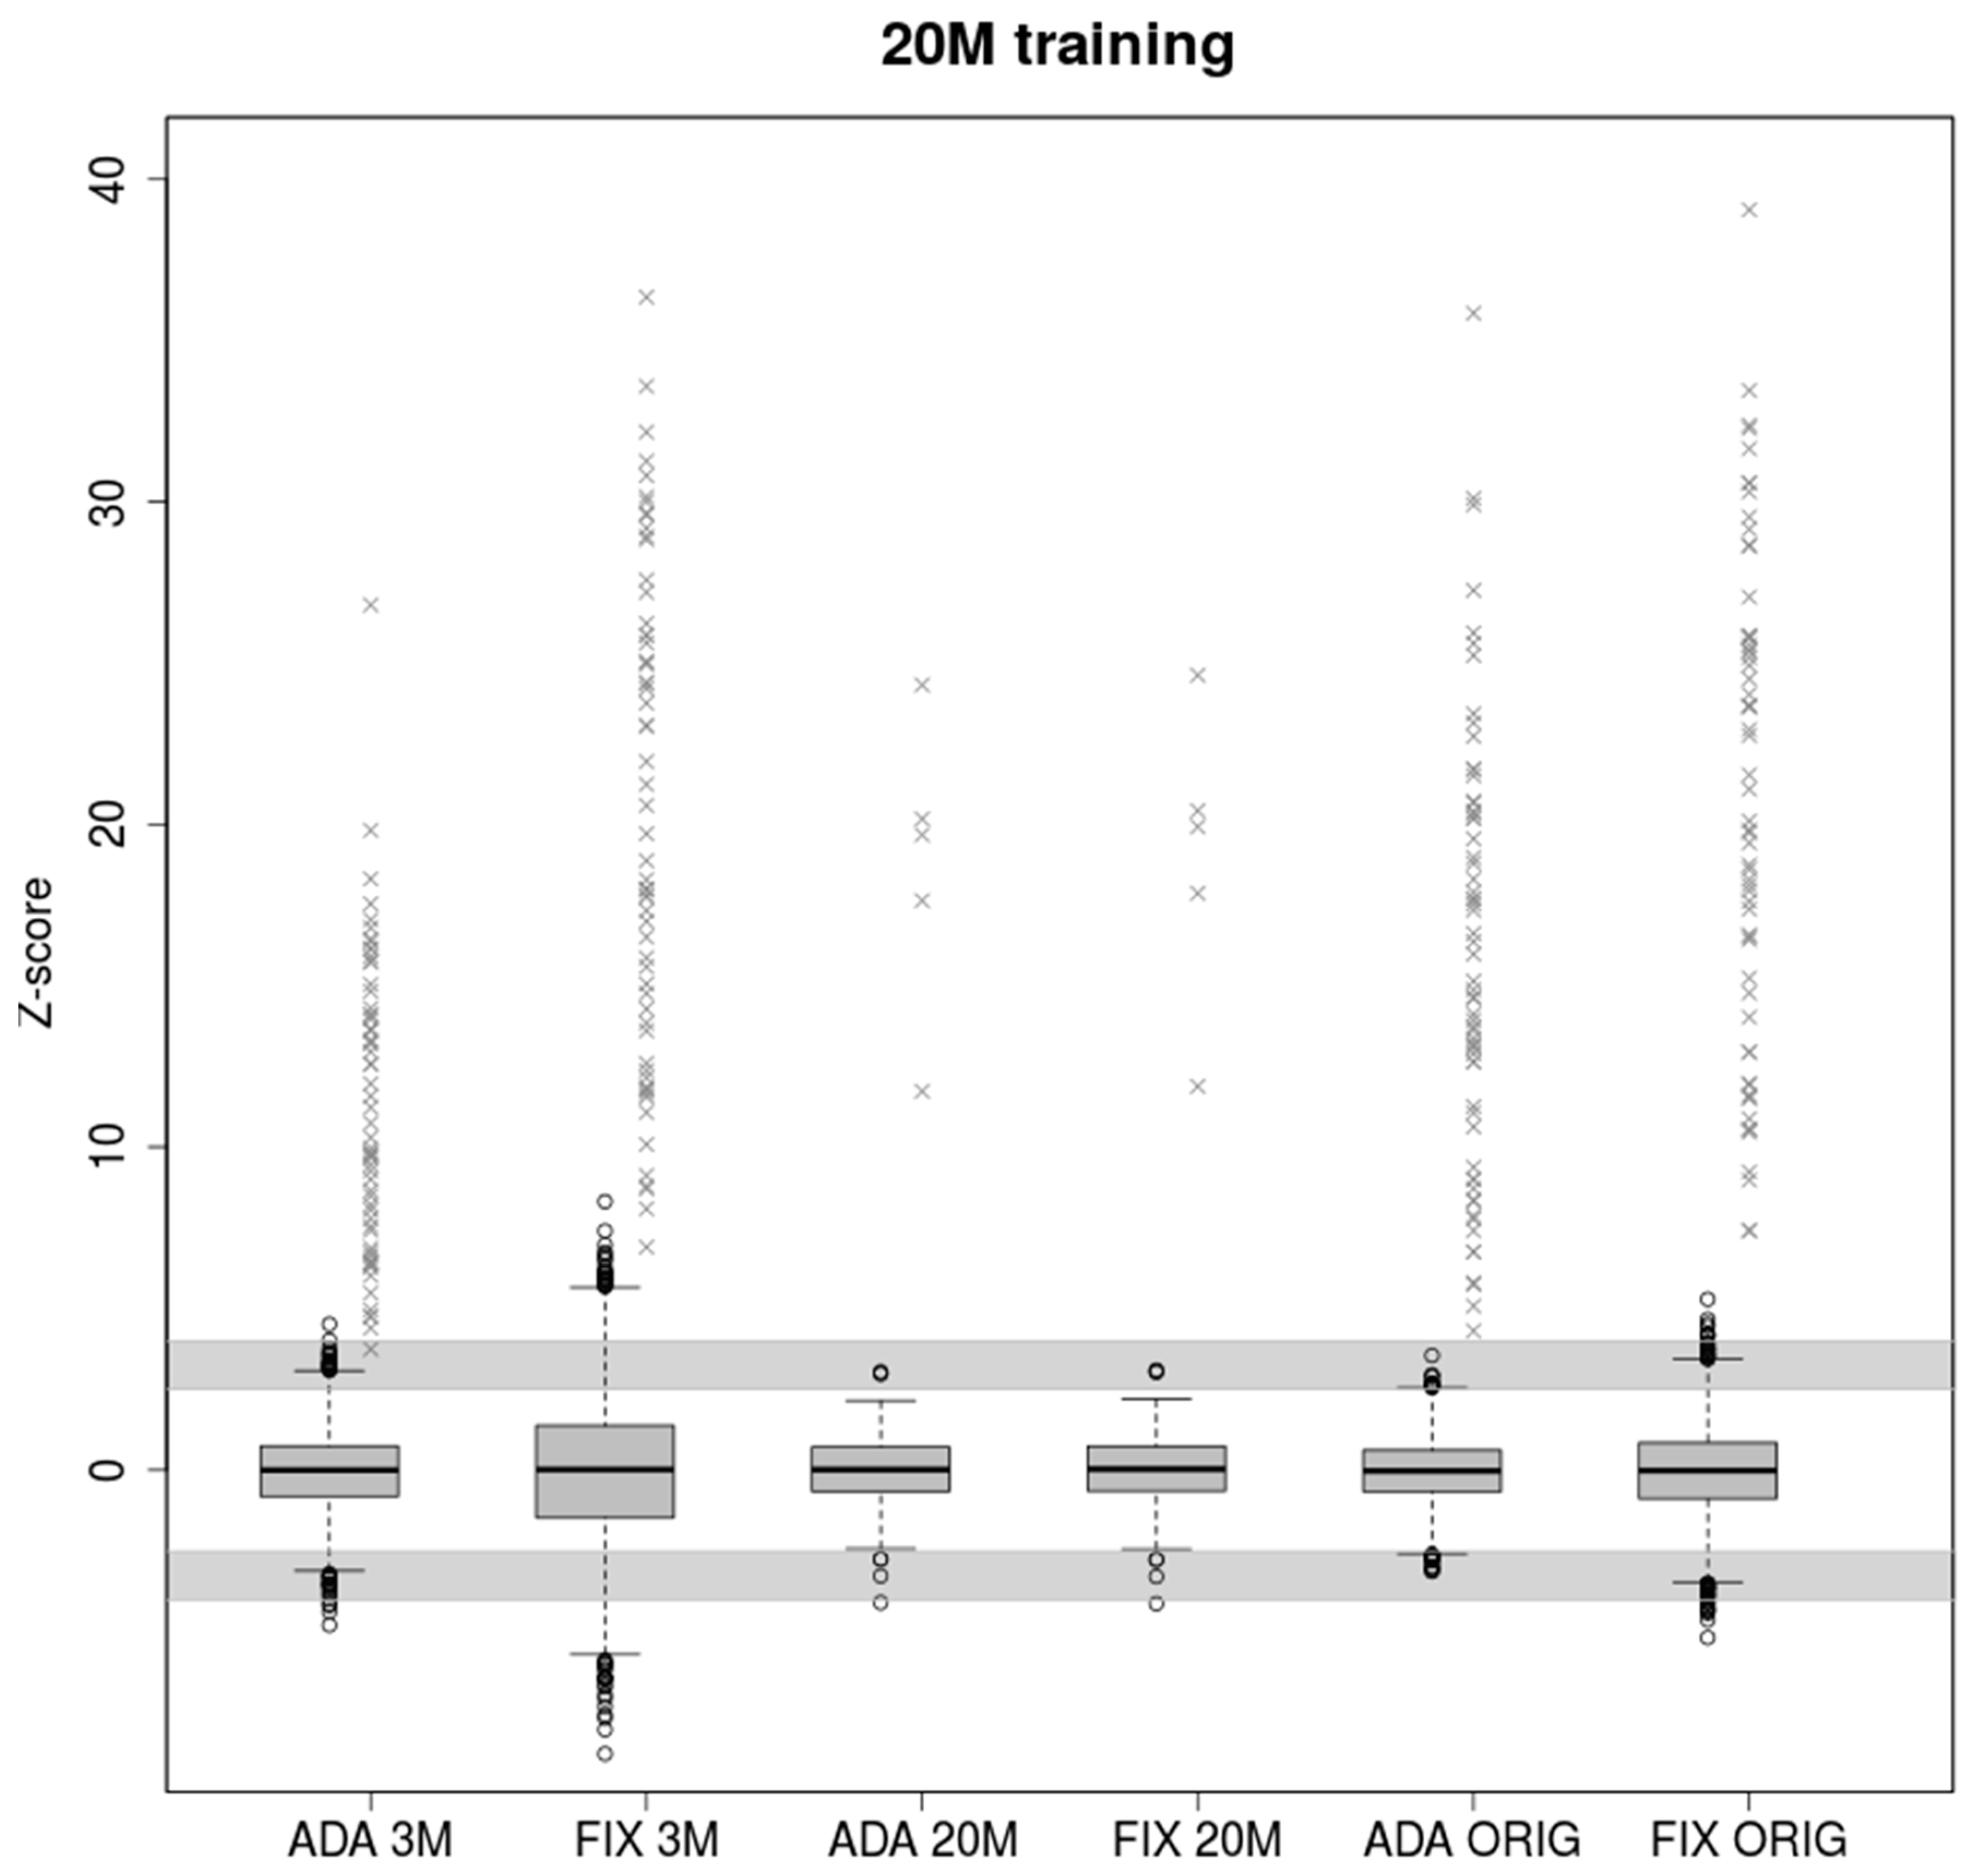
A lower number of reads leads to greater variability of observed chromosomal proportions between samples compared to deeply sequenced samples (
Figure 1). The z-score is then lower in general, resulting in uninformative calls falling into the grey zone given by intervals (−4, −2.5) and (2.5, 4). Both models performed similarly when trained and tested on the samples with the same coverage (3M reads). 2840 euploid samples were tested, of which 39 and 42 fell into grey zone for ADAVAR (Adaptive Variance) and FIXVAR (Fixed Variance) models, respectively.
Parameters trained on low coverage samples naturally cannot fit deeply covered samples. The adaptively calculated standard deviation (SD) therefore performed markedly better in cases with a great difference between training and testing set. In the case of ADAVAR model, one euploid and none of the trisomic samples fell into a grey zone. At the hands of FIXVAR model, two trisomic and none of the euploid samples fell into a grey zone. We observed 1.44× higher z-score (p = 7.431 × 10⁻⁷) for ADAVAR model when trisomic sample were compared. Relatively higher variability of low coverage 3M samples thus leads to needless under-estimation of the z-scores in case of fixed model parameters.
We observed similar effect on real life samples with uneven coverage. Although all euploid samples were classified correctly in both methods, the z-scores of trisomic samples were significantly higher (1.24×, p = 0.0035) for the ADAVAR model.
2.2. High Coverage in Training Data Set Leads to Overestimation of Z-Score in Low Coverage Samples
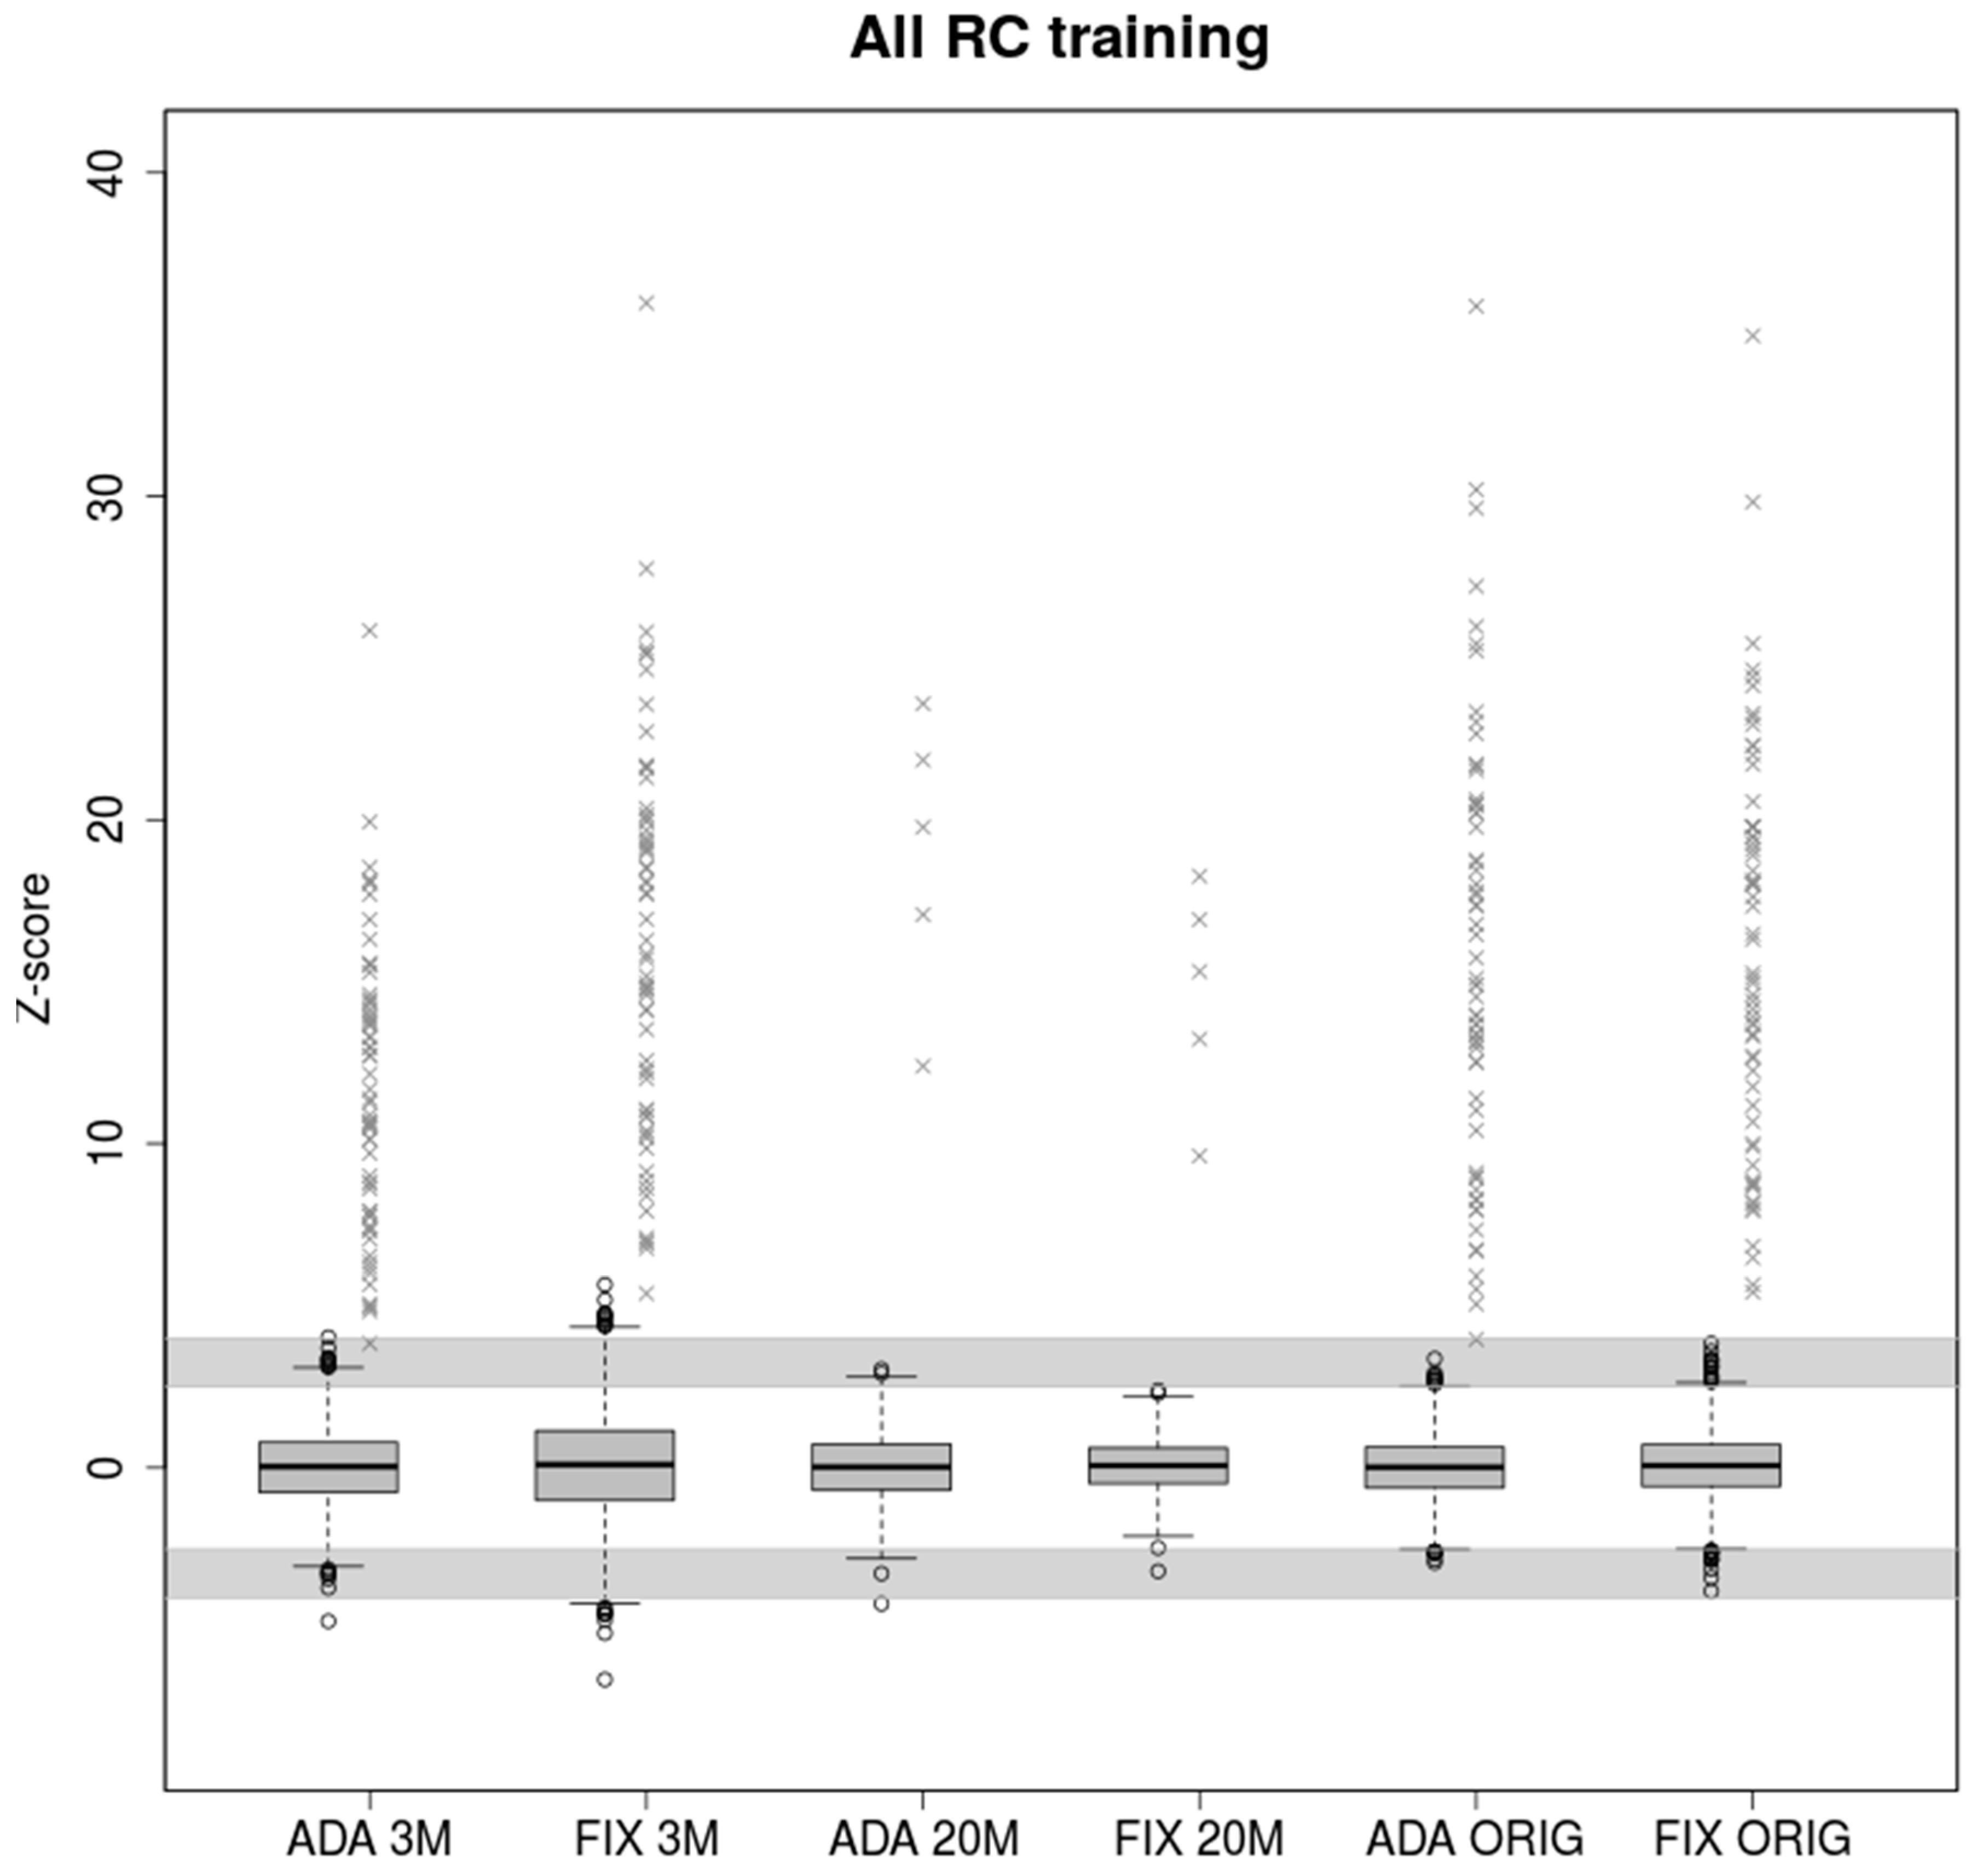
Model parameters trained on 20M samples more accurately depict underlying chromosomal distributions than 3M samples due to the higher number of observed reads. Although the z-scores are higher for low covered samples, this led to more false positives exceeding the grey zone (
Figure 2).
Parameters estimated using 20M training samples do not fit testing 3M samples properly. With a large number of testing data (5860 3M samples), we observed 1001 uninformative samples and 336 false positives (FP) in the case of FIXVAR model. This means almost every fourth test sample needs to be re-analyzed or evaluated as FP, which is not acceptable in clinical practice. Adaptive standard deviation reduced the number of uninformative results and FP calls from 1337 to 181 (6 FP), with a specificity 97%. On the other hand, in the case of ADAVAR model, the probability for false negative is slightly higher. Similarly, for 20M testing samples, the results are almost equal. All trisomic samples were classified correctly, and only seven euploid samples fell into a grey zone.
When testing 5680 production samples with original read count, we observed a still large number of uninformative results in case of FIXVAR model, 303 (19 FP), but only 45 uninformative and none of the FP in case of ADAVAR model. In both cases, all trisomic samples were classified correctly.
2.3. Training on Samples with Uneven Coverage
Real parameters estimated from training samples with original read count provide enough information about the variability between the data. Also, in this case the two models have comparable results when testing real read count samples (
Figure 3). Therefore, if enough training samples with wide read count range is available, both models provided high accuracy by testing. The adaptive standard deviation is valuable mostly in the limit case of the test samples.
In the case of testing 3M samples, FIXVAR model were found 330 uninformative calls (30 FP), which means too many samples for repeated analysis. On the other hand, the ADAVAR model is slightly more likely to report potentially false negative.
3. Discussion
We propose an improvement for state-of-the-art methods used in NGS-based non-invasive testing based on adaptive model parameters that are calculated for each sample separately. The method is based on theoretical properties of underlying distributions that provide estimates of variance in random draw from multinomial distribution. We have shown that those estimates differ from observed variance by constant factor, that may be easily incorporated into the calculation and improves the model beyond the level of current best methods used in clinical practice.
We tested the limitations of the commonly used method FIXVAR and the proposed ADAVAR method on boundary sequencing depths. We have also tested these methods on real data sets with uneven sequencing depths. Although the new method did not greatly exceed the current methods in ordinary cases, its benefits are in borderline cases.
As we have shown in the results, when training on low read count followed by testing on many times higher number of reads, ADAVAR provided significantly higher z-score values than FIXVAR (
Figure 1). Higher coverage is typically required for more thorough predictions, for example, in the case of repeated analysis, detection of mosaicism, or partial chromosomal aberrations.
As a result, the number of false negative calls is greatly reduced without increasing the number of false positive calls. FIXVAR method also performs poorly, when the model parameters are trained on samples with higher read count values than testing samples. Underestimation of variance in tested samples leads to a high amount of false positive calls. We have shown that the new method is able to partially correct these ineligible clinical results with respect to the number of reads and thus avoid the high number of false positives. This is the case when a sequenced sample has lack of reads which can be caused by several factors, for example, a large number of sequenced samples, insufficient concentration of DNA fragments, or uneven distribution of pooled samples to be sequenced.
In the article, we pointed out the shortcomings of current methods and their partial correction by our method. Although the new method ADAVAR has not overcome standard methods in all cases, it still has benefits in testing of samples with highly divergent coverages, where this method leads to a lower number of false positive and false negative calls.
4. Materials and Methods
4.1. Sample Acquisition
Altogether, we have collected 6117 samples with singleton pregnancy, of which 6053 were negative, while 64 were confirmed for trisomy of chromosome 21 (T21). In each case were positive results confirmed by amniocentesis. Negative samples were, however, not confirmed by any additional gold standard method. Data analyses reported here, were, on the other hand performed only on samples originally analyzed with a sufficient time interval to know, from a clinician feedback following the delivery, whether any false negative results occurred. Note that the sample set does not contain samples that we were not able to resolve (such samples were either repeated or declined to report). The samples were predominantly of Slovak and Czech origin. All women participating in this study gave informed written consent consistent with the Helsinki declaration. Ethic approval: Etická komisia Bratislavského samosprávneho kraja (Ethical commission of self-governing region of Bratislava), approval number: 07507/2018/HF, approval date: 11 June 2018.
4.2. Sample Preparation and Sequencing
Blood from pregnant women was collected into EDTA tubes and kept at 4 °C temperature until plasma separation. Blood plasma was separated within 36 h after collection and stored at −20 °C unit DNA isolation. DNA was isolated using Qiagen DNA Blood Mini kit (Hilden, Germany). Standard fragment libraries for massively parallel sequencing were prepared from isolated DNA using an Illumina TruSeq Nano kit (San Diego, CA, USA) and a modified protocol described previously [
15]. Briefly, to decrease laboratory costs, we used reduced volumes of reagents what were compensated by 9 cycles of PCR instead of 8 as per protocol. Physical size selection of cfDNA fragments was performed using specific volumes of magnetic beads in order to enrich fetal fraction. Illumina NextSeq 500/550 High Output Kit v2 (San Diego, CA, USA) (75 cycles) was used for massively parallel sequencing of prepared libraries using pair-end sequencing with read length of 2×35bp on an Illummina NextSeq 500 platform (Available online:
https://www.illumina.com/).
4.3. Mapping and Read Count Correction
The first part of analysis was performed as described previously in [
15,
16,
17]. Sequencing reads were aligned to the human reference genome (hg19) using Bowtie 2 algorithm [
18]. The first stage of data processing was carried out as in [
15,
18]. NextSeq-produced fastq files (two per sample) were directly mapped using the Bowtie 2 algorithm with --very-sensitive option. Reads with mapping quality of 40 or higher were retained for further data processing. For some of our analyses, a uniform random selection of only some amount of mapped reads (alignments) was chosen for further processing. Next, for each sample, the unique reads were processed to eliminate the GC bias according to [
19] with the exclusion of intra-run normalization. Briefly, for each sample the number of unique reads from each 20 kbp bin on each chromosome was counted. With empty bins filtered out, the locally weighted scatterplot smoothing (LOESS) regression was used to predict the expected read count for each bin based on its GC content. The LOESS-corrected read count for a particular bin was then calculated as
, where
is the global average of read counts through all bins,
is the fitted read count of that bin, and
is its observed read count.
To remove genomic regions with common structural differences, the LOESS-corrected bin counts were transformed into a principal space. The first component represents the highest variability across individuals in the control set. To normalize the sample, bin counts corresponding to a predefined number of top components were removed to reduce common noise in euploid samples [
20,
21]. Vector of corrected number of reads per autosomes was used for z-score calculations.
4.4. FIXVAR (Fixed Variance) Z-Score Calculation
The reference z-scores of samples were calculated as normalized chromosome values (NCV) according to [
13]. Given our training set, the optimal reference chromosomes with respect to the coefficient of variation were determined to be 1, 4, 8, 10, 19, and 20 for trisomy 21 [
13]. Similarly to [
7], samples scoring 4 and higher were considered trisomic, while samples scoring 2.5 or lower were considered euploid. The range (2.5, 4) was considered uninformative. We will refer to these NCV values as reference z-scores or
and to this type of z-score calculation (ratio of chromosomes) as FIXVAR model.
4.5. ADAVAR (Adaptive Variance) Z-Score Calculation
4.5.1. Motivation
Consider a multinomial distribution given by as a model for mapping of sequenced reads to autosomes (we omitted sex chromosomes due the different mapping ratio for male and female fetuses). The numbers are associated with proportion of reads mapped to the ith autosome, and are largely determined by structure and composition of the chromosome, such as its length, GC content, repeat sequence distribution and so on. However, it was observed that there exist differences between healthy individuals on sub-autosomal level (typically copy number variations or CNVs) large enough to skew the theoretical random draw from multinomial distribution (Kucharik 2019, under review). Even though we omitted those parts of the genome that exhibited such variations frequently, individual deviations from the central model, presumably due to random individual CNVs, still exceeded the statistical errors expected from the assumed multinomial distribution. Still, an approximation of the numbers can be obtained through a sufficiently large and diverse sample of population even though a population-universal multinomial mapping model is unlikely to exist. We showed that with sufficient corrections, the approximate model can still be useful, and it outperforms FIXVAR model in certain cases.
4.5.2. Definition
Formally, the model is defined as follows. Let a set of random variables
have joint multinomial distribution given by
. The instance of this random variable represents counts of reads mapped to autosomes for a given biological sample. Let
be two binary vectors such that
,
, and
for all
. The vector
selects an aneuploid autosome (thus, we have
), and the vector
selects reference autosomes. Because we do not want the aneuploid or potentially aneuploid autosome to be in the reference set, some other restrictions further apply, namely
for all
(i.e., the trisomic autosome is not in the reference set) and
(neither are three common trisomic autosomes). The reference autosomes can be found by many methods, for example, through minimization of coefficient of variation as in [
13].
Let
be a new scalar random variable defined as
where
stands for the scalar product. Observe that this is the model of chromosome ratio from [
13]. With
,
, and
, ref. [
22] showed that for sufficiently large
the following approximations of mean and standard deviation of
holds
where
is the total autosomal read count of a given sample (more robust approximations can be found in the paper). Observe that while the numbers
and
are determined by the reference set, the number
changes with each test sample. Thus, the mean and standard deviation is automatically adjusted for variable sequencing depth. Finally, we can calculate the sample’s z-score, an analogue to
, as
4.5.3. Additional Bias Correction
As we pointed out before, this central ADAVAR model does not represent a general euploid pregnancy in sufficient detail, presumably because of the random individual CNVs. Hence, the model needs to be modified before it can be used for z-score calculation.
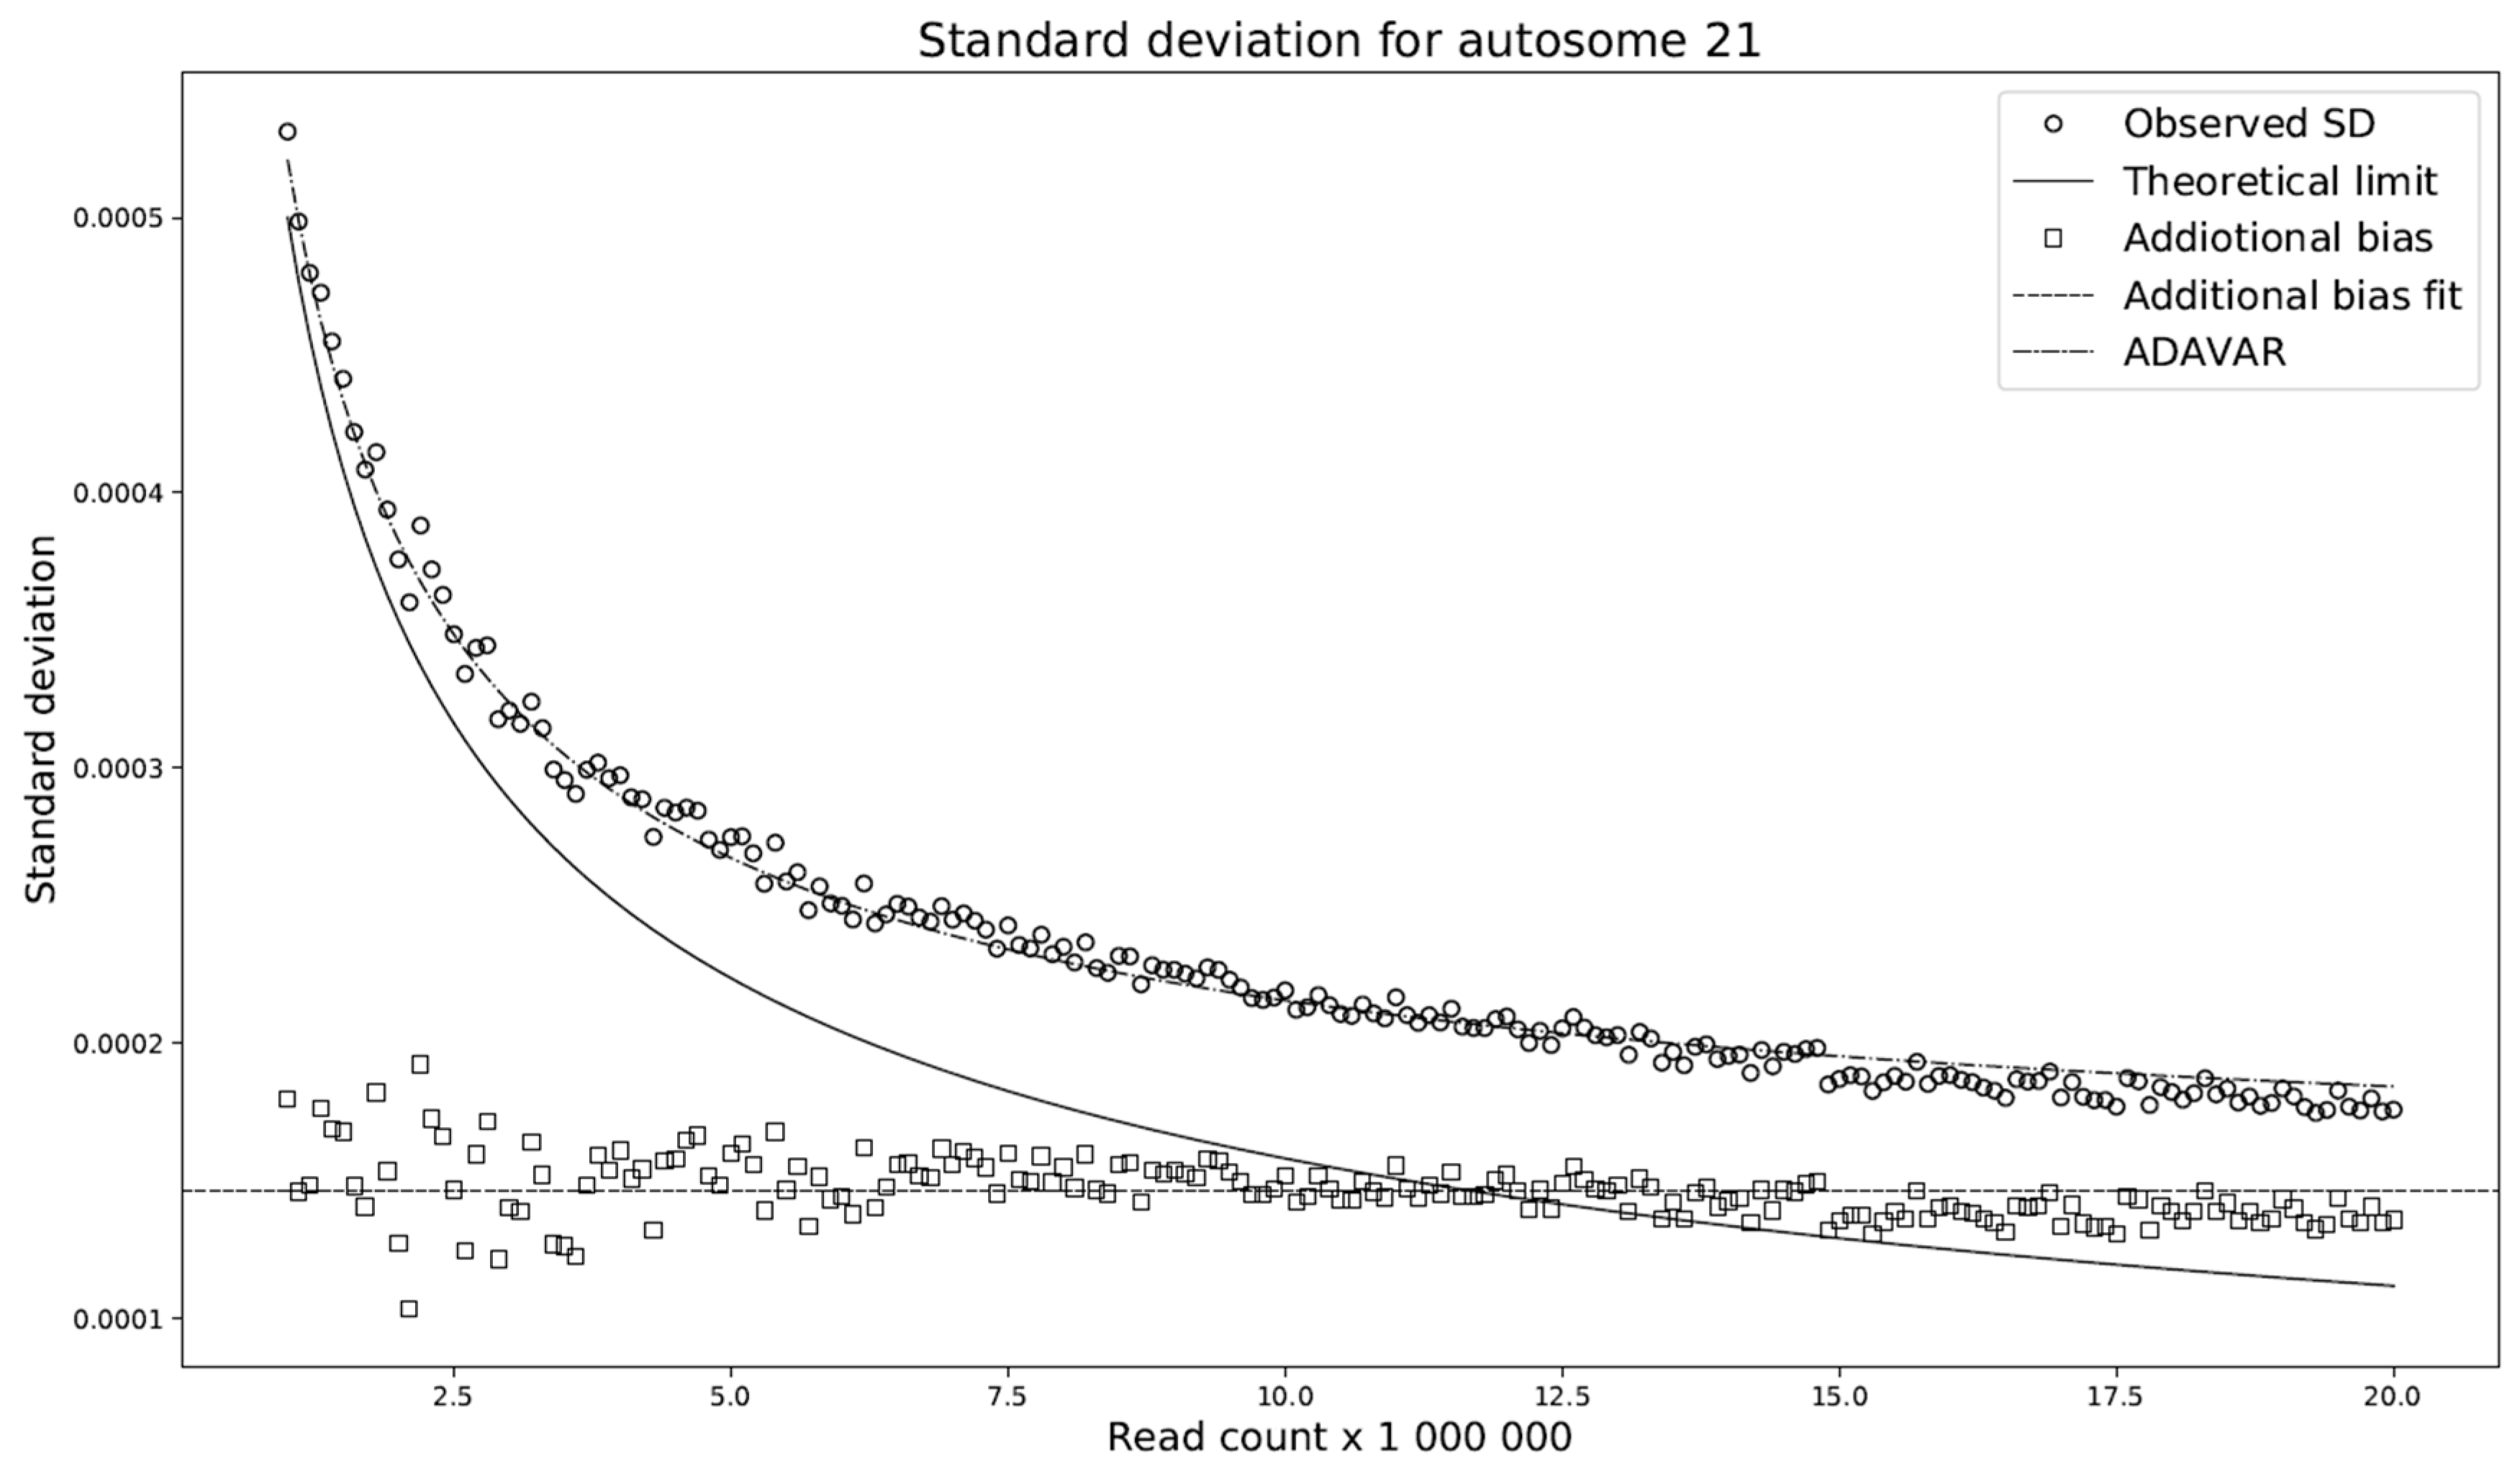
This modification compares the standard deviations with respect to the selected read count among the individual models. We have shown (
Figure 4) that the difference between these deviations is almost constant across any read count setting. Let this constant be denoted by
. We set
to be the average of the deviation differences. The theoretical model ADAVAR then has a standard deviation defined as
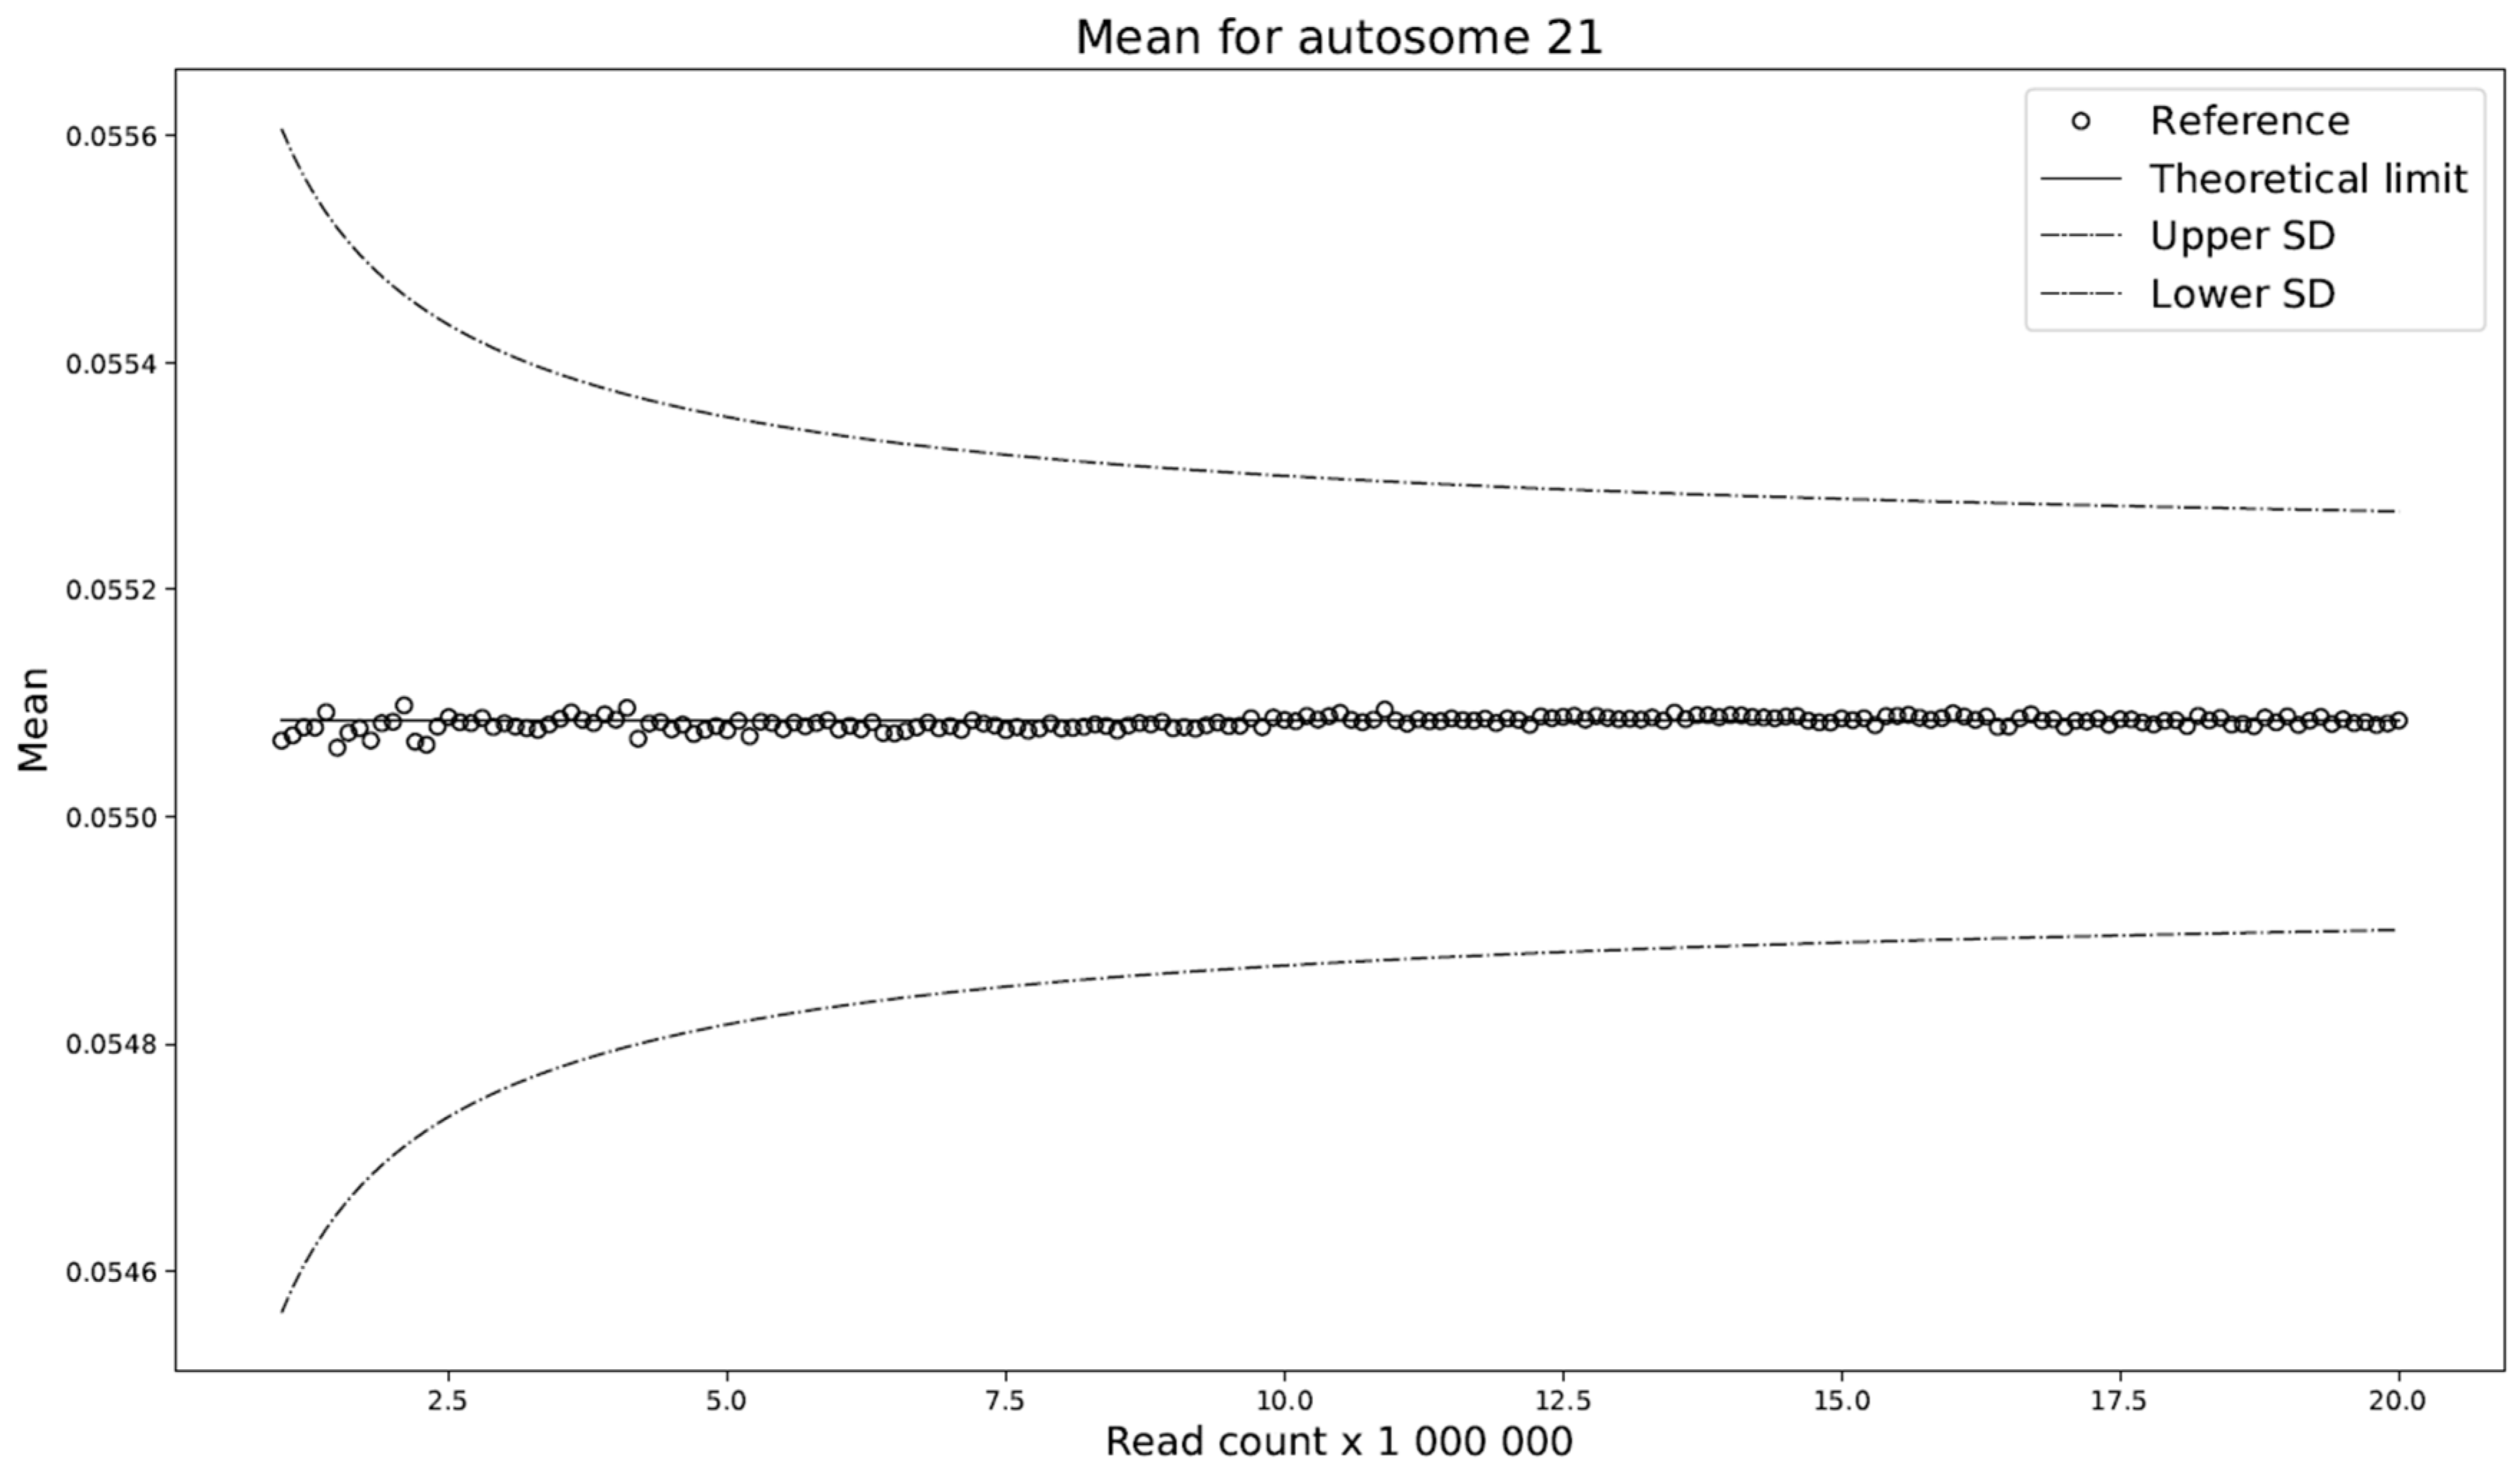
Furthermore, prediction of the mean of the ADAVAR model and the observations agree (
Figure 5) and no further correction is needed.
Then the sample’s z-score is given by
Author Contributions
Conceptualization, J.G., J.B., F.D., and T.S.; Methodology, J.G., J.B., and F.D.; Software, J.G. and F.D.; Validation, J.G. and F.D.; Formal analysis, J.G.; Investigation, J.G. and F.D.; Resources, T.S. and J.T.; Data curation, J.B.; Writing—original draft preparation, J.G., J.B., and F.D.; Writing—review and editing, J.G., J.B., F.D., and T.S.; Visualization, J.G.; Supervision, J.G. and F.D.; Project administration, T.S. and J.T.; Funding acquisition, T.S.
Funding
The presented work was supported by the “REVOGENE - Research centre for molecular genetics” project (ITMS 26240220067) supported by the Operational Programme Research and Development funded by the ERDF.
Conflicts of Interest
J.G., J.B., F.D., and T.S. participated in the development of the commercial NIPT test in the company Geneton Ltd. (Slovakia). J.T. have declared no conflicts of interest.
Abbreviations
| NIPT | Non-invasive prenatal testing |
| FP | False positive |
| FN | False negative |
| T21 | Trisomy of chromosome 21 |
| NCV | Normalized chromosome values |
| FIXVAR | Fixed variance model |
| ADAVAR | Adaptive variance model |
| ADA | Abbreviation of ADAVAR |
References
- Mujezinovic, F.; Alfirevic, Z. Procedure-Related Complications of Amniocentesis and Chorionic Villous Sampling. Obstet. Gynecol. 2007, 110, 687–694. [Google Scholar] [CrossRef] [PubMed]
- Lo, Y.M.D.; Corbetta, N.; Chamberlain, P.F.; Rai, V.; Sargent, I.L.; Redman, C.W.; Wainscoat, J.S. Presence of fetal DNA in maternal plasma and serum. Lancet 1997, 350, 485–487. [Google Scholar] [CrossRef]
- Bischoff, F.Z.; Lewis, D.E.; Simpson, J.L. Cell-free fetal DNA in maternal blood: kinetics, source and structure. Hum. Reprod. Updat. 2005, 11, 59–67. [Google Scholar] [CrossRef] [PubMed]
- Lo, Y.M.D.; Tein, M.S.; Lau, T.K.; Haines, C.J.; Leung, T.N.; Poon, P.M.; Wainscoat, J.S.; Johnson, P.J.; Chang, A.M.; Hjelm, N.M. Quantitative Analysis of Fetal DNA in Maternal Plasma and Serum: Implications for Noninvasive Prenatal Diagnosis. Am. J. Hum. Genet. 1998, 62, 768–775. [Google Scholar] [CrossRef] [PubMed]
- Fiorentino, F.; Bono, S.; Pizzuti, F.; Mariano, M.; Polverari, A.; Duca, S.; Sessa, M.; Baldi, M.; Diano, L.; Spinella, F. The importance of determining the limit of detection of non-invasive prenatal testing methods. Prenat. Diagn. 2016, 36, 304–311. [Google Scholar] [CrossRef] [PubMed]
- Chiu, R.W.; Akolekar, R.; Zheng, Y.W.; Leung, T.Y.; Sun, H.; Chan, K.A.; Lun, F.M.; Go, A.T.; Lau, E.T.; To, W.W.; et al. Non-invasive prenatal assessment of trisomy 21 by multiplexed maternal plasma DNA sequencing: Large scale validity study. BMJ 2011, 342, c7401. [Google Scholar] [CrossRef] [PubMed]
- Bianchi, D.W.; Sehnert, A.J.; Rava, R.P. Genome-Wide Fetal Aneuploidy Detection by Maternal Plasma DNA Sequencing. Obstet. Gynecol. 2012, 119, 1270–1271. [Google Scholar] [CrossRef]
- Straver, R.; Sistermans, E.A.; Holstege, H.; Visser, A.; Oudejans, C.B.; Reinders, M.J.T. WISECONDOR: Detection of fetal aberrations from shallow sequencing maternal plasma based on a within-sample comparison scheme. Nucleic Acids Res. 2014, 42, e31. [Google Scholar] [CrossRef]
- Stephanie, C.Y.; Chan, K.A.; Zheng, Y.W.; Jiang, P.; Liao, G.J.; Sun, H.; Akolekar, R.; Leung, T.Y.; Go, A.T.; van Vugt, J.M.; et al. Application of risk score analysis to low-coverage whole genome sequencing data for the noninvasive detection of trisomy 21, trisomy 18, and trisomy 13. Prenat. Diagn. 2016, 36, 56–62. [Google Scholar]
- Stephanie, C.Y.; Chan, K.A.; Zheng, Y.W.; Jiang, P.; Liao, G.J.; Sun, H.; Akolekar, R.; Leung, T.Y.; Go, A.T.; van Vugt, J.M.; et al. Size-based molecular diagnostics using plasma DNA for noninvasive prenatal testing. Proc. Natl. Acad. Sci. USA 2014, 111, 8583–8588. [Google Scholar]
- Chiu, R.W.; Chan, K.A.; Gao, Y.; Lau, V.Y.; Zheng, W.; Leung, T.Y.; Foo, C.H.; Xie, B.; Tsui, N.B.; Lun, F.M.; et al. Noninvasive prenatal diagnosis of fetal chromosomal aneuploidy by massively parallel genomic sequencing of DNA in maternal plasma. Proc. Natl. Acad. Sci. USA 2008, 105, 20458–20463. [Google Scholar] [CrossRef] [PubMed]
- Fan, H.C.; Blumenfeld, Y.J.; Chitkara, U.; Hudgins, L.; Quake, S.R. Noninvasive diagnosis of fetal aneuploidy by shotgun sequencing DNA from maternal blood. Proc. Natl. Acad. Sci. USA 2008, 105, 16266–16271. [Google Scholar] [CrossRef] [PubMed]
- Sehnert, A.J.; Rhees, B.; Comstock, D.; De Feo, E.; Heilek, G.; Burke, J.; Rava, R.P. Optimal Detection of Fetal Chromosomal Abnormalities by Massively Parallel DNA Sequencing of Cell-Free Fetal DNA from Maternal Blood. Clin. Chem. 2011, 57, 1042–1049. [Google Scholar] [CrossRef] [PubMed]
- Lau, T.K.; Chen, F.; Pan, X.; Pooh, R.K.; Jiang, F.; Li, Y.; Jiang, H.; Li, X.; Chen, S.; Zhang, X. Noninvasive prenatal diagnosis of common fetal chromosomal aneuploidies by maternal plasma DNA sequencing. J. Matern. Neonatal Med. 2012, 25, 1370–1374. [Google Scholar] [CrossRef] [PubMed]
- Minarik, G.; Repiska, G.; Hyblova, M.; Nagyova, E.; Soltys, K.; Budis, J.; Duris, F.; Sysak, R.; Bujalkova, M.G.; Vlkova-Izrael, B.; et al. Utilization of Benchtop Next Generation Sequencing Platforms Ion Torrent PGM and MiSeq in Noninvasive Prenatal Testing for Chromosome 21 Trisomy and Testing of Impact of In Silico and Physical Size Selection on Its Analytical Performance. PLoS ONE 2015, 10, e0144811. [Google Scholar] [CrossRef] [PubMed]
- Budis, J.; Gazdarica, J.; Radvanszky, J.; Harsanyova, M.; Gazdaricova, I.; Strieskova, L.; Frno, R.; Duris, F.; Minarik, G.; Sekelska, M.; et al. Non-invasive prenatal testing as a valuable source of population specific allelic frequencies. J. Biotechnol. 2019, 299, 72–78. [Google Scholar] [CrossRef] [PubMed]
- Budis, J.; Gazdarica, J.; Radvanszky, J.; Szucs, G.; Kucharik, M.; Strieskova, L.; Gazdaricova, I.; Harsanyova, M.; Duris, F.; Minarik, G.; et al. Combining count- and length-based z-scores leads to improved predictions in non-invasive prenatal testing. Bioinformatics 2018, 35, 1284–1291. [Google Scholar] [CrossRef]
- Langmead, B.; Trapnell, C.; Pop, M.; Salzberg, S.L. Ultrafast and memory-efficient alignment of short DNA sequences to the human genome. Genome Biol. 2009, 10, R25. [Google Scholar] [CrossRef]
- Liao, C.; Yin, A.H.; Peng, C.F.; Fu, F.; Yang, J.X.; Li, R.; Chen, Y.Y.; Luo, D.H.; Zhang, Y.L.; Ou, Y.M.; et al. Noninvasive prenatal diagnosis of common aneuploidies by semiconductor sequencing. Proc. Natl. Acad. Sci. USA 2014, 111, 7415–7420. [Google Scholar] [CrossRef]
- Price, A.L.; Patterson, N.J.; Plenge, R.M.; Weinblatt, M.E.; Shadick, N.A.; Reich, D. Principal components analysis corrects for stratification in genome-wide association studies. Nat. Genet. 2006, 38, 904–909. [Google Scholar] [CrossRef]
- Zhao, C.; Tynan, J.; Ehrich, M.; Hannum, G.; McCullough, R.; Saldivar, J.S.; Oeth, P.; van den Boom, D.; Deciu, C. Detection of Fetal Subchromosomal Abnormalities by Sequencing Circulating Cell-Free DNA from Maternal Plasma. Clin. Chem. 2015, 61, 608–616. [Google Scholar] [CrossRef] [PubMed]
- Duris, F.; Gazdarica, J.; Gazdaricova, I.; Strieskova, L.; Budis, J.; Turna, J.; Szemes, T. Mean and variance of ratios of proportions from categories of a multinomial distribution. J. Stat. Distrib. Appl. 2018, 5, 2. [Google Scholar] [CrossRef]
- Ehrich, M.; Deciu, C.; Zwiefelhofer, T.; Tynan, J.A.; Cagasan, L.; Tim, R.; Lu, V.; McCullough, R.; McCarthy, E.; Nygren, A.O.; et al. Noninvasive detection of fetal trisomy 21 by sequencing of DNA in maternal blood: A study in a clinical setting. Am. J. Obstet. Gynecol. 2011, 204, 205.e1–205.e11. [Google Scholar] [CrossRef] [PubMed]
© 2019 by the authors. Licensee MDPI, Basel, Switzerland. This article is an open access article distributed under the terms and conditions of the Creative Commons Attribution (CC BY) license (http://creativecommons.org/licenses/by/4.0/).

 ,
, 


