The AtHSP17.4C1 Gene Expression Is Mediated by Diverse Signals that Link Biotic and Abiotic Stress Factors with ROS and Can Be a Useful Molecular Marker for Oxidative Stress


Abstract
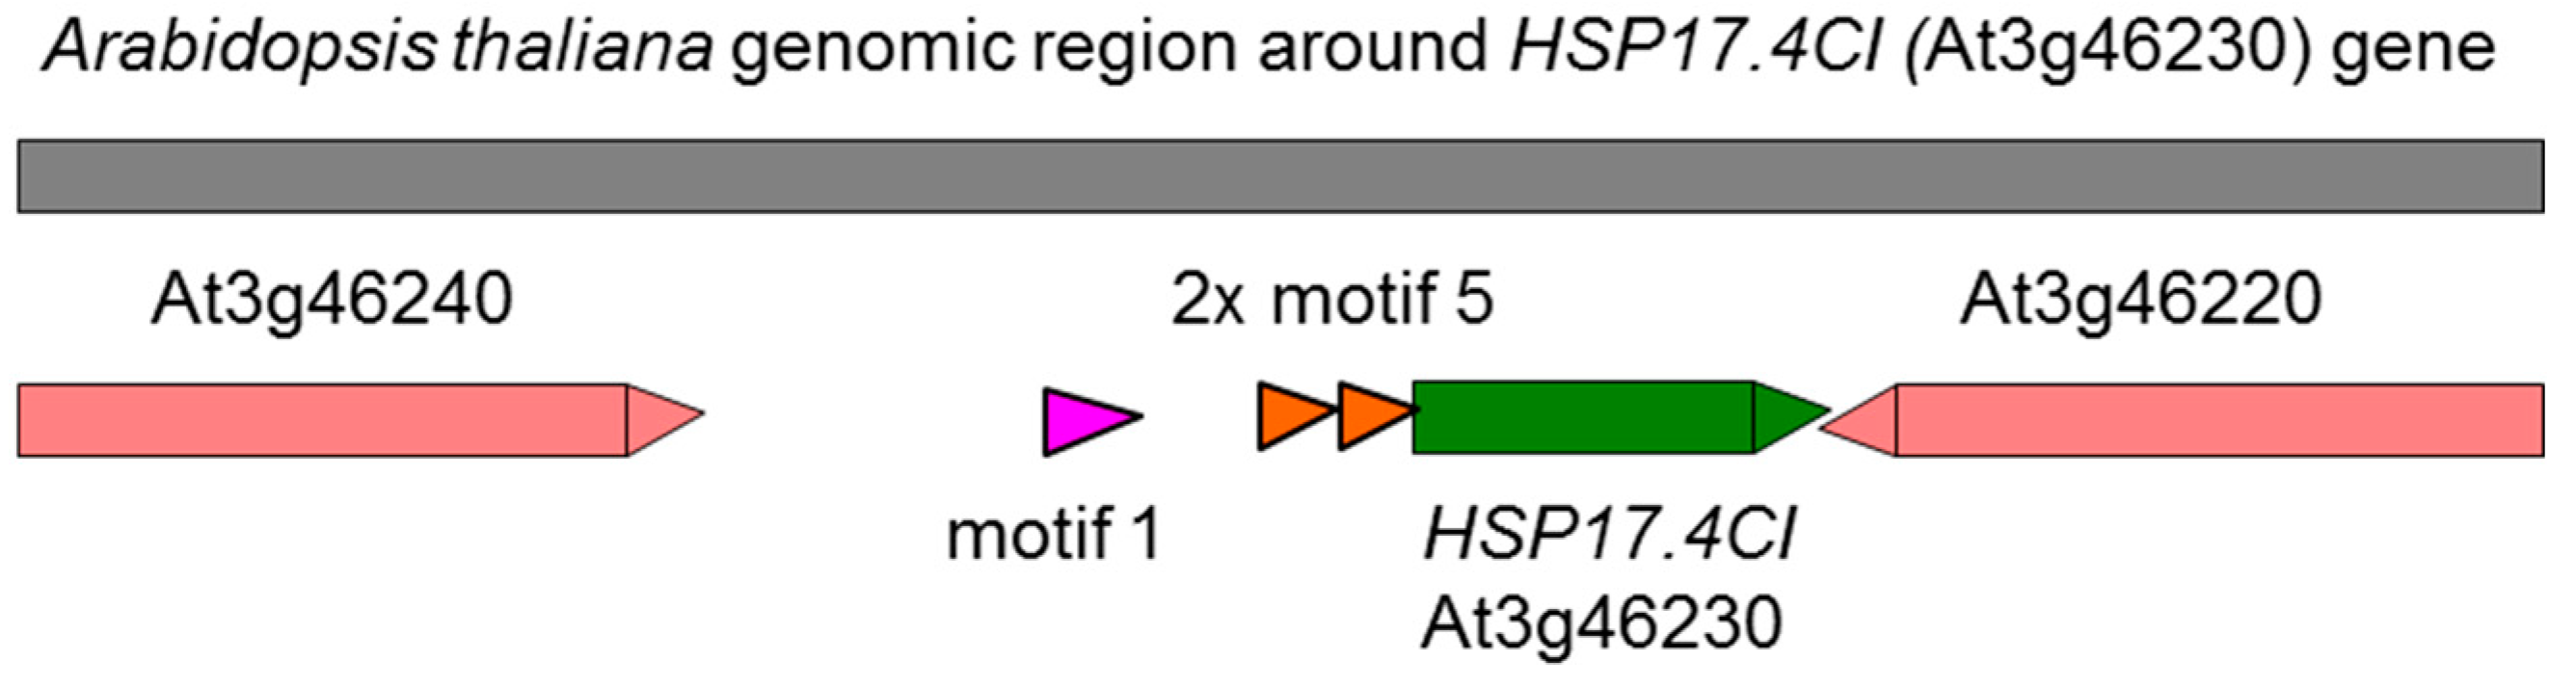
1. Introduction
2. Results
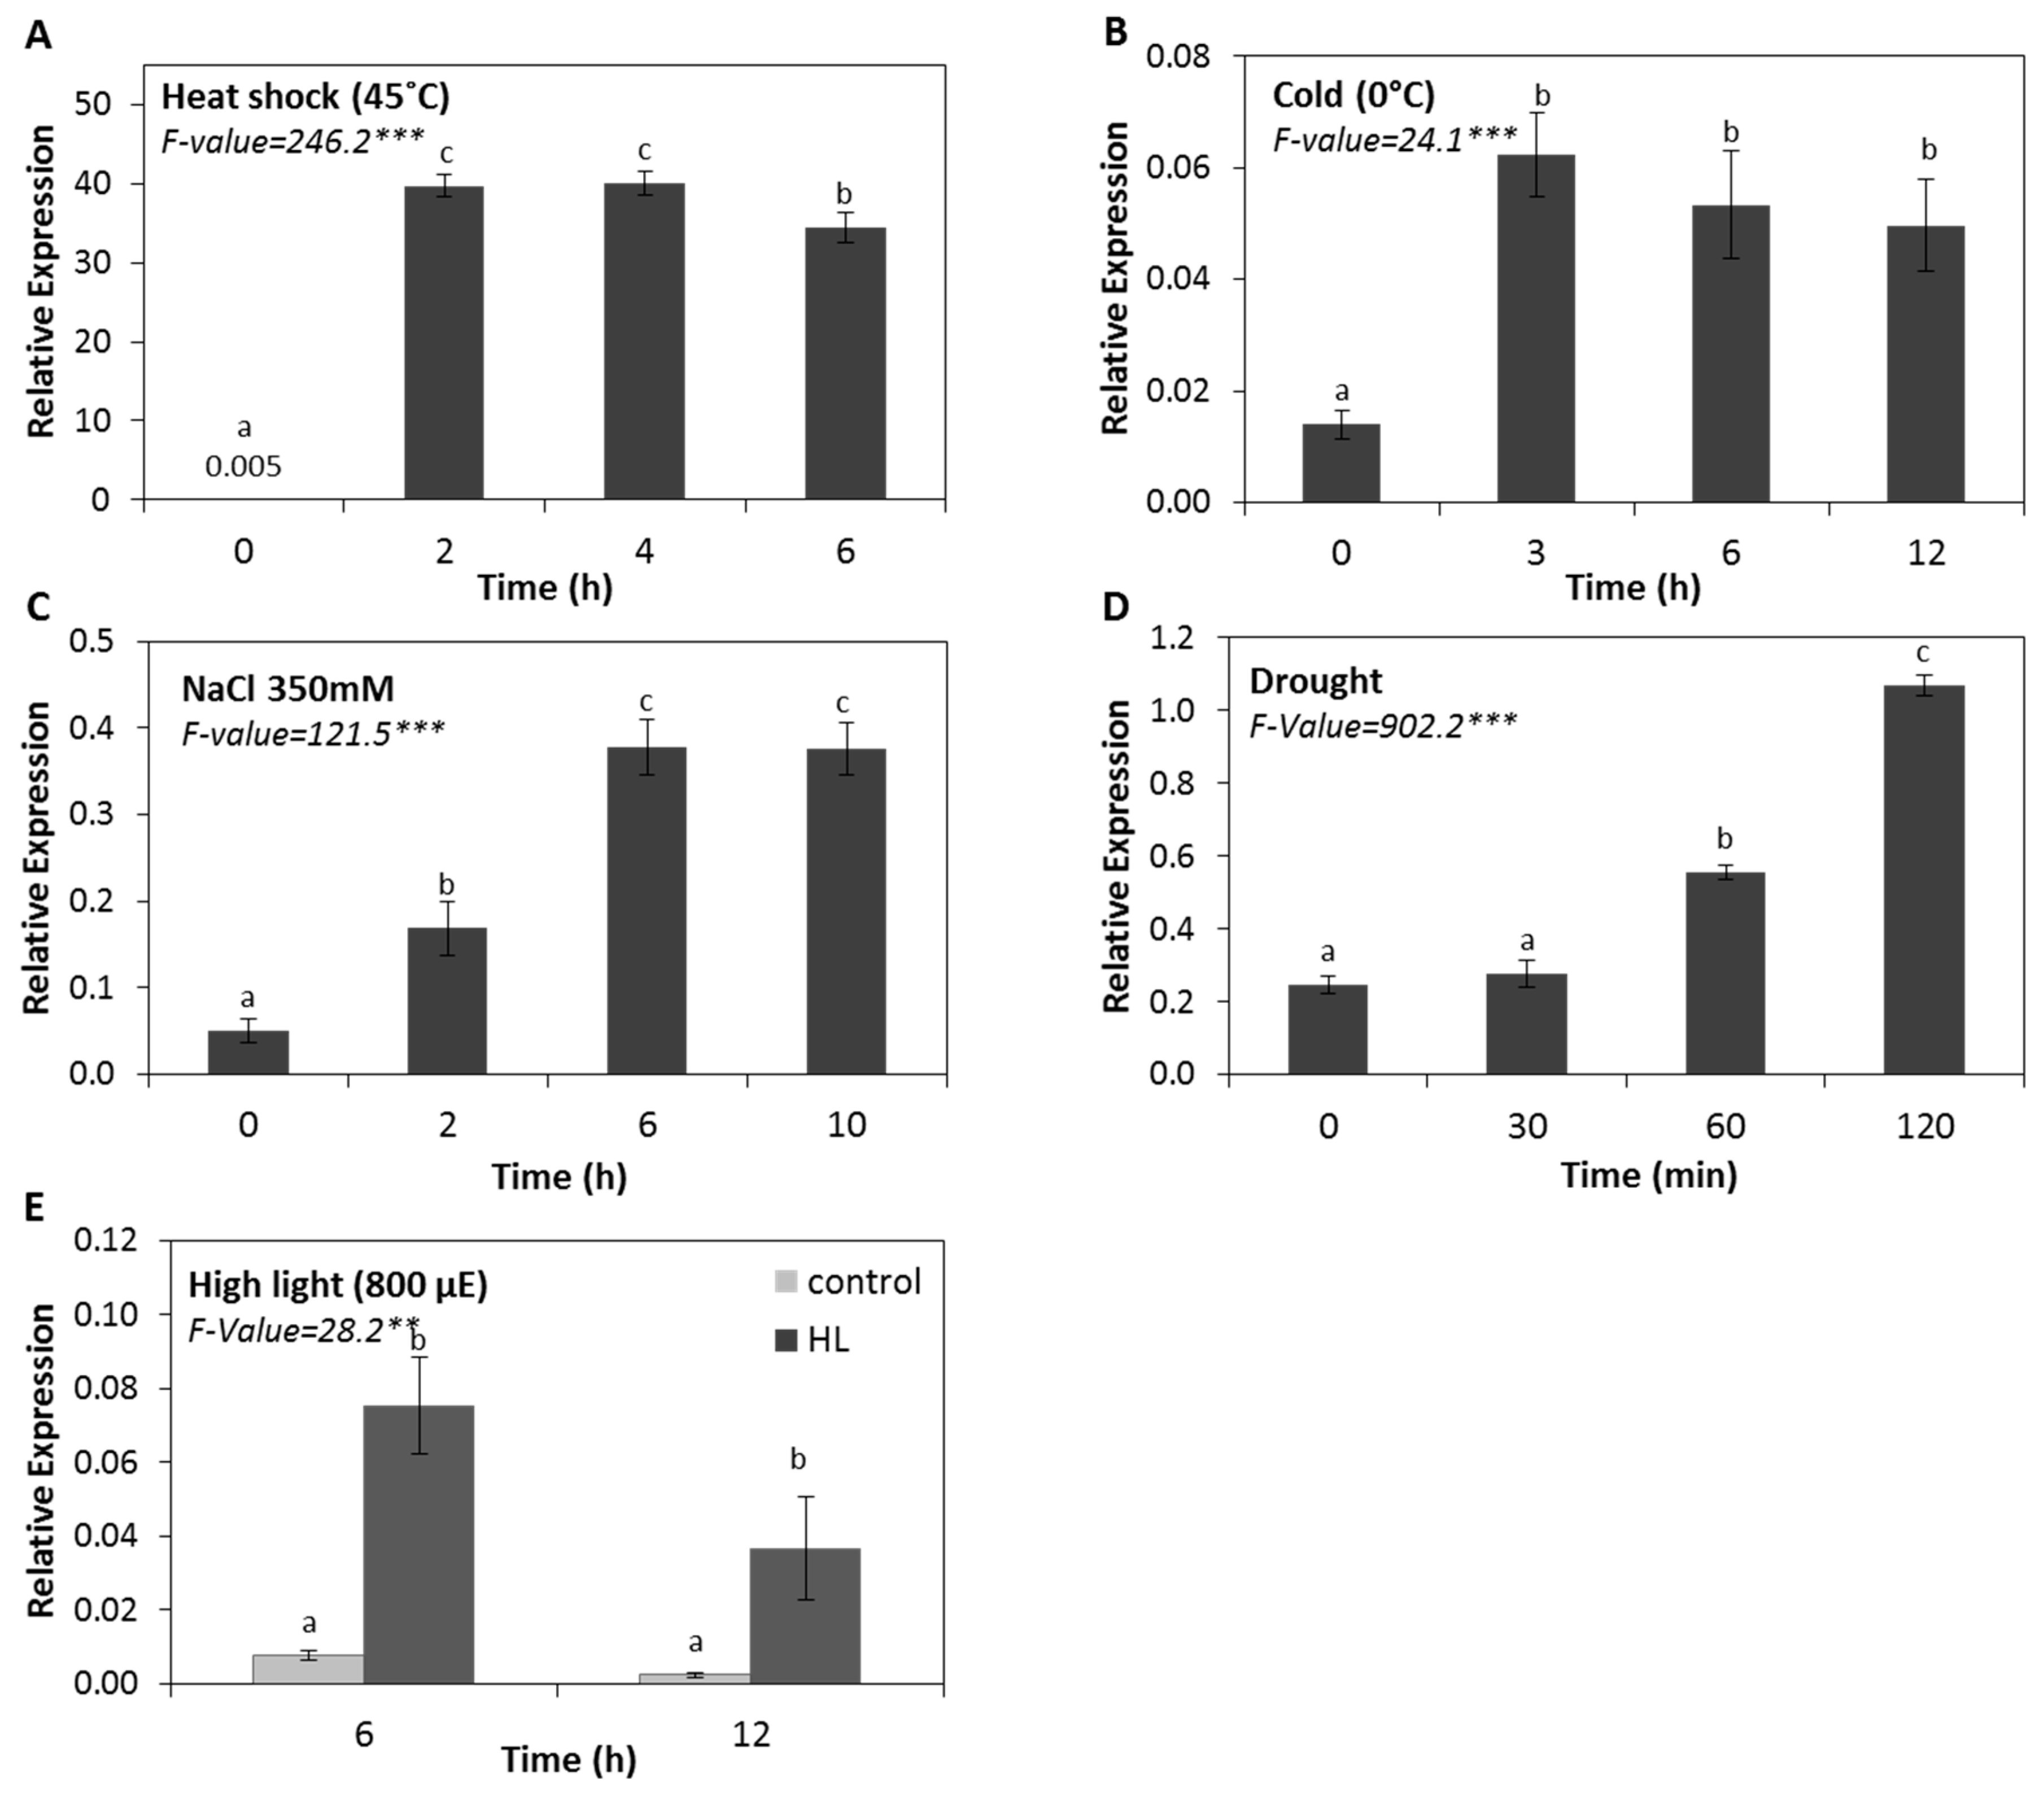
2.1. The Expression of HSP17.4CI is Induced by Various Abiotic Stresses
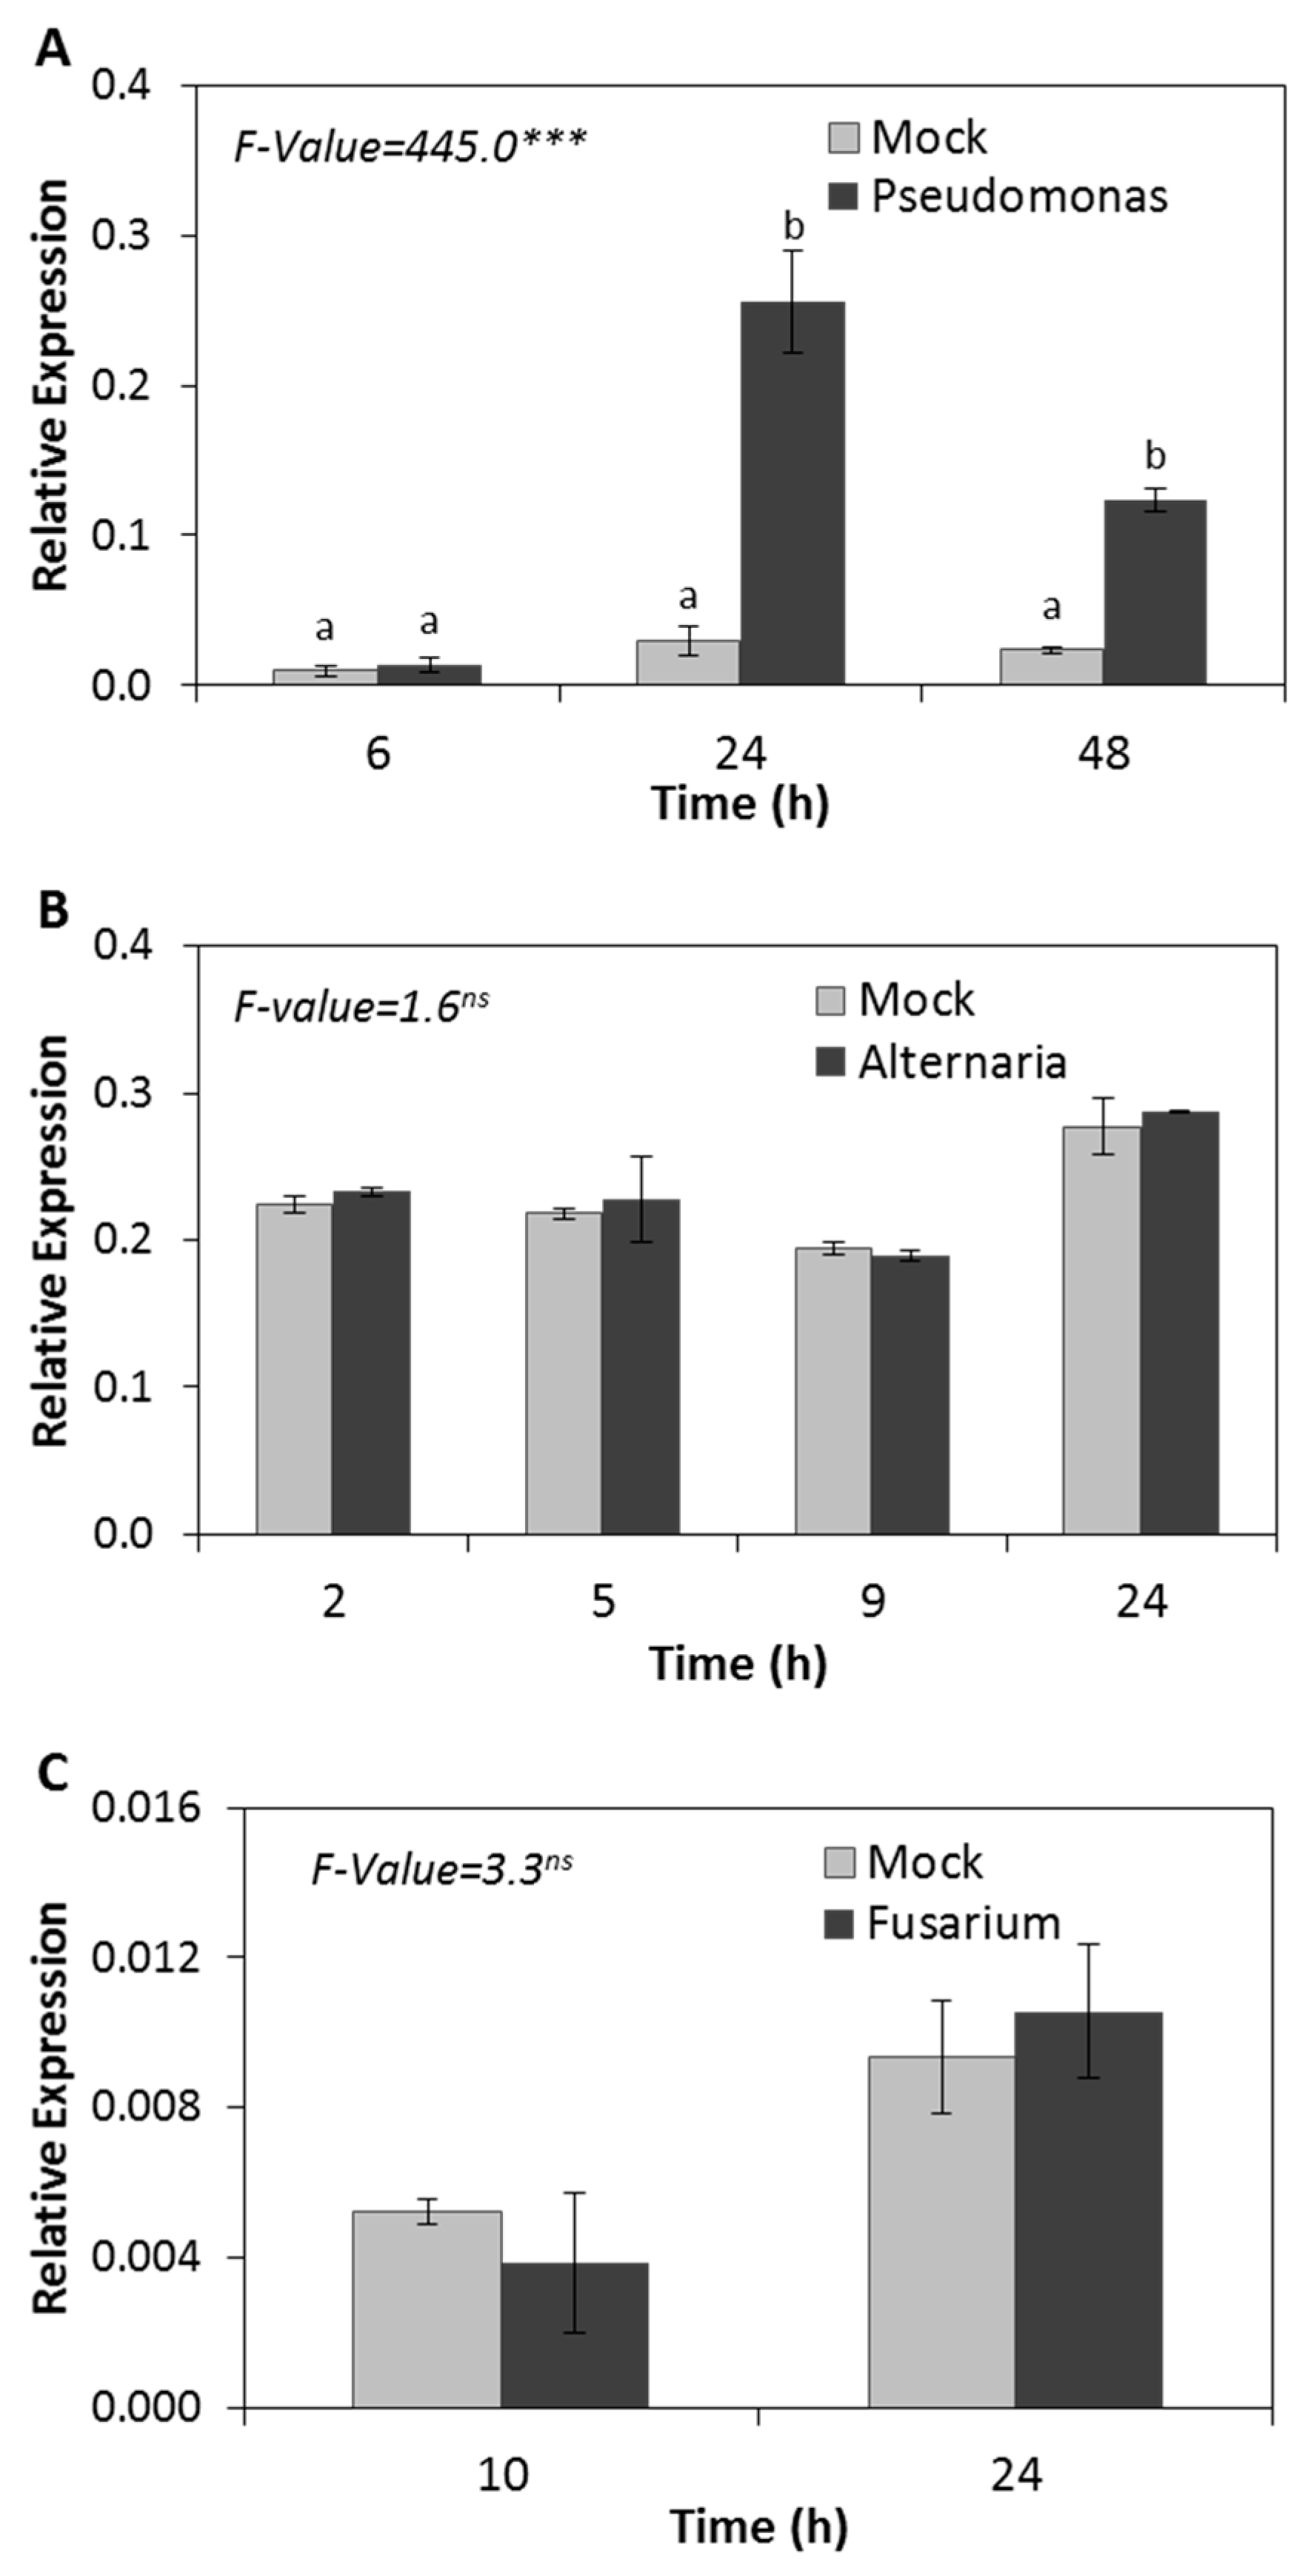
2.2. HSP17.4CI is Responsive to Biotrophic but Not to Necrotrophic Pathogens
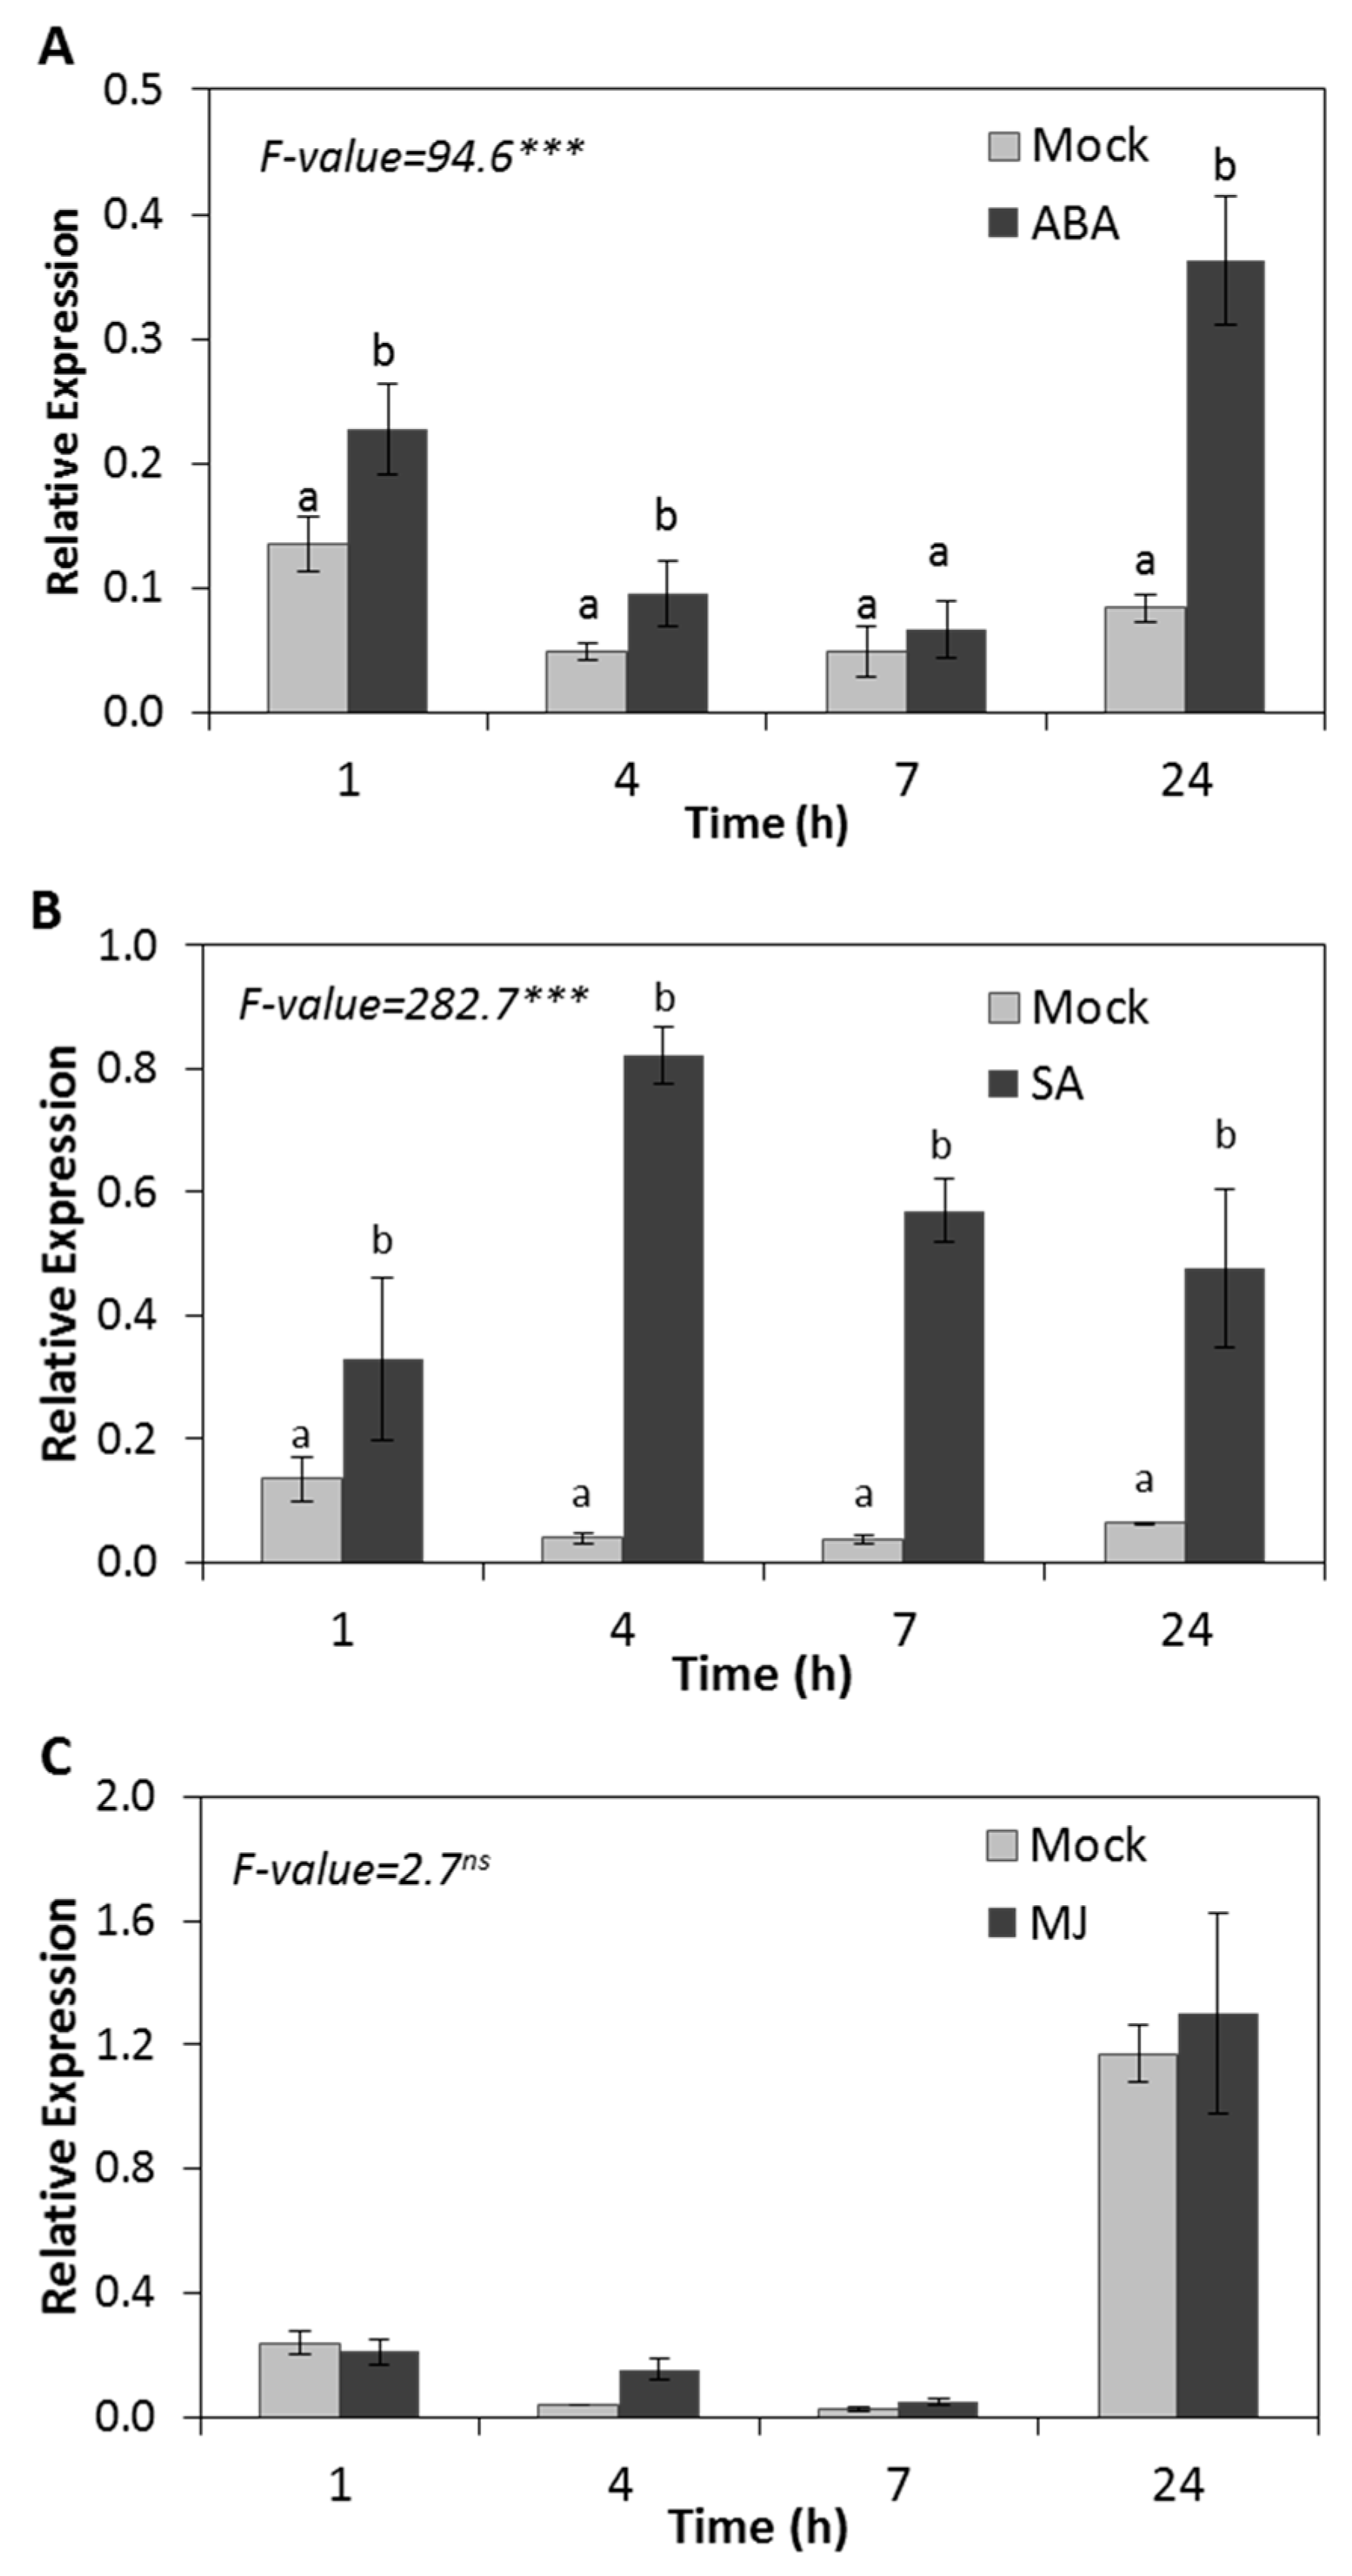
2.3. HSP17.4CI is Upregulated by Plant Hormones ABA and SA but Not by MJ
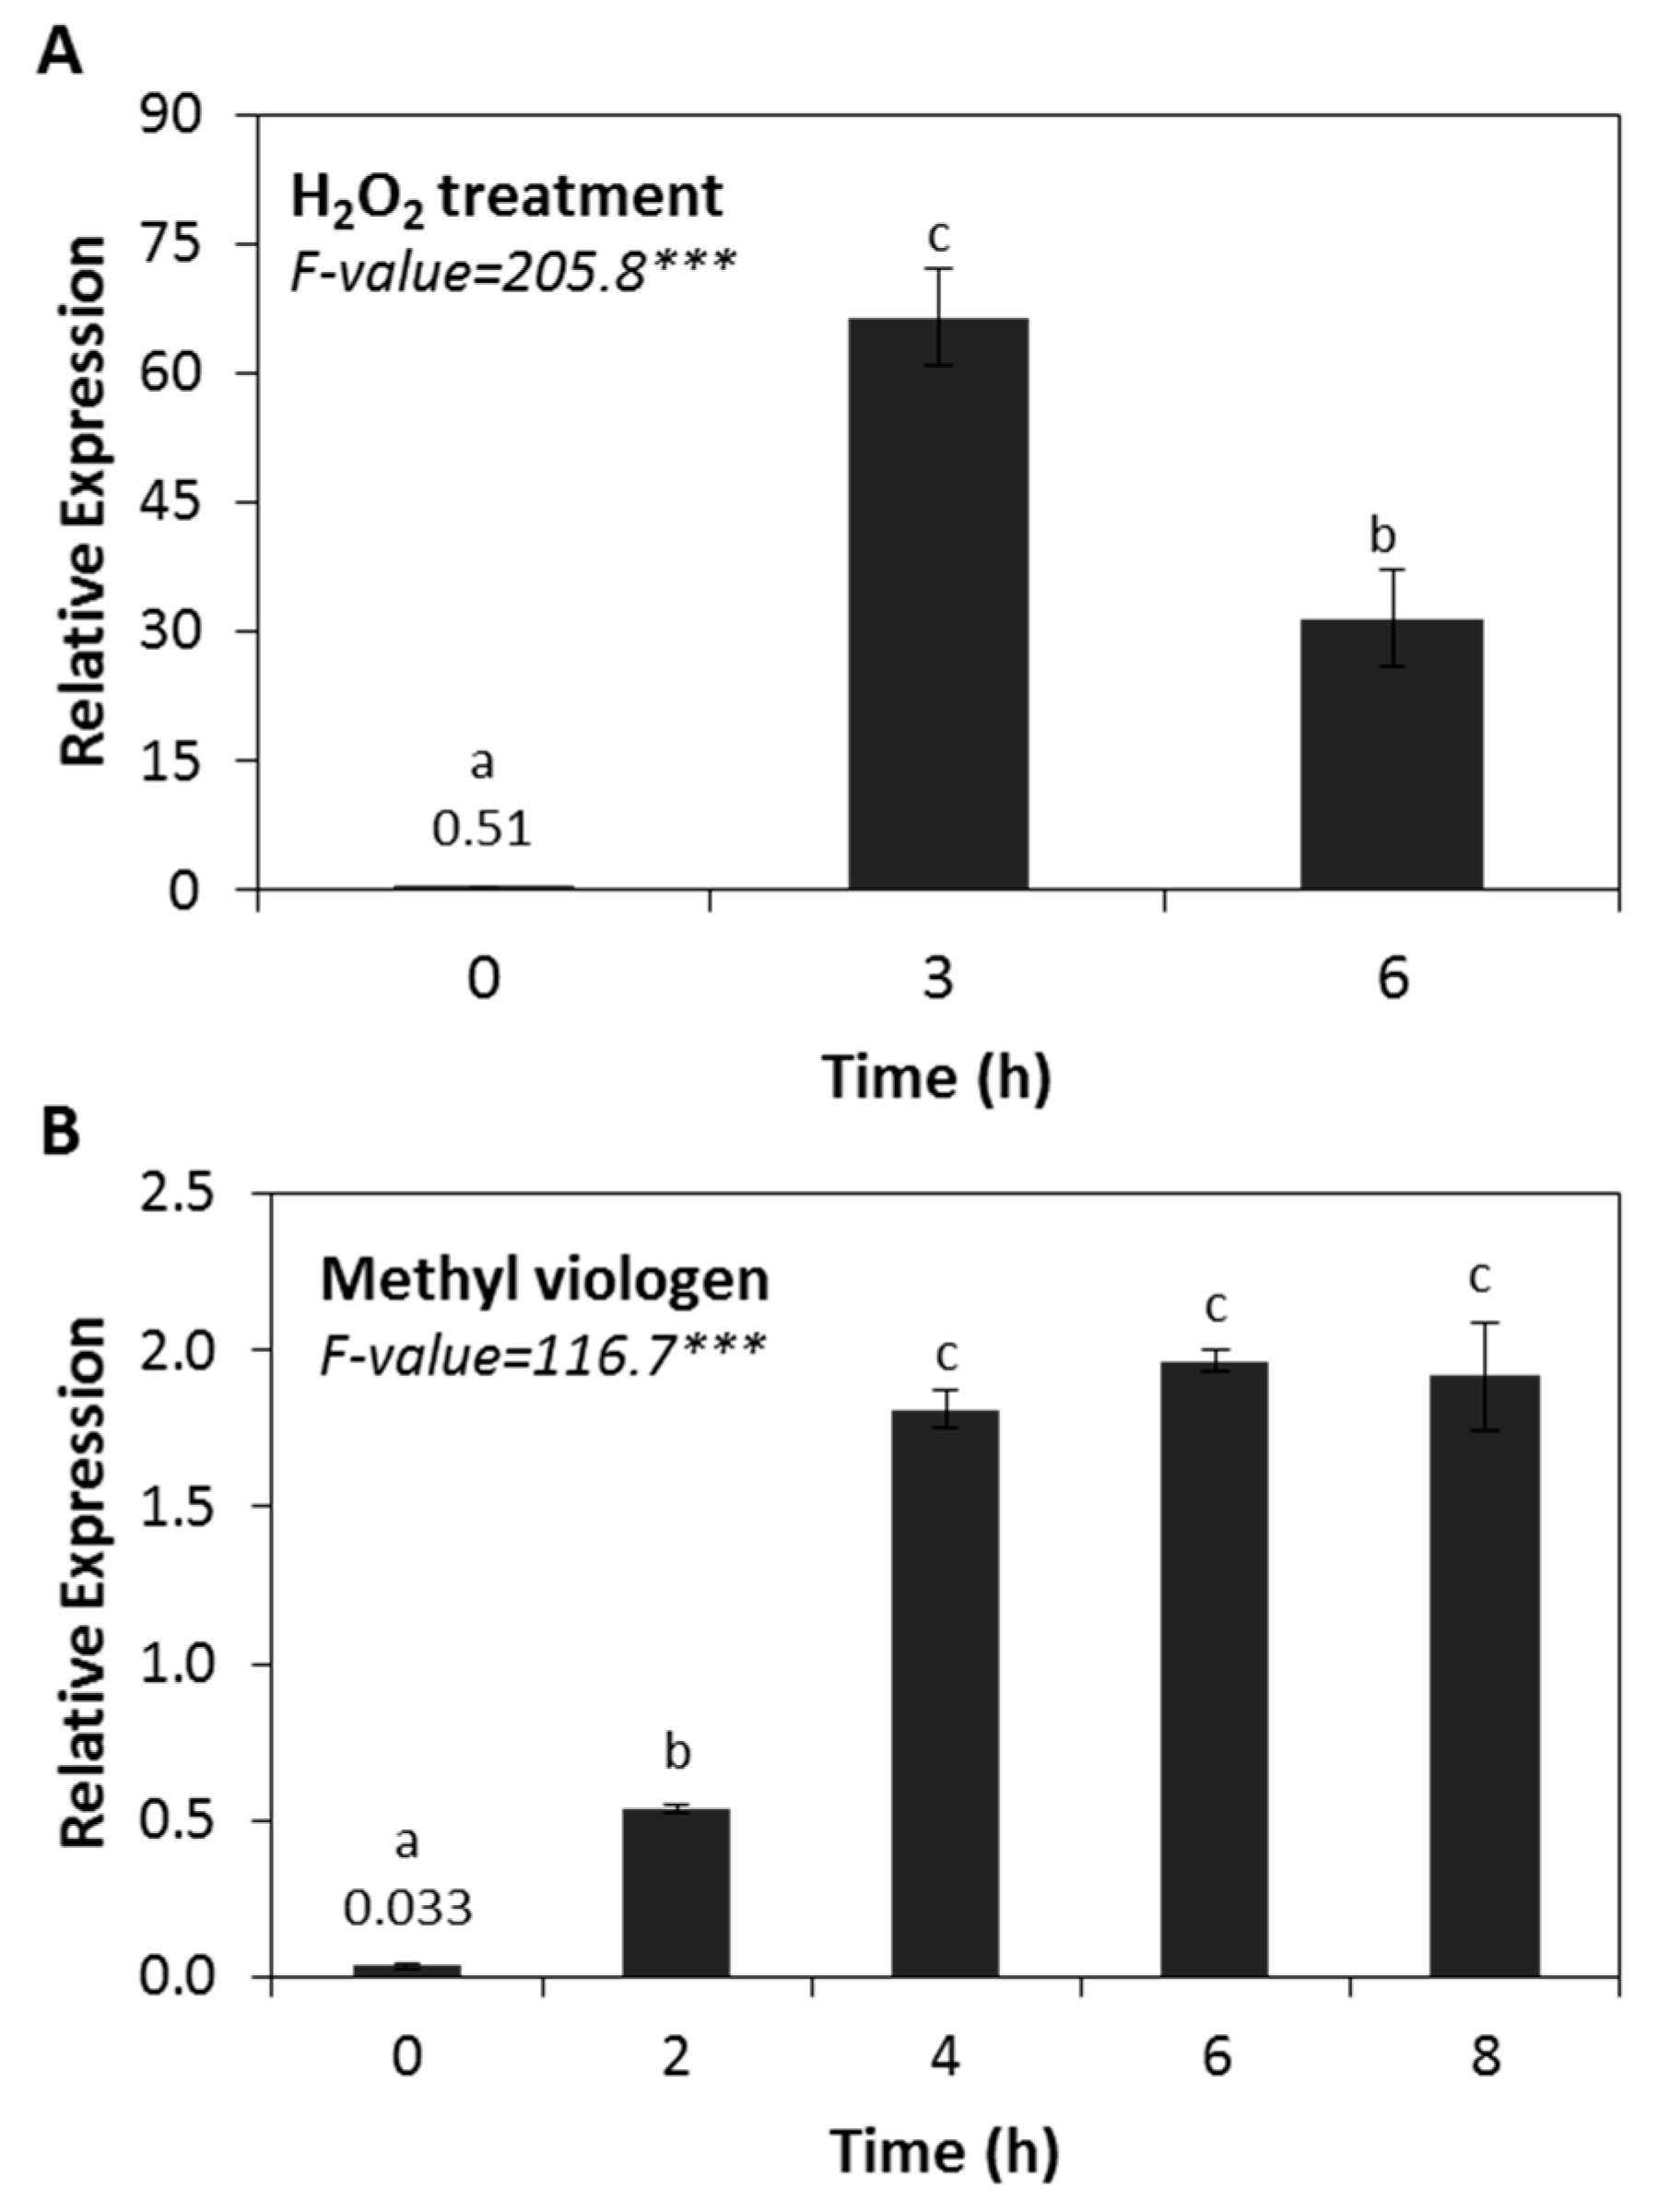
2.4. HSP17.4CI is Strongly Upregulated by Oxidative Stress Treatments
2.5. HSP17.4CI Expression is Enhanced in Mutant Plants that Accumulate Endogenous H2O2
2.6. Responsiveness of the Arabidopsis sHSPs genes to stress factors
3. Discussion
4. Materials and Methods
4.1. Plant Materials and Growth Conditions
4.2. Abiotic Stress Treatments
4.3. Biotic Stress Treatments
4.4. Plant Hormone Treatments
4.5. Oxidative Stress Treatments
4.6. Growth Conditions of Cat2-2 Plants
4.7. H2O2 Quantification
4.8. RNA Isolation and cDNA Synthesis
4.9. Real-time RT-PCR
4.10. Statistical Analysis
Supplementary Materials
Author Contributions
Funding
Acknowledgments
Conflicts of Interest
References
- Petrov, V.D.; Van Breusegem, F. Hydrogen peroxide - a central hub for information flow in plant cells. AoB Plants 2012, 2012, pls014. [Google Scholar] [CrossRef] [PubMed]
- Xia, X.J.; Zhou, Y.H.; Shi, K.; Zhou, J.; Foyer, C.H.; Yu, J.Q. Interplay between reactive oxygen species and hormones in the control of plant development and stress tolerance. J. Exp. Bot. 2015, 66, 2839–2856. [Google Scholar] [CrossRef] [PubMed]
- Caverzan, A.; Piasecki, C.; Chavarria, G.; Stewart, C.N., Jr.; Vargas, L. Defenses against ROS in crops and weeds: The effects of interference and herbicides. Int. J. Mol. Sci. 2019, 20, 1086. [Google Scholar] [CrossRef] [PubMed]
- Mittler, R.; Vanderauwera, S.; Suzuki, N.; Miller, G.; Tognetti, V.B.; Vandepoele, K.; Gollery, M.; Shulaev, V.; Van Breusegem, F. ROS signaling: The new wave. Trends Plant Sci. 2011, 16, 300–309. [Google Scholar] [CrossRef] [PubMed]
- Balazadeh, S.; Jaspert, N.; Arif, M.; Mueller-Roeber, B.; Maurino, V.G. Expression of ROS-responsive genes and transcription factors after metabolic formation of H2O2 in chloroplasts. Front. Plant Sci. 2012, 3, 234. [Google Scholar] [CrossRef] [PubMed]
- Sewelam, N.; Jaspert, N.; Van Der Kelen, K.; Tognetti, V.B.; Schmitz, J.; Frerigmann, H.; Maurino, V.G. Spatial H2O2 signaling specificity: H2O2 from chloroplasts and peroxisomes modulates the plant transcriptome differentially. Mol. Plant 2014, 7, 1191–1210. [Google Scholar] [CrossRef] [PubMed]
- Sewelam, N.; Kazan, K.; Schenk, P.M. Global plant stress signaling: Reactive oxygen species at the cross-road. Front. Plant Sci. 2016, 7, 187. [Google Scholar] [CrossRef] [PubMed]
- Katano, K.; Honda, K.; Suzuki, N. Integration between ROS regulatory systems and other signals in the regulation of various types of heat responses in plants. Int. J. Mol. Sci. 2018, 19, 3370. [Google Scholar] [CrossRef]
- Kollist, H.; Zandalinas, S.; Sengupta, S.; Nuhkat, M.; Kangasjärvi, J.; Mittler, R. Rapid responses to abiotic stress: Priming the landscape for the signal transduction network. Trends Plant Sci. 2019, 24, 25–37. [Google Scholar] [CrossRef]
- Miller, G.; Mittler, R. Could heat shock transcription factors function as hydrogen peroxide sensors in plants? Annals Bot. 2006, 98, 279–288. [Google Scholar] [CrossRef]
- Scarpeci, T.E.; Zanor, M.I.; Valle, E.M. Investigating the role of plant heat shock proteins during oxidative stress. Plant Signal. Behav. 2008, 3, 856–857. [Google Scholar] [CrossRef] [PubMed]
- Mubarakshina, M.M.; Ivanov, B.N.; Naydov, I.A.; Hillier, W.; Badger, M.R.; Krieger-Liszkay, A. Production and diffusion of chloroplastic H2O2 and its implication to signaling. J. Exp. Bot. 2010, 61, 3577–3587. [Google Scholar] [CrossRef] [PubMed]
- Borisova, M.M.; Kozuleva, M.A.; Rudenko, N.N.; Naydov, I.A.; Klenina, I.B.; Ivanov, B.N. Photosynthetic electron flow to oxygen and diffusion of hydrogen peroxide through the chloroplast envelope via aquaporins. Biochim. Biophys. Acta 2012, 1817, 1314–1321. [Google Scholar] [CrossRef] [PubMed]
- Gasch, A.; Spellman, P.; Kao, C.; Harel, O.; Eisen, M.; Storz, G.; Botstein, D.; Brown, P.O. Genomic expression programs in the response of yeast cells to environmental changes. Mol. Biol. Cell 2000, 11, 4241–4257. [Google Scholar] [CrossRef]
- Desikan, R.; Soheila, A.H.; Hancock, J.T.; Neill, S.J. Regulation of the Arabidopsis transcriptome by oxidative stress. Plant physiol. 2001, 127, 159–172. [Google Scholar] [CrossRef]
- Scarpeci, T.E.; Zanor, M.I.; Carrillo, N.; Mueller-Roeber, B.; Valle, E.M. Generation of superoxide anion in chloroplasts of Arabidopsis thaliana during active photosynthesis: A focus on rapidly induced genes. Plant Mol. Biol. 2008, 66, 361–378. [Google Scholar] [CrossRef]
- Vierling, E. The roles of heat shock proteins in plants. Ann. Rev. Plant Physiol. Plant Mol. Biol. 1991, 432, 579–620. [Google Scholar] [CrossRef]
- Boston, R.S.; Viitanen, P.V.; Vierling, E. Molecular chaperones and protein folding in plants. In Post-Transcriptional Control of Gene Expression in Plants; Filipowicz, W., Hohn, T., Eds.; Springer: Dordrecht, Netherlands, 1996; Volume 32, (1–2), pp. 191–222. [Google Scholar]
- Grigorova, B.; Vaseva, I.I.; Demirevska, K.; Feller, U. Expression of selected heat shock proteins after individually applied and combined drought and heat stress. Acta Physiol. Plant. 2011, 33, 2041. [Google Scholar] [CrossRef]
- Cao, F.; Cheng, H.; Cheng, S.; Li, L.; Xu, F.; Yu, W.; Yuan, H. Expression of selected Ginkgo biloba heat shock protein genes after cold treatment could be induced by other abiotic stress. Int. J. Mol. Sci. 2012, 13, 5768. [Google Scholar] [CrossRef]
- Li, Z.Y.; Long, R.C.; Zhang, T.J.; Yang, Q.C.; Kang, J.M. Molecular cloning and characterization of the MsHSP17.7 gene from Medicago sativa L. Mol. Biol. Rep. 2016, 43, 815–826. [Google Scholar] [CrossRef]
- Muthusamy, S.K.; Dalal, M.; Chinnusamy, V.; Bansal, K.C. Genome-wide identification and analysis of biotic and abiotic stress regulation of small heat shock protein (HSP20) family genes in bread wheat. J. Plant Physiol. 2017, 211, 100–113. [Google Scholar] [CrossRef] [PubMed]
- Liu, J.; Wang, R.; Liu, W.; Zhang, H.; Guo, Y.; Wen, R. Genome-wide characterization of heat-shock protein 70s from Chenopodium quinoa and expression analyses of Cqhsp70s in response to drought stress. Genes (Basel) 2018, 9, 35. [Google Scholar] [CrossRef] [PubMed]
- Wang, W.; Vinocur, B.; Shoseyov, O.; Altman, A. Role of plant heat shock proteins and molecular chaperones in the abiotic stress response. Trends Plant Sci. 2004, 9, 244–252. [Google Scholar] [CrossRef] [PubMed]
- Fu, X. Chaperone function and mechanism of small heat-shock proteins. Acta Biochim. Biophys. Sin. (Shanghai) 2014, 46, 347–356. [Google Scholar] [CrossRef] [PubMed]
- Lavania, D.; Siddiqui, M.H.; Al-Whaibi, M.H.; Singh, A.K.; Kumar, R.; Grover, A. Genetic approaches for breeding heat stress tolerance in faba bean (Vicia faba L.). Acta Physiol. Plant. 2015, 37, 1737. [Google Scholar] [CrossRef]
- Fragkostefanakis, S.; Röth, S.; Schleiff, E.; Scharf, K.D. Prospects of engineering thermotolerance in crops through modulation of heat stress transcription factor and heat shock protein networks. Plant Cell Environ. 2015, 38, 1881–1895. [Google Scholar] [CrossRef]
- Jiang, Y.; Zheng, Q.; Chen, L.; Liang, Y.; Wu, J. Ectopic overexpression of maize heat shock transcription factor gene ZmHsf04 confers increased thermo and salt-stress tolerance in transgenic Arabidopsis. Acta Physiol. Plant. 2018, 40, 9. [Google Scholar] [CrossRef]
- Sable, A.; Rai, K.M.; Choudhary, A.; Yadav, V.K.; Agarwal, S.K.; Sawant, S.V. Inhibition of heat shock proteins HSP90 and HSP70 induce oxidative stress, suppressing cotton fiber development. Sci. Rep. 2018, 8, 3620. [Google Scholar] [CrossRef]
- Vierling, E. The small heat shock proteins in plants are members of an ancient family of heat induced proteins. Acta Physiol. Plant. 1997, 19, 539. [Google Scholar] [CrossRef]
- Nakamoto, H.; Vigh, L. The small heat shock proteins and their clients. Cell Mol. Life Sci. 2007, 64, 294–306. [Google Scholar] [CrossRef]
- Waters, E.R. The evolution, function, structure, and expression of the plant sHSPs. J. Exp. Bot. 2013, 64, 391–403. [Google Scholar] [CrossRef] [PubMed]
- He, Y.; Fan, M.; Sun, Y.; Li, L. Genome-wide analysis of watermelon HSP20s and their expression profiles and subcellular locations under stresses. Int. J. Mol. Sci. 2018, 20, 12. [Google Scholar] [CrossRef] [PubMed]
- Sewelam, N.; Oshima, Y.; Mitsuda, N.; Ohme-Takagi, M. A step towards understanding plant responses to multiple environmental stresses: A genome-wide study. Plant Cell Environ. 2014, 37, 2024–2035. [Google Scholar] [CrossRef] [PubMed]
- Sun, W.; Van Montagu, M.; Verbruggen, N. Small heat shock proteins and stress tolerance in plants. Biochim. Biophys. Acta 2002, 1577, 1–9. [Google Scholar] [CrossRef]
- Yang, M.; Zhang, Y.; Zhang, H.; Wang, H.; Wei, T.; Che, S.; Zhang, L.; Hu, B.; Long, H.; Song, W.; et al. Identification of MsHsp20 gene family in Malus sieversii and functional characterization of MsHsp16.9 in heat tolerance. Front. Plant Sci. 2017, 8, 1761. [Google Scholar] [CrossRef] [PubMed]
- Dobson, C.M. Protein folding and misfolding. Nature 2003, 426, 884–890. [Google Scholar] [CrossRef]
- McHaourab, H.S.; Godar, J.A.; Stewart, P.L. Structure and mechanism of protein stability sensors: Chaperone activity of small heat shock proteins. Biochem. 2009, 48, 3828–3837. [Google Scholar] [CrossRef]
- Jacob, P.; Hirt, H.; Bendahmane, A. The heat-shock protein/chaperone network and multiple stress resistance. Plant Biotechnol. J. 2017, 15, 405–414. [Google Scholar] [CrossRef]
- Hilton, G.R.; Lioe, H.; Stengel, F.; Baldwin, A.J.; Benesch, J.L.P. Small heat-shock proteins: Paramedics of the cell. Topics Curr. Chem. 2013, 328, 69–98. [Google Scholar]
- Mogk, A.; Schlieker, C.; Friedrich, K.L.; Schönfeld, H.J.; Vierling, E.; Bukau, B. Refolding of substrates bound to small HSPs relies on a disaggregation reaction mediated most efficiently by ClpB/DnaK. J. Biol. Chem. 2003, 278, 31033–31042. [Google Scholar] [CrossRef]
- Balogi, Z.; Torok, Z.; Balogh, G.; Josvay, K.; Shigapova, N.; Vierling, E.; Vígh, L.; Horváth, I. “Heat shock lipid” in cyanobacteria during heat/light-acclimation. Arch. Biochem. Biophys. 2005, 436, 346–354. [Google Scholar] [CrossRef] [PubMed]
- Neta-Sharir, I.; Isaacson, T.; Lurie, S.; Weiss, D. Dual role for tomato heat shock protein 21: Protecting photosystem II from oxidative stress and promoting color changes during fruit maturation. Plant Cell 2005, 17, 1829–1838. [Google Scholar] [CrossRef]
- Guo, S.J.; Zhoua, H.Y.; Zhanga, X.S.; Lic, X.G.; Menga, Q.W. Overexpression of CaHSP26 in transgenic tobacco alleviates photoinhibition of PSII and PSI during chilling stress under low irradiance. J. Plant Physiol. 2007, 164, 126–136. [Google Scholar] [CrossRef] [PubMed]
- Mu, C.; Zhang, S.; Yu, G.; Chen, N.; Li, X.; Liu, H. Overexpression of small heat shock protein LimHSP16.45 in Arabidopsis enhances tolerance to abiotic stresses. PLoS ONE 2013, 8, e82264. [Google Scholar] [CrossRef] [PubMed]
- Sewelam, N.; Kazan, K.; Thomas-Hall, S.; Kidd, B.N.; Manners, J.M.; Schenck, P.M. Ethylene response factor 6 is a regulator of reactive oxygen species signaling in Arabidopsis. PLoS ONE 2013, 8, e70289. [Google Scholar] [CrossRef] [PubMed]
- Park, C.J.; Seo, Y.S. Heat shock proteins: A review of the molecular chaperones for plant immunity. Plant Pathol. J. 2015, 31, 323–333. [Google Scholar] [CrossRef] [PubMed]
- Qu, A.L.; Ding, Y.F.; Jiang, Q.; Zhu, C. Molecular mechanisms of the plant heat stress response. Biochem. Biophys. Res. Commun. 2013, 432, 203–207. [Google Scholar] [CrossRef] [PubMed]
- Glazebrook, J. Contrasting mechanisms of defense against biotrophic and necrotrophic pathogens. Annu. Rev. Phytopathol. 2005, 43, 205–227. [Google Scholar] [CrossRef]
- Kotak, S.; Larkindale, J.; Lee, U.; von Koskull-Döring, P.; Vierling, E.; Scharf, K.D. Complexity of the heat stress response in plants. Curr. Opin. Plant Biol. 2007, 10, 310–316. [Google Scholar] [CrossRef]
- Queval, G.; Issakidis-Bourguet, E.; Hoeberichts, F.A.; Vandorpe, M.; Gakière, B.; Vanacker, H.; Miginiac-Maslow, M.; Van Breusegem, F.; Noctor, G. Conditional oxidative stress responses in the Arabidopsis photorespiratory mutant cat2 demonstrate that redox state is a key modulator of daylength-dependent gene expression, and define photoperiod as a crucial factor in the regulation of H2O2-induced cell death. Plant J. 2007, 52, 640–657. [Google Scholar]
- Davletova, S.; Schlauch, K.; Coutu, J.; Mittler, R. The zinc-finger protein Zat12 plays a central role in reactive oxygen and abiotic stress signaling in Arabidopsis. Plant Physiol. 2005, 139, 847–856. [Google Scholar] [CrossRef] [PubMed]
- Uniport. Available online: https://www.uniprot.org/ (accessed on 28 May 2019).
- The Arabidopsis Information Resource (TAIR). Available online: https://www.arabidopsis.org/index.jsp (accessed on 28 May 2019).
- Wrzaczek, M.; Brosché, M.; Kangasjärvi, J. ROS signaling loops—production, perception, regulation. Curr. Opin. Plant Biol. 2013, 16, 575–582. [Google Scholar] [CrossRef] [PubMed]
- Kaur, H.; Petla, B.P.; Kamble, N.U.; Singh, A.; Rao, V.; Salvi, P.; Ghosh, S.; Majee, M. Differentially expressed seed aging responsive heat shock protein OsHSP18.2 implicates in seed vigor, longevity and improves germination and seedling establishment under abiotic stress. Front. Plant Sci. 2015, 6, 713. [Google Scholar] [CrossRef] [PubMed]
- Ham, D.J.; Moon, J.C.; Hwang, S.G.; Jang, C.S. Molecular characterization of two small heat shock protein genes in rice: Their expression patterns, localizations, networks, and heterogeneous overexpressions. Mol. Biol. Rep. 2013, 40, 6709–6720. [Google Scholar] [CrossRef] [PubMed]
- Lee, J.H.; Yun, H.S.; Kwon, C. Molecular communications between plant heat shock responses and disease resistance. Mol. Cells 2012, 34, 109–116. [Google Scholar] [CrossRef] [PubMed]
- Van Ooijen, G.; Lukasik, E.; Van Den Burg, H.A.; Vossen, J.H.; Cornelissen, B.J.; Takken, F.L. The small heat shock protein 20 RSI2 interacts with and is required for stability and function of tomato resistance protein I-2. Plant J. 2010, 63, 563–572. [Google Scholar] [CrossRef]
- Larkindale, J.; Huang, B. Thermotolerance and antioxidant systems in Agrostis stolonifera: Involvement of salicylic acid, abscisic acid, calcium, hydrogen peroxide, and ethylene. J. Plant Physiol. 2004, 161, 405–413. [Google Scholar] [CrossRef]
- Watkins, J.M.; Chapman, J.M.; Muday, G.K. Abscisic acid-induced reactive oxygen species are modulated by flavonols to control stomata aperture. Plant physiol. 2017, 175, 1807–1825. [Google Scholar] [CrossRef]
- Asad, M.A.U.; Zakari, S.A.; Zhao, Q.; Zhou, L.; Ye, Y.; Cheng, F. Abiotic stresses intervene with ABA signaling to induce destructive metabolic pathways leading to death: Premature leaf senescence in plants. Int. J. Mol. Sci. 2019, 20, 256. [Google Scholar] [CrossRef]
- Del Río, L.A. ROS and RNS in plant physiology: An overview. J. Exp. Bot. 2015, 66, 2827–2837. [Google Scholar] [CrossRef]
- Mittler, R. ROS are good. Trends Plant Sci. 2017, 22, 11–19. [Google Scholar] [CrossRef] [PubMed]
- Murashige, T.; Skoog, F. A revised medium for rapid growth and bioassays with tobacco tissue cultures. Physiol. Plant. 1962, 15, 473–497. [Google Scholar] [CrossRef]
- Schenk, P.M.; Kazan, K.; Wilson, I.; Anderson, J.P.; Richmond, T.; Somerville, S.C.; Manners, J.M. Coordinated plant defense responses in Arabidopsis revealed by microarray analysis. Proc. Natl. Acad. Sci. USA 2000, 97, 11655–11660. [Google Scholar] [CrossRef] [PubMed]
- Chakraborty, S.; Hill, A.L.; Shirsekar, G.; Afzal, A.J.; Wang, G.L.; Mackey, D.; Bonello, P. Quantification of hydrogen peroxide in plant tissues using Amplex Red. Methods 2016, 15, 105–113. [Google Scholar] [CrossRef] [PubMed]
- Czechowski, T.; Bari, R.P.; Stitt, M.; Scheible, W.R.; Udvardi, M.K. Real-time RT-PCR profiling of over 1400 Arabidopsis transcription factors: Unprecedented sensitivity reveals novel root- and shoot-specific genes. Plant J. 2004, 38, 366–379. [Google Scholar] [CrossRef] [PubMed]


| Gene Locus | Gene Name | Expression Levels (Log FC) under Stress Treatments | Localization | |||||
|---|---|---|---|---|---|---|---|---|
| Heat | Drought | Salt | Multiple | H2O2 | MV | |||
| AT3G46230 | HSP17.4CI | 6.12 | 1.50 | 2.00 | 7.16 | 3.52 | 4.28 | Cytoplasm |
| AT1G53540 | HSP17.6C | 9.08 | 1.50 | 3.14 | 10.18 | 4.08 | 3.07 | Cytoplasm |
| AT5G12030 | HSP17.6A | 8.72 | - | 2.89 | 9.21 | 3.70 | 5.21 | Cytoplasm |
| AT5G12020 | HSP17.6 | 7.53 | - | 1.97 | 8.22 | 4.89 | 4.04 | Cytoplasm |
| AT5G51440 | HSP23.5 | 6.34 | - | 1.50 | 6.73 | 3.64 | 2.02 | Mitochondrion |
| AT2G29500 | HSP17.6B | 5.76 | - | - | 7.23 | 4.23 | 4.48 | Cytoplasm |
| AT1G59860 | HSP17.6A | 4.52 | - | - | 5.06 | 4.73 | 4.63 | Cytoplasm |
| AT1G54050 | HSP17.4B | 2.44 | - | - | 3.03 | 3.64 | 4.08 | Cytoplasm |
| AT5G37670 | HSP15.7 | 2.71 | - | - | 2.95 | 2.85 | 1.85 | Peroxisome |
| AT4G10250 | HSP22.0 | 8.33 | - | - | 10.17 | 1.53 | - | ER |
| AT4G27670 | HSP21 | 8.02 | - | - | 10.04 | 1.61 | - | Chloroplast |
| AT4G25200 | HSP23.6 | 11.23 | - | 2.73 | 12.12 | - | - | Mitochondrion |
| AT1G07400 | HSP17.8 | 5.96 | - | 1.50 | 6.91 | - | - | Cytoplasm |
| AT2G19310 | HSP18.5 | 3.47 | - | - | 3.37 | - | - | Cytoplasm |
| AT1G52560 | HSP26.5 | 2.40 | - | - | 5.12 | - | - | Mitochondrion |
| AT5G59720 | HSP18.2 | 1.99 | - | - | 3.98 | - | - | Cytoplasm |
| AT4G16550 | HSP20-like chaperone | 1.60 | 2.17 | 1.50 | 1.82 | - | - | Unknown |
| AT4G21870 | HSP20-like chaperone | - | - | - | −2.32 | - | - | Cytoplasm |
| AT1G76770 | HSP20-like chaperone | −1.79 | - | - | - | - | - | Cytoplasm |
© 2019 by the authors. Licensee MDPI, Basel, Switzerland. This article is an open access article distributed under the terms and conditions of the Creative Commons Attribution (CC BY) license (http://creativecommons.org/licenses/by/4.0/).
Share and Cite
Sewelam, N.; Kazan, K.; Hüdig, M.; Maurino, V.G.; Schenk, P.M. The AtHSP17.4C1 Gene Expression Is Mediated by Diverse Signals that Link Biotic and Abiotic Stress Factors with ROS and Can Be a Useful Molecular Marker for Oxidative Stress. Int. J. Mol. Sci. 2019, 20, 3201. https://doi.org/10.3390/ijms20133201
Sewelam N, Kazan K, Hüdig M, Maurino VG, Schenk PM. The AtHSP17.4C1 Gene Expression Is Mediated by Diverse Signals that Link Biotic and Abiotic Stress Factors with ROS and Can Be a Useful Molecular Marker for Oxidative Stress. International Journal of Molecular Sciences. 2019; 20(13):3201. https://doi.org/10.3390/ijms20133201
Chicago/Turabian StyleSewelam, Nasser, Kemal Kazan, Meike Hüdig, Veronica G. Maurino, and Peer M. Schenk. 2019. "The AtHSP17.4C1 Gene Expression Is Mediated by Diverse Signals that Link Biotic and Abiotic Stress Factors with ROS and Can Be a Useful Molecular Marker for Oxidative Stress" International Journal of Molecular Sciences 20, no. 13: 3201. https://doi.org/10.3390/ijms20133201
APA StyleSewelam, N., Kazan, K., Hüdig, M., Maurino, V. G., & Schenk, P. M. (2019). The AtHSP17.4C1 Gene Expression Is Mediated by Diverse Signals that Link Biotic and Abiotic Stress Factors with ROS and Can Be a Useful Molecular Marker for Oxidative Stress. International Journal of Molecular Sciences, 20(13), 3201. https://doi.org/10.3390/ijms20133201