Exogenous Administration of Low-Dose Lipopolysaccharide Potentiates Liver Fibrosis in a Choline-Deficient l-Amino-Acid-Defined Diet-Induced Murine Steatohepatitis Model

 ,
, 
Abstract
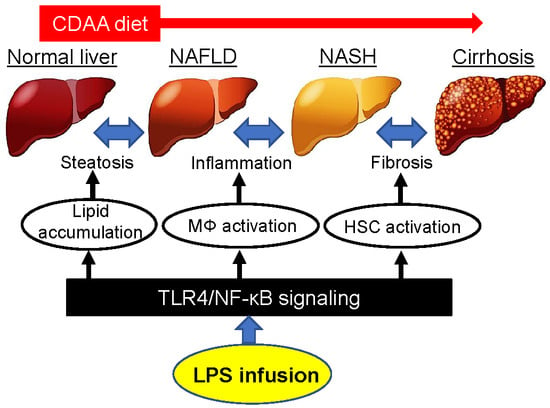
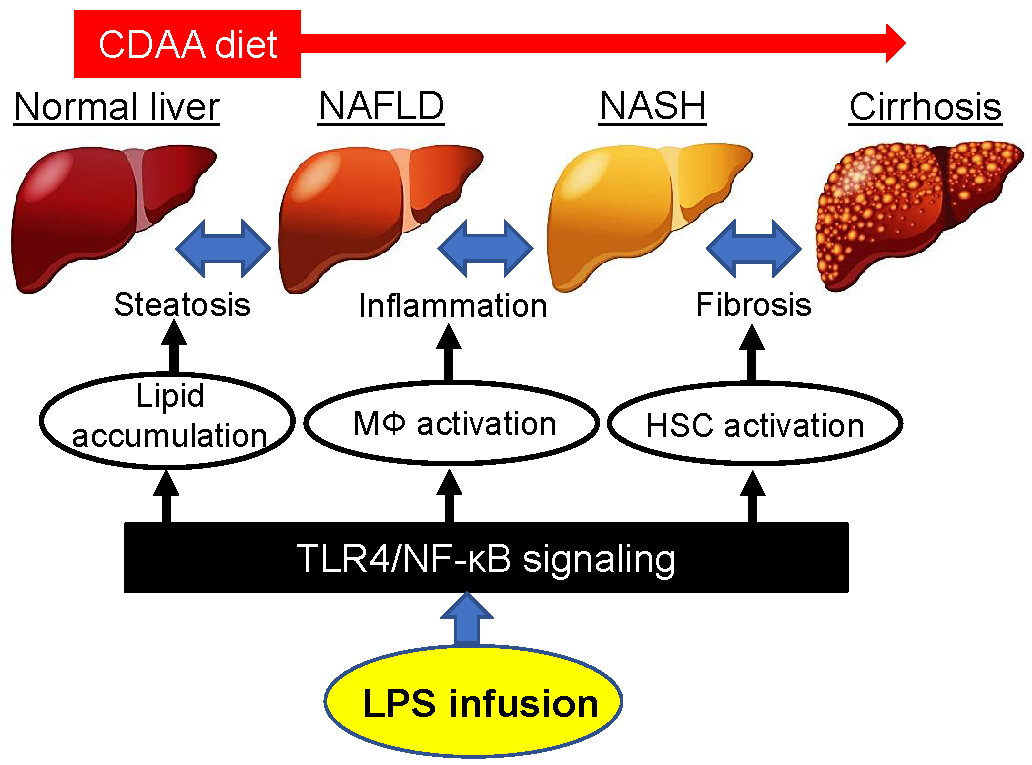
1. Introduction
2. Results
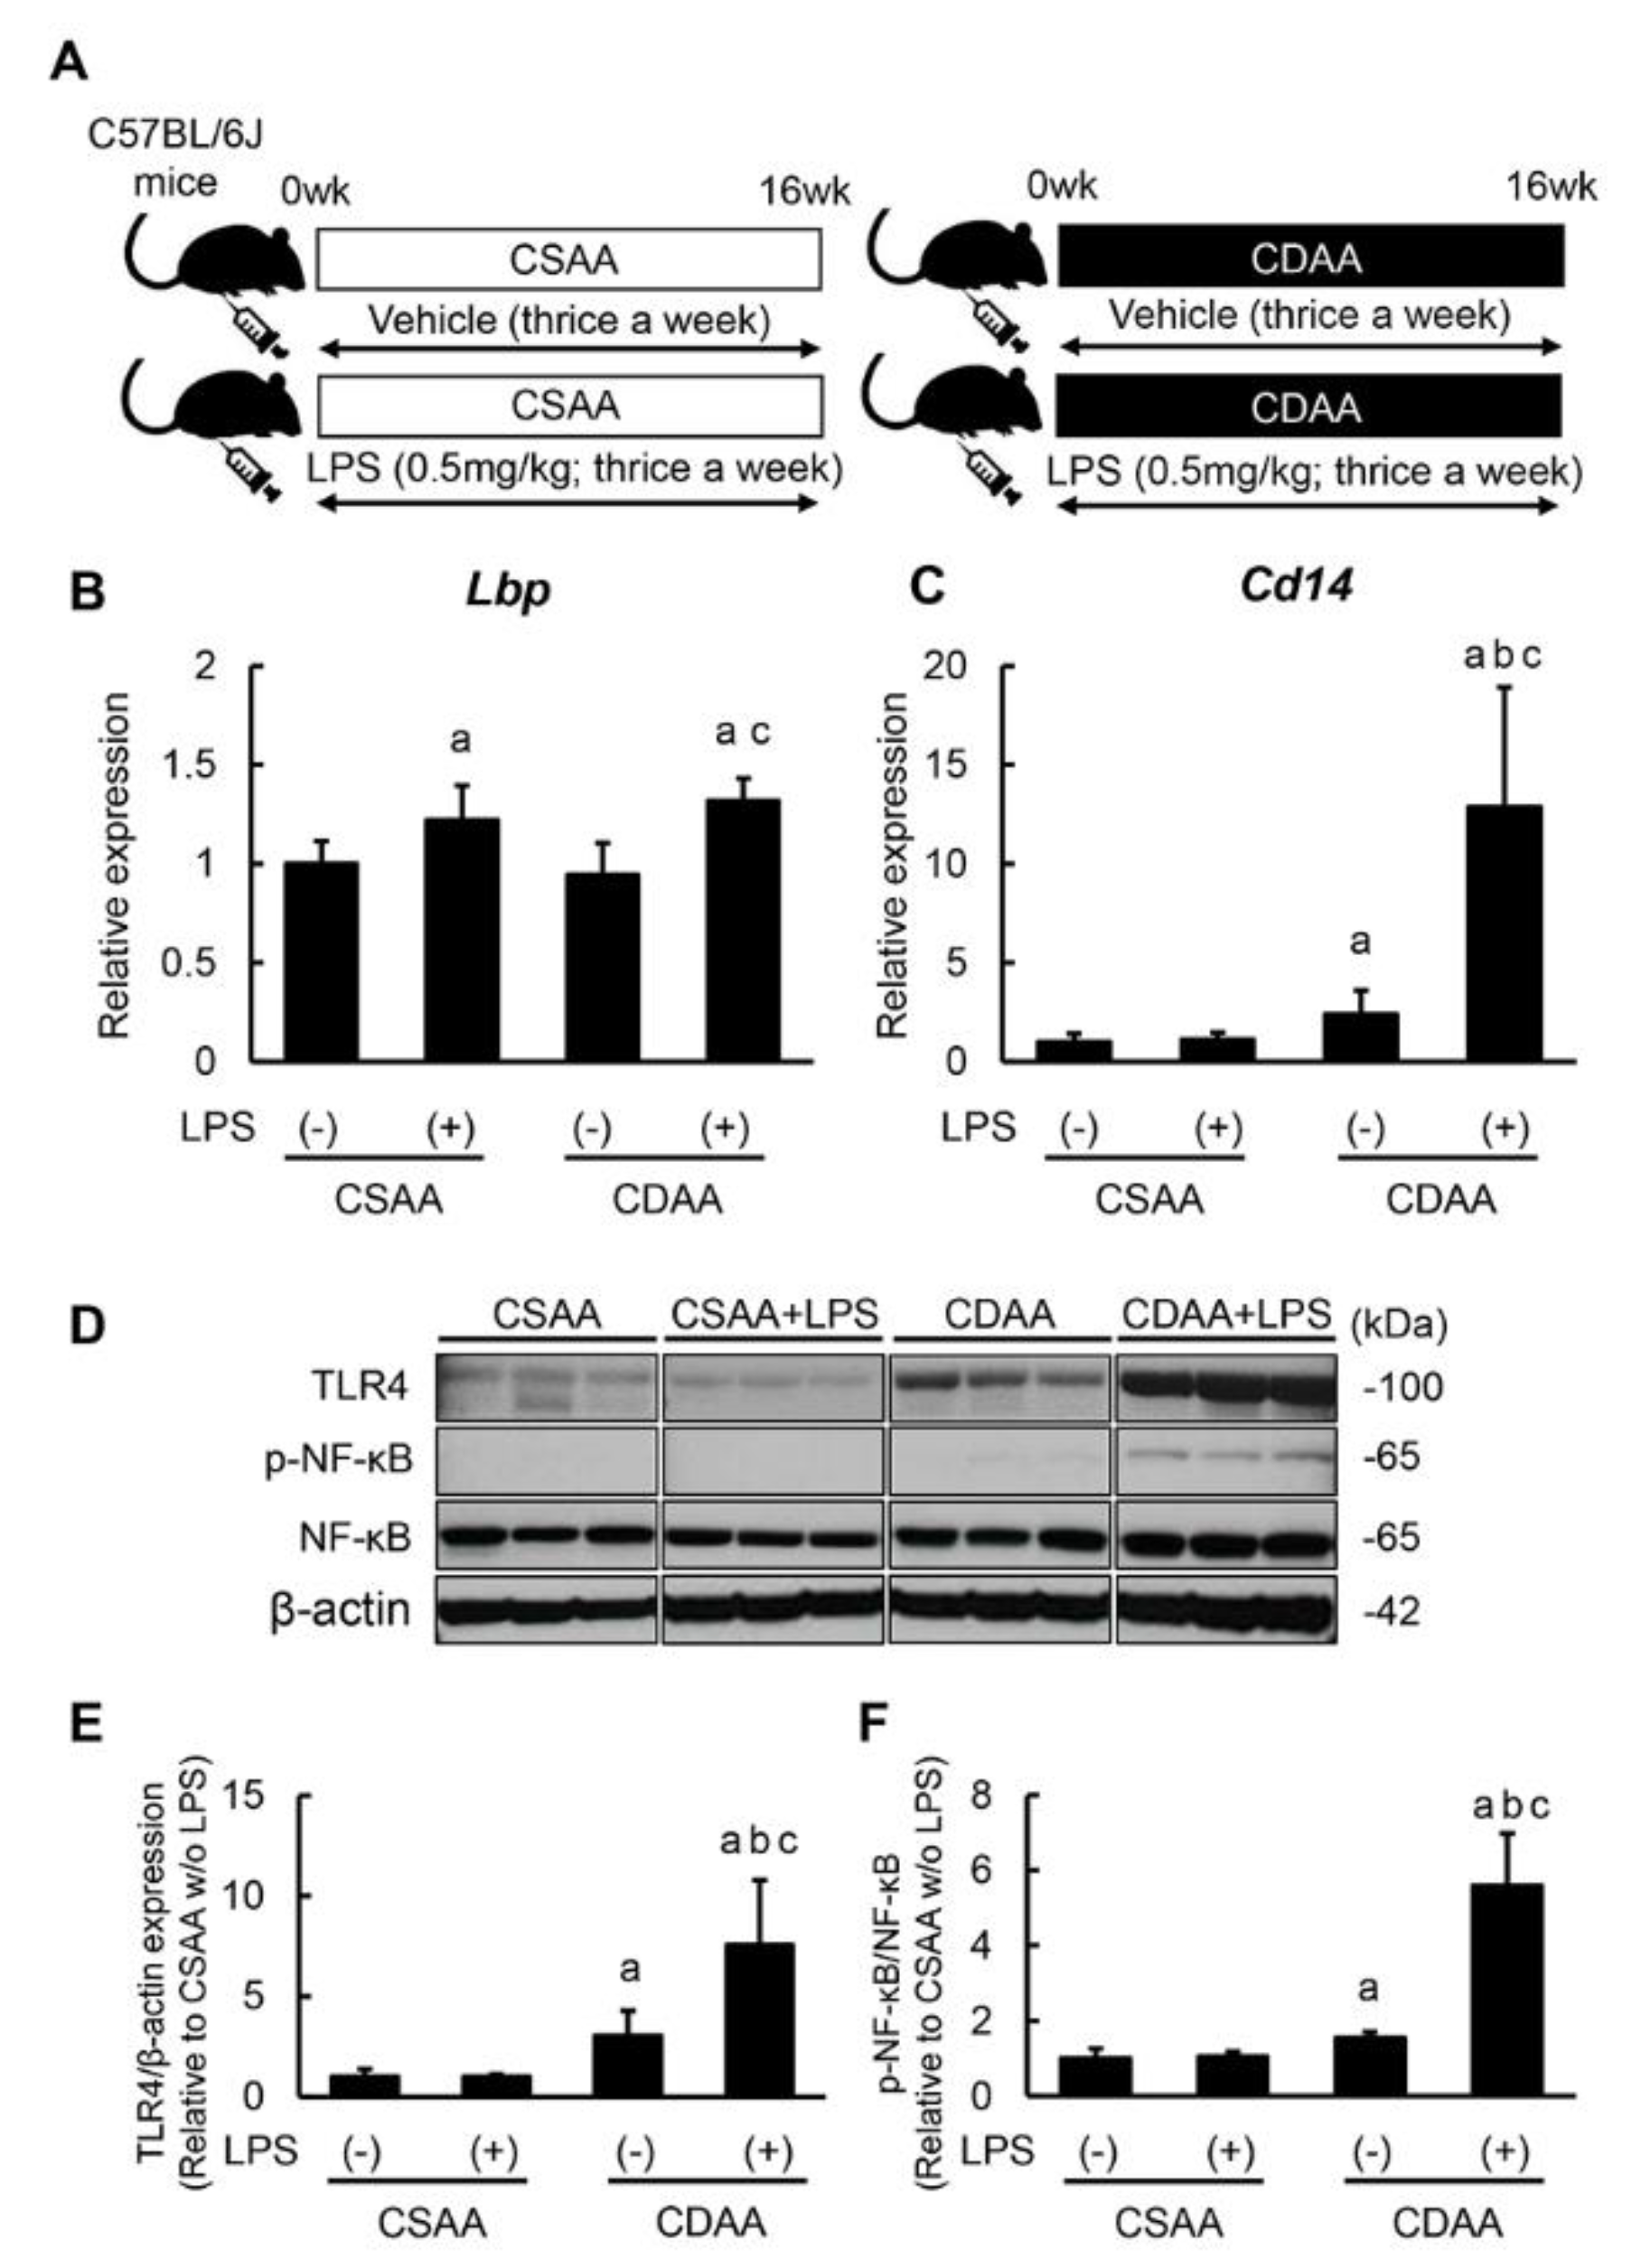
2.1. Repetitive Low-Dose LPS Infusion Triggers Activation of the TLR4/NF-κB Signaling Pathway in the Liver of CDAA-Fed Mice
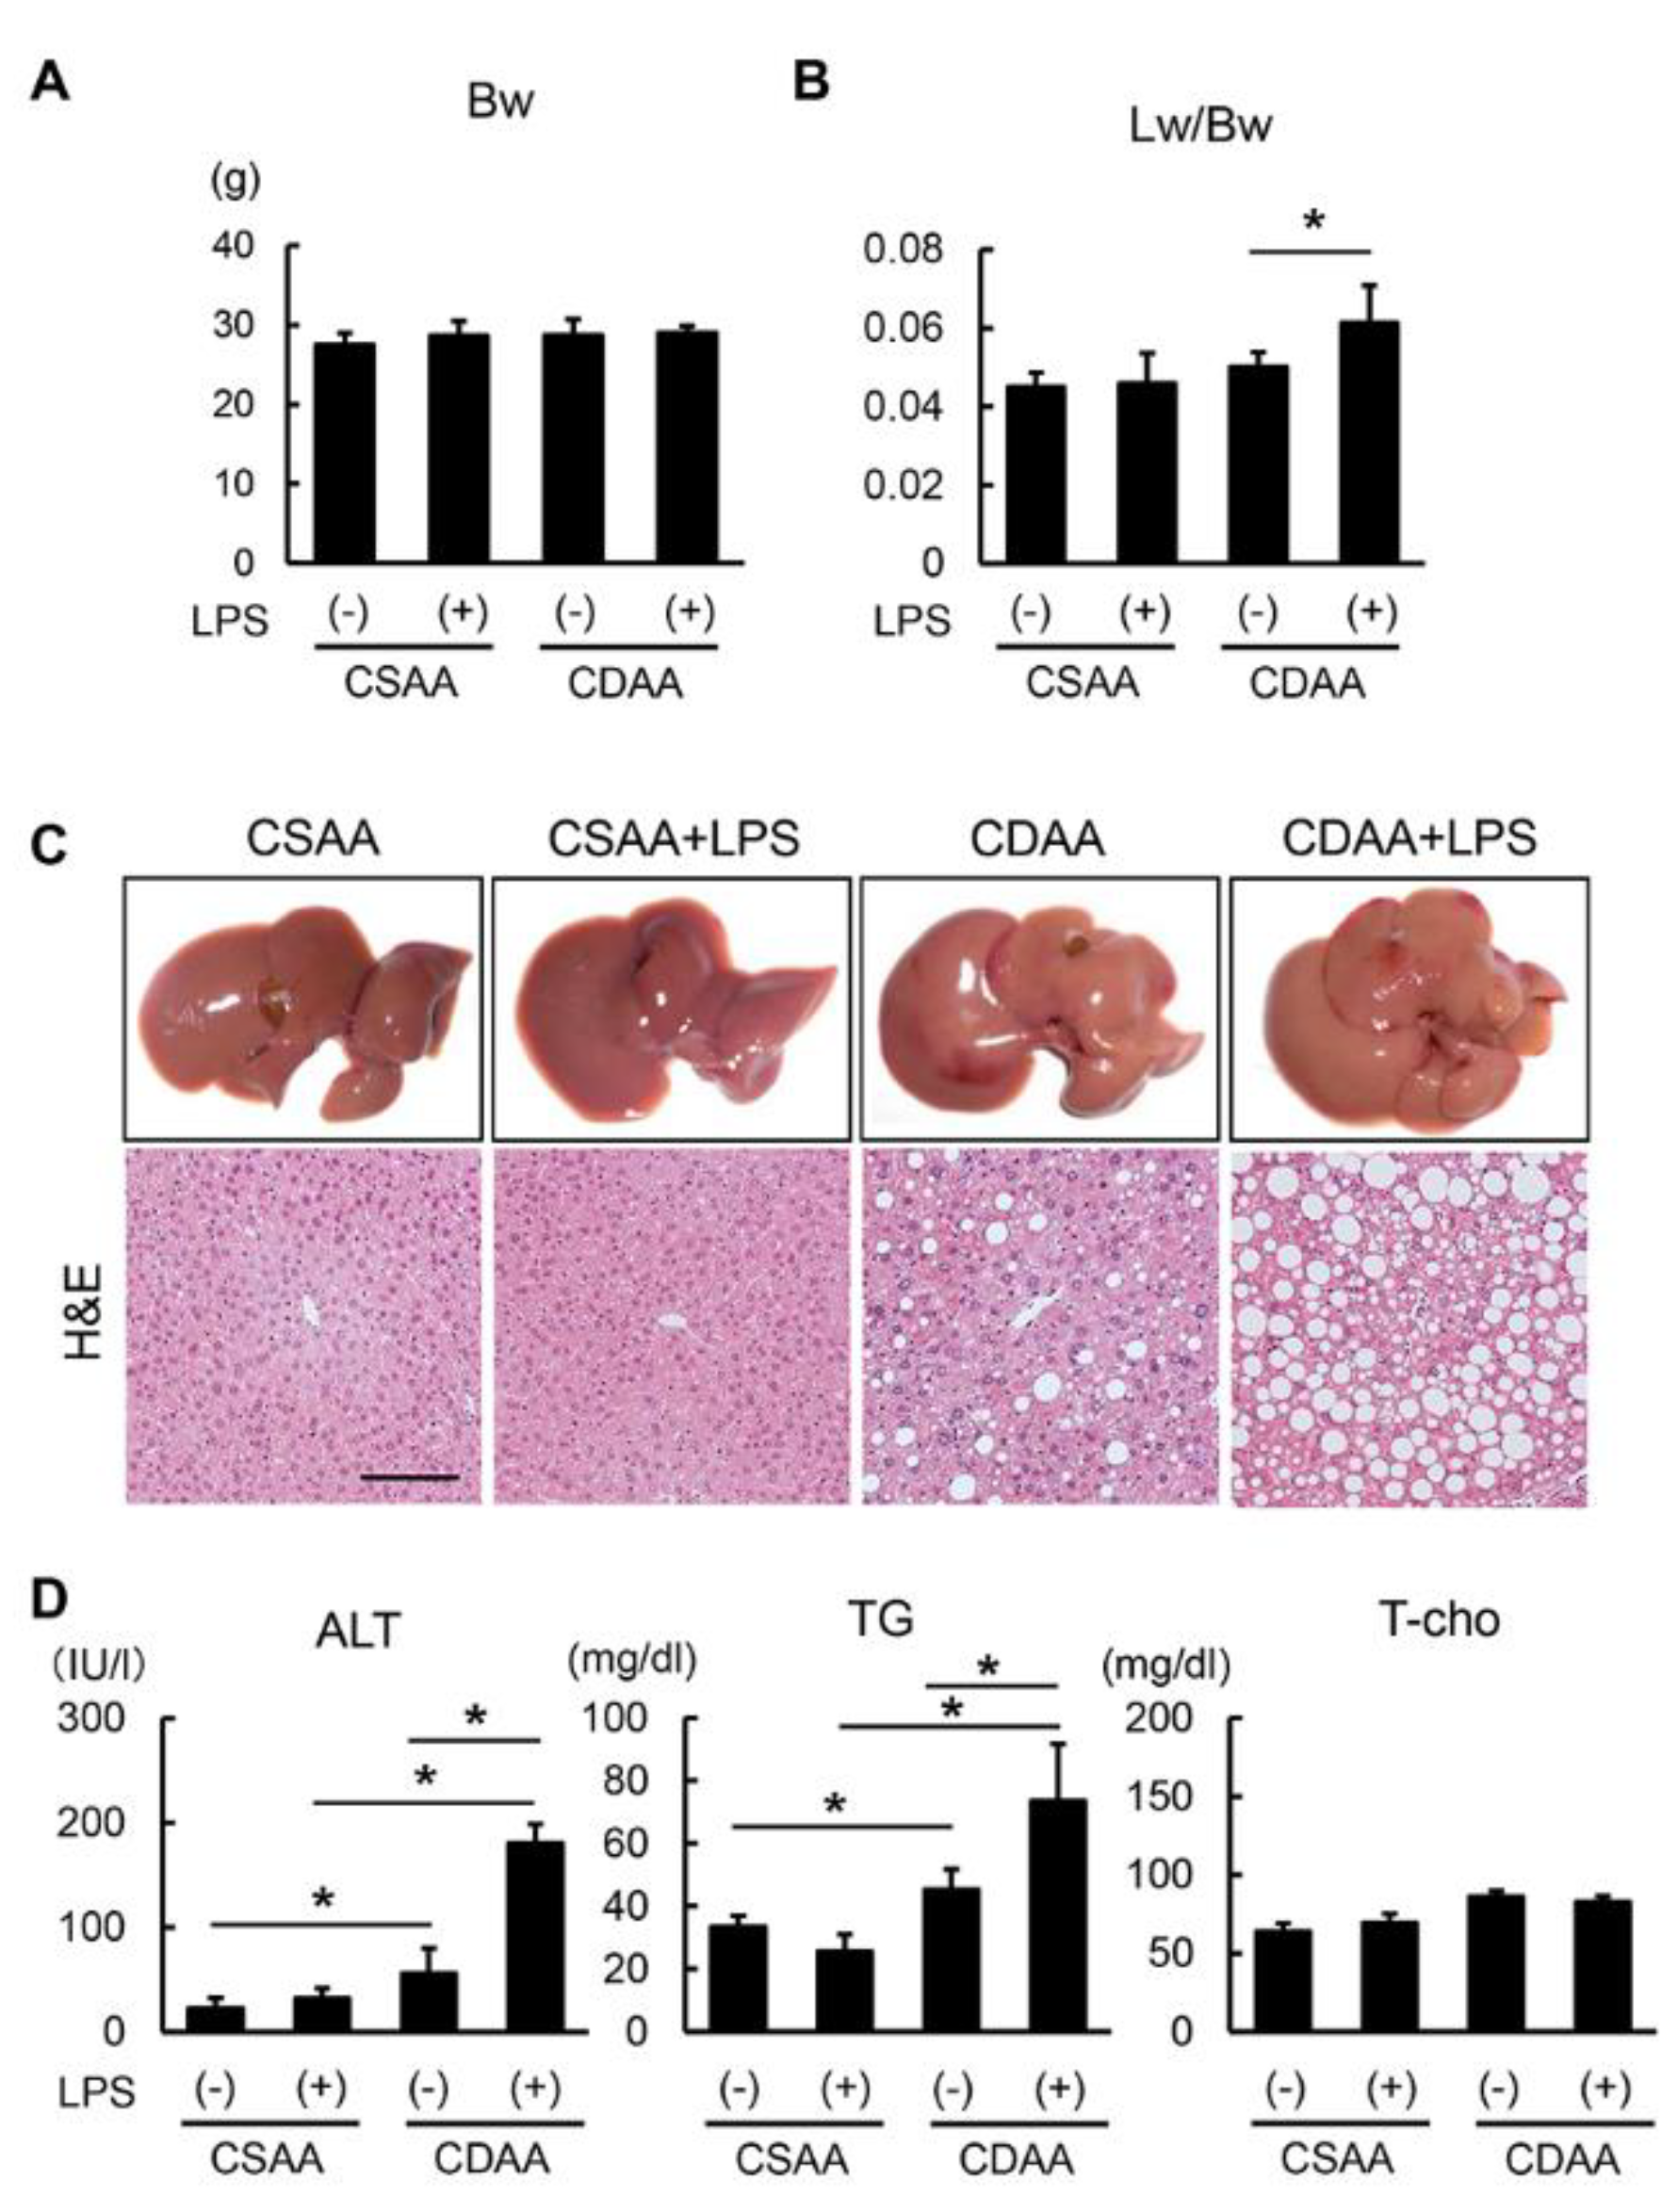
2.2. Exogenous LPS Exacerbates Steatosis in CDAA- but not in CSAA-Fed Mice
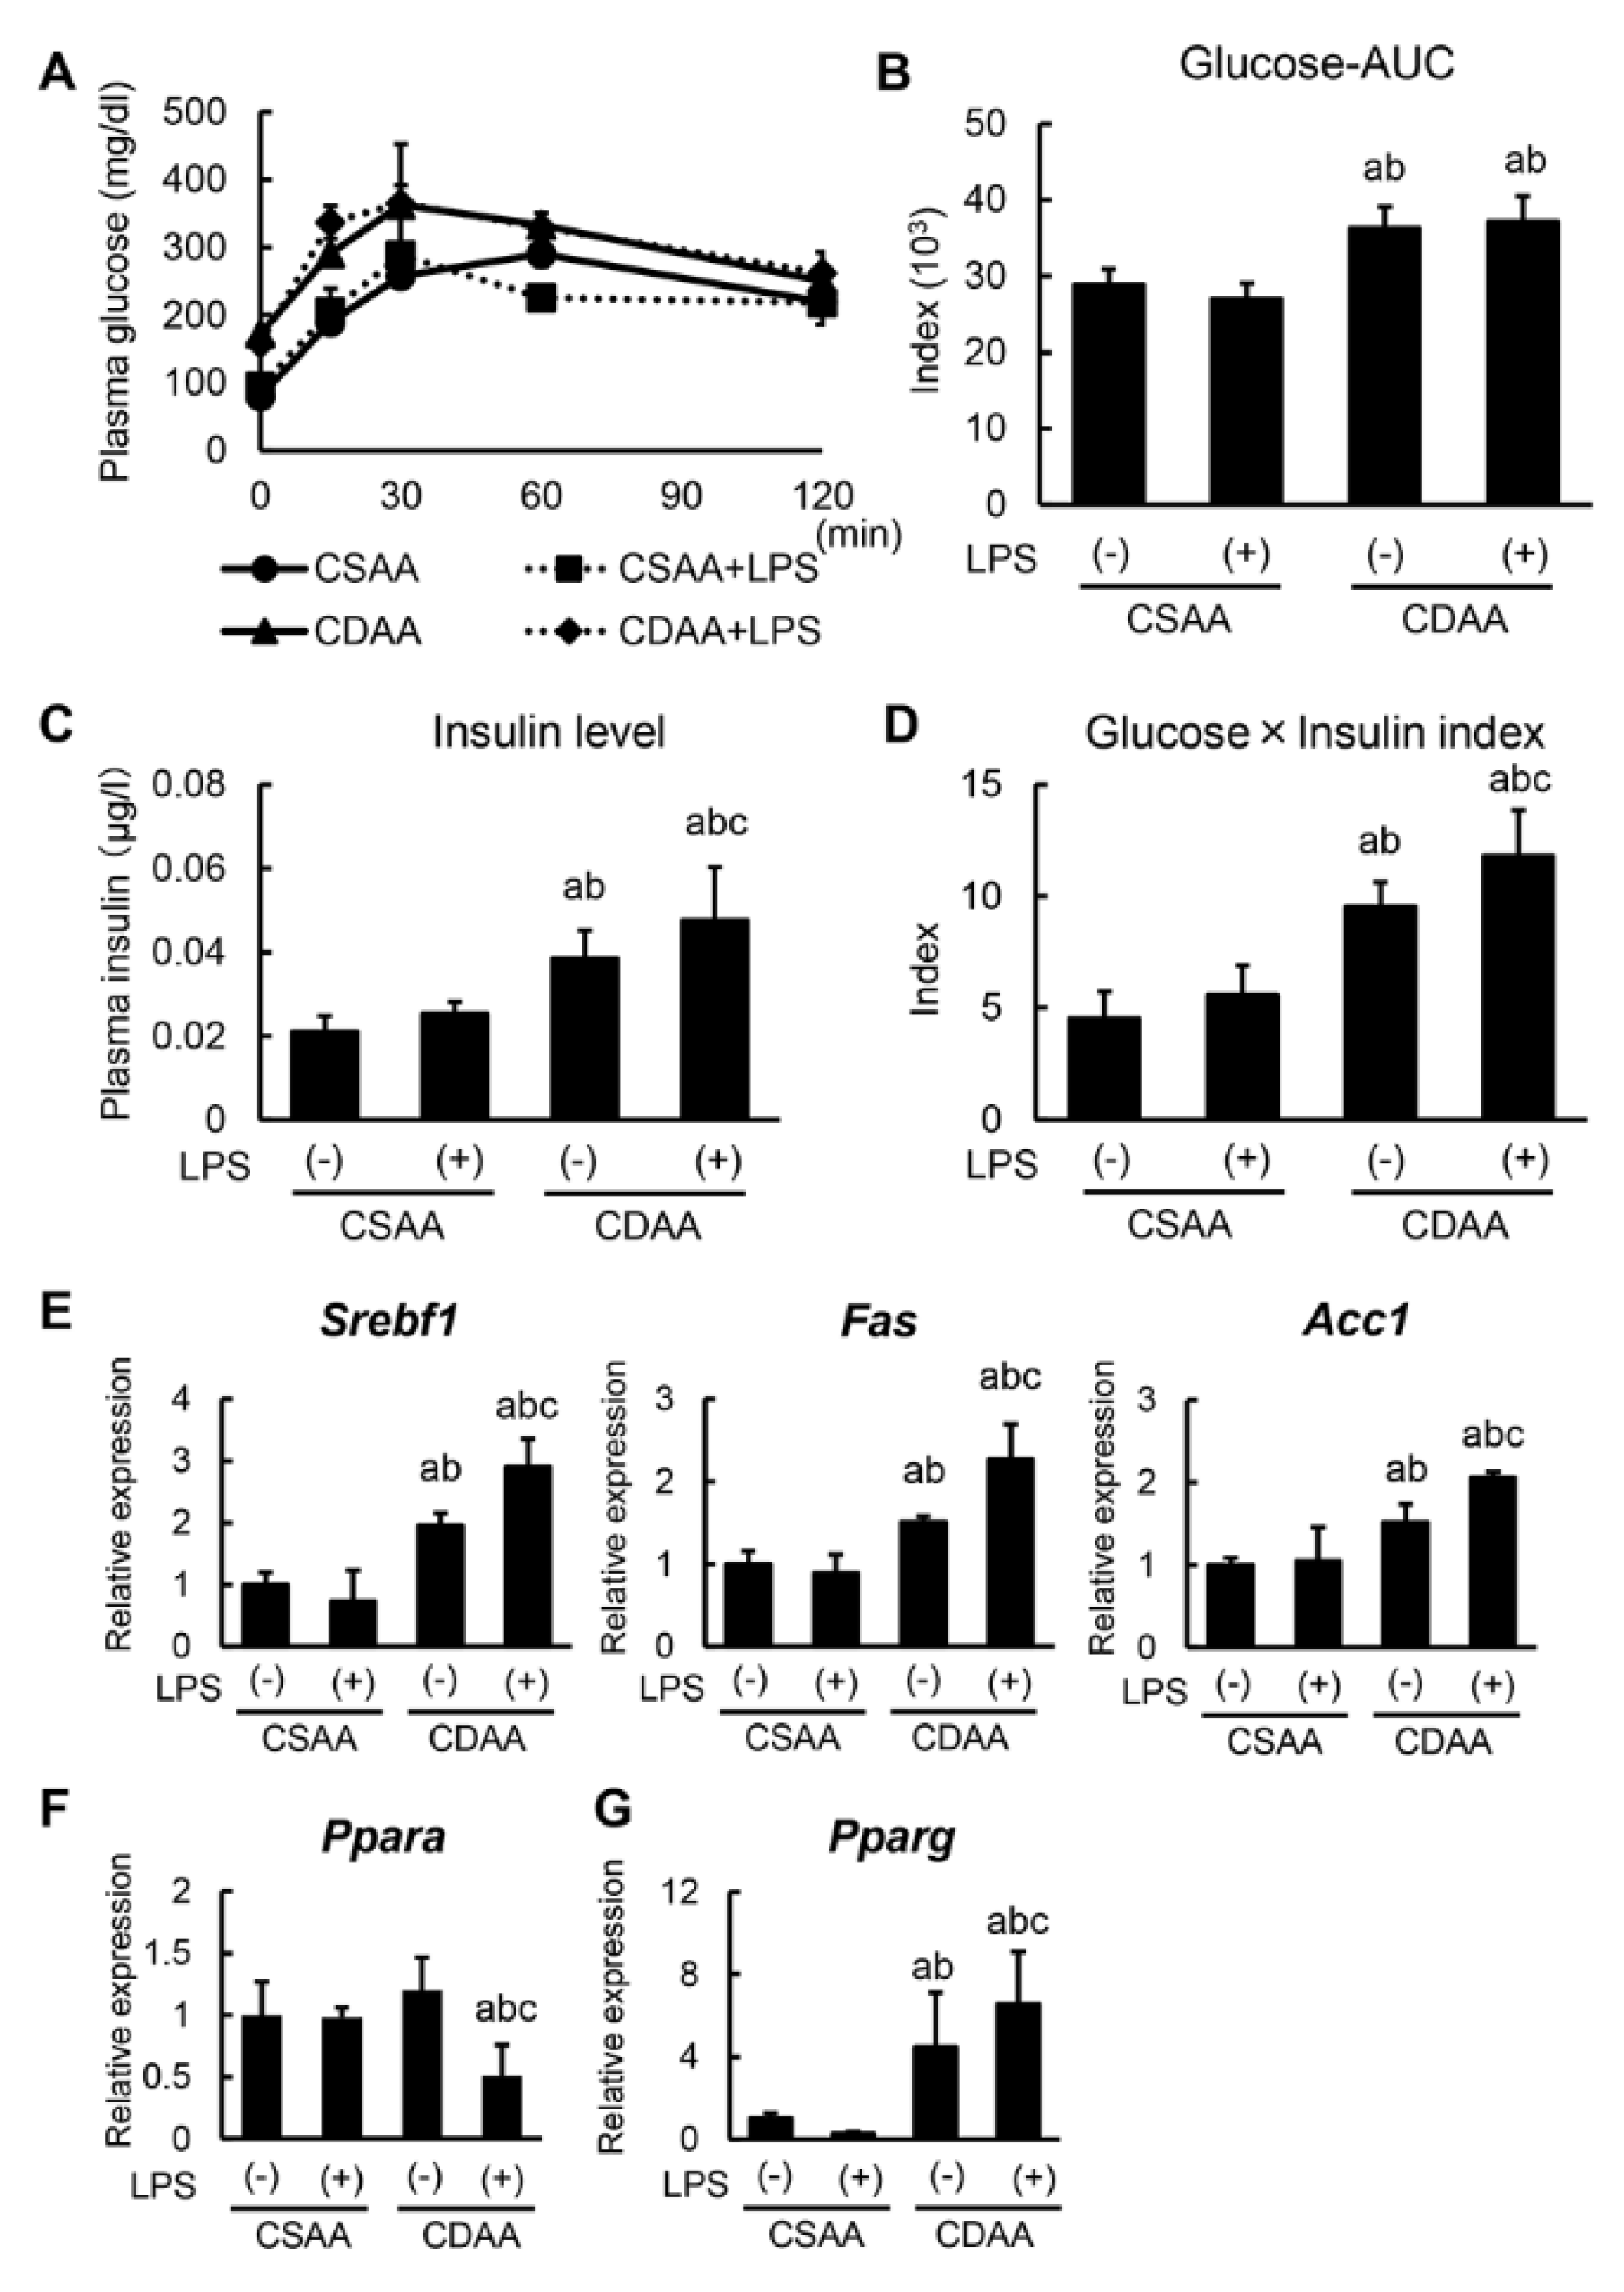
2.3. Alterations in Glucose and Lipid Metabolism Related to CDAA Diet and Low-DOSE LPS Administration
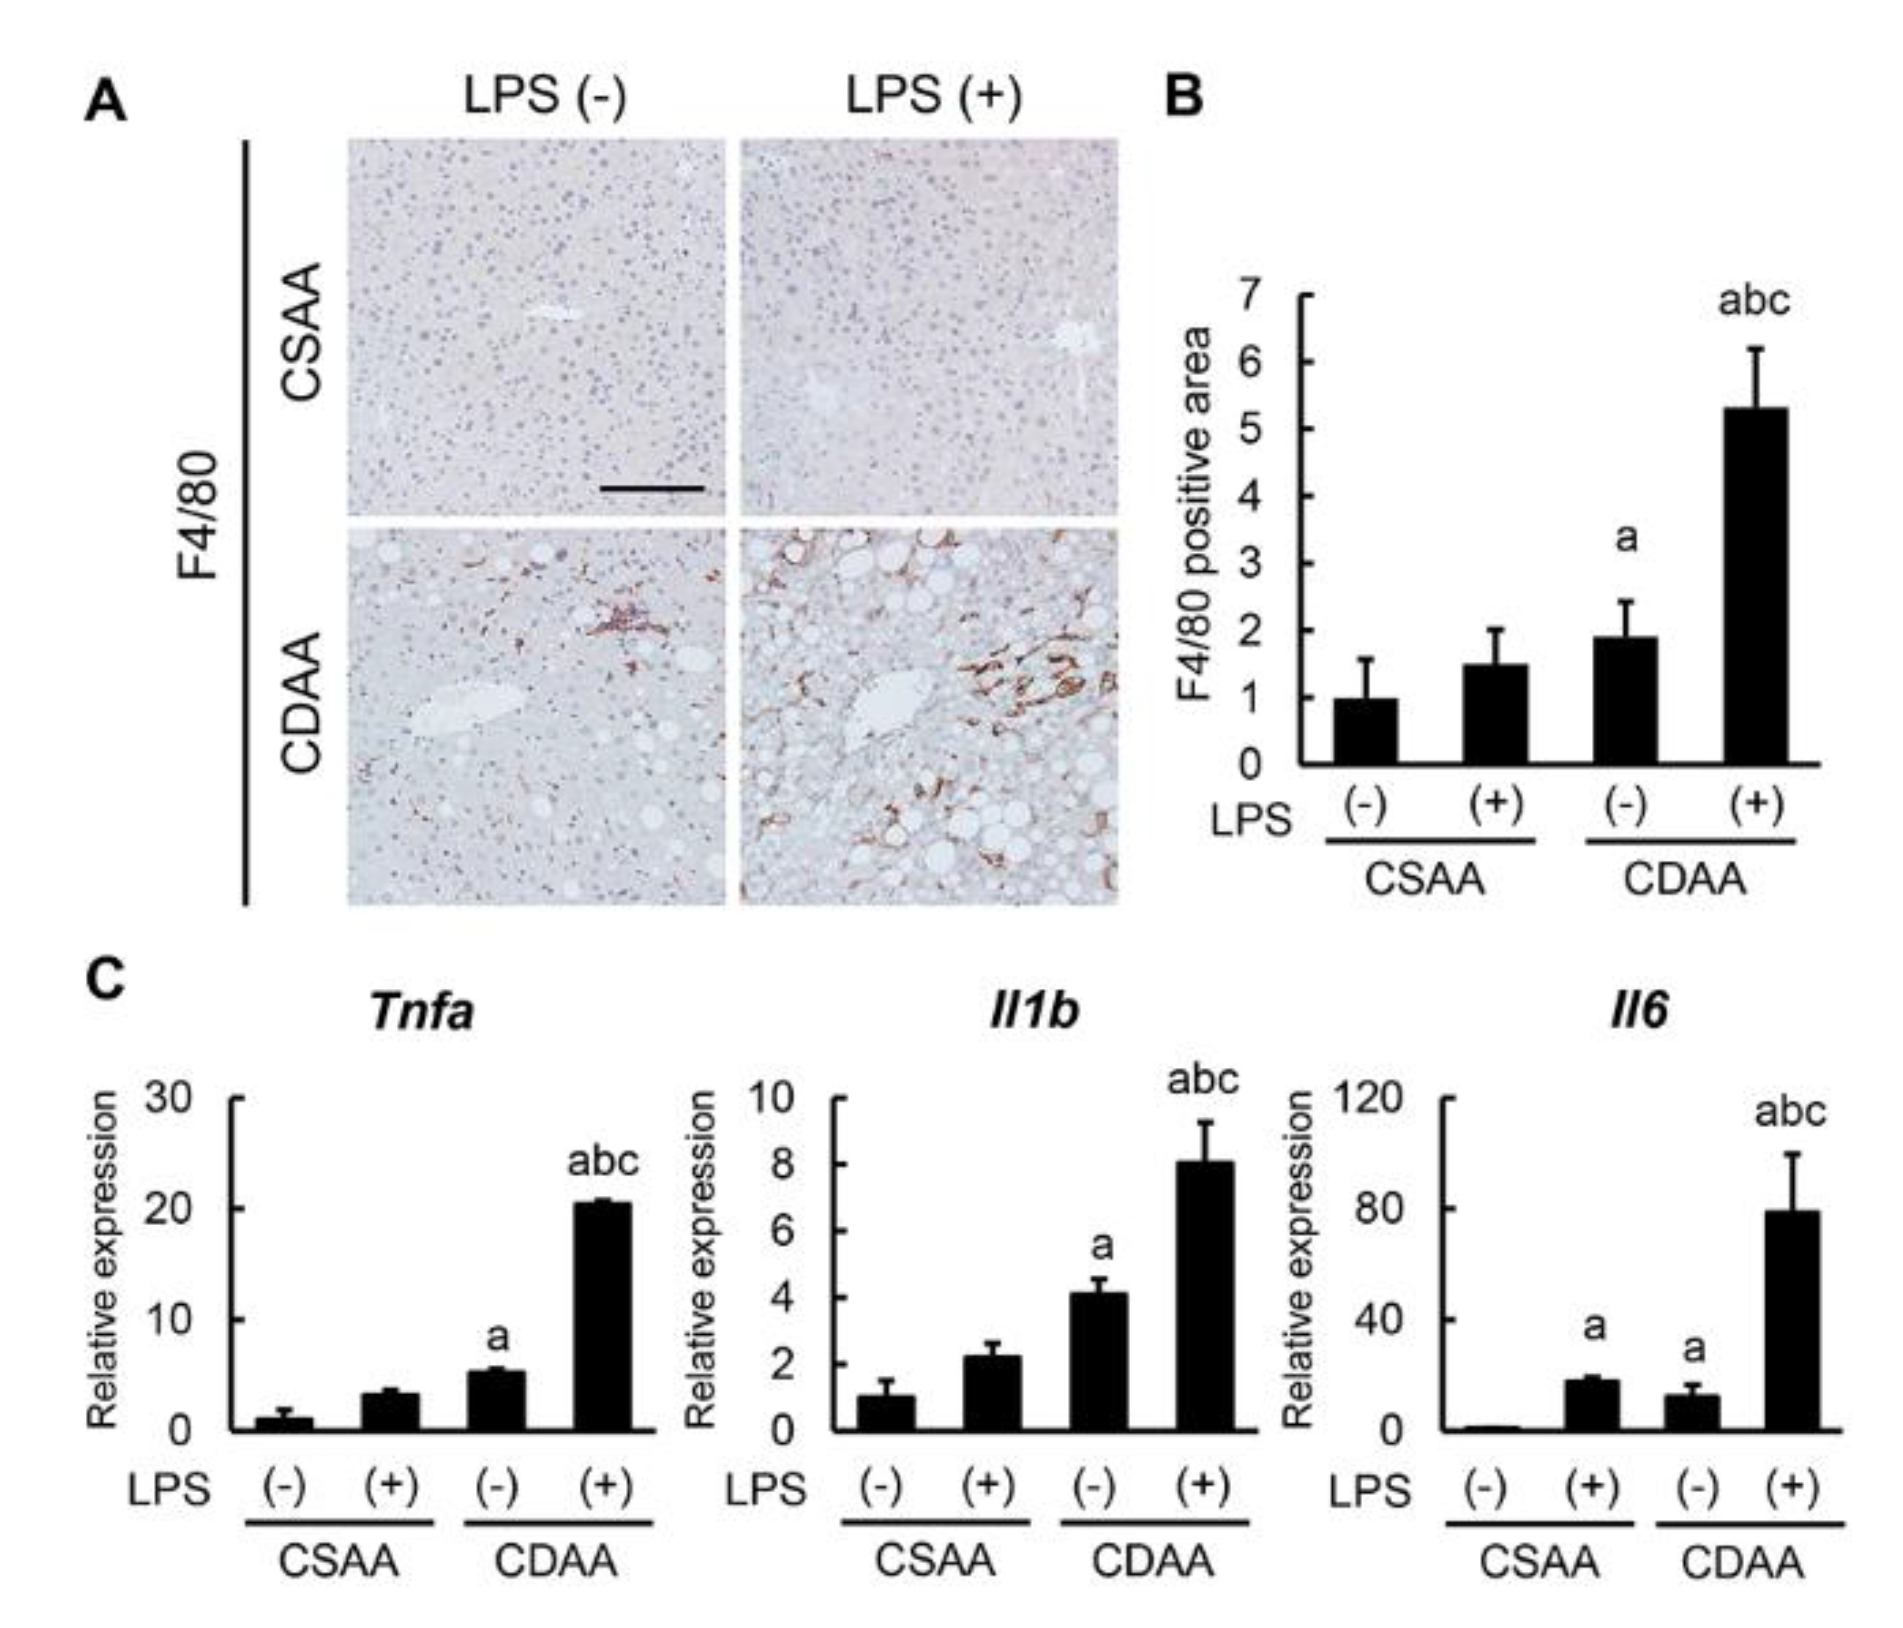
2.4. Exogenous LPS Promotes Hepatic Macrophage Infiltration and Inflammatory Response in CDAA-Fed Mice
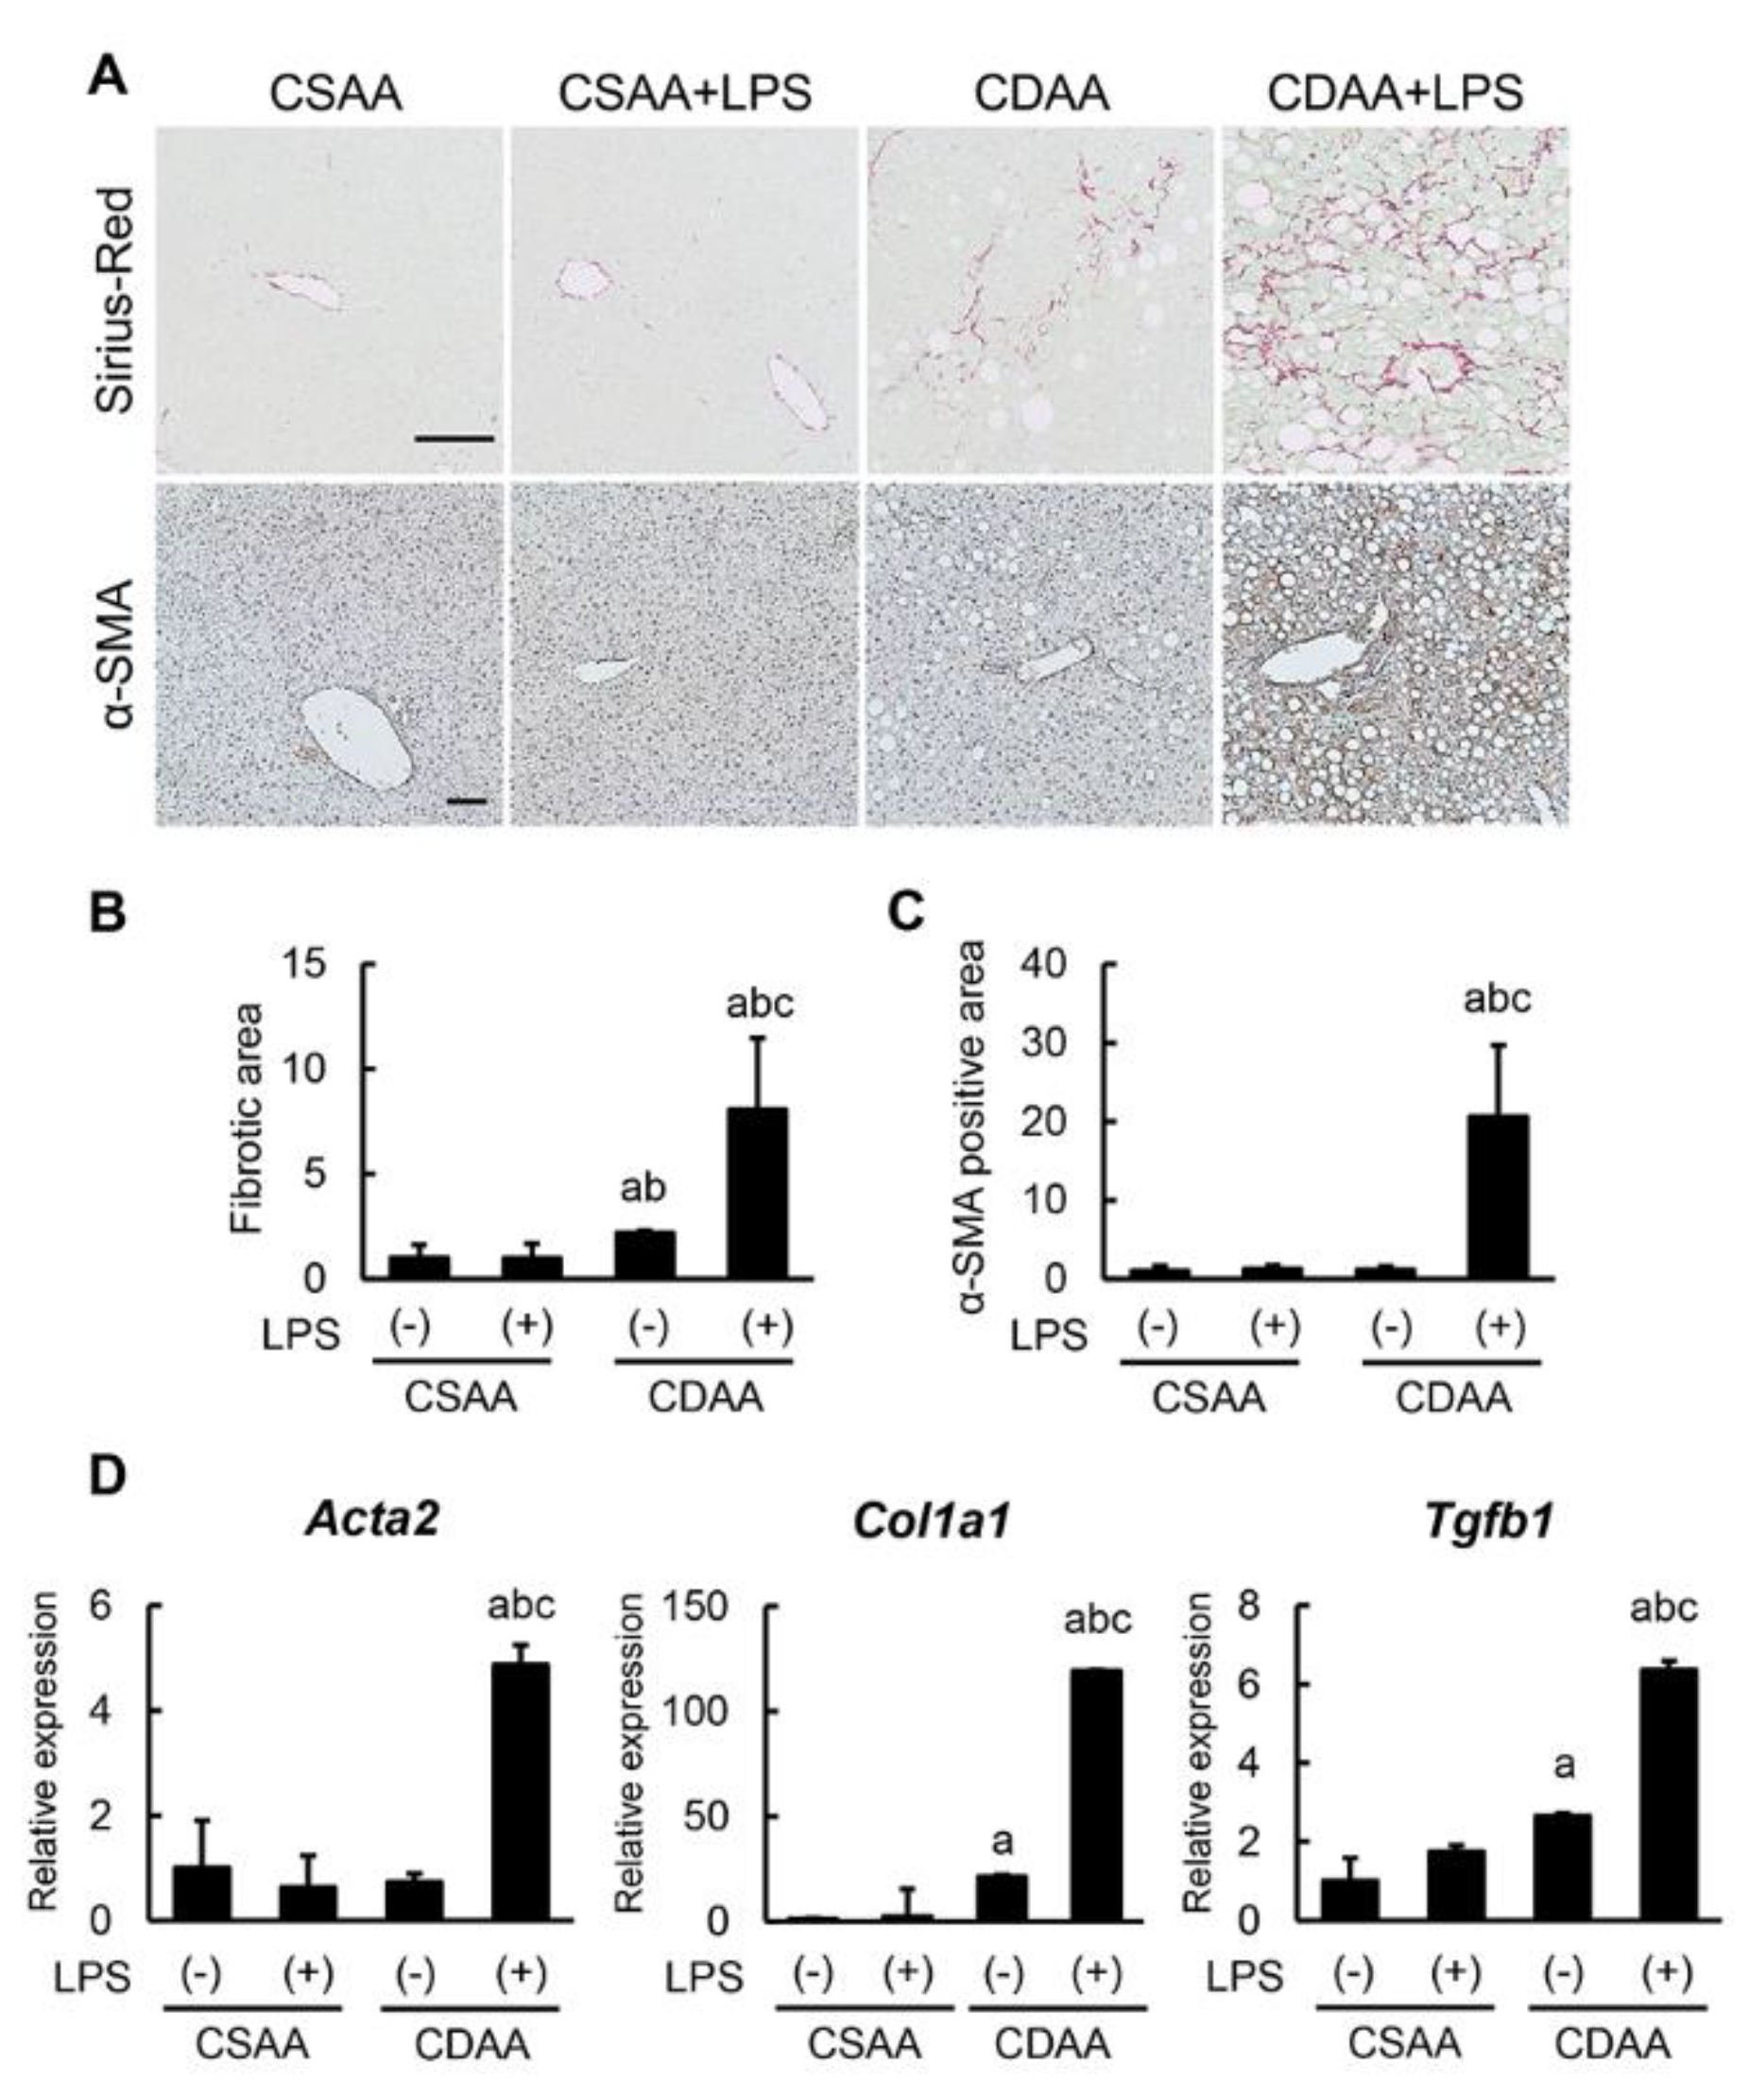
2.5. Exogenous LPS Robustly Boosts Liver Fibrosis Development in CDAA-Fed Mice
3. Discussion
4. Materials and Methods
4.1. Animals and Experimental Protocol
4.2. Histological and Immunohistochemical Analyses
4.3. RNA Extraction and Reverse Transcription Quantitative Polymerase Chain Reaction (RT-qPCR)
4.4. Protein Extraction and Western Blotting
4.5. Statistical Analysis
Supplementary Materials
Author Contributions
Funding
Acknowledgments
Conflicts of Interest
References
- Farrell, G.C.; Larter, C.Z. Nonalcoholic fatty liver disease: From steatosis to cirrhosis. Hepatology 2006, 43, S99–S112. [Google Scholar] [CrossRef] [PubMed]
- Angulo, P. Nonalcoholic Fatty Liver Disease. N. Engl. J. Med. 2002, 346, 1221–1231. [Google Scholar] [CrossRef] [PubMed]
- Sanyal, A.J.; Neuschwander-Tetri, B.A.; Tonascia, L. End points must be clinically meaningful for drug development in nonalcoholic fatty liver disease. Gastroenterology 2016, 150, 11–13. [Google Scholar] [CrossRef] [PubMed]
- Younossi, Z.M.; Koenig, A.B.; Abdelatif, D.; Fazel, Y.; Henry, L.; Wymer, M. Global epidemiology of nonalcoholic fatty liver disease-Meta-analytic assessment of prevalence, incidence, and outcomes. Hepatology 2016, 64, 73–84. [Google Scholar] [CrossRef] [PubMed]
- Wong, R.J.; Cheung, R.; Ahmed, A. Nonalcoholic steatohepatitis is the most rapidly growing indication for liver transplantation in patients with hepatocellular carcinoma in the U.S. Hepatology 2014, 59, 2188–2195. [Google Scholar] [CrossRef] [PubMed]
- Adams, L.A.; Lymp, J.F.; St Sauver, J.; Sanderson, S.O.; Lindor, K.D.; Feldstein, A.; Angulo, P. The natural history of nonalcoholic fatty liver disease: A population-based cohort study. Gastroenterology 2005, 129, 113–121. [Google Scholar] [CrossRef] [PubMed]
- Nakae, D.; Yoshiji, H.; Maruyama, H.; Kinugasa, T.; Denda, A.; Konishi, Y. Production of both 8-hydroxydeoxyguanosine in liver DNA and gamma-glutamyltransferase-positive hepatocellular lesions in rats given a choline-deficient, L-amino acid-defined diet. Jpn. J. Cancer Res. 1990, 81, 1081–1084. [Google Scholar] [CrossRef]
- Nakae, D.; Yoshiji, H.; Mizumoto, Y.; Horiguchi, K.; Shiraiwa, K.; Tamura, K.; Denda, A.; Konishi, Y. High incidence of hepatocellular carcinomas induced by a choline deficient L-amino acid defined diet in rats. Cancer Res. 1992, 52, 5042–5045. [Google Scholar]
- Sakaida, I.; Kubota, M.; Kayano, K.; Takenaka, K.; Mori, K.; Okita, K. Prevention of fibrosis reduces enzyme-altered lesions in the rat liver. Carcinogenesis 1994, 15, 2201–2206. [Google Scholar] [CrossRef]
- Okura, Y.; Namisaki, T.; Moriya, K.; Kitade, M.; Takeda, K.; Kaji, K.; Noguchi, R.; Nishimura, N.; Seki, K.; Kawaratani, H.; et al. Combined treatment with dipeptidyl peptidase-4 inhibitor (sitagliptin) and angiotensin-II type 1 receptor blocker (losartan) suppresses progression in a non-diabetic rat model of steatohepatitis. Hepatol. Res. 2017, 47, 1317–1328. [Google Scholar] [CrossRef]
- Kamada, Y.; Matsumoto, H.; Tamura, S.; Fukushima, J.; Kiso, S.; Fukui, K.; Igura, T.; Maeda, N.; Kihara, S.; Funahashi, T.; et al. Hypoadiponectinemia accelerates hepatic tumor formation in a nonalcoholic steatohepatitis mouse model. J. Hepatol. 2007, 47, 556–564. [Google Scholar] [CrossRef] [PubMed]
- Tilg, H.; Moschen, A.R. Evolution of inflammation in nonalcoholic fatty liver disease: The multiple parallel hits hypothesis. Hepatology 2010, 52, 1836–1846. [Google Scholar] [CrossRef] [PubMed]
- Lu, Y.C.; Yeh, W.C.; Ohashi, P.S. LPS/TLR4 signal transduction pathway. Cytokine 2008, 42, 145–151. [Google Scholar] [CrossRef] [PubMed]
- Ishioka, M.; Miura, K.; Minami, S.; Shimura, Y.; Ohnishi, H. Altered Gut Microbiota Composition and Immune Response in Experimental Steatohepatitis Mouse Models. Dig. Dis. Sci. 2017, 62, 396–406. [Google Scholar] [CrossRef] [PubMed]
- Mouzaki, M.; Comelli, E.M.; Arendt, B.M.; Bonengel, J.; Fung, S.K.; Fischer, S.E.; McGilvray, I.D.; Allard, J.P. Intestinal microbiota in patients with nonalcoholic fatty liver disease. Hepatology 2013, 58, 120–127. [Google Scholar] [CrossRef] [PubMed]
- Harte, A.L.; da Silva, N.F.; Creely, S.J.; McGee, K.C.; Billyard, T.; Youssef-Elabd, E.M.; Tripathi, G.; Ashour, E.; Abdalla, M.S.; Sharada, H.M.; et al. Elevated endotoxin levels in non-alcoholic fatty liver disease. J. Inflamm. 2010, 7, 15. [Google Scholar] [CrossRef]
- Kawai, T.; Akira, S. The role of pattern-recognition receptors in innate immunity: Update on Toll-like receptors. Nat. Immunol. 2010, 11, 373–384. [Google Scholar] [CrossRef]
- Schwabe, R.F.; Seki, E.; Brenner, D.A. Toll-like receptor signaling in the liver. Gastroenterology 2006, 130, 1886–1900. [Google Scholar] [CrossRef]
- Seki, K.; Kitade, M.; Nishimura, N.; Kaji, K.; Asada, K.; Namisaki, T.; Moriya, K.; Kawaratani, H.; Okura, Y.; Takaya, H.; et al. Oral administration of fructose exacerbates liver fibrosis and hepatocarcinogenesis via increased intestinal permeability in a rat steatohepatitis model. Oncotarget 2018, 9, 28638–28651. [Google Scholar] [CrossRef]
- Kawaratani, H.; Tsujimoto, T.; Kitazawa, T.; Kitade, M.; Yoshiji, H.; Uemura, M.; Fukui, H. Innate immune reactivity of the liver in rats fed a choline-deficient L-amino-acid-defined diet. World J. Gastroenterol. 2008, 14, 6655–6661. [Google Scholar] [CrossRef]
- Imajo, K.; Fujita, K.; Yoneda, M.; Nozaki, Y.; Ogawa, Y.; Shinohara, Y.; Kato, S.; Mawatari, H.; Shibata, W.; Kitani, H.; et al. Hyperresponsivity to low-dose endotoxin during progression to nonalcoholic steatohepatitis is regulated by leptin-mediated signaling. Cell Metab. 2012, 16, 44–54. [Google Scholar] [CrossRef] [PubMed]
- Nakano, T.; Cheng, Y.F.; Lai, C.Y.; Hsu, L.W.; Chang, Y.C.; Deng, J.Y.; Huang, Y.Z.; Honda, H.; Chen, K.D.; Wang, C.C.; et al. Impact of artificial sunlight therapy on the progress of non-alcoholic fatty liver disease in rats. J. Hepatol. 2011, 55, 415–425. [Google Scholar] [CrossRef] [PubMed]
- Dembek, A.; Laqqai, S.; Kessler, S.M.; Czepukojc, B.; Simon, Y.; Kiemer, A.K.; Hoppstädter, J. Hepatic interleukin-6 production is maintained during endotoxin tolerance and facilitates lipid accumulation. Immunobiology 2017, 222, 786–796. [Google Scholar] [CrossRef] [PubMed]
- Yang, L.; Miura, K.; Zhang, B.; Matsushita, H.; Yang, Y.M.; Liang, S.; Song, J.; Roh, Y.S.; Seki, E. TRIF Differentially Regulates Hepatic Steatosis and Inflammation/Fibrosis in Mice. Cell Mol Gastroenterol Hepatol. 2017, 3, 469–483. [Google Scholar] [CrossRef]
- Miura, K.; Yang, L.; van Rooijen, N.; Ohnishi, H.; Seki, E. Hepatic recruitment of macrophages promotes nonalcoholic steatohepatitis through CCR2. Am. J. Physiol Gastrointest Liver Physiol. 2012, 302, G1310–G1321. [Google Scholar] [CrossRef] [PubMed]
- Seki, E.; de Minicis, S.; Osterreicher, C.H.; Kluwe, J.; Osawa, Y.; Brenner, D.A.; Schwabe, R.F. TLR4 enhances TGF-beta signaling and hepatic fibrosis. Nat. Med. 2007, 13, 1324–1332. [Google Scholar] [CrossRef]
- Lonardo, A.; Nascimbeni, F.; Ballestri, S.; Fairweather, D.; Win, S.; Than, T.A.; Abdelmalek, M.F.; Suzuki, A. Sex Differences in NAFLD: State of the Art and Identification of Research Gaps. Hepatology 2019. [Google Scholar] [CrossRef]
- Jena, P.K.; Sheng, L.; Liu, H.X.; Kalanetra, K.M.; Mirsoian, A.; Murphy, W.J.; French, S.W.; Krishnan, V.V.; Mills, D.A.; Wan, Y.Y. Western Diet-Induced Dysbiosis in Farnesoid X Receptor Knockout Mice Causes Persistent Hepatic Inflammation after Antibiotic Treatment. Am. J. Pathol. 2017, 187, 1800–1813. [Google Scholar] [CrossRef]
- Norheim, F.; Hui, S.T.; Kulahcioglu, E.; Mehrabian, M.; Cantor, R.M.; Pan, C.; Parks, B.W.; Lusis, A.J. Genetic and hormonal control of hepatic steatosis in female and male mice. J. Lipid Res. 2017, 58, 178–187. [Google Scholar] [CrossRef]
- Ganz, M.; Csak, T.; Szabo, G. High fat diet feeding results in gender specific steatohepatitis and inflammasome activation. World J. Gastroenterol. 2014, 20, 8525–8534. [Google Scholar] [CrossRef]
- Kirsch, R.; Clarkson, V.; Shephard, E.G.; Marais, D.A.; Jaffer, M.A.; Woodburne, V.E.; Kirsch, R.E.; Hall Pde, L. Rodent nutritional model of non-alcoholic steatohepatitis: Species, strain and sex difference studies. J. Gastroenterol. Hepatol. 2003, 18, 1272–1282. [Google Scholar] [CrossRef] [PubMed]
- Spruss, A.; Henkel, J.; Kanuri, G.; Blank, D.; Puschel, G.P.; Bischoff, S.C.; Bergheim, I. Female mice are more susceptible to nonalcoholic fatty liver disease: Sex-specific regulation of the hepatic AMP-activated protein kinase-plasminogen activator inhibitor 1 cascade, but not the hepatic endotoxin response. Mol. Med. 2012, 18, 1346–1355. [Google Scholar] [CrossRef] [PubMed]
- Guerrerio, A.L.; Colvin, R.M.; Schwartz, A.K.; Molleston, J.P.; Murray, K.F.; Diehl, A.; Mohan, P.; Schwimmer, J.B.; Lavine, J.E.; Torbenson, M.S.; et al. Choline intake in a large cohort of patients with nonalcoholic fatty liver disease. Am. J. Clin. Nutr. 2012, 95, 892–900. [Google Scholar] [CrossRef]
- Klein, S.L.; Marriott, I.; Fish, E.N. Sex-based differences in immune function and responses to vaccination. Trans. R Soc. Trop. Med. Hyg. 2015, 109, 9–15. [Google Scholar] [CrossRef] [PubMed]
- Giles, D.A.; Moreno-Fernandez, M.E.; Stankiewicz, T.E.; Graspeuntner, S.; Cappelletti, M.; Wu, D.; Mukherjee, R.; Chan, C.C.; Lawson, M.J.; Klarquist, J.; et al. Thermoneutral housing exacerbates nonalcoholic fatty liver disease in mice and allows for sex-independent disease modeling. Nat. Med. 2017, 23, 829–838. [Google Scholar] [CrossRef] [PubMed]


© 2019 by the authors. Licensee MDPI, Basel, Switzerland. This article is an open access article distributed under the terms and conditions of the Creative Commons Attribution (CC BY) license (http://creativecommons.org/licenses/by/4.0/).
Share and Cite
Nakanishi, K.; Kaji, K.; Kitade, M.; Kubo, T.; Furukawa, M.; Saikawa, S.; Shimozato, N.; Sato, S.; Seki, K.; Kawaratani, H.; et al. Exogenous Administration of Low-Dose Lipopolysaccharide Potentiates Liver Fibrosis in a Choline-Deficient l-Amino-Acid-Defined Diet-Induced Murine Steatohepatitis Model. Int. J. Mol. Sci. 2019, 20, 2724. https://doi.org/10.3390/ijms20112724
Nakanishi K, Kaji K, Kitade M, Kubo T, Furukawa M, Saikawa S, Shimozato N, Sato S, Seki K, Kawaratani H, et al. Exogenous Administration of Low-Dose Lipopolysaccharide Potentiates Liver Fibrosis in a Choline-Deficient l-Amino-Acid-Defined Diet-Induced Murine Steatohepatitis Model. International Journal of Molecular Sciences. 2019; 20(11):2724. https://doi.org/10.3390/ijms20112724
Chicago/Turabian StyleNakanishi, Keisuke, Kosuke Kaji, Mitsuteru Kitade, Takuya Kubo, Masanori Furukawa, Soichiro Saikawa, Naotaka Shimozato, Shinya Sato, Kenichiro Seki, Hideto Kawaratani, and et al. 2019. "Exogenous Administration of Low-Dose Lipopolysaccharide Potentiates Liver Fibrosis in a Choline-Deficient l-Amino-Acid-Defined Diet-Induced Murine Steatohepatitis Model" International Journal of Molecular Sciences 20, no. 11: 2724. https://doi.org/10.3390/ijms20112724
APA StyleNakanishi, K., Kaji, K., Kitade, M., Kubo, T., Furukawa, M., Saikawa, S., Shimozato, N., Sato, S., Seki, K., Kawaratani, H., Moriya, K., Namisaki, T., & Yoshiji, H. (2019). Exogenous Administration of Low-Dose Lipopolysaccharide Potentiates Liver Fibrosis in a Choline-Deficient l-Amino-Acid-Defined Diet-Induced Murine Steatohepatitis Model. International Journal of Molecular Sciences, 20(11), 2724. https://doi.org/10.3390/ijms20112724