Article

Exploring Novel Functions of the Small GTPase Ypt1p under Heat-Shock by Characterizing a Temperature-Sensitive Mutant Yeast Strain, ypt1-G80D

Division of Applied Life Sciences (BK21+) and Plant Molecular Biology and Biotechnology Research Center, Gyeongsang National University, Jinju 52828, Korea
*
Author to whom correspondence should be addressed.
These authors contributed equally to this work.
Int. J. Mol. Sci. 2019, 20(1), 132; https://doi.org/10.3390/ijms20010132
Submission received: 22 November 2018 / Revised: 8 December 2018 / Accepted: 8 December 2018 / Published: 1 January 2019
(This article belongs to the Special Issue Small GTPases)

Abstract

:
In our previous study, we found that Ypt1p, a Rab family small GTPase protein, exhibits a stress-driven structural and functional switch from a GTPase to a molecular chaperone, and mediates thermo tolerance in Saccharomyces cerevisiae. In the current study, we focused on the temperature-sensitive ypt1-G80D mutant, and found that the mutant cells are highly sensitive to heat-shock, due to a deficiency in the chaperone function of Ypt1pG80D. This defect results from an inability of the protein to form high molecular weight polymers, even though it retains almost normal GTPase function. The heat-stress sensitivity of ypt1-G80D cells was partially recovered by treatment with 4-phenylbutyric acid, a chemical chaperone. These findings indicate that loss of the chaperone function of Ypt1pG80D underlies the heat sensitivity of ypt1-G80D cells. We also compared the proteomes of YPT1 (wild-type) and ypt1-G80D cells to investigate Ypt1p-controlled proteins under heat-stress conditions. Our findings suggest that Ypt1p controls an abundance of proteins involved in metabolism, protein synthesis, cellular energy generation, stress response, and DNA regulation. Finally, we suggest that Ypt1p essentially regulates fundamental cellular processes under heat-stress conditions by acting as a molecular chaperone.

1. Introduction

Ypt1p is a member of the Rab family of small GTPases that cycles between an active GTP-bound form and an inactive GDP-bound form. Ypt1p requires guanine nucleotide exchange factor for the GDP-GTP exchange and subsequent activation of the signaling process. In addition, GTPase-activating proteins are also required for hydrolysis of the bound GTP. A large number of small GTPases belonging to the Rab family play a role in vesicular trafficking, and Ypt1p is essential for multiple steps of the yeast secretory pathway, including endoplasmic reticulum to cis-Golgi and cis- to medial-Golgi transport [1]. Although knockout of the YPT1 gene in yeast is lethal [2], several conditional ypt1 mutants have been generated and characterized, including GTPase-deficient (ypt1-S22N and ypt1-Q67L), temperature-sensitive (ypt1-G80D), and vesicle transport-defective (ypt1-1, ypt1-2, and ypt1-3) mutants [2,3,4,5,6,7,8]. Hydrolysis of Ypt1p-bound GTP is an essential step in vesicle transport and cell growth, yet the GTPase-deficient ypt1-Q67L mutant exhibits no observable defects in protein transport, secretion, membrane morphology, or cell growth at temperatures ranging from 14 °C to 37 °C [4]. Based on these findings, it was concluded that, contrary to the general concept of Ypt1p/Rab function, the GTPase activity of Ypt1p is not essential for Ypt1p-mediated vesicle transport or membrane fusion, or for growth at an elevated temperature (37 °C). On the other hand, the Ypt1pG80D protein has normal GTPase function and the ypt1-G80D mutant strain displays normal growth and nearly normal endoplasmic reticulum-to-Golgi vesicle trafficking at typical growth temperature (30 °C), but experiences growth retardation at an elevated temperature (37 °C) [7]. This finding implies that the GTPase activity of Ypt1p is not essential for the growth of yeast at elevated temperatures.
To explain the temperature-sensitive growth phenotype of the ypt1-G80D strain, we hypothesized that (a) Ypt1p has a novel function in addition to its well-known GTPase function, (b) the unknown function of Ypt1p is temperature-dependent, and (c) the unknown function of Ypt1p promotes the survival and growth of cells under heat-stress. Accordingly, in our previous study [9], we found that Ypt1p functions as both a GTPase and a molecular chaperone. Furthermore, we found that heat-shock induces a functional switch in Ypt1p from that of a GTPase to that of a molecular chaperone, and this change is driven by a structural switch from a low molecular weight (LMW) to a high molecular weight (HMW) form. In the current study, we examined the conditional chaperone activity of Ypt1pG80D and compared the biochemical properties of the Ypt1p and Ypt1pG80D proteins in vitro and in vivo. Briefly, we found that Ypt1p can switch both structurally and functionally from a GTPase to a molecular chaperone at high temperatures, validating our first two hypotheses. Unlike the wild-type protein, Ypt1pG80D is unable to perform this switch at high temperatures. To gain insight into the cellular processes controlled by Ypt1p under heat-stress conditions, we compared the proteomes of YPT1 (wild-type) and ypt1-G80D mutant cells. Finally, we validated our third hypothesis by showing that the chaperone function of Ypt1p enhances the resistance of cells to heat-stress, while loss of this function in ypt1-G80D cells causes a heat-sensitive phenotype.

2. Results

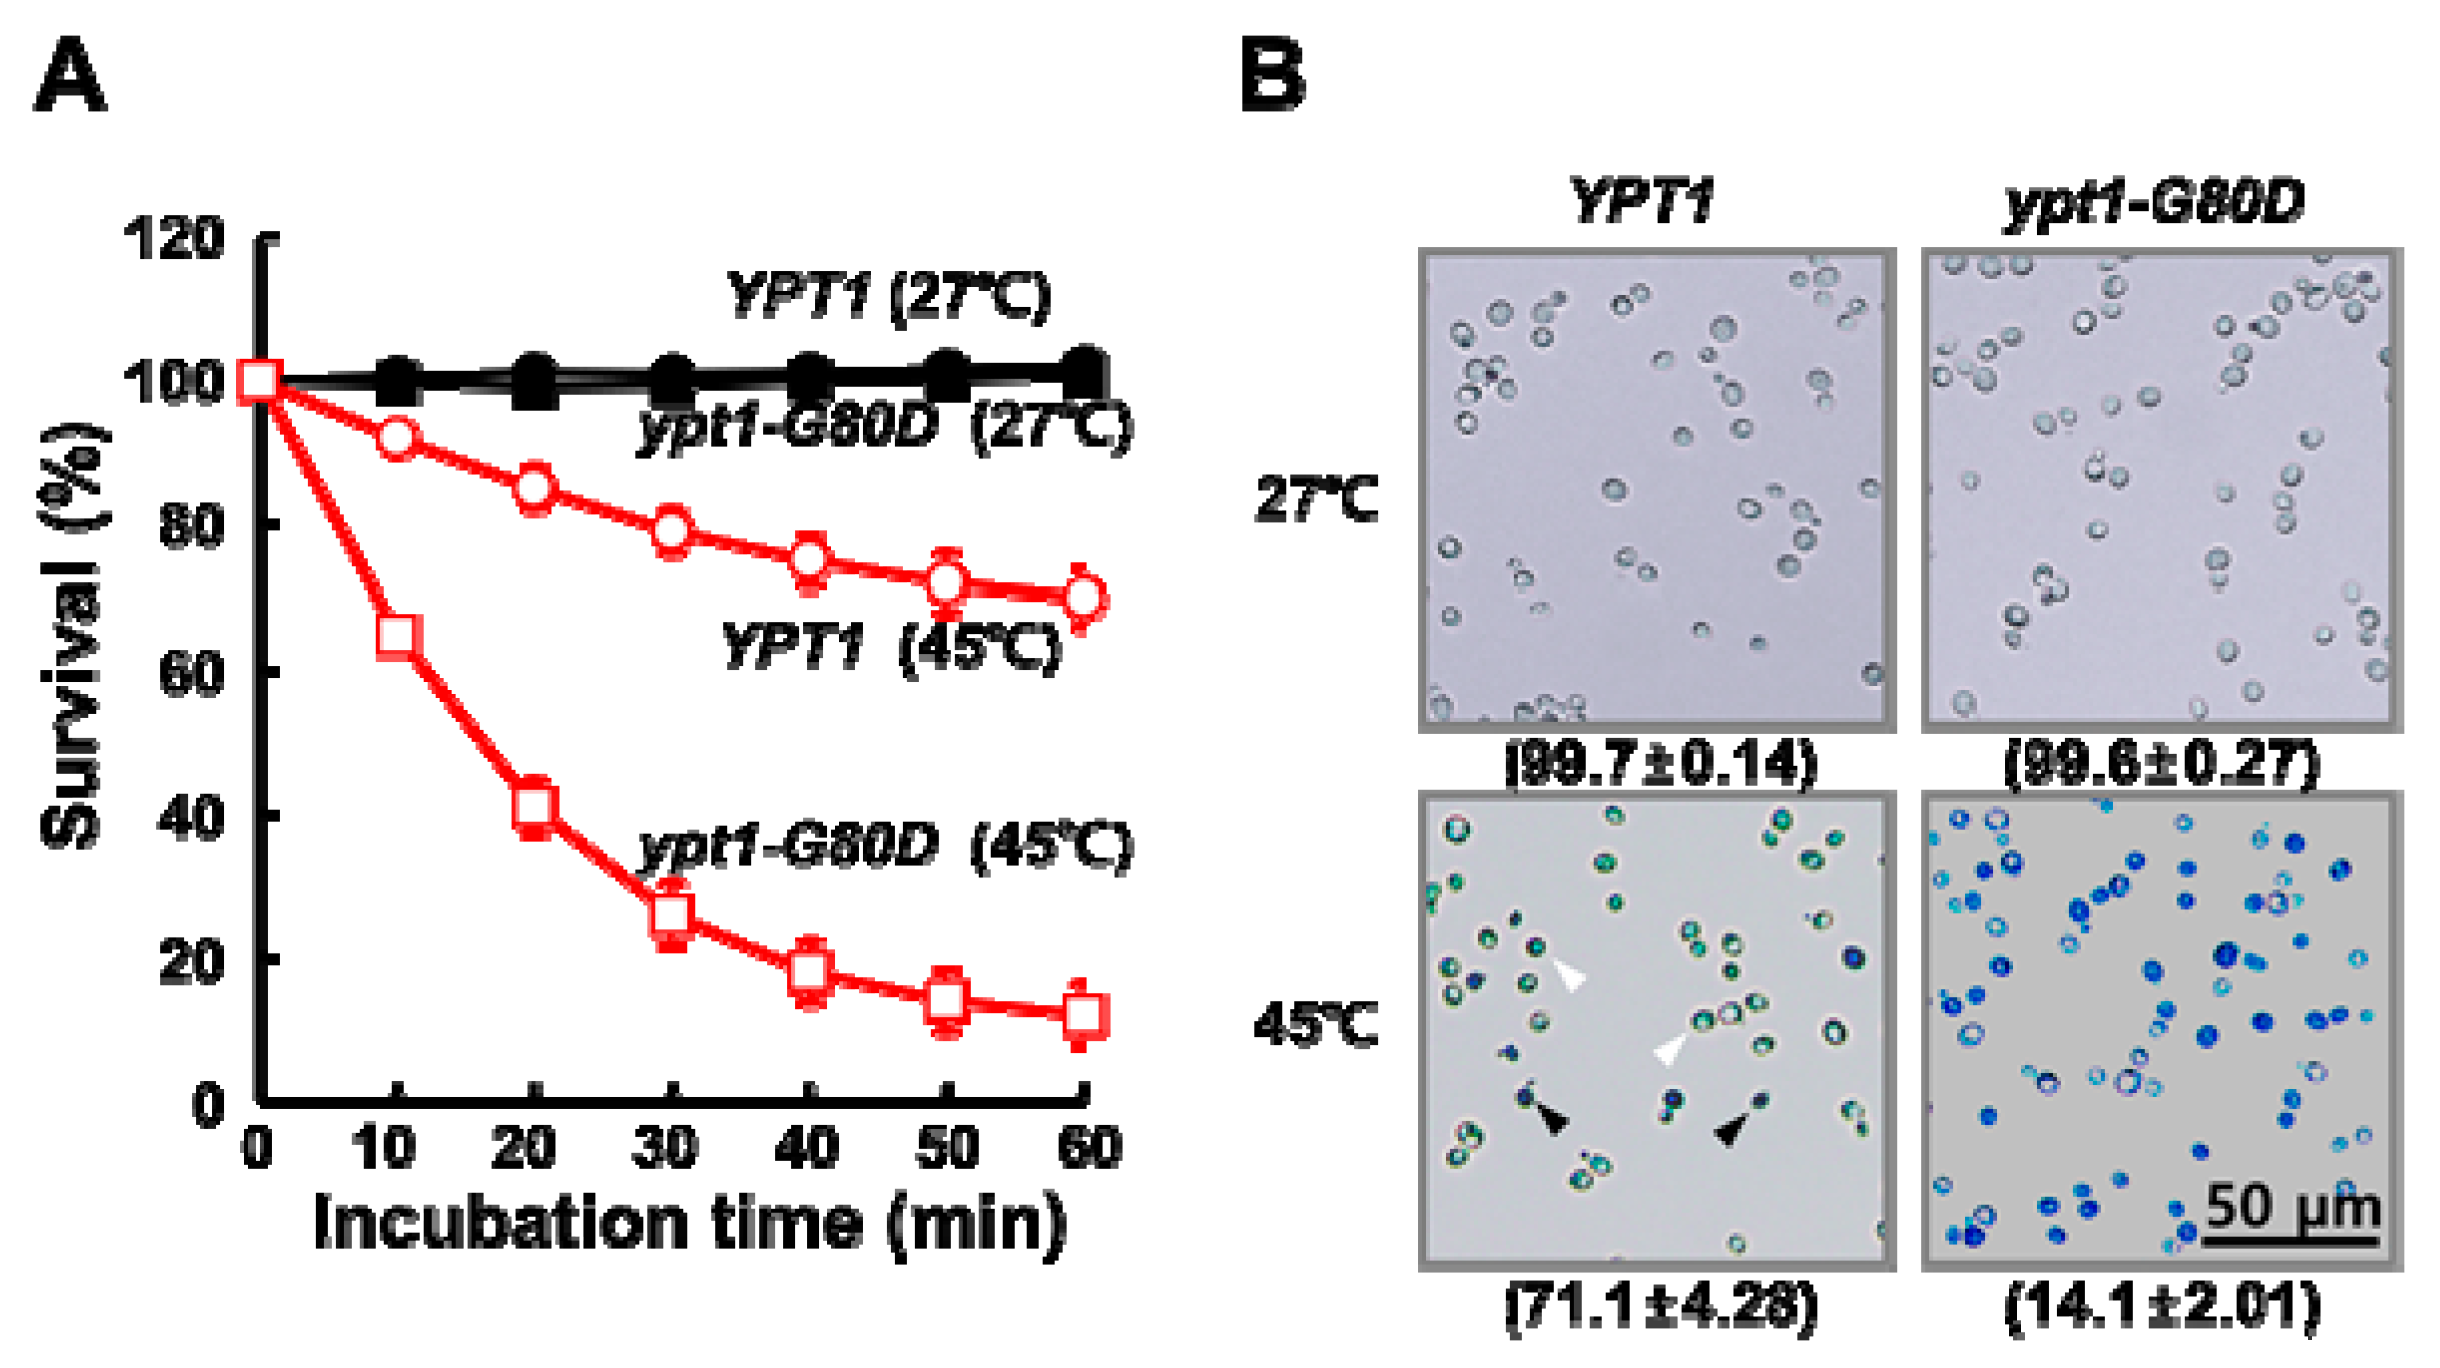
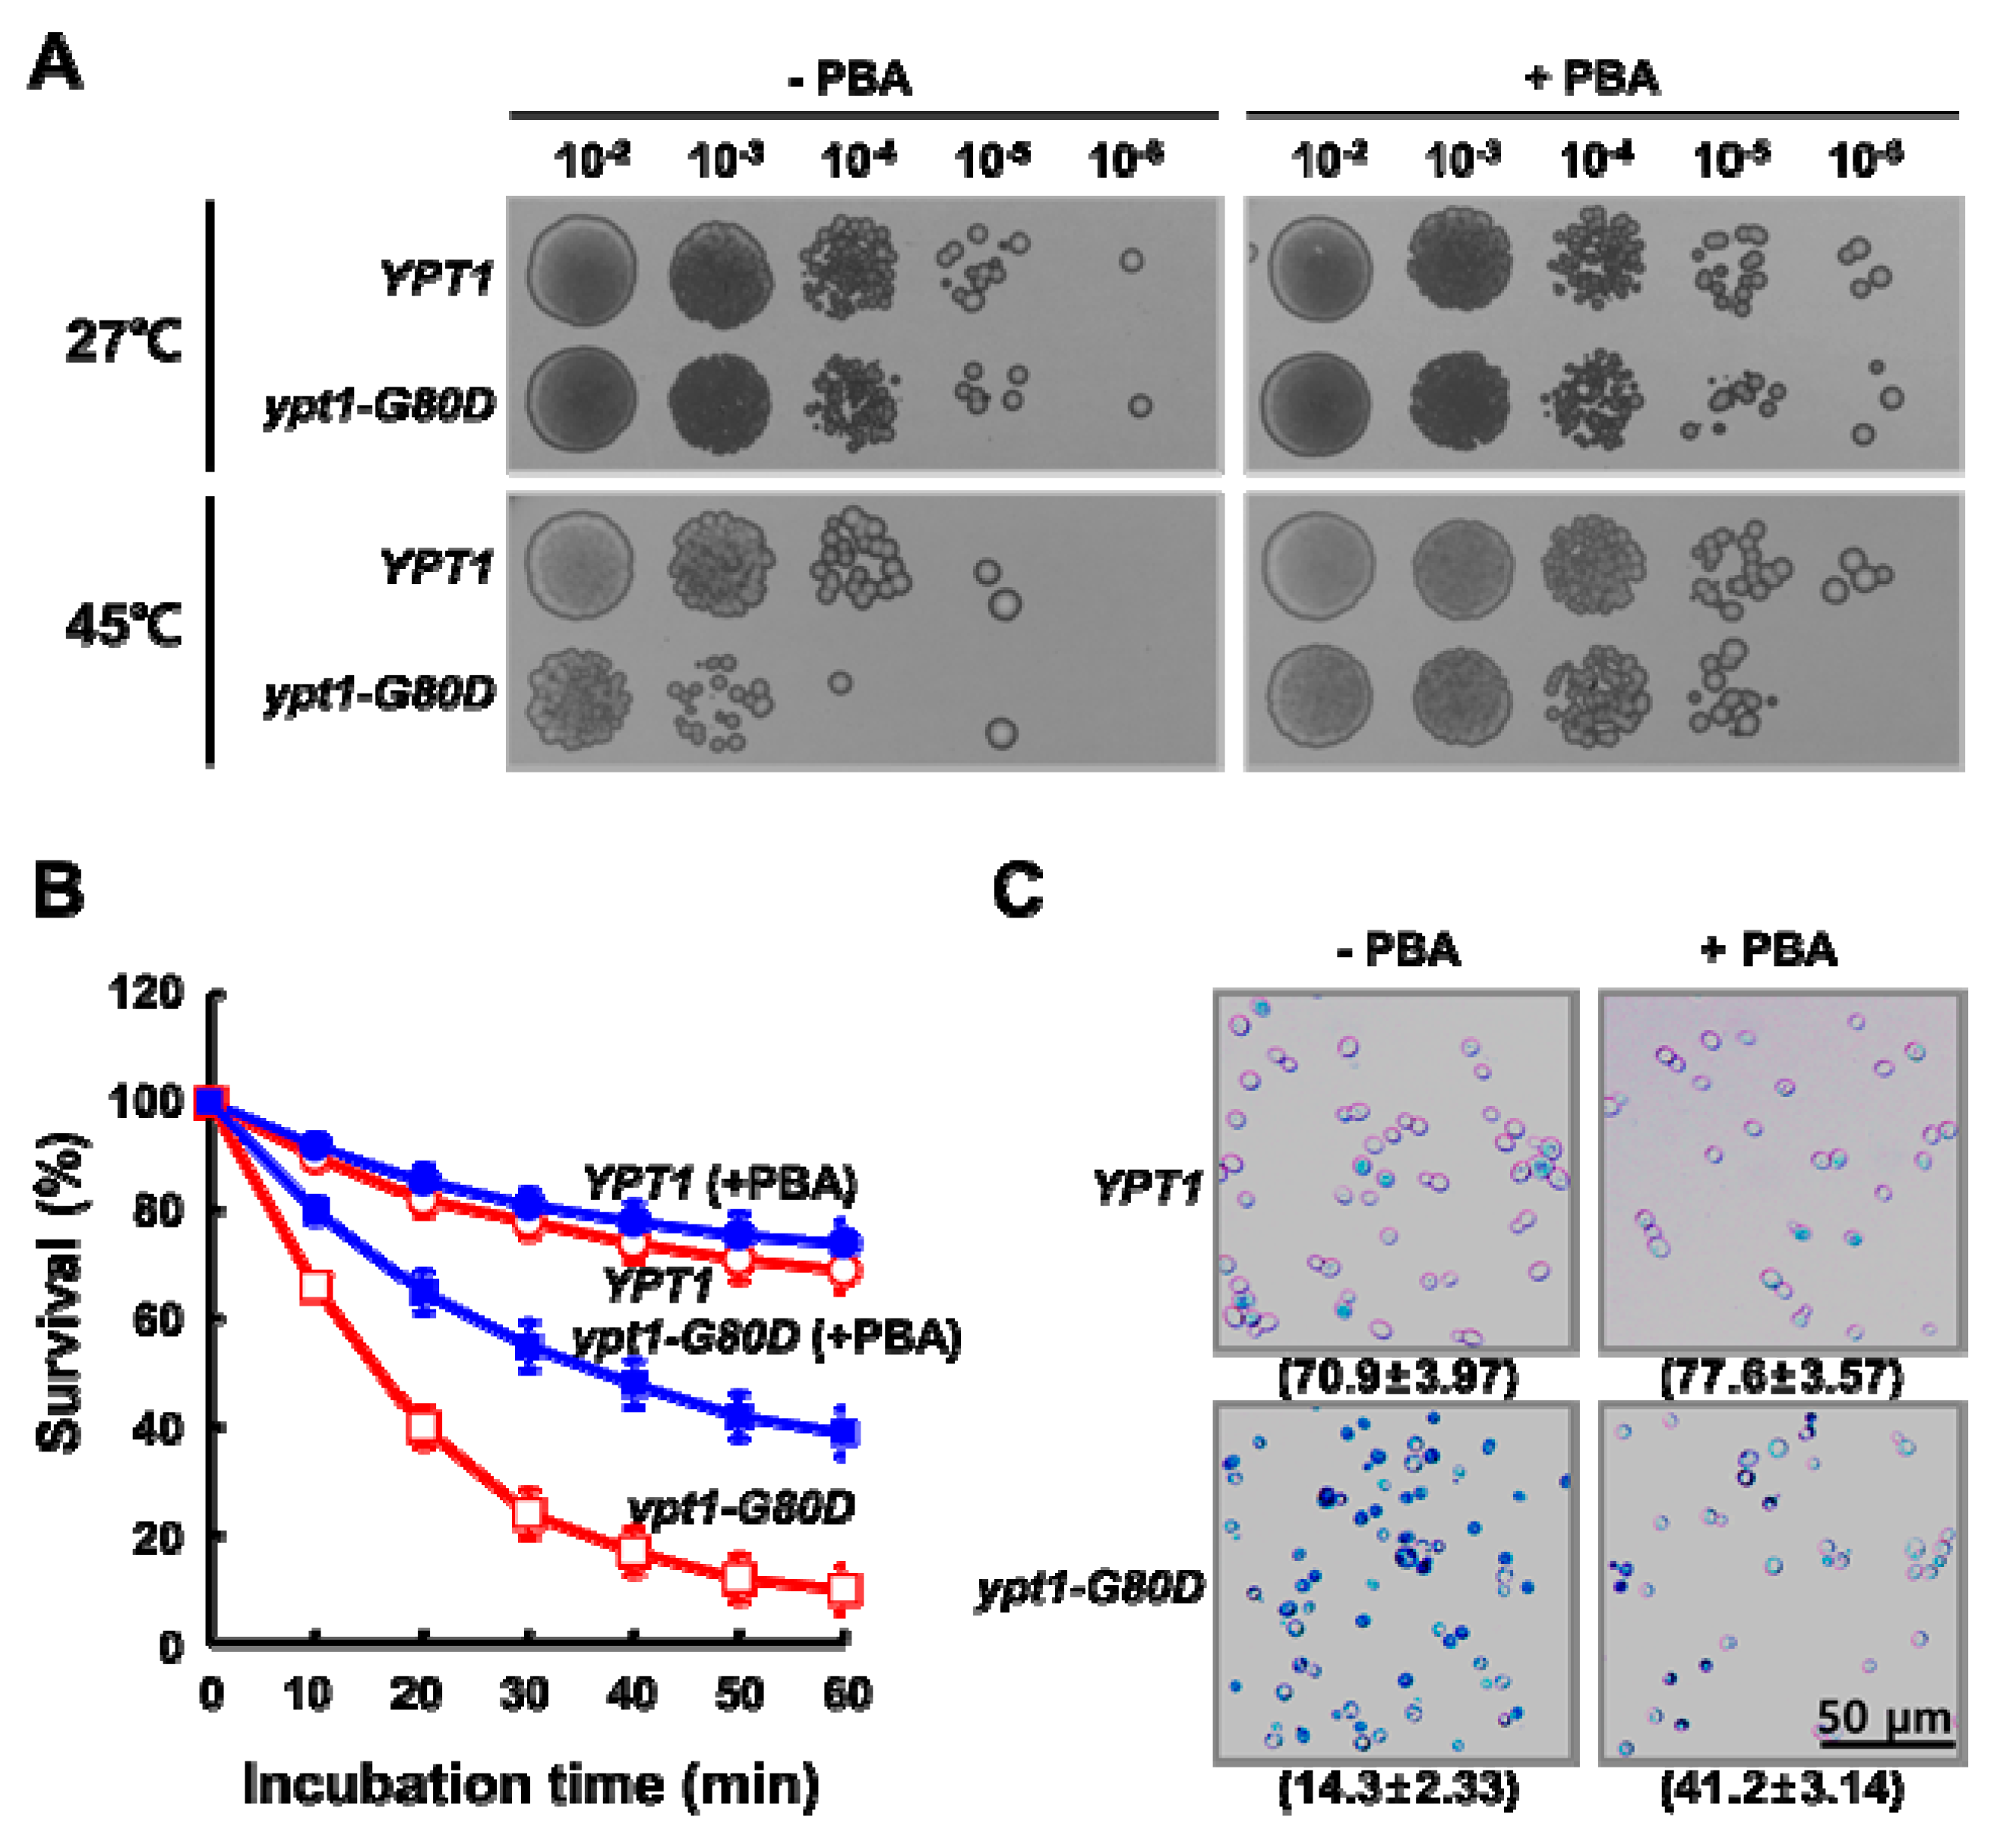
2.1. Mutant ypt1-G80D Yeast Cells Are Sensitive to Heat-Shock

Isogenic ypt1 mutant strains grow more slowly than wild-type cells at non-permissive temperatures (e.g., 37 °C) [7], and loss of the chaperone activity of Ypt1p leads to a physiological susceptibility of organisms to heat-shock [10]. To confirm the physiological significance of the G80D mutation in Ypt1p, we compared the viabilities of heat-shocked YPT1 and ypt1-G80D cells (Figure 1). Cultures of the two strains in the mid-exponential growth phase were adjusted to equal cell densities, and aliquots were incubated at 27 °C or 45 °C. Viable counts were determined at regular time intervals (Figure 1A). There was no significant difference in percent survival between the YPT1 and ypt1-G80D strains upon incubation at 27 °C for up to 60 min. However, upon incubation at 45 °C, the percent survival of the ypt1-G80D strain was reduced more dramatically than that of the YPT1 strain (26 ± 4.37% versus 79 ± 2.99% at 30 min, respectively; 12 ± 4.31% versus 70 ± 3.95% at 60 min, respectively). To confirm these results, we assessed cell death using a trypan blue (TB) exclusion assay [11]. The TB exclusion test is based on the principle that only dead cells stain blue because they cannot exclude the dye. As shown in Figure 1B, no TB-positive YPT1 or ypt1-G80D cells were observed after a 60 min incubation at 27 °C. By contrast, after a 60 min incubation at 45 °C, most of the ypt1-G80D cells were stained intensely blue, indicating that they were dead, whereas most of the YPT1 cells were stained only mildly, indicating that they were alive.

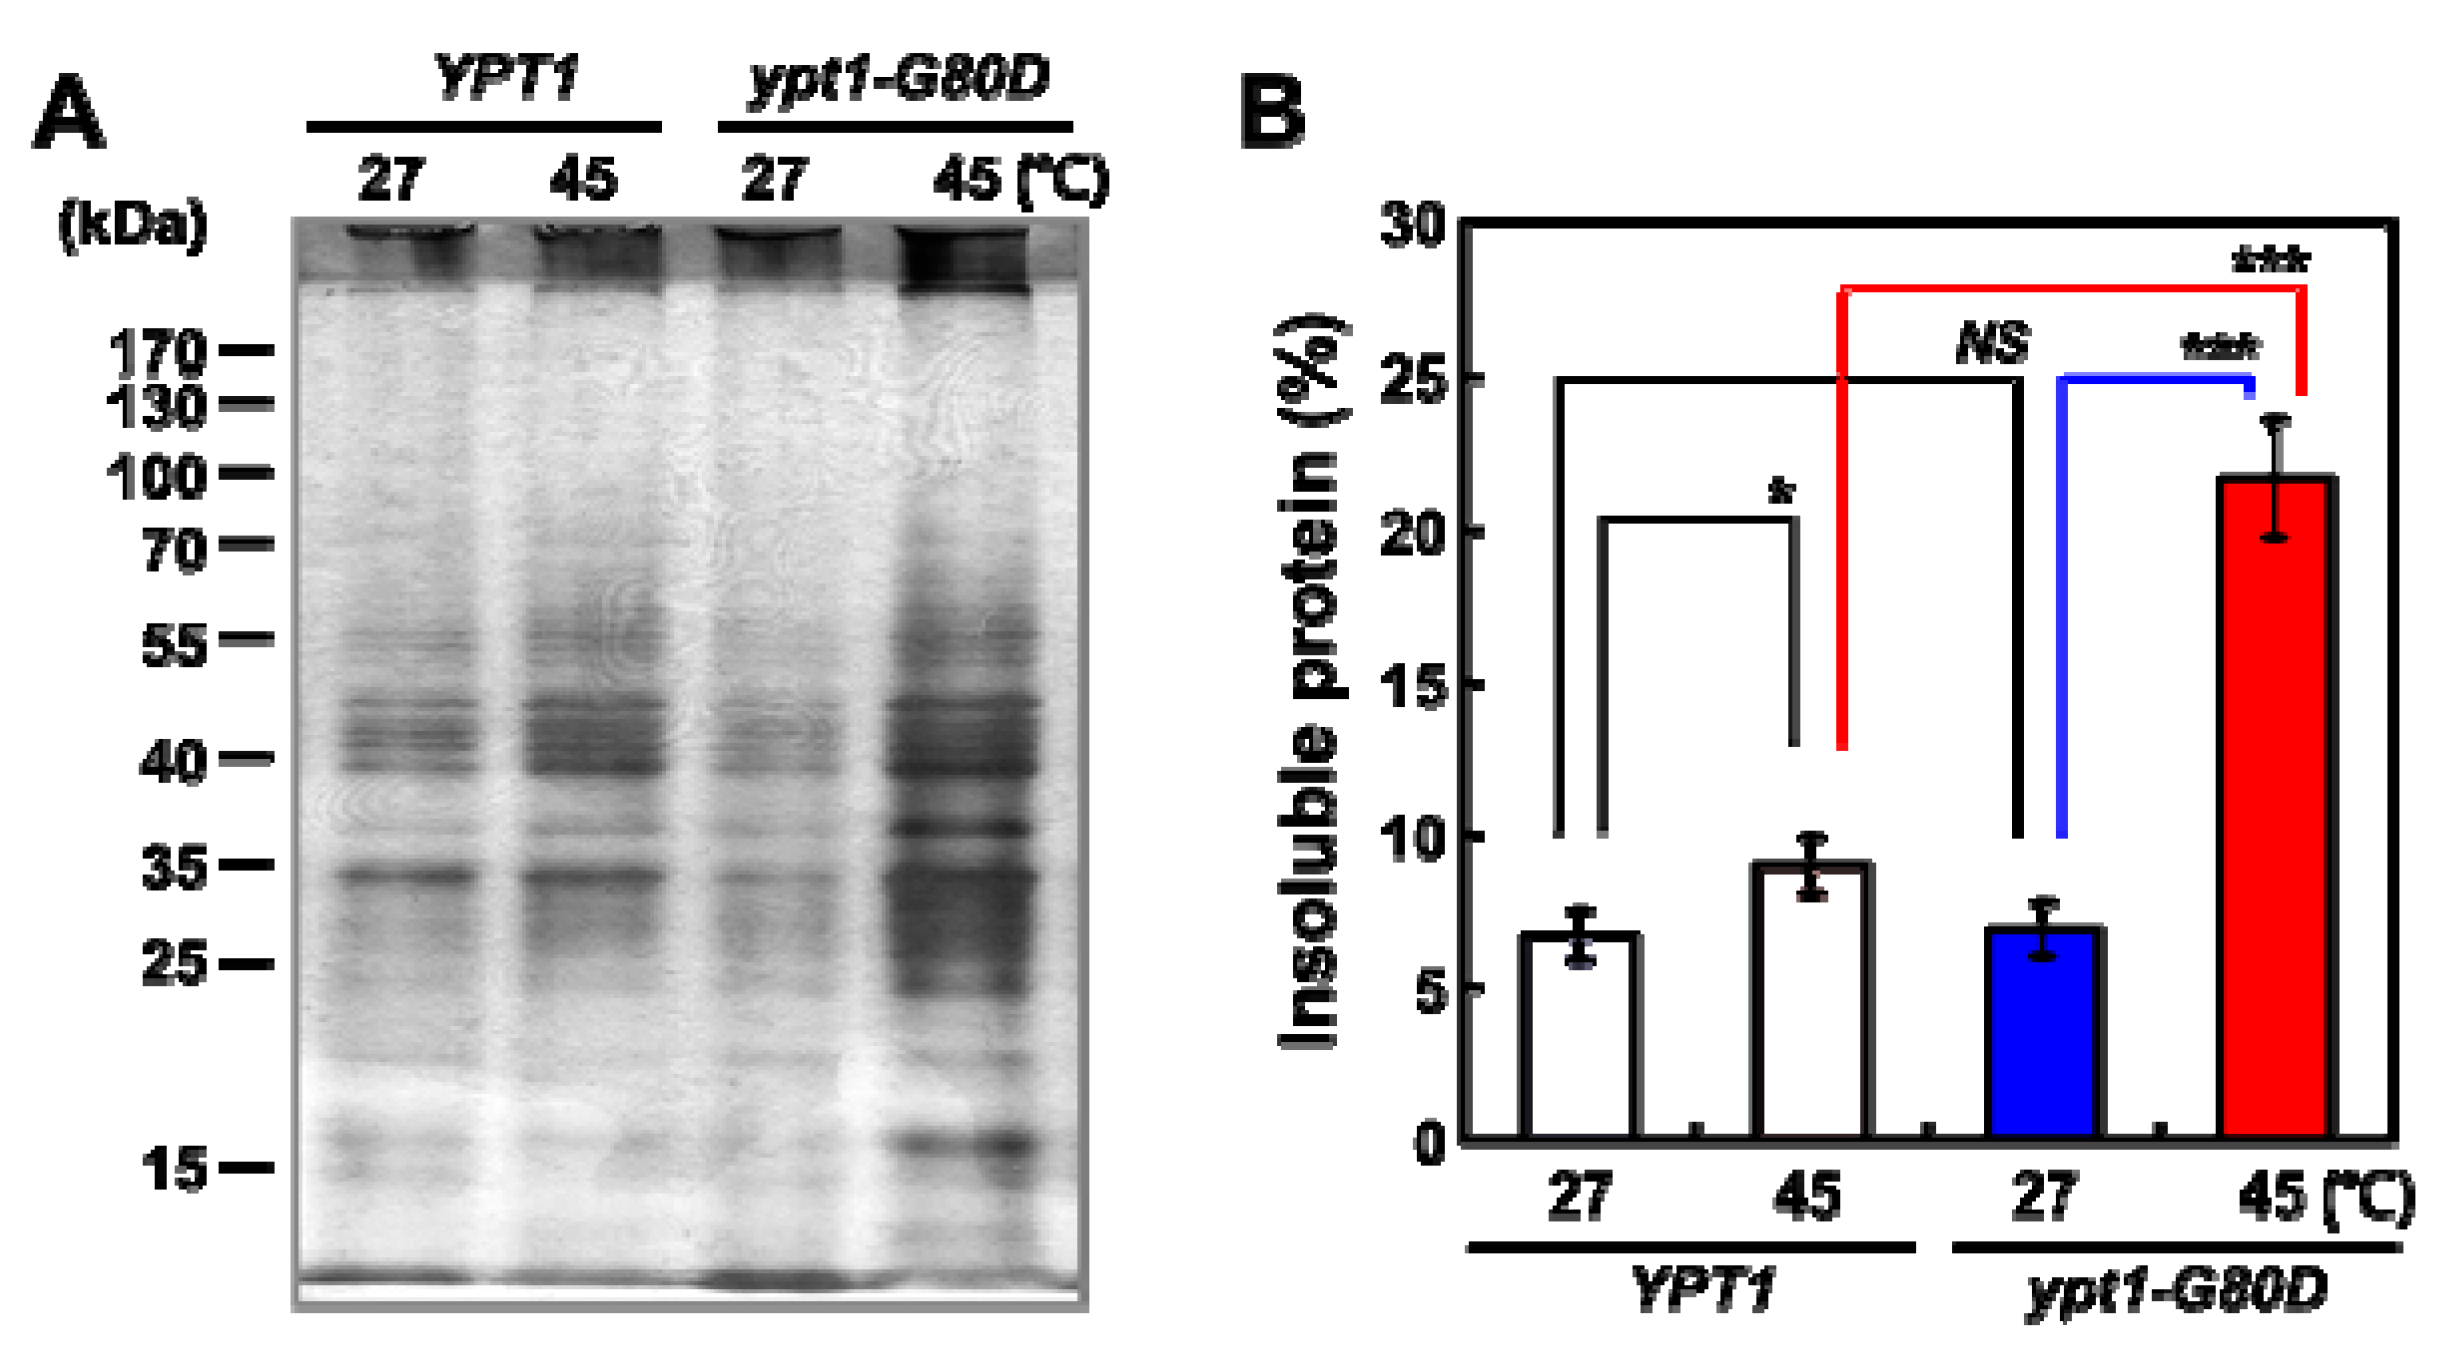
2.2. Heat-Shock Induces Cytosolic Protein Aggregation in ypt1-G80D Yeast Cells

Loss of cell viability may be related to the aggregation of thermolabile proteins within cells [12]. Therefore, we compared the abundances of cytosolic protein aggregates in YPT1 and ypt1-G80D cells after incubation at 27 °C or 45 °C for 60 min, using a protocol developed by Tomoyasu et al. [12] that minimizes background signals and enhances the sensitivity of aggregate detection. In YPT1 cells, the amount of insoluble protein aggregates was only marginally higher at 45 °C than at 25 °C; however, a much larger increase was observed upon incubation at 45 °C in the ypt1-G80D cells (Figure 2A). The amount of insoluble protein was quantified by comparing it with that of total protein (Figure 2B). There was no significant difference between the percentages of insoluble protein in YPT1 and ypt1-G80D strains following incubation at 27 °C for up to 60 min. Upon incubation at 45 °C, the percentage of insoluble protein in the ypt1-G80D strain was significantly higher than that in the YPT1 strain (21.5% versus 9.1%, respectively).

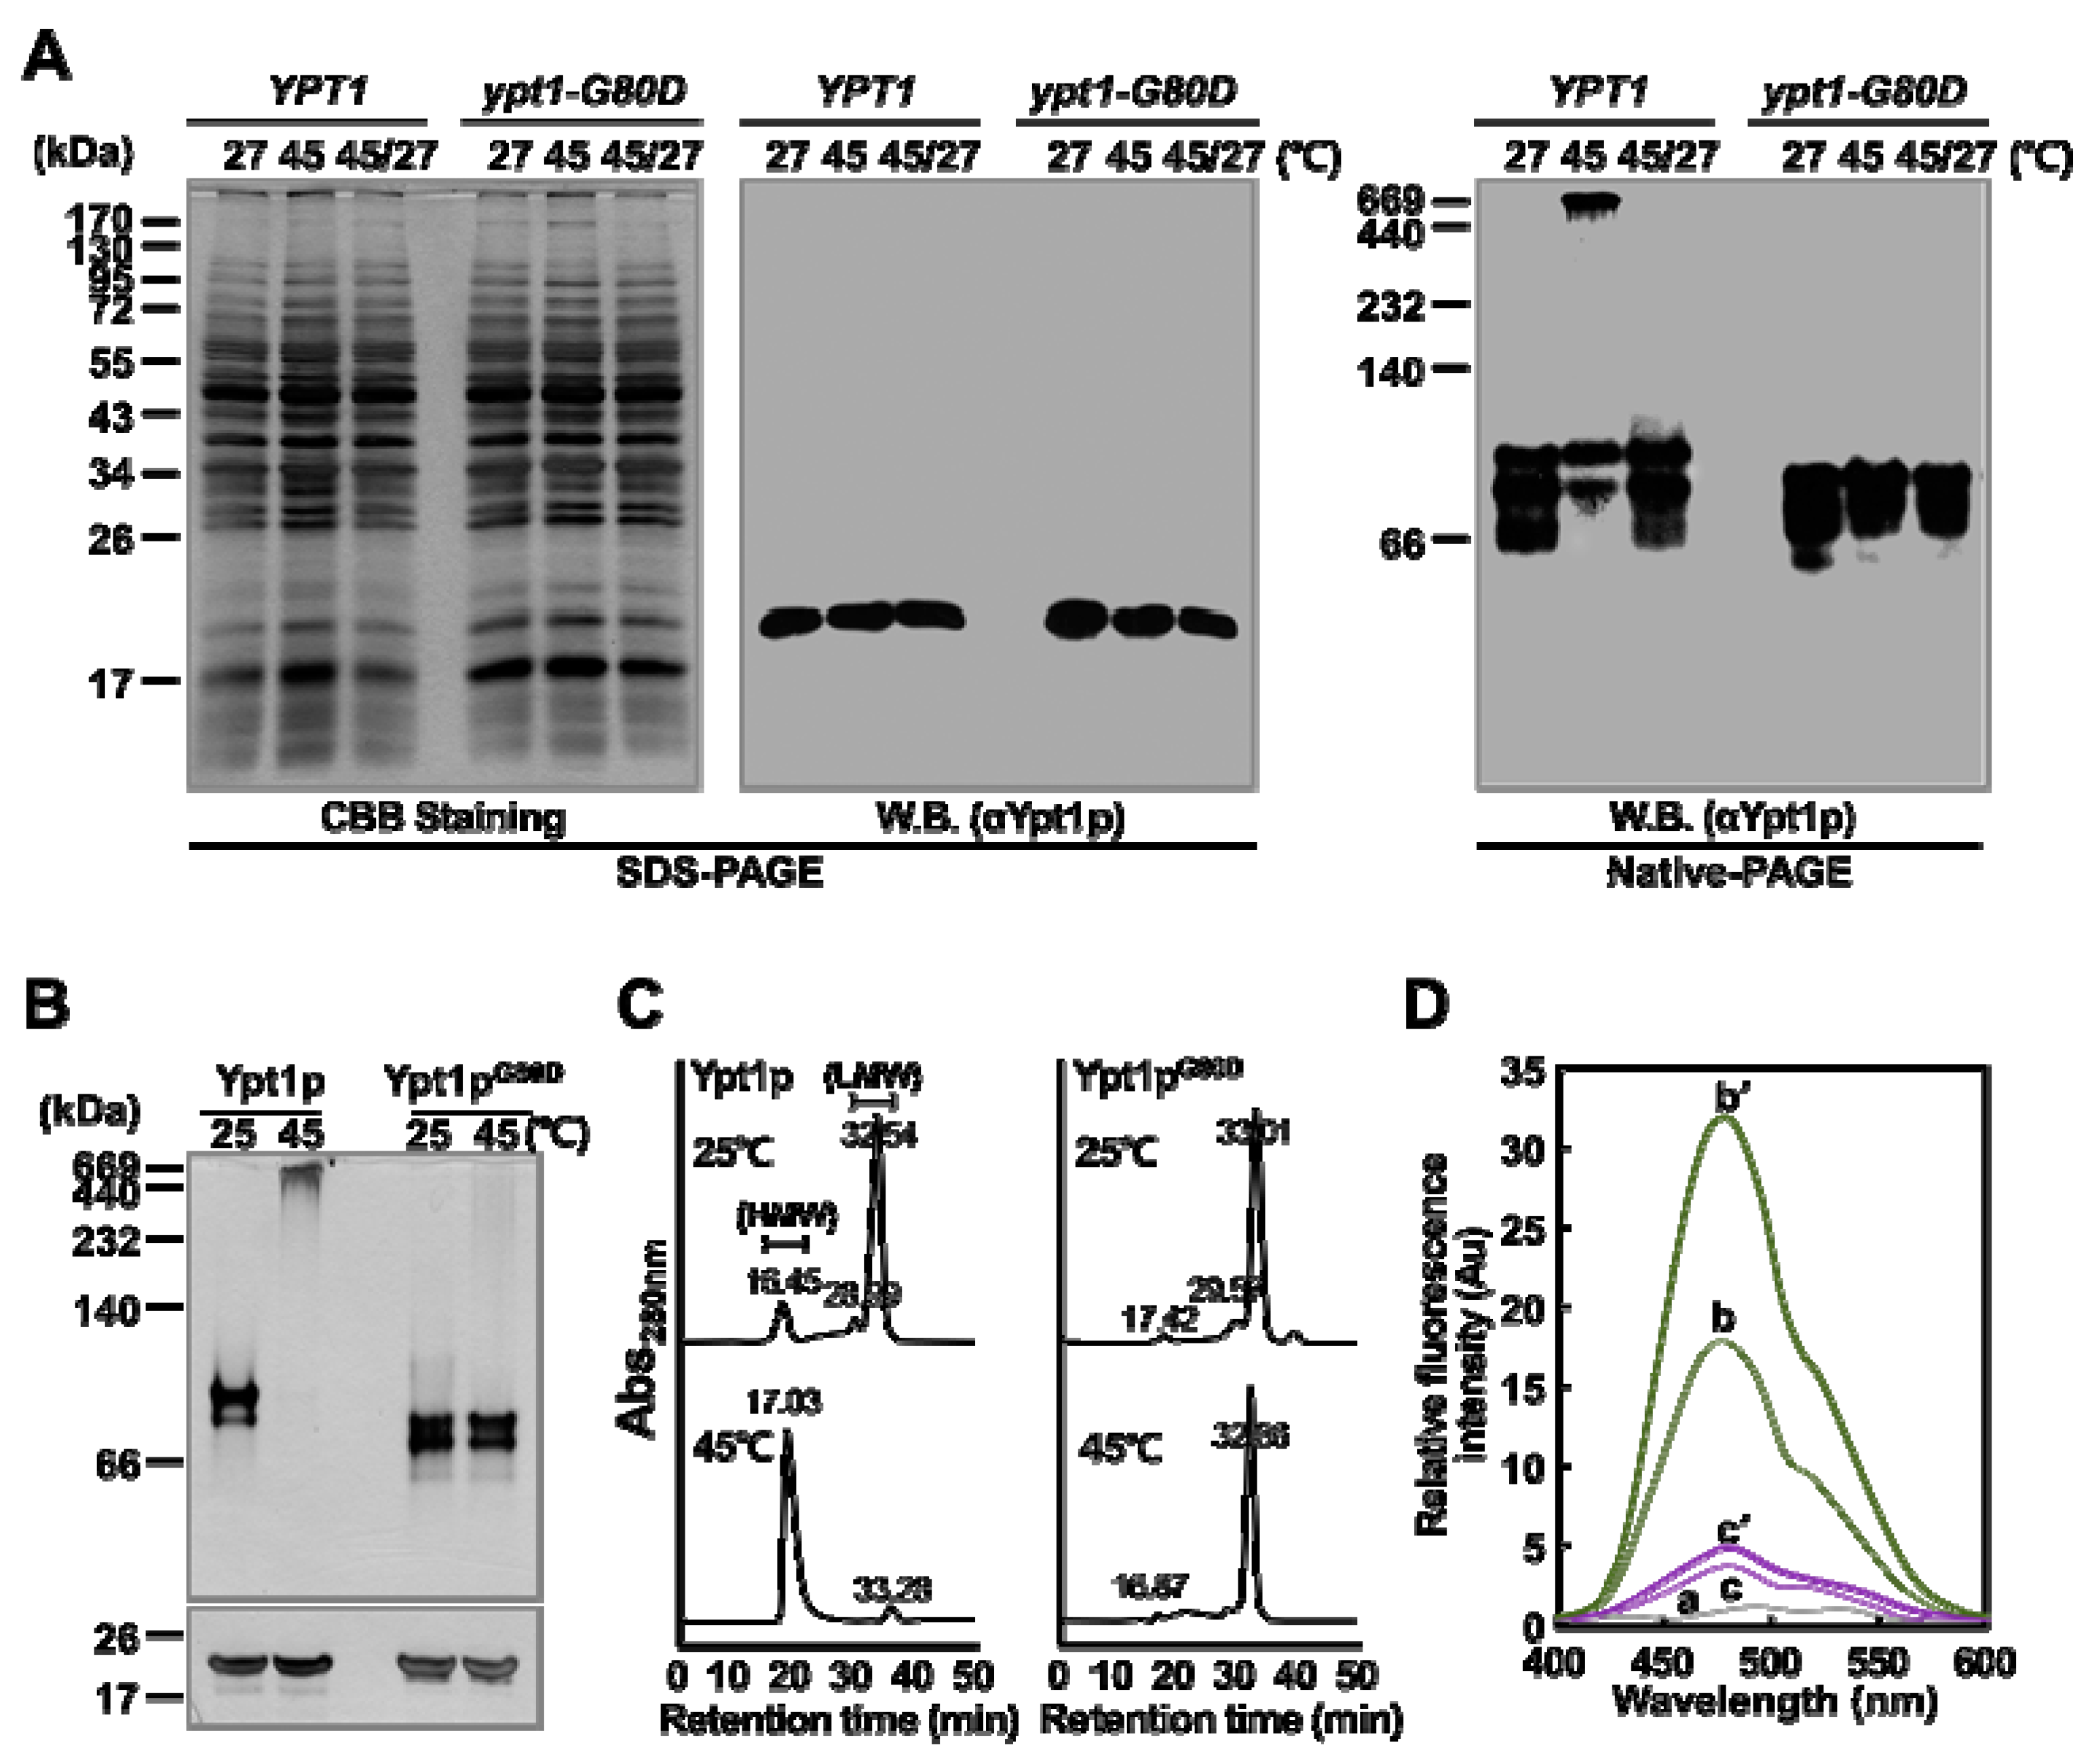
2.3. Ypt1pG80D does not Undergo a Heat-Shock-Induced Structural Change In Vivo

In our previous research, we found that Ypt1p undergoes reversible temperature-dependent structural changes [9]. Therefore, we investigated whether Ypt1pG80D also undergoes temperature-dependent structural modifications in vivo and in vitro. First, YPT1 and ypt1-G80D cells were subjected to heat-shock at 45 °C for 45 min, and then half of the cells were allowed to recover at 27 °C for 10 h in fresh growth medium containing the protein synthesis inhibitor cycloheximide. Total protein extracts of these samples were fractionated by SDS-PAGE and native-PAGE, and Ypt1p/Ypt1pG80D was detected by immunoblotting with an anti-Ypt1p polyclonal antibody prepared in our laboratory [9]. As expected, a single protein band of 23.5 kDa, corresponding to the size of monomeric Ypt1p/Ypt1pG80D, was detected in all samples on the SDS-PAGE gel (Figure 3A). The native-PAGE analysis confirmed that heat-shock treatment induced the reversible formation of HMW protein complexes containing Ypt1p in vivo, as reported previously [9]. By contrast, in the ypt1-G80D cell extract, the antibody detected a relatively narrow range of band sizes. Notably, HMW Ypt1pG80D complexes were not observed in extracts of heat-treated ypt1-G80D cells (Figure 3A). Interestingly, the LMW bands of Ypt1p/Ypt1pG80D show different patterns in the YPT1 and ypt1-G80D cells, with doublets at different positions on native PAGE (Figure 3A). This was similar for the recombinant proteins analyzed on native PAGE (Figure 3B, upper gel). Considering that Glycine, the 80th residue of Ypt1p is replaced with Aspartic acid in Ypt1pG80D, the amino acid replacement could affect size shifts on the gel by affecting secondary or tertiary structure of the protein [13,14].
The inability of ypt1-G80D cells to form heat-induced HMW aggregates containing Ypt1pG80D was confirmed by size exclusion chromatography (SEC). Total protein extracts from heat-treated and untreated ypt1-G80D cells were fractionated by SEC (Figure S1). The fractions were analyzed by SDS-PAGE, and the Ypt1pG80D contents were determined by western blotting (Figure S1). In ypt1-G80D cells, Ypt1pG80D was mainly detected in LMW protein fractions (≤ 140 kDa), regardless of heat treatment.

2.4. Ypt1pG80D does not Undergo a Heat-Shock-Induced Structural Change In Vitro

Next, we investigated the possibility of heat-induced polymerization of purified bacterially expressed recombinant Ypt1pG80D. As observed in our previous study [9], a heat-induced structural change in purified recombinant Ypt1p was confirmed (Figure 3B,C). Native-PAGE analyses revealed no differences between the protein banding patterns of recombinant Ypt1pG80D following incubation at 25 °C or 45 °C, and most of the Ypt1pG80D protein was detected as a LMW oligomer at both temperatures (Figure 3B). Furthermore, SEC analyses revealed no marked differences between the samples incubated at 25 °C or 45 °C (Figure 3C). In the Ypt1pG80D sample, major protein peaks were observed at retention times of 33.01 min and 32.86 min following incubation at 25 °C and 45 °C, respectively, indicating the formation of LMW oligomers under both conditions. Unlike in the Ypt1p sample, the SEC protein peak with a retention time of approximately 17 min, corresponding to HMW oligomers, was almost undetectable in the Ypt1pG80D samples incubated at 25 °C or 45 °C, confirming that Ypt1pG80D is unable to form HMW oligomers upon heat treatment.
We also examined changes in the hydrophobicities of purified bacterially expressed Ypt1p and Ypt1pG80D upon heat treatment using 4,4′-bis (1-anilinonaphthalene 8-sulfonate) (bis-ANS) as a probe. Binding of Bis-ANS to hydrophobic patches on proteins results in fluorescence with an emission maximum of approximately 470 nm [15]. As shown in our previous study [9], when Ypt1p was incubated with bis-ANS (Figure 3D), the fluorescence peak at 470 nm was larger when the incubation was carried out at 45 °C rather than 25 °C. By contrast, Ypt1pG80D exhibited very little fluorescence at 470 nm when incubated with bis-ANS at 25 °C, and there was no significant increase in this fluorescence when the incubation was carried out at 45 °C (Figure 3D). These results indicate that the conformations of Ypt1pG80D and Ypt1p differ at 25 °C, and the conformation of Ypt1pG80D does not change at 45 °C. Overall, the results show that Gly80 is required for both the heat-induced increase in the surface hydrophobicity of Ypt1p (Figure 3D) and the formation of HMW Ypt1p homo-polymers (Figure 3B,C). They also suggest that Ypt1pG80D has a smaller amount of exposed hydrophobic patches than Ypt1p, and subsequently a lower tendency to form HMW complexes.

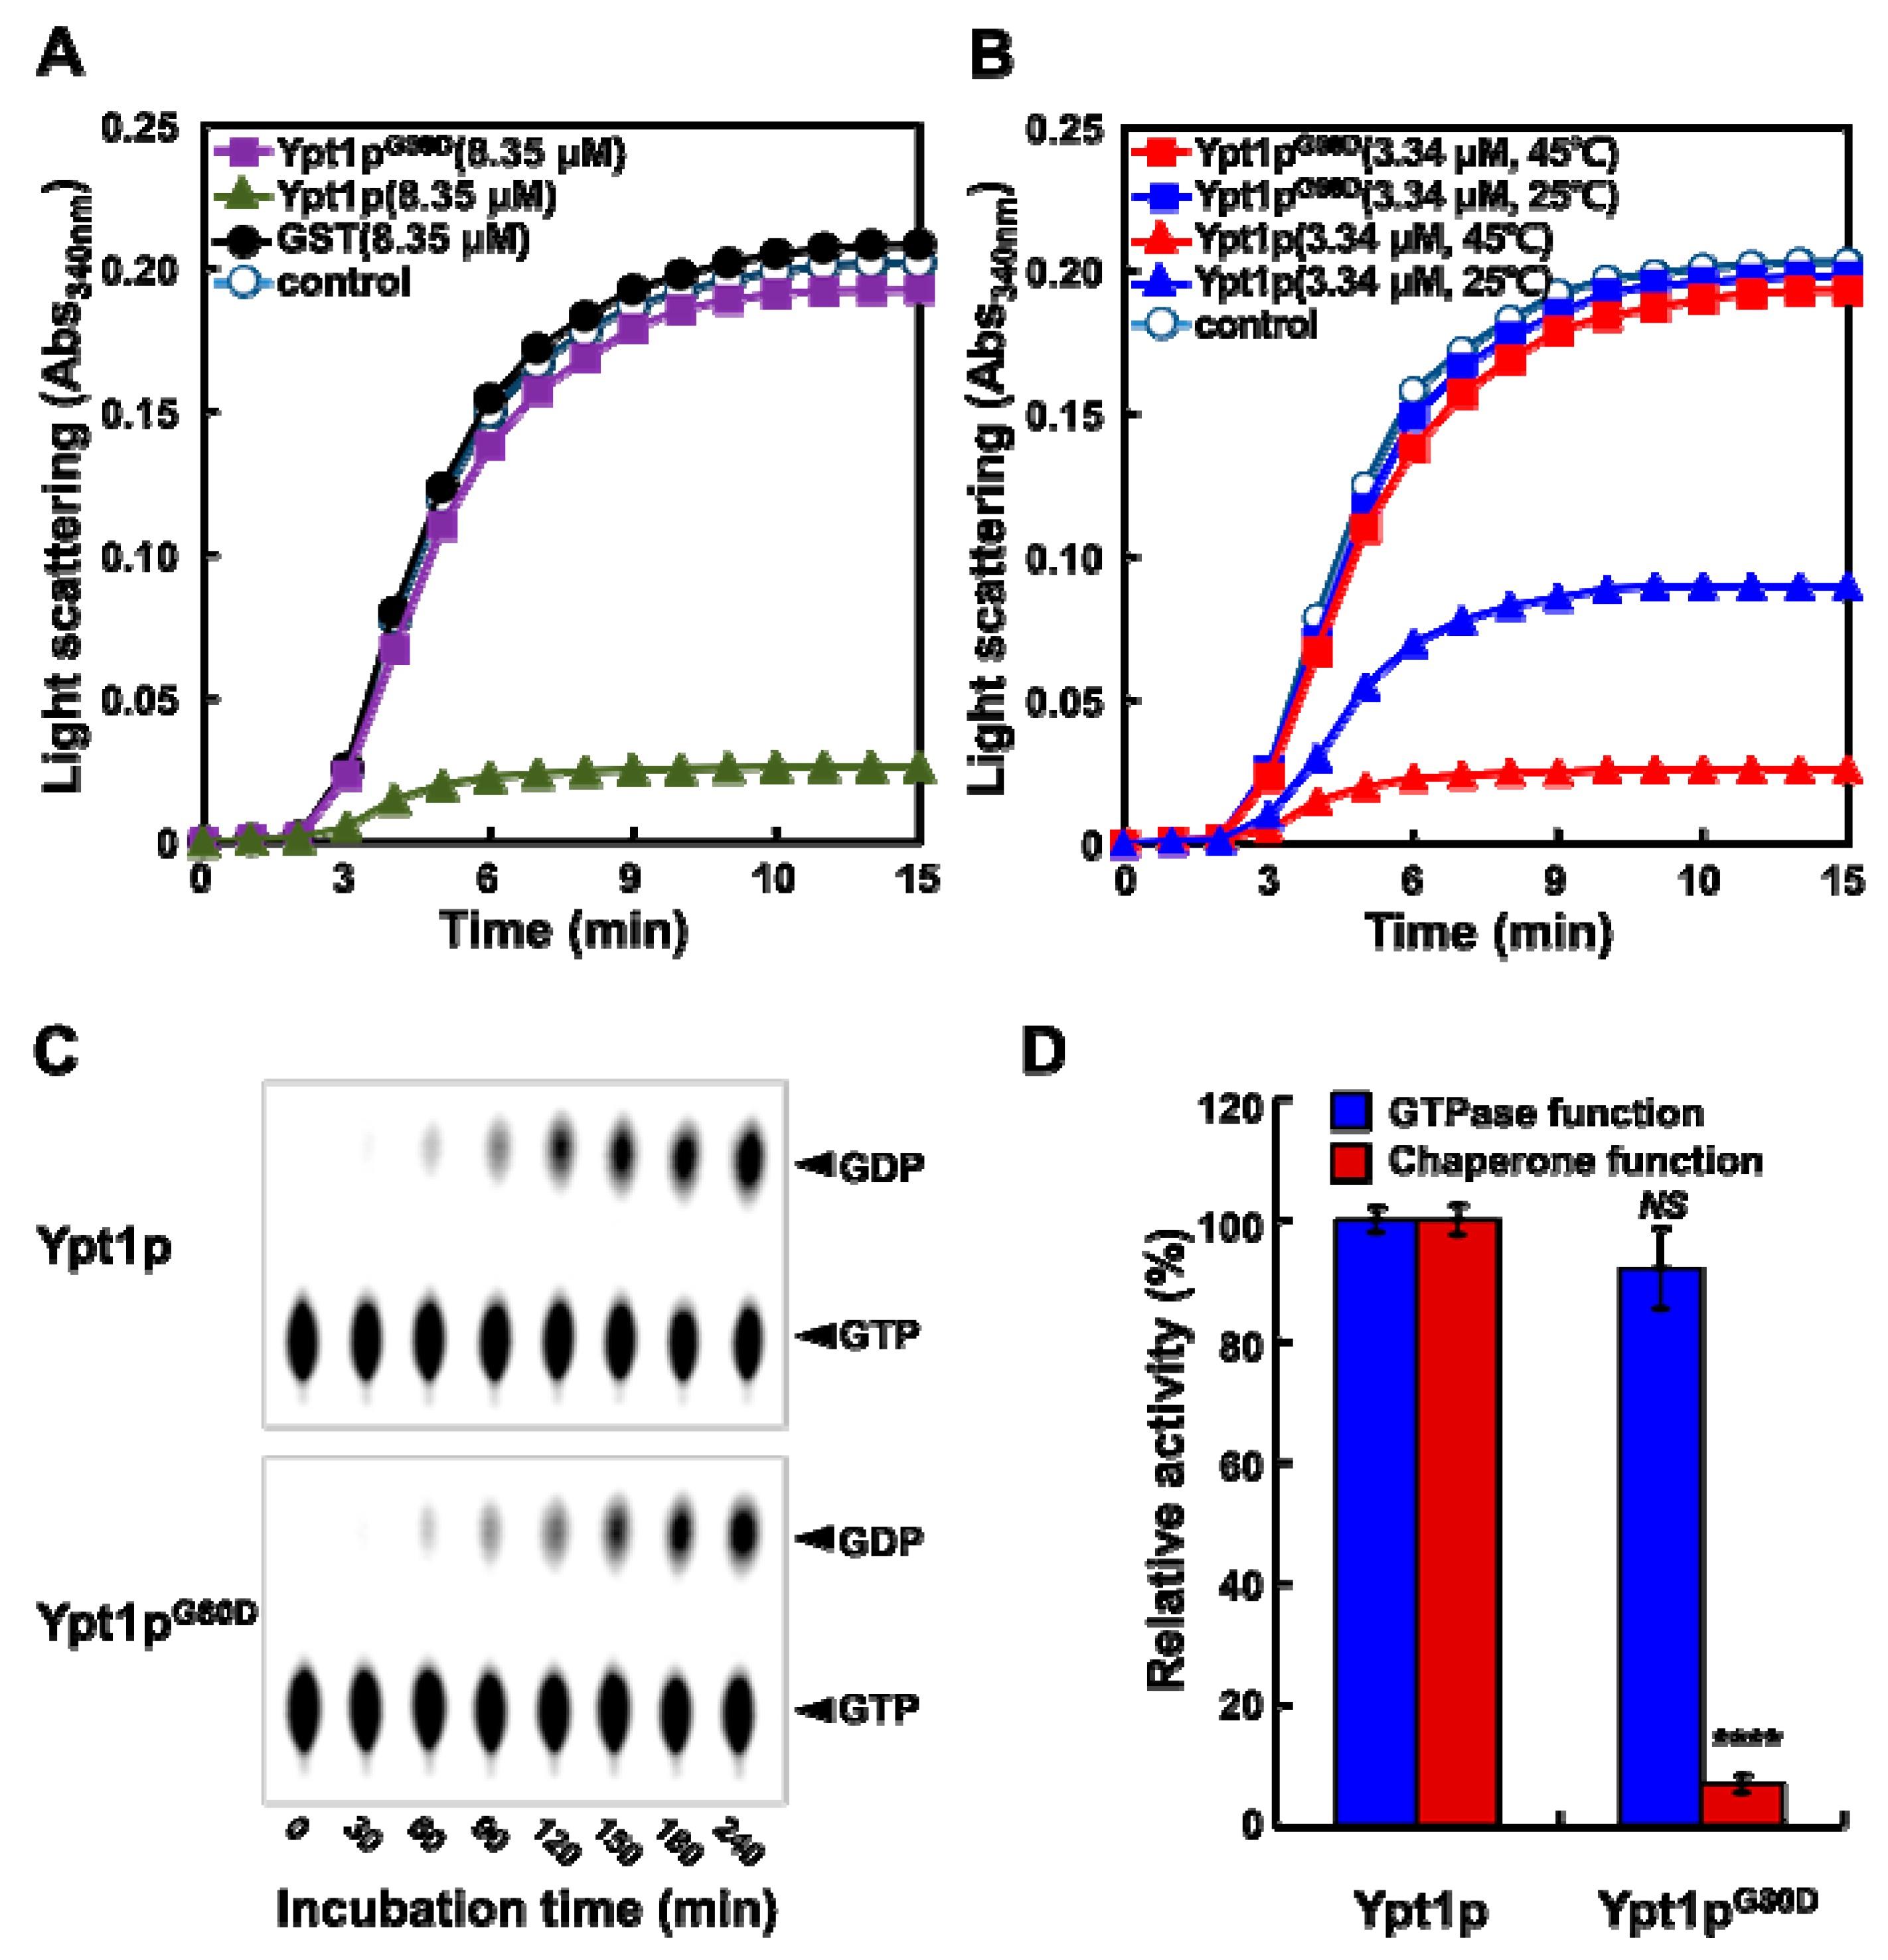
2.5. Ypt1pG80D Retains GTPase Activity but Loses Molecular Chaperone Activity

Since Ypt1pG80D exists as a LMW form regardless of temperature and has a lower hydrophobicity than Ypt1p (Figure 3D), we examined whether the structural difference between Ypt1p and Ypt1pG80D leads to a difference in function. To this end, we examined the chaperone and GTPase activities of Ypt1p and Ypt1pG80D.
To investigate chaperone activity, we measured the abilities of Ypt1p and Ypt1pG80D to prevent heat-induced denaturation of the substrate proteins malate dehydrogenase (MDH) and citrate synthase (CS) [10,16]. The formation of insoluble protein aggregates of denatured MDH and CS was monitored by measuring light scattering at 340 nm (Figure 4A and Figure S2). Light scattering increased rapidly when MDH (1.67 μM) and CS (2 μM) were heated alone or with a 5-fold molar excess (8.35 μM) of Ypt1pG80D or the negative control glutathione-S-transferase (GST) protein. However, when MDH (1.67 μM) and CS (2 μM) were heated in the presence of a 5-fold molar excess of Ypt1p, the aggregation was successively prevented, confirming the molecular chaperone activity of Ypt1p.
Next, we examined the temperature-dependency of the chaperone activities of Ypt1p and Ypt1pG80D. Light scattering increased rapidly when MDH (1.67 μM) was heated alone or with a 2-fold molar excess (3.34 μM) of Ypt1pG80D that had previously been incubated for 30 min at 25 °C or 45 °C (Figure 4B). However, when MDH (1.67 μM) was heated in the presence of a 2-fold molar excess of Ypt1p that was incubated at 25 °C previously, the aggregation was reduced by approximately 50%, and was reduced more substantially in the presence of Ypt1p that was incubated at 45 °C previously (Figure 4B). These findings suggest that the chaperone activity of Ypt1p is enhanced by incubation at a high temperature, whereas Ypt1pG80D does not have molecular chaperone function, regardless of temperature.
The GTPase activities of bacterially expressed recombinant Ypt1p and Ypt1pG80D were comparable (Figure 4C). With both proteins, GDP formation was observed after 1 h and approximately 50% of the [α-32P]GTP substrate was hydrolyzed within 6 h. Ypt1pG80D retained almost 90% of the GTPase activity of native Ypt1p, but less than 10% of the chaperone activity (Figure 4D). These results suggest that the increased heat-stress sensitivity of ypt1-G80D mutants is likely related to the loss of Ypt1p chaperone activity.

2.6. PBA Increases the Thermo Tolerance of ypt1-G80D Cells

To further confirm that the lack of chaperone function in Ypt1pG80D accounts for the thermal sensitivity of the ypt1-G80D mutant, we compared the heat sensitivities of YPT1 and ypt1-G80D strains by incubating them at 27 °C or 45 °C for 1 h in the presence or absence of sodium 4-phenylbutyric acid (PBA), a chemical chaperone [17] (Figure 5). At 27 °C, there was no difference between the growth of the strains in either the absence or presence of PBA. Following incubation at 45 °C, the viability of the ypt1-G80D mutant was reduced to a greater extent than that of the YPT1 strain in the absence of PBA. The viabilities of both strains were improved in the presence of PBA, but the improvement was more marked for the ypt1-G80D mutant than the YPT1 strain (Figure 5A). Next, we compared survival of the two strains after incubating comparable concentrations of mid-logarithmic phase cells for up to 60 min at 45 °C in the presence or absence of 1 mM PBA (Figure 5B). PBA had no effect on the viability of YPT1 cells at 45 °C, as determined by measuring viable counts or using the TB exclusion assay (Figure 5B,C). By contrast, PBA exposure increased the viability of ypt1-G80D cells (Figure 5B,C), although it was not restored to the level seen for the YPT1 strain. These results support the conclusion that the thermal sensitivity of the ypt1-G80D mutant is due to a deficiency in the heat-induced chaperone function of Ypt1pG80D.

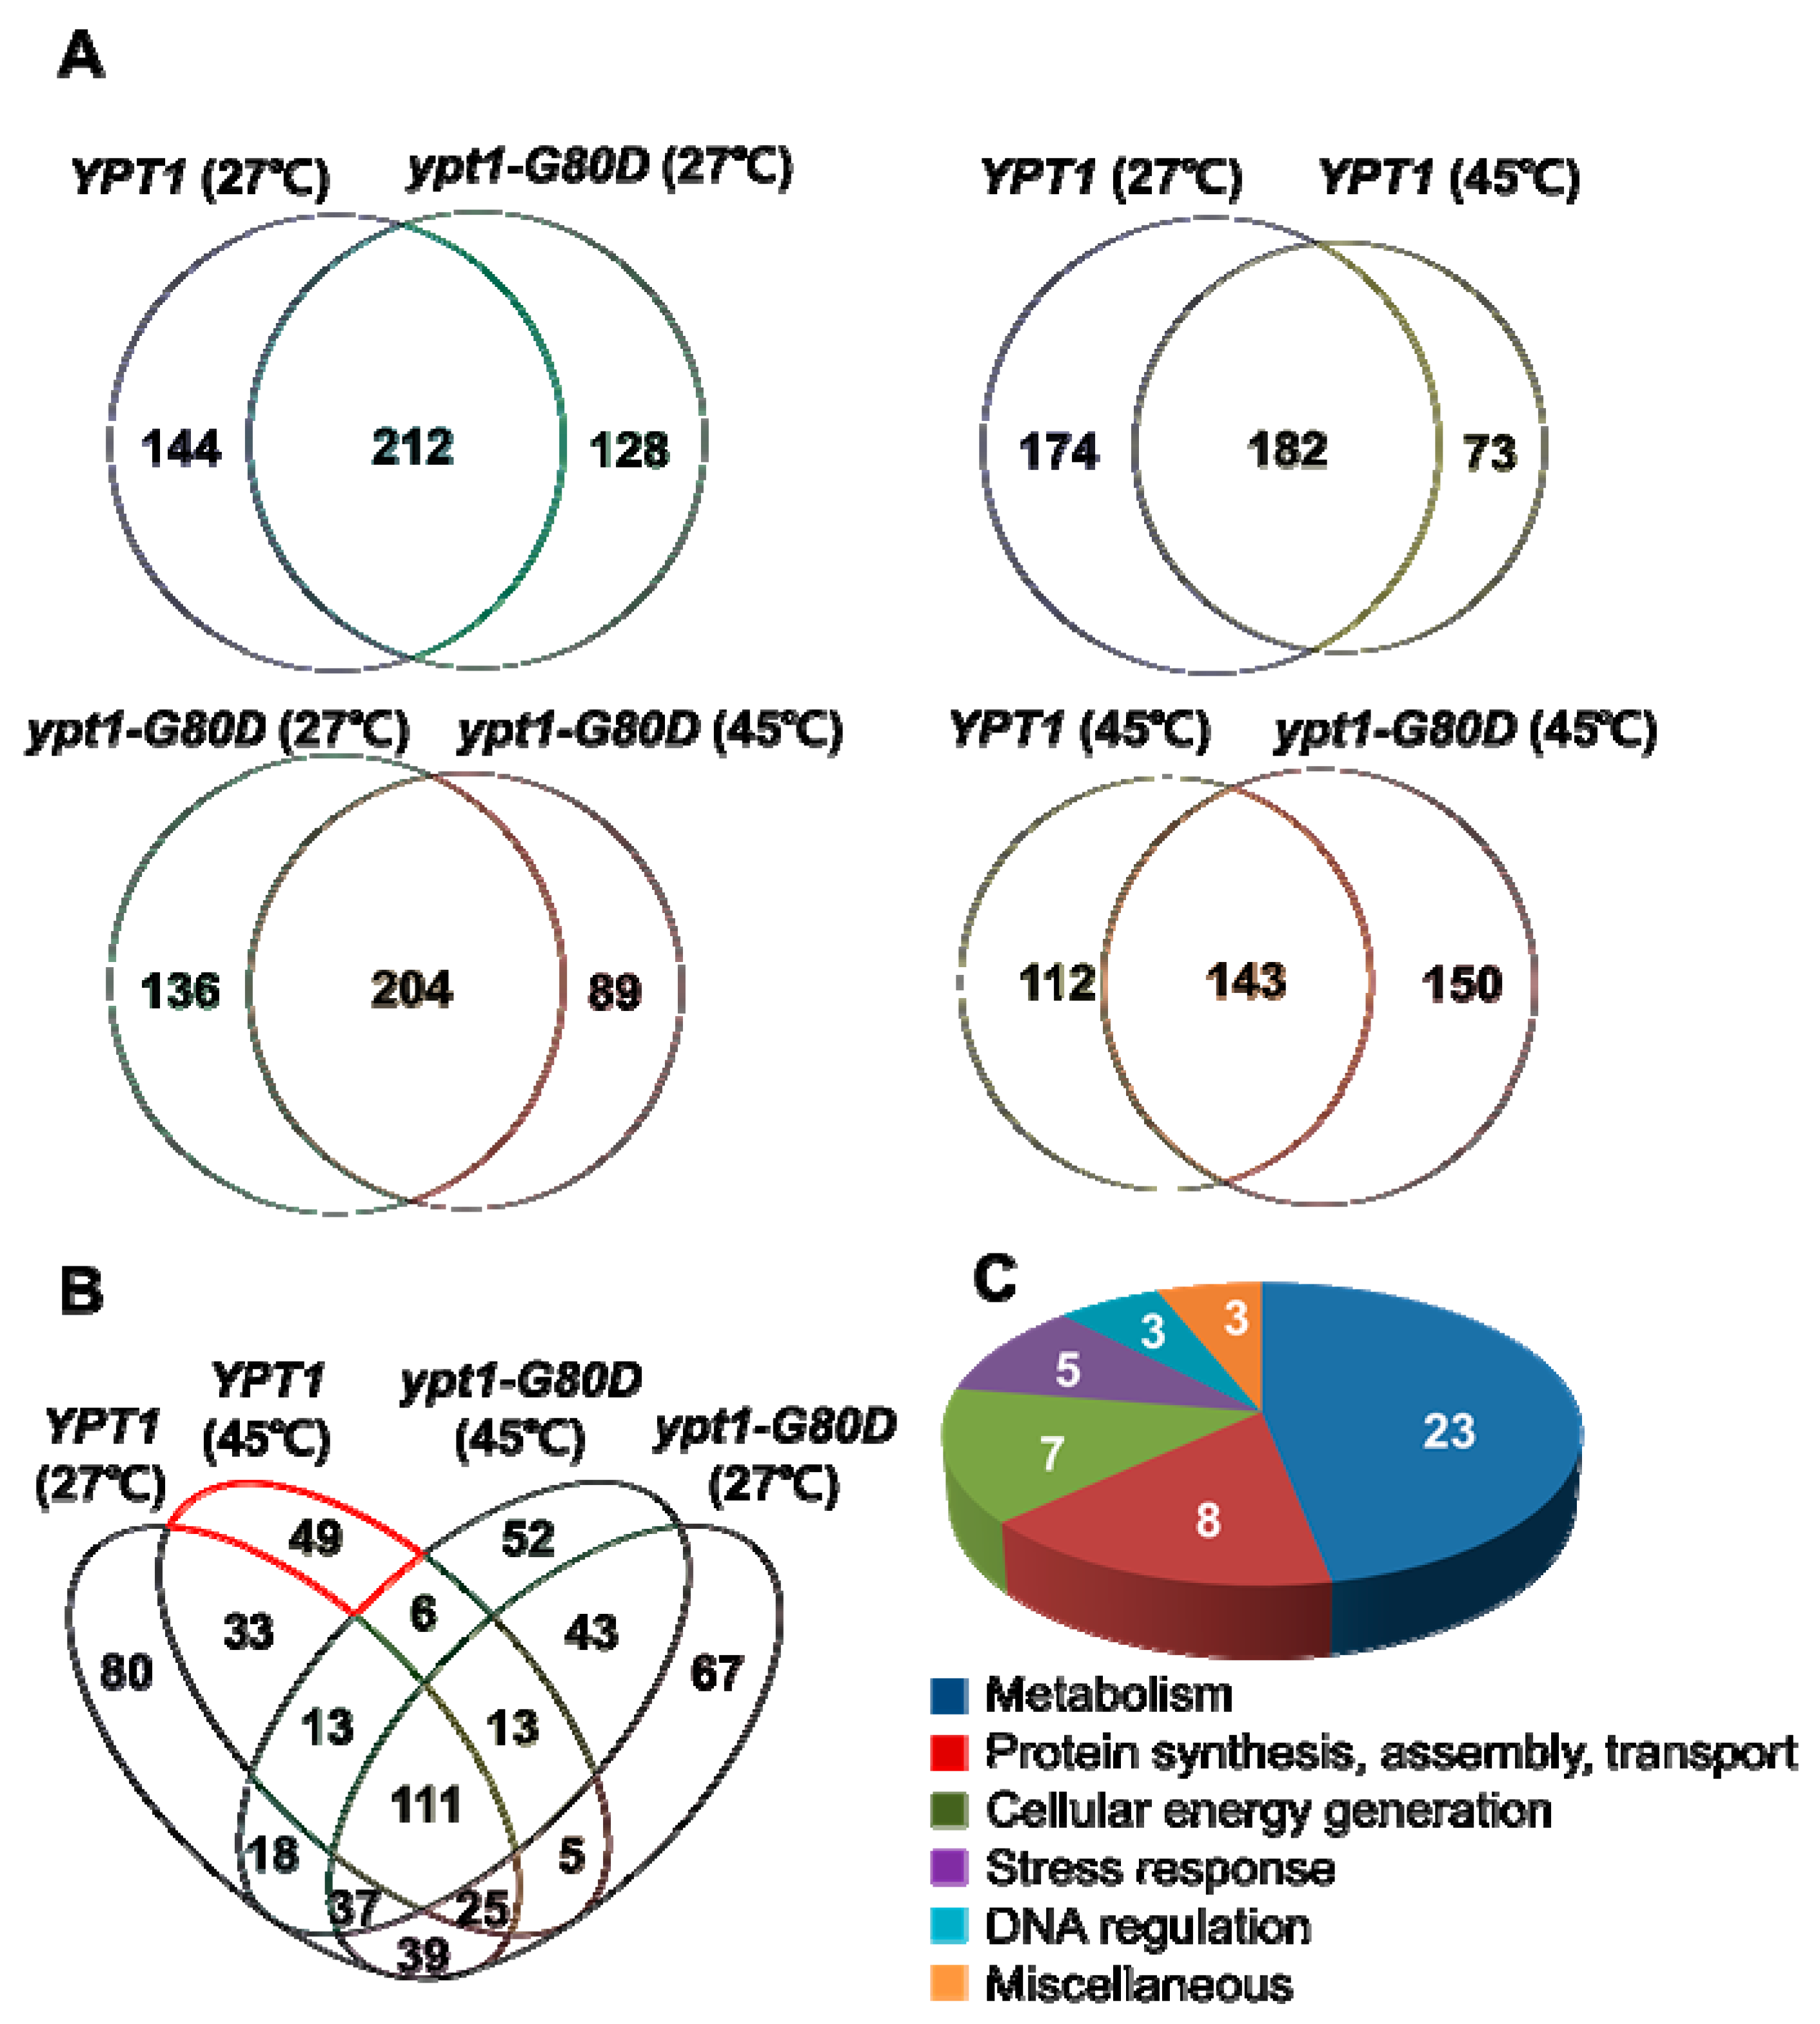
2.7. Identification of Putative Ypt1p-Regulatory Proteins under Heat-Shock

To identify intracellular Ypt1p-regulatory proteins in heat-shocked yeast cells, YPT1 and ypt1-G80D cells were incubated at 27 °C or 45 °C for 1 h and total proteins were analyzed by tandem MS (MS/MS) using a Velos LTQ mass spectrometer [18] (Figure S3). Trypsinized peptides were separated by reversed-phase nanoflow liquid chromatography (LC) followed by MS/MS sequencing in the high energy collision dissociation (HCD) mode, and the peptide spectra were searched against the Uniprot database (http://www.uniprot.org/) of Saccharomyces cerevisiae proteins, using the SEQUEST algorithm. For highest fidelity, the cut-off was set at 99% false discovery rate. From the total protein fraction of YPT1 cells, 356 and 255 proteins were identified at 27 °C and 45 °C, respectively, whereas the corresponding numbers from ypt1-G80D cells were 340 and 293 proteins, respectively. A total of 73 proteins were specifically enriched in YPT1 cells incubated at 45 °C compared with 27 °C (Figure 6). By comparison, 89 proteins were specifically enriched in ypt1-G80D cells incubated at 45 °C compared with 27 °C (Figure 6). Six heat-induced proteins were common to both strains, including alcohol dehydrogenase 1p (Adh1p, E7LZZ9), phosphorylase (Gph1p, B3LKC1), vacuolar protein sorting 29p (Vps29p, E7KDB3), ADP-ribosylation factor 1 (P11076), lipoamide dehydrogenase 1p (Lpd1p, E7NH76), and YMR051C-like protein (E7QCY4). A total of 49 proteins were specifically enriched in heat-treated YPT1 cells but were not identified among the heat-shock-enriched proteins in ypt1-G80D cells, suggesting that these proteins are directly or indirectly dependent on Gly80 of Ypt1p (Table 1 and Table S1). Among the YPT1-specific heat-shock-induced proteins, 23 were annotated as involved in metabolism; 8 were involved in protein synthesis, assembly, or transport; 7 were involved in cellular energy generation, 5 were involved in stress response, 3 were involved in DNA regulation, and the remaining 3 proteins were annotated as “miscellaneous”. This finding suggests that abrogation of heat-shock-induced Ypt1p chaperone function by the G80D mutation lowers cell viability largely by hindering metabolism and cellular energy generation.

3. Discussion

Organisms need to be able to adapt to their environment because environmental nutritional usability, osmotic balance, temperature, and presence of harmful substances are constantly changing. To protect against these external stresses [19,20], all aerobic organisms are equipped with a wide range of protective proteins, including a diverse range of molecular chaperones such as the heat-shock proteins, the small heat-shock proteins, and several redox chaperones [21,22]. Recent reports showed that some plant proteins play a role in cellular protection against heat-stress via the acquisition of new functions endowed by heat-induced structural changes [16,23,24,25]. In addition, two yeast cytosolic peroxiredoxins (Prxs) change from a LMW form to a HMW form following heat-shock or oxidative stress, conferring stress resistance to cells [10]. This structural change is accompanied by functional switching from a peroxidase to a molecular chaperone. Our previous study [9] showed that heat-shock induces a reversible polymerization of Ytp1p into a HMW form in vivo and in vitro, and this structural change abolishes the original GTPase activity but confers a new molecular chaperone activity on the protein. If cells are allowed to recover from heat-stress, Ypt1p reverts back to the LMW form in vivo.
Loss of the function of molecular chaperone genes reduces the ability of cells to protect against environmental stresses [26,27,28]. For example, yeast cells become very sensitive to heat-shock stress following loss of the cPrxI and cPrxII genes [10]. As expected, mutations in the YPT1 gene cause defective yeast growth at a non-permissive temperature. Representatively, the ypt1-G80D mutant strain shows a temperature-sensitive phenotype [7]; however, the reason for this defect had not previously been identified. In the current study, we examined the physiological effects of the G80D mutation in ypt1-G80D mutant cells. We found that Ypt1pG80D retained most of the GTPase activity of Ypt1p but was unable to form HMW complexes and lacked chaperone function (Figure 3, Figure 4, Figures S1 and S2). The ypt1-G80D mutant strain experienced a greater loss of viability than the YPT1 strain when exposed to heat-shock (Figure 1 and Figure 5), suggesting that heat-stress-driven polymerization and switching of Ypt1p function to a molecular chaperone is critical for cell survival. Addition of a chemical chaperone to the growth medium of the ypt1-G80D strain reduced its heat sensitivity (Figure 5). Therefore, we suggest that an increase in the proportion of HMW Ypt1p polymers in a cell experiencing heat-stress helps to prevent the stress-induced aggregation of intracellular proteins that leads to loss of viability (Figure 2).
In general, hydrophobic regions are buried inside proteins that are properly folded. However, when cells are exposed to severe stress, such as heat-shock or oxidative stress, the proteins are denatured and the hydrophobic regions are exposed. Subsequently, the external hydrophobic regions are recognized by molecular chaperones, which target a number of denatured proteins [29,30]. Accordingly, we observed an abundance of numerous insoluble proteins in the ypt1-G80D strain that lacked the chaperone function of Ypt1p (Figure 2). Proteomic analysis of proteins extracted from unstressed and heat-shocked YPT1 and ypt1-G80D cells identified 49 proteins that were heat-shock-induced in YPT1 cells but not ypt1-G80D cells, implying that the chaperone function of Ypt1p is essential for the increase in abundance of these particular proteins under stress (Figure 6). Included in these 49 proteins were various enzymes involved in glycolysis and the tricarboxylic acid cycle, and proteins necessary for cellular energy generation, protein synthesis, protein assembly, and protein transport (Table 1). These results suggest that loss of Ypt1p chaperone function may cause problems in cell metabolism, protein synthesis, and energy generation under heat-shock. Stress-seventy subfamily A 1p (Ssa1p, E7Q0L2), ATP synthase subunit beta (Atp2p, E7Q5S7), inorganic pyrophosphatase (Ipp1p, P00817), porin (Por1p, B3LNR6), and translation elongation factor 2 (Eft2p, E7NN07) showed the highest numbers of peptide-spectrum matches among the 49 proteins (Table S1), and previous studies found that complete or partial loss of the functions of these proteins by mutation of the corresponding genes increases the heat sensitivity of yeast cells [26,27,28]. The fact that these proteins were less abundant in ypt1-G80D cells than YPT1 cells under heat-shock conditions may explain why ypt1-G80D cells are sensitive to this type of stress. Further studies of ypt1 mutants are required to examine this possibility.
Small G-proteins affect most biological processes by controlling complex cell signaling processes. As a result of their extensive cellular roles, inadequate control and functional failure of small G-proteins often lead to human diseases [31]. For example, dysfunction of Rab GTPase contributes to genetic or acquired human diseases [32,33]. Therefore, small G-proteins and their regulators are targets for the development of various human medicines. Previous studies have mainly focused on the functions of small G-proteins as GTPases; however, our current research suggests that it may be possible to find new ways to cure human diseases by expanding the horizon of small G-proteins to a new family of molecular chaperones. In this regard, previous findings that various molecular chaperones are closely related to human diseases should be considered [34,35].

4. Materials and Methods

4.1. Yeast Strains, Survivability Assays, and TB Exclusion Assay

Isogenic YPT1 (SVL82; MaTα, ade2, his3, leu2, trp1, ura3, can1) and ypt1-G80D (SVL422; MaTα, ade2, his3, leu2, trp1, ura3, can1, ypt1-G80D) S. cerevisiae W303 strains were grown in YPD medium at 27 °C [7]. For the viable count assay, yeast cells were grown overnight in YPD medium and cells (5 × 10⁷ cells/mL) in fresh YPD medium were incubated at 27 °C or 45 °C. Samples were withdrawn at 0, 10, 20, 30, 40, 50, and 60 min after incubation, and survival assays were performed. The numbers of viable cells or colony forming units were determined by plating suitable dilutions onto YPD agar plates and counting the colonies that appeared after 2–3 days of incubation at 27 °C.
Samples of the YPT1 and ypt1-G80D cells at the 60 min time point in the survival assay were subjected to TB staining and spot assays. For TB staining, 1 mL of cells was harvested by centrifugation, washed with PBS (140 mM NaCl, 2.7 mM KCl, 10 mM Na2HPO4, and 1.8 mM KH2PO4 [pH 7.6]), resuspended in PBS, and stained with 0.4% TB for 5–10 min. The cells were examined under a fluorescence microscope (Olympus Optical Co., Tokyo, Japan), and results were documented using software provided by the company. For spot assays, cultures were adjusted to an Abs600nm of 1.0 and aliquots (6 μL) of 10-fold serial dilutions were spotted onto YPD agar. The plates were examined after incubation at 27 °C for 2–3 days.

4.2. Analysis of Heat-Shock-Induced Cytosolic Protein Aggregation in Yeast Cells

Samples of the cell cultures at the 60 min time point in the survival assay underwent measurements of cytosolic protein aggregation, as described previously [10]. Yeast cells harvested at an identical cell density were resuspended in lysis buffer (50 mM potassium phosphate buffer [pH 7.0], 1 mM EDTA, 5% glycerol, and 1 mM PMSF) containing protease inhibitor cocktail (Sigma-Aldrich, St. Louis, MO, USA) and incubated at 30 °C for 30 min after adding 0.25 volumes of zymolase 20T (10 mg/mL). The cells were broken by beating them three times with acid-washed glass beads in a bead beater (Biospec Products, Bartlesville, OK, USA) for 1 min. Each beating was followed by cooling at 4 °C for 2 min. After removing intact cells by brief centrifugation, the mixture was separated into an insoluble pellet fraction and a cytosolic supernatant by centrifugation at 15,000 g for 30 min. The insoluble pellet fraction containing the membrane and aggregated proteins was then resuspended in 320 μL of lysis buffer by brief sonification. Membrane proteins were removed by adding 80 μL of 10% (v/v) NP40 and centrifuging at 15,000 g for 20 min. The NP40-insoluble protein aggregates in the pellet were then analyzed by gel electrophoresis. Protein concentrations in the cytosolic and insoluble fractions were measured to analyze the proportions of the insoluble fractions in the total cytosolic proteins.

4.3. Construction of Expression Plasmids

The G80D-F (5′-TCTTACTACCGTGATTCGCATGGGATC-3′) and G80D-R (5′-GATCCCATGCGAATCACGGTAGTAAGA-3′) primers were used to generate the G80D mutation. Substitution of single amino acids was performed using the QuickChange™ Site-Directed Mutagenesis Kit (Stratagene, La Jolla, CA, USA), as described previously [36]. To generate pGEX-ypt1G80D, mutation was performed by targeting the pGEMT-YPT1 plasmid [9]; the insert was then released by digesting the resulting plasmid with BamHI and HindIII, and cloned into the corresponding sites of the pGEX-2T vector.

4.4. Purification of Recombinant Proteins and Production of the Polyclonal Antibody

The pGEX-YPT1 and pGEX-ypt1G80D vectors were transformed into Escherichia coli BL21(DE3)pLysS cells. The cells were then cultured at 37 °C in LB medium supplemented with ampicillin (50 μg/mL). At an Abs600nm of approximately 0.5–0.6, protein expression was induced by the addition of 0.2 mM isopropyl-β-D-thiogalacto-pyranoside. After an additional 4 h culture at 30 °C, the cells were harvested by centrifugation at 6000 g for 6 min. The pellets were resuspended in PBS buffer containing 1 mM PMSF and stored at –70 °C. GST-fused Ypt1p proteins were purified from the cells using GSH-agarose resin, and the GST-tag was removed by thrombin cleavage, as described previously [37]. Ypt1p proteins were further purified using a TSK heparin-5PW HPLC column (7.5 × 75 mm), as described previously [38]. DnaK, a possible co-purifying contaminant on GSH columns, was removed using an ATP-agarose column according to the manufacturer’s instructions (Amersham Pharmacia Biotech, Piscataway, NJ, USA). The pure Ypt1p proteins were dialyzed against 20 mM HEPES (pH 8.0) before use. Purified Ypt1p was used for the immunization of rabbits to obtain a polyclonal antibody.

4.5. Size Exclusion Chromatography

SEC was performed on a Superdex 200 HR 10/30 column equilibrated with 50 mM HEPES (pH 8.0) buffer containing 100 mM NaCl, at a flow rate of 0.5 mL/min (AKTAFPLC; Amersham Biosciences, Piscataway, NJ, USA), as described previously [10]. Protein (Abs280nm) peaks were pooled and concentrated using Centricon YM-30 (Millipore Corp., Bedford, MA, USA).

4.6. Assay of GTPase Activity

A thin layer chromatography (TLC) technique [39] was modified slightly for measurement of GTPase activity. The GTPase reaction was allowed to proceed at 30 °C in 200 μL of HEDL buffer (20 mM Tri-HCl [pH 7.5], 2 mM EDTA, and 10 mM DTT) containing 0.1 μM [α32P]GTP and 2 μg of Ypt1p. At appropriate time intervals, 10 μL aliquots were withdrawn and added to 10 μL of 0.5 M EDTA (pH 8.0) to stop the reaction. Subsequently, a 2 μL aliquot of this mixture was spotted onto a PEI-cellulose TLC plate. The plates were developed in 0.5 M KH2PO4 (pH 3.4), dried, and exposed to X-ray film as described previously [40].

4.7. Measurement of bis-ANS Fluorescence

A reaction mixture containing proteins (30 μg/mL in 20 mM HEPES, pH 8.0) and bis-ANS (10 μM; Sigma-Aldrich) was incubated at various temperatures for 30 min, and then the fluorescence spectrum between 400 and 600 nm was obtained at an excitation wavelength of 380 nm using a SFM25 spectrofluorometer (Kontron, Zurich, Switzerland).

4.8. LC/MS Analysis

YPT1 and ypt1-G80D cell cultures in YPD medium were adjusted to an Abs600nm of 1.0 and incubated at 27 °C or 45 °C for 1 h. The cells were harvested by centrifugation, and the culture medium was removed completely by pipetting. To prepare total protein samples, yeast cells were lysed in lysis buffer (8 M urea, 100 mM NaH2PO4, and 50 mM Tris [pH 8.0]) using a pestle and mortar. Subsequently, the 8 M urea samples were diluted with an equal volume of 20 mM Tris [pH 8.0] to a final concentration of 4 M urea. Trypsin was added to the solution in an enzyme/protein ratio of 1:50, along with 2 mM CaCl2. After digestion, the tryptic digests were desalted using a C18 solid-phase extraction pipette tip (SPEC PT C18; Varian, Lake Forrest, CA, USA), vacuum-dried, and reconstituted in 10 mL of 95% water, 5% acetonitrile, and 0.1% formic acid. The samples were analyzed by electrospray ionization MS using a system consisting of a nanoflow liquid chromatograph (nanoAcquity; Waters Corp., Milford, MA, USA) connected online to an electrospray ionization FT/ion-trap mass spectrometer (LTQ Orbitrap Velos; Thermo Fisher Scientific, San Jose, CA, USA). LC separation employed a 100 × 365 μm fused silica capillary microcolumn packed with 15 cm of 3 μm diameter, 100 Å pore size, C18 beads (Magic C18; Bruker, Billerica, MA, USA), with the emitter tip pulled to approximately 2 μm using a laser puller (Sutter Instruments). Peptides were loaded onto the column at a flow rate of 500 nL/min for 30 min, and then eluted over 120 min at a flow rate of 200 nL/min with a gradient of 2–30% acetonitrile in 0.1% formic acid. Full mass scans were performed in the FT orbitrap between 300 and 1500 mass-to-charge ratio at a resolution of 60,000, followed by ten MS/MS HCD scans of the ten highest intensity parent ions at 42% relative collision energy and 7500 resolution, with a mass range starting at 100 mass-to-charge ratio. Dynamic exclusion was enabled with a repeat count of two over the duration of 30 s and an exclusion window of 120 s. The acquired precursor MS and MS/MS spectra were searched against the Uniprot database (http://www.uniprot.org/) of Saccharomyces cerevisiae proteins using SEQUEST version 1.2 (ThermoFisher Scientific). Masses of the precursor and fragment ions were treated as monoisotopic. The database search allowed for up to two missed trypsin cleavages, and ion masses were matched with a mass tolerance of 10 ppm for precursor masses and 0.1 D for HCD fragments. The data were filtered using a 1% false discovery rate [41], with a minimum of two peptide matches required for confident protein identification. The database search using the peptide sequences from the MS analyses identified 356 and 255 proteins for the 30 °C or 45 °C YPT1 samples, respectively, and 340 and 293 proteins for the ypt1-G80D cells, respectively (Table S1). The identified proteins were further analyzed for shared or specific groups using the free software VENNY [42].

Supplementary Materials

Supplementary materials can be found at https://www.mdpi.com/1422-0067/20/1/132/s1.

Author Contributions

C.H.K. and S.Y.L. conceived and designed experiments. C.H.K. and J.H.P. performed yeast cell culture, survivability test, LC/MS analysis, and data analysis. J.H.P., H.B.C., and Y.H.C. performed chaperone and GTPase assays. C.H.K., J.H.P., E.S.L. and S.K.P. performed experiments on the structural changes. C.H.K., J.H.P. and S.Y.L. wrote the paper.

Funding

This work was supported by grants from the NG-BioGreen 21 Program (SSAC, grant numbers PJ01317301 and PJ01334001), RDA, and the Basic Science Research Program (grant number 2016R1D1A1B01016551) through the National Research Foundation funded by MOEST, Korea.

Acknowledgments

We appreciate technical assistance with the LTQ-Orbitrap (LS-MS) by the Pohang Center for Evaluation of Biomaterials (POCEB) at Pohang Technopark.

Conflicts of Interest

The authors declare no conflict of interest.

Abbreviations

bis-ANS4,4′-bis (1-anilinonaphthalene 8-sulfonate)
CBBCoomassie Brilliant Blue
CScitrate synthase
GSTglutathione-S-transferase
HMWhigh molecular weight
LC-MSLiquid chromatography-mass spectrometry
LMWlow molecular weight
MDHmalate dehydrogenase
PBAsodium 4-phenylbutyric acid
Prxperoxiredoxin
SECsize exclusion chromatography
TBtrypan blue
TLCthin layer chromatography

References

  1. Jedd, G.; Richardson, C.; Litt, R.; Segev, N. The Ypt1 GTPase is essential for the first two steps of the yeast secretory pathway. J. Cell Biol. 1995, 131, 583–590. [Google Scholar] [CrossRef] [PubMed] [Green Version]
  2. Segev, N.; Botstein, D. The ras-like yeast YPT1 gene is itself essential for growth, sporulation, and starvation response. Mol. Cell Biol. 1987, 7, 2367–2377. [Google Scholar] [CrossRef] [PubMed]
  3. Nuoffer, C.; Davidson, H.W.; Matteson, J.; Meinkoth, J.; Balch, W.E. A GDP-bound of rab1 inhibits protein export from the endoplasmic reticulum and transport between Golgi compartments. J. Cell Biol. 1994, 125, 225–237. [Google Scholar] [CrossRef] [PubMed] [Green Version]
  4. Richardson, C.J.; Jones, S.; Litt, R.J.; Segev, N. GTP hydrolysis is not important for Ypt1 GTPase function in vesicular transport. Mol. Cell Biol. 1998, 18, 827–838. [Google Scholar] [CrossRef] [PubMed]
  5. Du, L.L.; Novick, P. Yeast rab GTPase-activating protein Gyp1p localizes to the Golgi apparatus and is a negative regulator of Ypt1p. Mol. Biol. Cell 2001, 12, 1215–1226. [Google Scholar] [CrossRef] [PubMed]
  6. Ballew, N.; Liu, Y.; Barlowe, C. A Rab requirement is not bypassed in SLY1-20 suppression. Mol. Biol. Cell 2005, 16, 1839–1849. [Google Scholar] [CrossRef] [PubMed]
  7. Frigieri, M.C.; Joao Luiz, M.V.; Apponi, L.H.; Zanelli, C.F.; Valentini, S.R. Synthetic lethality between eIF5A and Ypt1 reveals a connection between translation and the secretory pathway in yeast. Mol. Genet. Genom. 2008, 280, 211–221. [Google Scholar] [CrossRef] [PubMed]
  8. Lynch-Day, M.A.; Bhandari, D.; Menon, S.; Huang, J.; Cai, H.; Bartholomew, C.R.; Brumell, J.H.; Ferro-Novick, S.; Klionsky, D.J. Trs85 directs a Ypt1 GEF, TRAPPIII, to the phagophore to promote autophagy. Proc. Natl. Acad. Sci. USA 2010, 107, 7811–7816. [Google Scholar] [CrossRef] [Green Version]
  9. Kang, C.H.; Lee, S.Y.; Park, J.H.; Lee, Y.; Jung, H.S.; Chi, Y.H.; Jung, Y.J.; Chae, H.B.; Shin, M.R.; Kim, W.Y.; et al. Stress-driven structural and functional switching of Ypt1p from a GTPase to a molecular chaperone mediates thermo tolerance in Saccharomyces cerevisiae. FASEB J. 2015, 29, 4424–4434. [Google Scholar] [CrossRef] [Green Version]
  10. Jang, H.H.; Lee, K.O.; Chi, Y.H.; Jung, B.G.; Park, S.K.; Park, J.H.; Lee, J.R.; Lee, S.S.; Moon, J.C.; Yun, J.W.; et al. Two enzymes in one; two yeast peroxiredoxins display oxidative stress-dependent switching from a peroxidase to a molecular chaperone function. Cell 2004, 117, 625–635. [Google Scholar] [CrossRef]
  11. Strober, W. Trypan blue exclusion test of cell viability. Curr. Protoc. Immunol. 2001, Appendix 3, Appendix 3B. [Google Scholar] [CrossRef]
  12. Tomoyasu, T.; Mogk, A.; Langen, H.; Goloubinoff, P.; Bukau, B. Genetic dissection of the roles of chaperones and proteases in protein folding and degradation in the Escherichia coli cytosol. Mol. Microbiol. 2001, 40, 397–413. [Google Scholar] [CrossRef] [PubMed] [Green Version]
  13. Faust, A.M.; Wong, C.C.; Yates, J.R., 3rd; Drubin, D.G.; Barnes, G. The FEAR protein Slk19 restricts Cdc14 phosphatase to the nucleus until the end of anaphase, regulating its participation in mitotic exit in Saccharomyces cerevisiae. PLoS ONE 2013, 8, e73194. [Google Scholar] [CrossRef] [PubMed]
  14. Paul, K.R.; Molliex, A.; Cascarina, S.; Boncella, A.E.; Taylor, J.P.; Ross, E.D. Effects of Mutations on the Aggregation Propensity of the Human Prion-Like Protein hnRNPA2B1. Mol. Cell Biol. 2017, 37. [Google Scholar] [CrossRef]
  15. Sharma, K.K.; Kaur, H.; Kumar, G.S.; Kester, K. Interaction of 1,1′-bi(4-anilino)naphthalene-5,5′-disulfonic acid with alpha-crystallin. J. Biol. Chem. 1998, 273, 8965–8970. [Google Scholar] [CrossRef] [PubMed]
  16. Lee, J.R.; Lee, S.S.; Jang, H.H.; Lee, Y.M.; Park, J.H.; Park, S.C.; Moon, J.C.; Park, S.K.; Kim, S.Y.; Lee, S.Y.; et al. Heat-shock dependent oligomeric status alters the function of a plant-specific thioredoxin-like protein, AtTDX. Proc. Natl. Acad. Sci. USA 2009, 106, 5978–5983. [Google Scholar] [CrossRef] [Green Version]
  17. Basseri, S.; Lhotak, S.; Sharma, A.M.; Austin, R.C. The chemical chaperone 4-phenylbutyrate inhibits adipogenesis by modulating the unfolded protein response. J. Lipid Res. 2009, 50, 2486–2501. [Google Scholar] [CrossRef] [Green Version]
  18. Kim, D.Y.; Scalf, M.; Smith, L.M.; Vierstra, R.D. Advanced proteomic analyses yield a deep catalog of ubiquitylation targets in Arabidopsis. Plant Cell 2013, 25, 1523–1540. [Google Scholar] [CrossRef]
  19. Butterfield, D.A.; Yatin, S.M.; Varadarajan, S.; Koppal, T. Amyloid beta-peptide-associated free radical oxidative stress, neurotoxicity, and Alzheimer’s disease. Methods Enzymol. 1999, 309, 746–768. [Google Scholar]
  20. Kim, K.S.; Choi, S.Y.; Kwon, H.Y.; Won, M.H.; Kang, T.C.; Kang, J.H. Aggregation of alpha-synuclein induced by the Cu,Zn-superoxide dismutase and hydrogen peroxide system. Free Radic. Biol. Med. 2002, 32, 544–550. [Google Scholar] [CrossRef]
  21. Hendrick, J.P.; Hartl, F.U. Molecular chaperone functions of heat-shock proteins. Annu. Rev. Biochem. 1993, 62, 349–384. [Google Scholar] [CrossRef] [PubMed]
  22. Mayer, M.P. The unfolding story of a redox chaperone. Cell 2012, 148, 843–844. [Google Scholar] [CrossRef] [PubMed]
  23. Chae, H.B.; Moon, J.C.; Shin, M.R.; Chi, Y.H.; Jung, Y.J.; Lee, S.Y.; Nawkar, G.M.; Jung, H.S.; Hyun, J.K.; Kim, W.Y.; et al. Thioredoxin reductase type C (NTRC) orchestrates enhanced thermotolerance to Arabidopsis by its redox-dependent holdase chaperone function. Mol. Plant 2013, 6, 323–336. [Google Scholar] [CrossRef] [PubMed]
  24. Park, J.H.; Lee, S.Y.; Kim, W.Y.; Jung, Y.J.; Chae, H.B.; Jung, H.S.; Kang, C.H.; Shin, M.R.; Kim, S.Y.; Su’udi, M.; et al. Heat-induced chaperone activity of serine/threonine protein phosphatase 5 enhances thermotolerance in Arabidopsis thaliana. New Phytol. 2011, 191, 692–705. [Google Scholar] [CrossRef] [PubMed]
  25. Park, S.K.; Jung, Y.J.; Lee, J.R.; Lee, Y.M.; Jang, H.H.; Lee, S.S.; Park, J.H.; Kim, S.Y.; Moon, J.C.; Lee, S.Y.; et al. Heat-shock and redox-dependent functional switching of an h-type Arabidopsis thioredoxin from a disulfide reductase to a molecular chaperone. Plant Physiol. 2009, 150, 552–561. [Google Scholar] [CrossRef] [PubMed]
  26. Bell, S.L.; Chiang, A.N.; Brodsky, J.L. Expression of a malarial Hsp70 improves defects in chaperone-dependent activities in ssa1 mutant yeast. PLoS ONE 2011, 6, e20047. [Google Scholar] [CrossRef] [PubMed]
  27. Ruiz-Roig, C.; Vieitez, C.; Posas, F.; de Nadal, E. The Rpd3L HDAC complex is essential for the heat stress response in yeast. Mol. Microbiol. 2010, 76, 1049–1062. [Google Scholar] [CrossRef] [PubMed] [Green Version]
  28. Sinha, H.; David, L.; Pascon, R.C.; Clauder-Munster, S.; Krishnakumar, S.; Nguyen, M.; Shi, G.; Dean, J.; Davis, R.W.; Oefner, P.J.; et al. Sequential elimination of major-effect contributors identifies additional quantitative trait loci conditioning high-temperature growth in yeast. Genetics 2008, 180, 1661–1670. [Google Scholar] [CrossRef] [PubMed]
  29. Feldman, D.E.; Frydman, J. Protein folding in vivo: The importance of molecular chaperones. Curr. Opin. Struct. Biol. 2000, 10, 26–33. [Google Scholar] [CrossRef]
  30. Slavotinek, A.M.; Biesecker, L.G. Unfolding the role of chaperones and chaperonins in human disease. Trends Genet. 2001, 17, 528–535. [Google Scholar] [CrossRef]
  31. Aoki, Y.; Niihori, T.; Inoue, S.; Matsubara, Y. Recent advances in RASopathies. J. Hum. Genet. 2016, 61, 33–39. [Google Scholar] [CrossRef]
  32. Hor, C.H.H.; Tang, B.L.; Goh, E.L.K. Rab23 and developmental disorders. Rev. Neurosci. 2018. [Google Scholar] [CrossRef] [PubMed]
  33. Zhang, X.; Huang, T.Y.; Yancey, J.; Luo, H.; Zhang, Y.W. Role of Rab GTPases in Alzheimer’s Disease. ACS Chem. Neurosci. 2018. [Google Scholar] [CrossRef] [PubMed]
  34. Bobori, C.; Theocharopoulou, G.; Vlamos, P. Molecular Chaperones in Neurodegenerative Diseases: A Short Review. Adv. Exp. Med. Biol. 2017, 987, 219–231. [Google Scholar] [CrossRef] [PubMed]
  35. Ebrahimi-Fakhari, D.; Saidi, L.J.; Wahlster, L. Molecular chaperones and protein folding as therapeutic targets in Parkinson’s disease and other synucleinopathies. Acta Neuropathol. Commun. 2013, 1, 79. [Google Scholar] [CrossRef] [PubMed] [Green Version]
  36. Kang, C.H.; Jung, W.Y.; Kang, Y.H.; Kim, J.Y.; Kim, D.G.; Jeong, J.C.; Baek, D.W.; Jin, J.B.; Lee, J.Y.; Kim, M.O.; et al. AtBAG6, a novel calmodulin-binding protein, induces programmed cell death in yeast and plants. Cell Death Differ. 2006, 13, 84–95. [Google Scholar] [CrossRef] [PubMed]
  37. Cheong, N.E.; Choi, Y.O.; Lee, K.O.; Kim, W.Y.; Jung, B.G.; Chi, Y.H.; Jeong, J.S.; Kim, K.; Cho, M.J.; Lee, S.Y. Molecular cloning, expression, and functional characterization of a 2Cys-peroxiredoxin in Chinese cabbage. Plant Mol. Biol. 1999, 40, 825–834. [Google Scholar] [CrossRef] [PubMed]
  38. Chae, H.Z.; Chung, S.J.; Rhee, S.G. Thioredoxin-dependent peroxide reductase from yeast. J. Biol. Chem. 1994, 269, 27670–27678. [Google Scholar]
  39. Bollag, G.; McCormick, F. Intrinsic and GTPase-activating protein-stimulated Ras GTPase assays. Methods Enzymol. 1995, 255, 161–170. [Google Scholar] [PubMed]
  40. Seo, H.S.; Jeong, J.Y.; Nahm, M.Y.; Kim, S.W.; Lee, S.Y.; Bahk, J.D. The effect of pH and various cations on the GTP hydrolysis of rice heterotrimeric G-protein alpha subunit expressed in Escherichia coli. J. Biochem. Mol. Biol. 2003, 36, 196–200. [Google Scholar] [PubMed]
  41. Rohrbough, J.G.; Breci, L.; Merchant, N.; Miller, S.; Haynes, P.A. Verification of single-peptide protein identifications by the application of complementary database search algorithms. J. Biomol. Tech. 2006, 17, 327–332. [Google Scholar] [PubMed]
  42. Oliveros, J.C. VENNY. An. Interactive Tool for Comparing Lists with Venn Diagrams; CNB_CSIC: Madrid, Spain, 2007. [Google Scholar]
Figure 1. Mutant ypt1-G80D Yeast Cells are Sensitive to Heat-Stress. (A) Effect of heat treatment on cell viability. YPT1 and ypt1-G80D cells (5 × 10⁷ cells/mL) grown in YPD medium were incubated at 27 °C or 45 °C, and samples were withdrawn at the indicated times for measurement of viable counts. Cell survival (percent) at each time point was calculated as 100× the ratio of the viable count at that time to the viable count at time zero. Error bars: means ± SD of at least 3 independent experiments. (B) Trypan blue (TB) exclusion assay of heat-shock-induced cell death. Samples of the YPT1 and ypt1-G80D cells at the 60 min time point in (A) were visualized by fluorescence microscopy after staining with TB. The percentages of TB-negative cells are shown below the images. Data are represented as the mean ± SD of at least three independent experiments. White and black arrowheads show examples of TB-negative and -positive cells, respectively. Scale bar, 50 μm.
Ijms 20 00132 g001
Figure 2. Heat-Shock-Induced Cytosolic Protein Aggregation in Yeast Cells. (A) Heat-shock-induced cytosolic protein aggregation in YPT1 and ypt1-G80D cells. The cells (5 × 10⁷ cells/mL) were grown in YPD medium and incubated at 27 °C or 45 °C. Samples were withdrawn at the 60 min time point, and the amounts of insoluble cytosolic protein were determined. The insoluble fractions were subjected to SDS-PAGE followed by silver-staining. Each lane represents the insoluble fraction of 3 × 10⁶ cells. (B) Proportions of insoluble fractions in the total cytosolic proteins extracted in (A). Red line indicates the comparison between YPT1 and ypt1-G80D samples at 45 °C, blue line shows the comparison of two ypt1-G80D samples at 27 °C and 45 °C, whereas black lines represents the comparison of two YPT1 samples at 27 °C and 45 °C or the comparison between YPT1 and ypt1-G80D samples at 27 °C. Error bars: means ± SD of at least 3 independent experiments. * p < 0.05, *** p < 0.001, and NS, no significance, according to a 2-tailed Student’s t test.
Ijms 20 00132 g002
Figure 3. Heat-Shock Induces Changes in the Molecular State of Ypt1p but not Ypt1pG80D. (A) Changes in the molecular state of Ypt1p and Ypt1pG80D in vivo. YPT1 and ypt1-G80D cells were grown in YPD medium (1 × 10⁸ cells/mL) and incubated at 27 °C or 45 °C for 45 min. Half of the heat-treated cells were transferred to an equal volume of fresh YPD medium containing 100 μg/mL cycloheximide and allowed to recover for 10 h at 27 °C (45/27). Total protein extracts (10 μg) were analyzed by SDS-PAGE, and proteins were visualized by CBB staining (left image). In addition, total protein extracts (50 μg) were analyzed by immunoblotting with a polyclonal anti-Ypt1p antibody after fractionation by SDS-PAGE (middle image) or native-PAGE (right image). W.B., western blotting. (B,C) Changes in the molecular state of Ypt1p and Ypt1pG80D in vitro. (B) Purified bacterially expressed Ypt1p and Ypt1pG80D (3 μg/μL) were incubated at 25 °C or 45 °C for 30 min, subjected to native-PAGE (upper image) or SDS-PAGE (lower image), and then silver-stained. (C) SEC analysis of the protein solutions described in (B). (D) A bis-ANS binding assay to identify heat-shock-induced exposure of hydrophobic domains in Ypt1p and Ypt1pG80D. Fluorescence spectra of bis-ANS were measured with excitation at 380 nm and emission scanning at 400–600 nm. The samples used were 10 μM bis-ANS (a), 10 μM bis-ANS plus 30 μM Ypt1p incubated at 25 °C (b) or 45 °C (b′), and 10 μM bis-ANS plus 30 μM Ypt1pG80D incubated at 25 °C (c) or 45 °C (c′) for 20 min.
Ijms 20 00132 g003
Figure 4. Ypt1pG80D has GTPase Activity but not Molecular Chaperone Activity. (A,B) Chaperone activity assay. Light scattering was monitored at 340 nm over a 15 min incubation period. Shown are representative data out of at least three independent experiments. (A) Solutions of MDH (1.67 μM) alone (-o-) or with 8.35 μM GST (-●-), Ypt1p (-▲-), or Ypt1pG80D (-■-) in 50 mM HEPES (pH 8.0) were incubated in a spectrophotometer cell at 45 °C. (B) Solutions of MDH (1.67 μM) alone (-o-) or with 3.34 μM Ypt1p pretreated at 25 °C (-▲-) or 45 °C (-▲-) or 3.34 μM Ypt1pG80D pretreated at 25 °C (-■-) or 45 °C (-■-) in 50 mM HEPES (pH 8.0) were incubated in a spectrophotometer cell at 45 °C. (C) GTPase activity assay. Recombinant Ypt1p and Ypt1pG80D (2 μg each) were incubated with [α-32P]GTP at 30 °C, and samples of the reaction mixtures were withdrawn at different time points for analysis by TLC. Shown is a representative image out of at least three independent experiments. (D) Relative GTPase (240 min) and chaperone (15 min) activities of Ypt1p and Ypt1pG80D. The activities of Ypt1p were set to 100%. Data are represented as the mean ± SD of at least three independent experiments. **** P < 0.0001, and NS, no significance, according to a Student’s t test.
Ijms 20 00132 g004
Figure 5. PBA Increases the Thermo Tolerance of ypt1-G80D Cells. (A) Yeast spot assay. Yeast cells (5 × 7 cells/mL) were grown in YPD medium and incubated at 27 °C or 45 °C for 1 h in the presence (+PBA) or absence (-PBA) of 1 mM PBA. Samples of the YPT1 and ypt1-G80D cells were withdrawn for analysis. Aliquots (6 μL) of 10-fold serial dilutions of these cell suspensions were spotted onto YPD plates, and the plates were photographed after incubation at 27 °C for 3 days. (B) Effect of PBA on heat-shock resistance of the YPT1 and ypt1-G80D cells. Yeast cells (5 × 7 cells/mL) were grown in YPD medium and incubated at 45 °C in the presence (+PBA) or absence (-PBA) of 1 mM PBA. Samples were withdrawn at the indicated times for measurement of viable counts. Cell survival (percent) at each time point was calculated as 100× the ratio of the viable count at that time to the viable count at time zero. Error bars: means ± SD of at least 3 independent experiments. (C) Trypan blue exclusion assay of heat-shock-induced cell death. Samples of the YPT1 and ypt1-G80D cells at the 60 min time point in (B) were visualized by fluorescence microscopy after staining with trypan blue. The percentages of TB-negative cells are shown below the images. Data are represented as the mean ± SD of at least three independent experiments.
Ijms 20 00132 g005
Figure 6. Analyses of LC/MS Data. (A) Venn diagrams showing the numbers of proteins identified by the LC/MS analysis in extracts of YPT1 and ypt1-G80D cells incubated at 27 °C (upper left), extracts of YPT1 cells incubated at 27 °C or 45 °C (upper right), extracts of ypt1-G80D cells incubated at 27 °C or 45 °C (lower left), and extracts of YPT1 and ypt1-G80D cells incubated at 45 °C (lower right). (B) Venn diagram showing the relationships between the proteins identified by the LC/MS analysis in extracts of YPT1 and ypt1-G80D cells incubated at 27 °C or 45 °C. The group of 49 proteins that was induced at 45 °C in YPT1 cells but not ypt1-G80D cells is indicated by the red outline. (C) Pie chart showing distribution of these 49 proteins among different cellular processes.
Ijms 20 00132 g006
Table 1. Categorized Lists of Putative Ypt1p-Regulatory Proteins under Heat-Shock. See Table S1 for further details. “# proteins” means number of proteins in the groups.
Groups (# proteins)Putative Ypt1p-Regulatory Proteins under Heat-Shock
Metabolism (23)Inorganic pyrophosphatase, Glucose-6-phosphate isomerase, Ach1p, YKR097Wp-like protein, Thr4p, 6-phosphogluconate dehydrogenase, Alpha-ketoglutarate dehydrogenase, Carboxypeptidase Y inhibitor, Ses1p, YGL202Wp-like protein, Transaldolase, IDH2 (Isocitric dehydrogenase 2), Putative uncharacterized protein (A6ZLW7), Pbi2p, IDP2 (Isocitrate dehydrogenase), Branched chain a.a. aminotransferase, YGR124Wp-like protein, Bts1p, Enolase, Ypr1p, Erg10p, Cys4p, K7_Ade17bp
Protein synthesis, assembly, and transport (8)Eft2p, Om45p, Ses1p, Tropomyosin-1, YFL037Wp-like protein, KAP123 (Karyopherin beta 4), YBL050Wp-like protein, Rpl7bp
Cellular energy generation (7)ATP synthase subunit beta, Porin, Rhr2p, ADK1 (Adenylate kinase), Sdh1p, Atp16p, YBR039Wp-like protein, Cytochrome b-c1 complex subunit 7
Stress response (5)Ssa1p, Ssa3p, Prx1p, SIP18, YML128Cp-like protein
DNA regulation (3)REV3 (DNA polymerase), YPL016Wp-like protein, Mbp1p
Miscellaneous (3)Putative uncharacterized protein (A6ZYB0), SOF1 (Conserved protein), Tma19p

