Article

A Novel Approach Based on a Weighted Interactive Network to Predict Associations of MiRNAs and Diseases

1
College of Computer Engineering & Applied Mathematics, Changsha University, Changsha 410001, China
2
Key Laboratory of Hunan Province for Internet of Things and Information Security, Xiangtan University, Xiangtan 411105, China
3
Institute of Fundamental and Frontier Sciences, University of Electronic Science and Technology of China, Chengdu 610000, China
4
School of Computer Science and Technology, Tianjin University, Tianjin 300000, China
*
Author to whom correspondence should be addressed.
Int. J. Mol. Sci. 2019, 20(1), 110; https://doi.org/10.3390/ijms20010110
Submission received: 27 November 2018 / Revised: 23 December 2018 / Accepted: 24 December 2018 / Published: 28 December 2018
(This article belongs to the Special Issue Computational Models in Non-Coding RNA and Human Disease)

Abstract

:
Accumulating evidence progressively indicated that microRNAs (miRNAs) play a significant role in the pathogenesis of diseases through many experimental studies; therefore, developing powerful computational models to identify potential human miRNA–disease associations is vital for an understanding of the disease etiology and pathogenesis. In this paper, a weighted interactive network was firstly constructed by combining known miRNA–disease associations, as well as the integrated similarity between diseases and the integrated similarity between miRNAs. Then, a new computational method implementing the newly weighted interactive network was developed for discovering potential miRNA–disease associations (WINMDA) by integrating the T most similar neighbors and the shortest path algorithm. Simulation results show that WINMDA can achieve reliable area under the receiver operating characteristics (ROC) curve (AUC) results of 0.9183 ± 0.0007 in 5-fold cross-validation, 0.9200 ± 0.0004 in 10-fold cross-validation, 0.9243 in global leave-one-out cross-validation (LOOCV), and 0.8856 in local LOOCV. Furthermore, case studies of colon neoplasms, gastric neoplasms, and prostate neoplasms based on the Human microRNA Disease Database (HMDD) database were implemented, for which 94% (colon neoplasms), 96% (gastric neoplasms), and 96% (prostate neoplasms) of the top 50 predicting miRNAs were confirmed by recent experimental reports, which also demonstrates that WINMDA can effectively uncover potential miRNA–disease associations.

1. Introduction

Recently, increasing studies indicated that non-coding RNAs (ncRNAs) play an extensive and important role in many biological processes such as cell differentiation, ontogenesis, and disease development [1,2,3]. In particular, microRNAs (miRNAs), a class of small ncRNAs with a length of 20–25 nucleotides, was proven to be closely related to the occurrence of many diseases that are seriously harmful to human health [4,5]; they are able to regulate many functions of eukaryotic cells and affect various behaviors such as gene expression, cell-cycle regulation, and individual development [6]. For example, miR-126 was demonstrated to be associated with clear cell human renal cell carcinoma [7], while miR-34a-5p was proven to have a critical impact on ovarian cancer (OC) cell lines via interacting with nuclear paraspeckle assembly transcript 1 (NEAT1) [8]. MicroRNA expression microarray analysis showed that miR-145 and miR-1 expression is significantly downregulated in colon cancer tissues [9], and that miR-424 and miR-381 play important roles in tumor regulation, expression, and even treatment [10]. Therefore, it is necessary to study the association between miRNAs and diseases in depth and explore the potential relationship between miRNA and some human diseases [11,12].
The identification of potential miRNA–disease associations can not only play an important role in the diagnosis, treatment, and prevention of disease, but also effectively addresses the high cost and long-term shortcomings of traditional biological experiments [13,14]. Up to now, various miRNA-related heterogeneous biological databases were established and were extended to various fields of miRNA-related research, such as miRBase [15], Database of Differentially Expressed miRNAs in Human Cancers (dbDEMC) [16], Human microRNA Disease Database (HMDD) [17], miR2Disease [18], etc. Based on these datasets, different computational prediction methods were developed to predict potential miRNA–disease associations [19,20,21,22,23,24]. For example, in 2012, Chen et al. developed a prediction method named random walk with restart for miRNA–disease association (RWRMDA) for inferring potential miRNA–disease associations through combining the semantic similarity of the disease and the functional similarity of miRNA [25]. In 2014, Chen et al. further developed a computational model named regularized least squares for miRNA–disease association (RLSMDA) based on semi-supervised machine learning, which can uncover related miRNAs for each disease without any known related miRNAs [26]. In 2016, under the basic assumption that functional similar miRNAs tend to interact with similar diseases, Chen et al. proposed a prediction model named within and between Score for miRNA–disease association (WBSMDA) by combining the within score and between score from the opinion of diseases and miRNAs to calculate the score and predict potential miRNA–disease associations [27]. Furthermore, Zou et al. also developed a machine learning based method named CATAPULT to uncover relationships between microRNAs and diseases based on social network analysis methods [28]. Zhu et al. developed a novel path-based method named PBMDA to predict the relationships between miRNA and disease by integrating different types of heterogeneous biological datasets and constructing three interlinked sub-graphs [29]. In 2017, Chen et al. proposed LRSSLMDA where novel miRNA–disease associations were predicted using sparse subspace learning to map high-dimensional miRNA/disease spaces into a lower-dimensional subspace [30]. In LRSSLMDA, feature extraction was performed on the integrated similarity to form the statistical profile and the graph theoretical profile. In 2018, Chen et al. developed a novel computational model named MDHGI to predict potential miRNA–disease associations using a sparse learning method to decompose the original adjacency matrix and combing the miRNA functional similarities network, the disease semantic similarities network, the Gaussian interaction profile kernel similarities network, and the new adjacency matrix into a heterogeneous graph [31]. Zhao and Wang presented a distance correlation set-based prediction method named DCSMDA for predicting latent miRNA–disease associations by constructing the disease/long non-coding RNA (lncRNA)/miRNA interactive network [32]. Moreover, Chen et al. developed an extreme gradient-boosting machine with a decision tree named EGBMMDA, seeking potential miRNA–disease associations using vector-covered statistical measures, graph theoretical measures, and matrix factorization results for miRNAs and diseases [33]. Chen et al. proposed a rating-integrated bipartite network recommendation-based prediction method named BNPMDA for predicting potential miRNA–disease association using agglomerative hierarchical clustering [34].
In most of the abovementioned computational models, researchers constructed an adjacency matrix A to represent relationships between miRNA and disease. Specifically, if the association term between miRNA mi and disease dj is recorded in the database, the matrix A(i,j) = 1; otherwise it is equal to zero. However, since the number of known miRNA–disease associations existing in these well-known databases is very limited, this results in a sparse matrix; thus, in order to improve the accuracy of our prediction model, the information about the diseases and miRNAs was adopted to construct a weighted interactive network in this paper. Moreover, on the basis of premises that functionally similar miRNAs may regulate similar diseases and similar diseases tend to associate with functionally similar miRNAs, a novel prediction model based on the newly constructed weighted interactive network was developed for miRNA–disease association inference (WINMDA). Comparing several state-of-the-art computational models, the strong point of WINMDA lies in the construction of a weighted interactive network and the introduction of the shortest path between nodes in the weighted interactive network. This also means that WINMDA proposes an idea for improving the sparseness of the adjacency matrix A and does not need negative samples to predict potential miRNA–disease associations simultaneously. All prediction results of potential miRNA–disease associations are shown in the Supplementary files 1–3; researchers could use these data to guide biological experiments in the future. In addition, the performance of WINMDA was evaluated by cross-validation and case studies of colon neoplasms, gastric neoplasms, and prostate neoplasms. Our simulation results show that WINMDA can achieve reliable area under the receiver operating characteristics (ROC) curve (AUC) results of 0.9183 ± 0.0007, 0.9200 ± 0.0004, 0.9243, and 0.8856 in terms of 5-fold cross-validation, 10-fold cross-validation, global leave-one-out cross-validation (LOOCV), and local LOOCV, respectively. Additionally, 94% (colon neoplasms), 96% (gastric neoplasms), and 96% (prostate neoplasms) of the top 50 predicting miRNAs were confirmed by dbDEMC [16], miR2Disease [18], and recently published experimental studies. These results also demonstrate that WINMDA can effectively predict potential miRNA–disease associations.

2. Results and Case Studies

In this section, we evaluated the predictive performance of WINMDA through the following experiments: we firstly compared WINMDA with four state-of-the-art methods, namely BNPMDA [34], PBMDA [29], WBSMDA [27], and RLSMDA [26] in the framework of LOOCV. Then, the process of five-fold cross-validation was repeated 50 times for our method to evaluate the prediction performance of WINMDA. Thirdly, the influence of given parameters T and w on the prediction model was analyzed. Moreover, several case studies were performed to validate the feasibility of our method. Finally, experimental results regarding the top 50 predicted associations between miRNAs and four important neoplasms were listed, and we implemented the performance comparisons between WINMDA and four state-of-the-art methods through observing the rankings of six important disease-related miRNAs in the case studies.

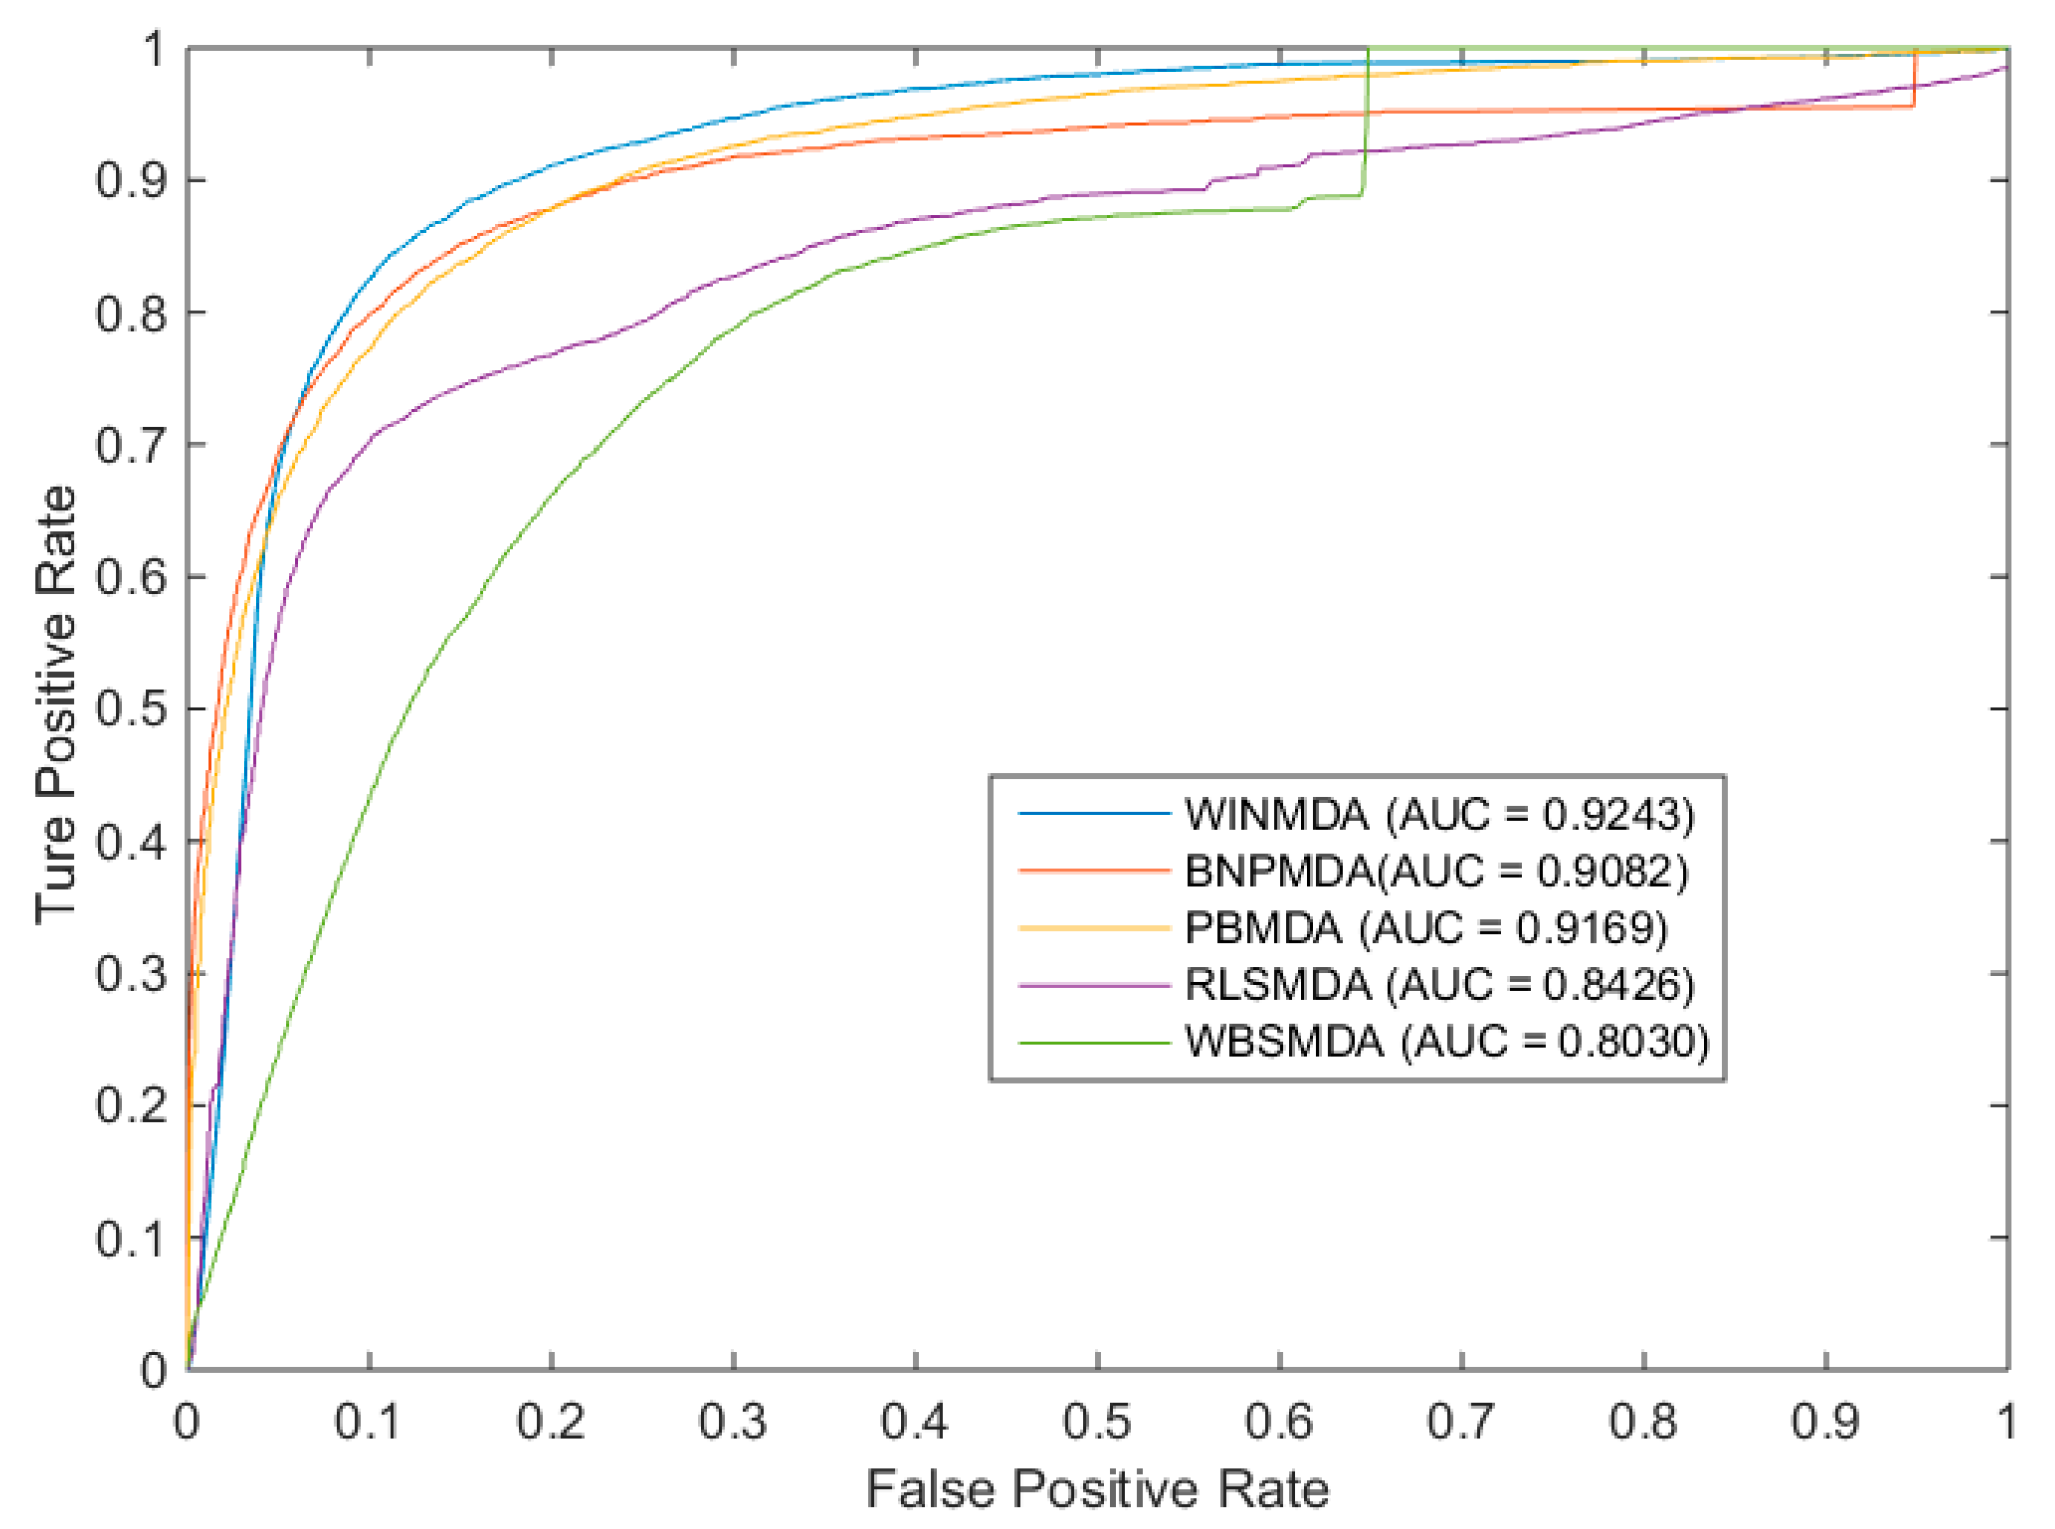
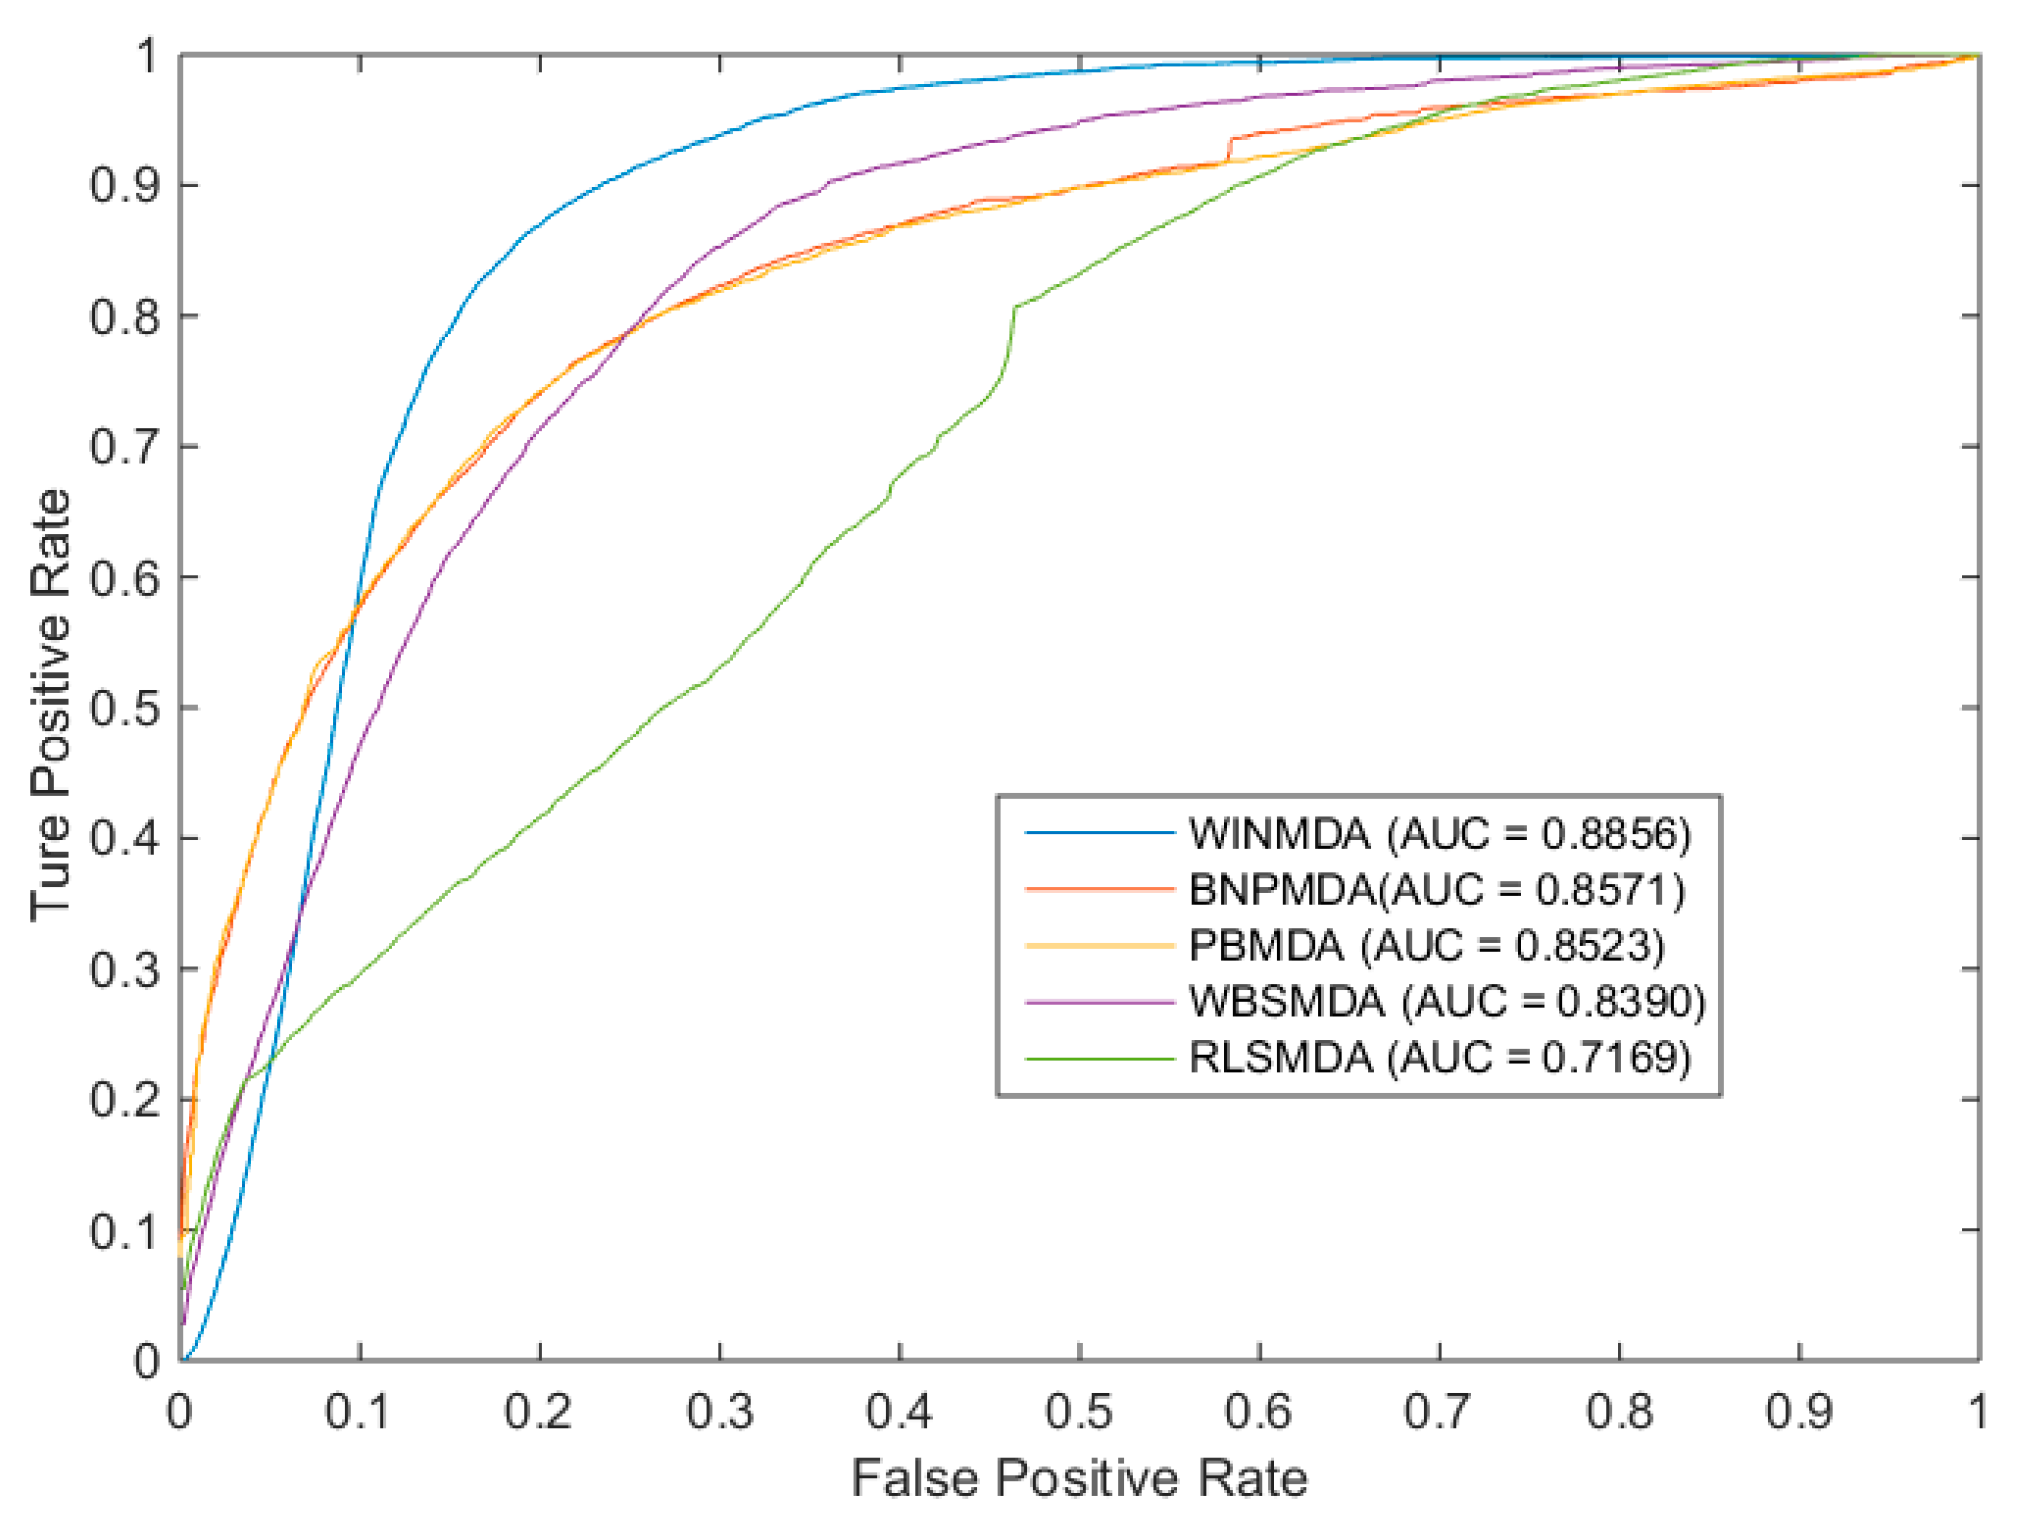
2.1. Comparison with Existing State-of-the-Art Methods

We evaluated the performance of WINMDA by observing it along with four state-of-the-art methods to predict the accuracy of potential miRNA–disease associations using global and local LOOCV. In the global LOOCV, each known disease–miRNA association was alternately used as a test sample, and other known miRNA–disease associations were considered as a training set, while all unknown disease–miRNA associations in HMDD were considered as a candidate set. However, in local LOOCV, for each given disease d, each known miRNA related to d was utilized as a test sample, while all other known miRNAs related to d were used as training samples, and all other unknown miRNAs related to d were considered as candidates. Hence, through comparing the scores obtained from the test sample with other candidate associations, we could evaluate how well this association was ranked in the candidate set; if the predicted ranking of the test sample was higher than the preset threshold, then the sample was successfully predicted by the computational model. In other words, let TP be true positive, TN be true negative, FN be false negative, and FP be false positive; then, under different threshold settings, the corresponding true positive rate (TPR; sensitivity) and false positive rate (FPR; specificity) can be obtained as follows:
FPR = FP/(FP + TN)
TPR = TP/(TP + FN)
Here, sensitivity means that the percentage of the test samples with predicted ranks was higher than the given threshold, whereas specificity was computed as the percentage of negative samples with predicted ranks lower than the given threshold. Obviously, after obtaining different TPR and FPR pairs under different thresholds, the final ROC curve (in which, FPR is the horizontal axis of the coordinate system and TPR is the longitudinal axis of the coordinate system) could be plotted by connecting these pairs. Finally, the AUC could be obtained to represent the specific prediction performance of the computational models. Furthermore, it is obvious that the larger the AUC value is, the more likely the current classification algorithm is to place a positive sample in front of the negative sample, such that it can be better classified. Next, for the global LOOCV and local LOOCV, we compared WINMDA with four state-of-the-art computational methods, namely BNPMDA, PBMDA, WBSMDA, and RLSMDA; the simulation results are shown in Figure 1 and Figure 2, respectively. From the two figures, it is easy to see that WINMDA can achieve reliable AUCs of 0.9243 and 0.8856 for global LOOCV and local LOOCV, respectively, when T = 16 and w = 0.6, which are much higher than the AUCs of 0.9169 and 0.8523 achieved by PBMDA, 0.9082 and 0.8571 achieved by BNPMDA, 0.8030 and 0.8390 achieved by WBSMDA, and 0.8426 and 0.7169 achieved by RLSMDA. It is obvious that our newly proposed method WINMDA is superior to these four traditional computational models in global and local LOOCV; therefore, it can be used as an important tool for discovering potential miRNA–disease associations.
In addition, considering the potential bias of random sample partitioning for performance assessment, we divide the known miRNA-disease associations by 50 times, and the AUCs were obtained in the similar way as global LOOCV. As a result, WINMDA achieved the prediction performance with average AUCs of 0.9183 and 0.9200 with standard deviation of 0.0007 and 0.0004 when using the 5-Fold and 10-Flod cross validation (Table 1).

2.2. Evaluation of the Effects of Parameters

There are two kinds of important parameters existing in our newly proposed model of WINMDA, as illustrated in Equation (22), one is w and the other is T.

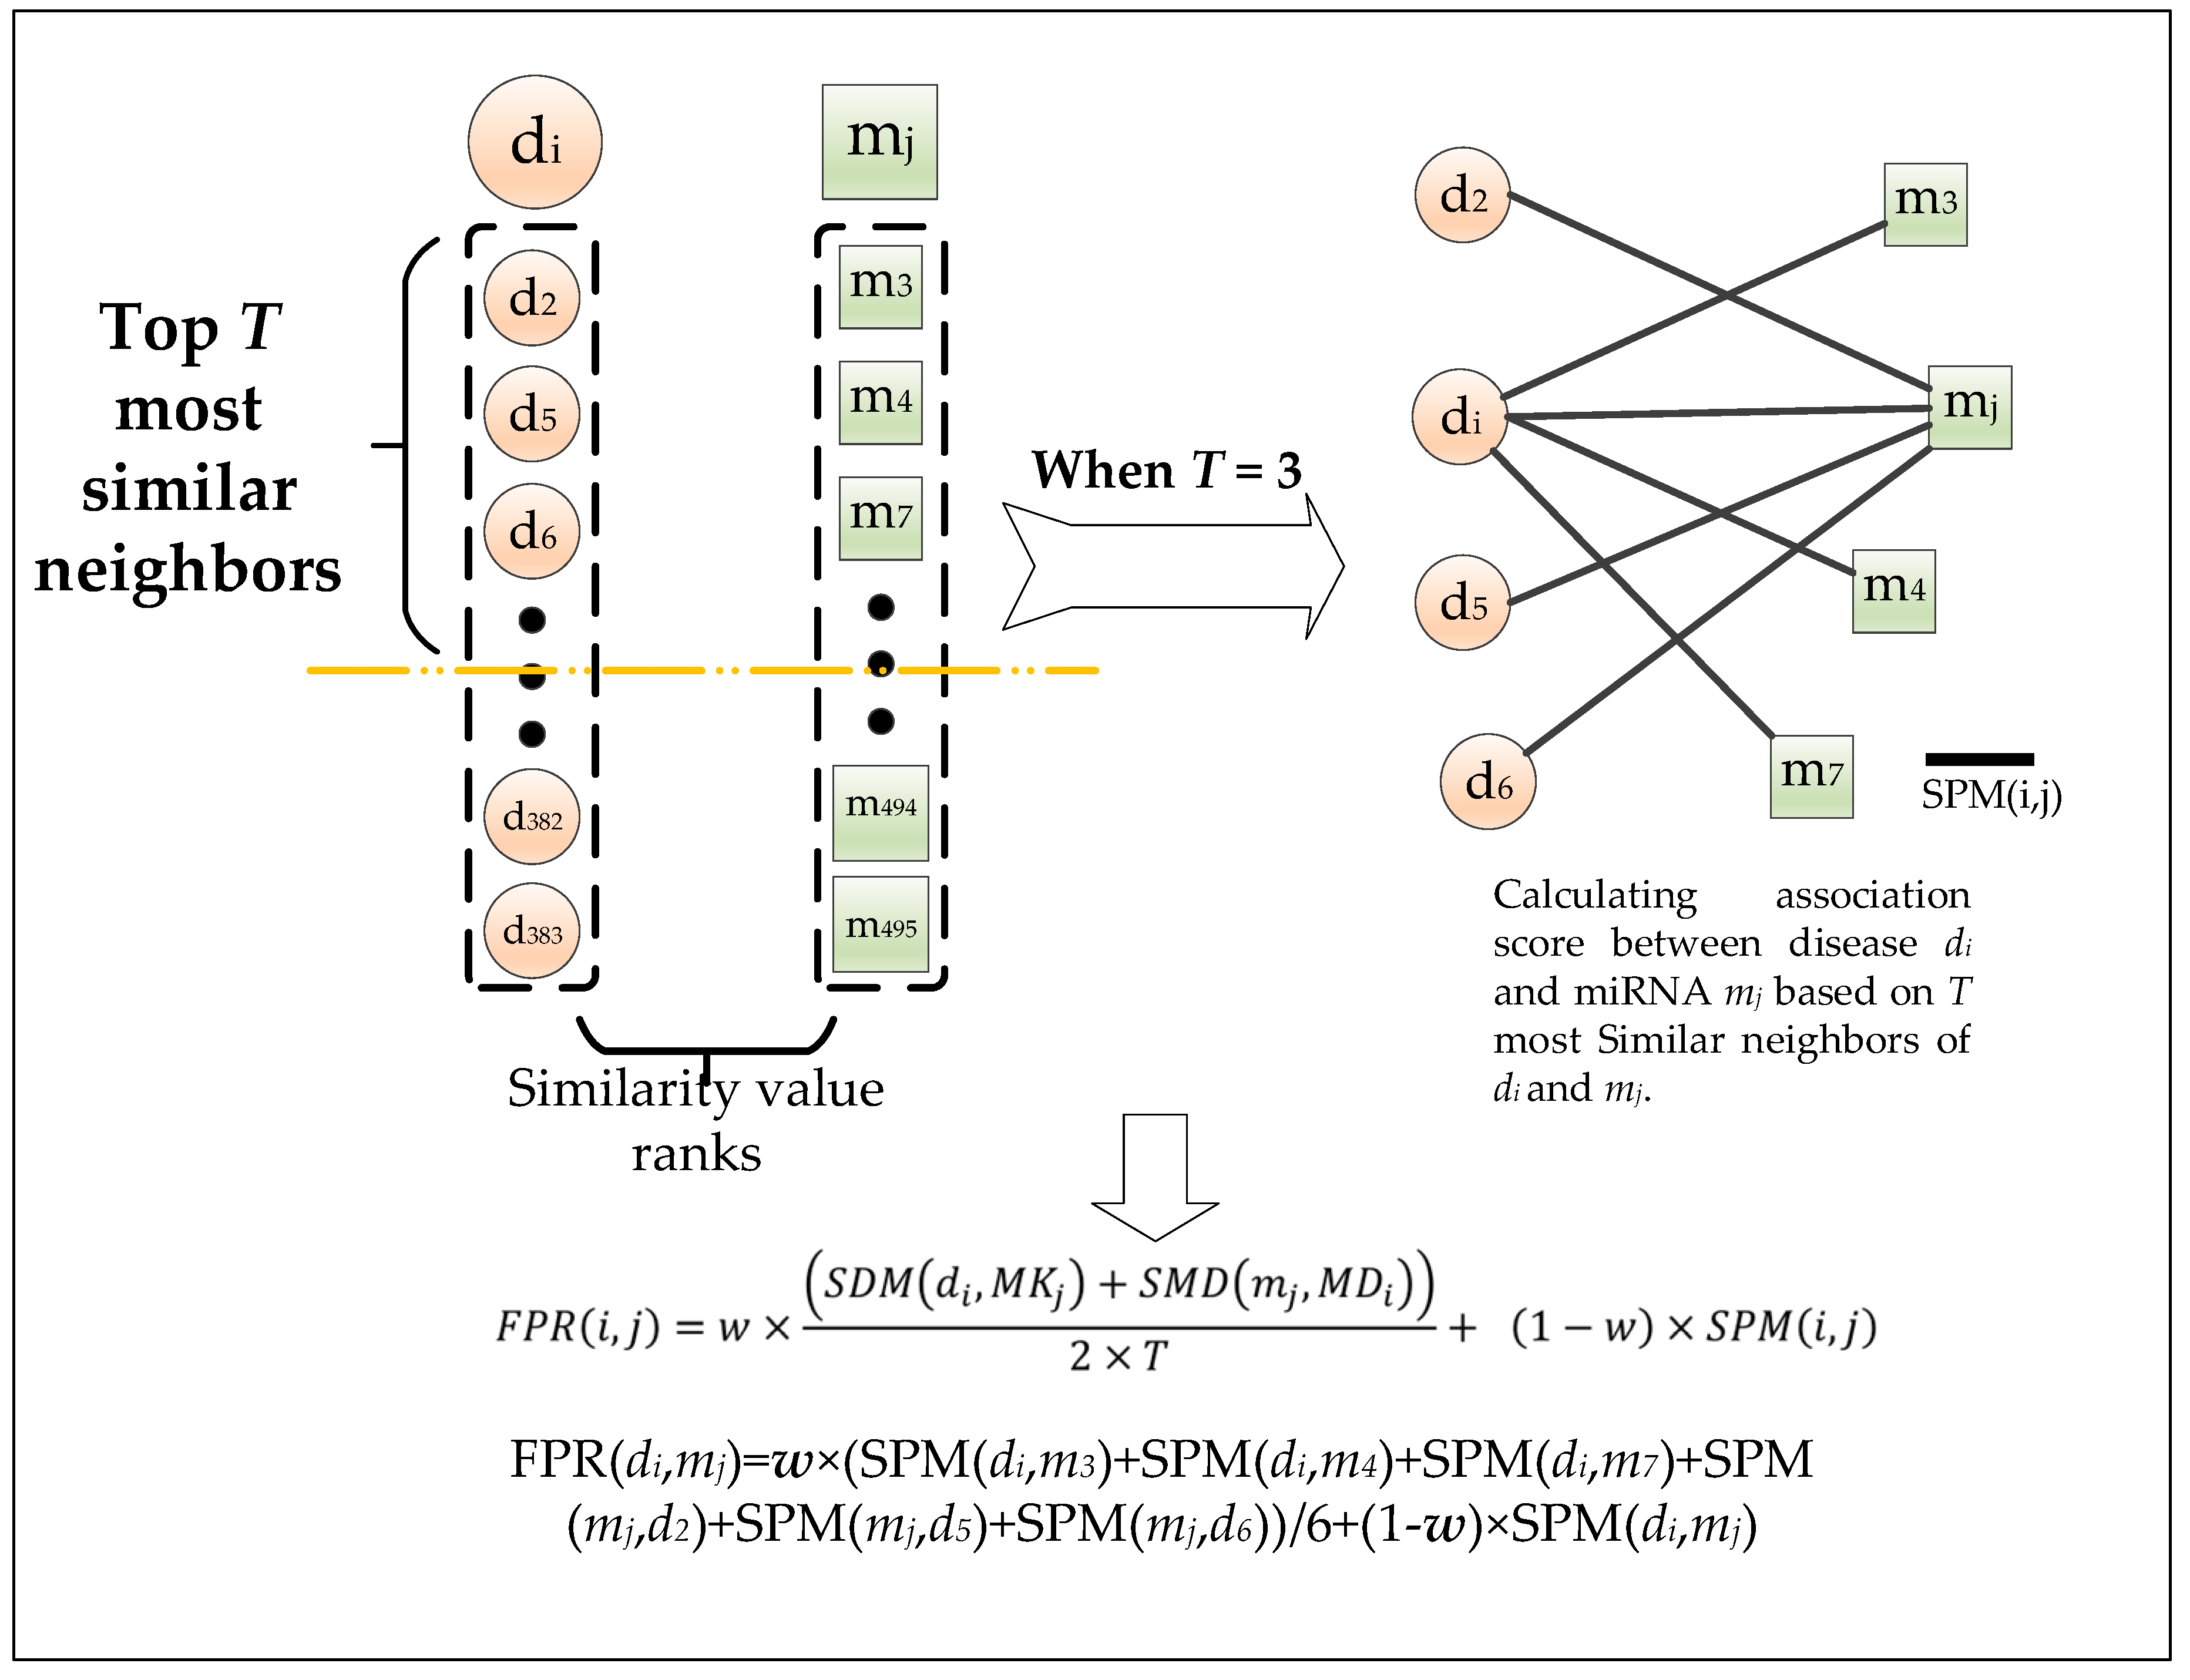
2.2.1. Effects of Parameter T

From Equations (20), (21), and (22), it is easy to know that parameter T will have important effects on the accuracy of our prediction model WINMDA. For instance, if the value of T is too large, then lots of noise data will be included, which will reduce the predictive performance of WINMDA. Alternatively, if the value of T is too small, then the useful associations may not be sufficient for accurate estimation of potential associations between some specific diseases and miRNAs. Hence, in order to evaluate the effects of parameter T, we set the value of T ranging from 1–20 during the implementation of WINMDA, and the simulation results are shown in Table 2. From Table 2, it is easy to see that the AUCs achieved by WINMDA varied with the different values of T. Specifically, the prediction performance of WINMDA increased upon increasing of the value of T, while T varied from 1 to 16, which indicates that the number of useful neighbors is positively related to the prediction performance of our model. Meanwhile, it is easy to find that the AUC will decline when T > 16, which indicates that an excess of noise data will markedly interfere with our prediction model WINMDA. Therefore, it was determined as best to set T to 16 for WINMDA in this paper.

2.2.2. Effects of Parameter w

In this section, to investigate the effects of parameter w on the prediction performance of WINMDA, we set w to different values ranging from 0–1, while implementing WINMDA under LOOCV, and the results are shown in the Table 3. It is obvious that the variation of the value of w has an important influence on the performance of our prediction model WINMDA. Specifically, from Table 3, it is obvious that WINMDA can achieve the maximum AUC value when w is set to 0.6. Hence, we set w to 0.6 in this paper.

2.3. Case Studies

Recently, increasing evidence demonstrated that miRNAs play an extensive and important role in the physiological processes of the body [35]. In addition, in developed countries such as the United States and throughout Europe, cancer is the second leading cause of human death, while it ranks second or third in developing countries [36]. Therefore, in order to further evaluate the accuracy of WINMDA in predicting potential disease–miRNA associations, we chose three kinds of cancers, i.e., colon neoplasms, gastric neoplasms, and prostate neoplasms, as case studies for WINMDA, and the prediction results were verified by recently published experimental studies and two databases, namely miR2Disease and dbDEMC. During the simulation, for each kind of cancer, all known related miRNAs were considered as seed miRNAs, and the other miRNAs were considered as candidate miRNAs. In addition, all candidate miRNAs associated with colon neoplasms, gastric neoplasms, and prostate neoplasms were ranked in descending order according to our prediction results, as illustrated in Table 4, Table 5 and Table 6, respectively.
Recently, colon cancer (colon neoplasms) ranks third among the most common female cancers and second among the most common male cancers in the world [37]. Each year, more than one million people died from colon cancer [38]. The incidence rates vary widely around the world, depending on lifestyle, environment, and heredity [39]. Recent studies reported that miRNAs are closely related to the diagnosis, prognosis, and chemo-sensitivity of colon cancer, which indicates that miRNAs can be used as a marker for the early diagnosis of colon cancer and as a guideline for various stages of colon cancer [40]. Hence, case studies on colon cancer-related miRNAs were implemented to further verify the predictive ability of WINMDA and, as a result, 10 of the top 10 and 47 of the top 50 candidate miRNAs were shown to be associated with colon neoplasms by miR2Disease, dbDEMC, and other known experimental studies (Table 4). For example, some researchers confirmed that the overexpression of miR-143 (ranked first in the WINMDA forecast list) reduces cell proliferation and migration of mutant KRAS HCT116 colon cancer cells [41]. Additionally, experimental studies also found that miR-20a is a member of the miR-17 miRNA family, which is part of the regulatory machinery that defines the pro-tumorigenic differentiation of stromal fibroblasts. In stromal fibroblasts, miR-20a (ranked second in the WINMDA forecast list) can modulate chemokine C–X–C ligand 8 (CXCL8) function, thereby influencing tumor latency [42]. Moreover, some researchers found that the rs35301225 polymorphism in miR-34a (ranked third in the WINMDA forecast list) is involved in the development of human colon cancer via downregulation of tumor-promoting gene E2F1 as a tumor suppressor, and the C/A single-nucleotide polymorphism of miR-34a promotes colon cancer cell proliferation via upregulating E2F1 [43].
In recent years, it was reported that gastric cancer (gastric neoplasms) is one of the most common malignant tumors of the digestive tract in the world, and Japan, South Korea, and China are high-risk areas for gastric cancer [44]. Therefore, it is necessary to explore the mechanism of miRNA in the development of gastric cancer and provide a basis for the early diagnosis of gastric cancer. We used potential gastric cancer-associated miRNAs as a case study to further illustrate the predictive power of WINMDA in this section. As a result, 10 of the top 10 and 48 of the top 50 potential gastric cancer-related miRNAs were validated by miR2Disease, dbDEMC, and other known experimental studies (Table 5). For example, gene UHRF1 plays a significant role in the development of gastric cancer. Furthermore, Zhou et al. identified and verified miR-146b (ranked first in our prediction list) and miR-146a as direct upstream regulators of UHRF1 in gastric cancer metastasis. [45]. In addition, according to the target genes of miR-143 (ranked seventh in our prediction list), IGF1R and BCL2, which are related to cisplatin resistance, we can regulate the resistance of human gastric cancer cells to cisplatin via differential expression of IGF1R and BCL2 in gastric cancer tissues and cell lines [46].
Prostate cancer (prostate neoplasms) is the third most common type of cancer. In 2012, the incidence rate of prostate cancer in the neoplasm registration area in China was 99.2%, which ranked sixth in the incidence of male malignant tumors [47]. However, early patients with prostate tumors have only subtle symptoms that make it difficult to detect cancer at an early stage [48]. Increasing studies confirmed that some miRNAs are related to prostate neoplasms. Therefore, case studies about prostate cancer-related miRNAs were implemented to further verify the predictive ability of WINMDA in this section. As a result, nine of the top 10 and 48 of the top 50 predicted prostate cancer-related miRNAs were validated by miR2Disease, dbDEMC, and other known experimental studies (Table 6). For example, Chu et al. selected single-nucleotide polymorphisms (SNPs) in the 1000 bp upstream from the transcription start site of hsa-miR-143 (ranked first in our prediction list) precursor in the dbSNP database with the condition that MAF > 0.05 in the Chinese population and finally identified that rs4705342 T > C was associated with the risk of prostate cancer, and that the C allele had a protective effect [49]. Wang et al. explored the effects of miR-182 (ranked second in our prediction list) on the growth, migration, and apoptosis of prostate cancer cells using qRT-PCR analysis. Moreover, they found that miR-182 plays an important role in prostate cancer, which enhances HIF1α signaling by targeting PHD2 and FIH1 in prostate cancer [50]. Furthermore, Taddei et al. confirmed that hsa-miR-210 (ranked fourth in our prediction list) overexpression increased senescence-associated features in young fibroblasts and converted them into cancer-associated fibroblast-like cells. These senescent fibroblasts can induce epithelial–mesenchymal transition in prostate cancer cells, support tumor angiogenesis, and recruit endothelial precursor cells, thus contributing to cancer progression [51].
In order to further illustrate the high efficiency of our method, we compared the performances of PBMDA, WBSMDA, LRLSMDA, and our model WINMDA by counting the top 50 disease-associated miRNAs in the predicted results and observing how many disease-related miRNAs were identified by miR2Disease, dbDEMC, and recent biological experimental studies (Table 7) in the case studies of six important diseases. As a result, from Table 7, it is easy to see that WINMDA is more effective than other methods in general. In addition, as a global computational model, WINMDA can not only achieve reliable prediction performances, but also simultaneously predict all potential associations between the diseases and miRNAs in HMDD, which means that potential associations with high predicted values obtained by WINMDA can be used preferentially for biological experiment verification and public release. Hence, we may easily reach a conclusion that our newly proposed model WINMDA is of great value in predicting potential miRNA–disease associations.

3. Discussion

Increasing studies based on biological experiments indicated that miRNAs are closely related to the occurrence of many diseases that are seriously harmful to human health, and the identification of potential miRNA–disease associations can not only play an important role in the diagnosis, treatment, and prevention of disease, but also effectively addresses the high cost and long-term shortcomings of traditional biological experiments. In this article, we developed a novel prediction model called WINMDA to predict potential relationships between miRNAs and diseases based on premises that functionally similar miRNAs may regulate similar diseases and similar diseases tend to associate with functionally similar miRNAs. In WINMDA, we firstly integrated disease semantic similarity, Gaussian interaction profile kernel similarity, and miRNA function similarity, and then constructed a weighted interactive network for potential miRNA–disease prediction. The important difference between WINMDA and previous state-of-the-art prediction models is that the problem of limited known miRNA–disease associations was considered in WINMDA and the shortest paths in the weighted interactive network were adopted to solve the problem. Moreover, we evaluated the predictive performance of WINMDA through LOOCV (including global LOOCV and local LOOCV), k-fold cross-validation, and several case studies. Experimental results show that WINMDA can effectively uncover potential disease–miRNA candidates, which means that it can be used as a reliable and accurate calculation model for finding potential miRNA–disease associations.
Although WINMDA achieved effective performance in predicting candidate relationships between miRNAs and diseases, there are still some existing limitations that can be improved in the future. Firstly, the parameters T and w play important roles in WINMDA, and the selection of suitable values for T and w are critical problems that shall be addressed in future studies. Secondly, the assigned weight may not be accurate enough, as it was on the basis of premises that functionally similar miRNAs may regulate similar diseases and similar diseases tend to associate with functionally similar miRNAs. Finally, a weighted interactive network was constructed in WINMDA based on the disease similarity, miRNA similarity, and known miRNA–disease associations. The performance of WINMDA will be further improved considering more databases storing other information about diseases, miRNAs, and miRNA–disease associations.

4. Materials and Methods

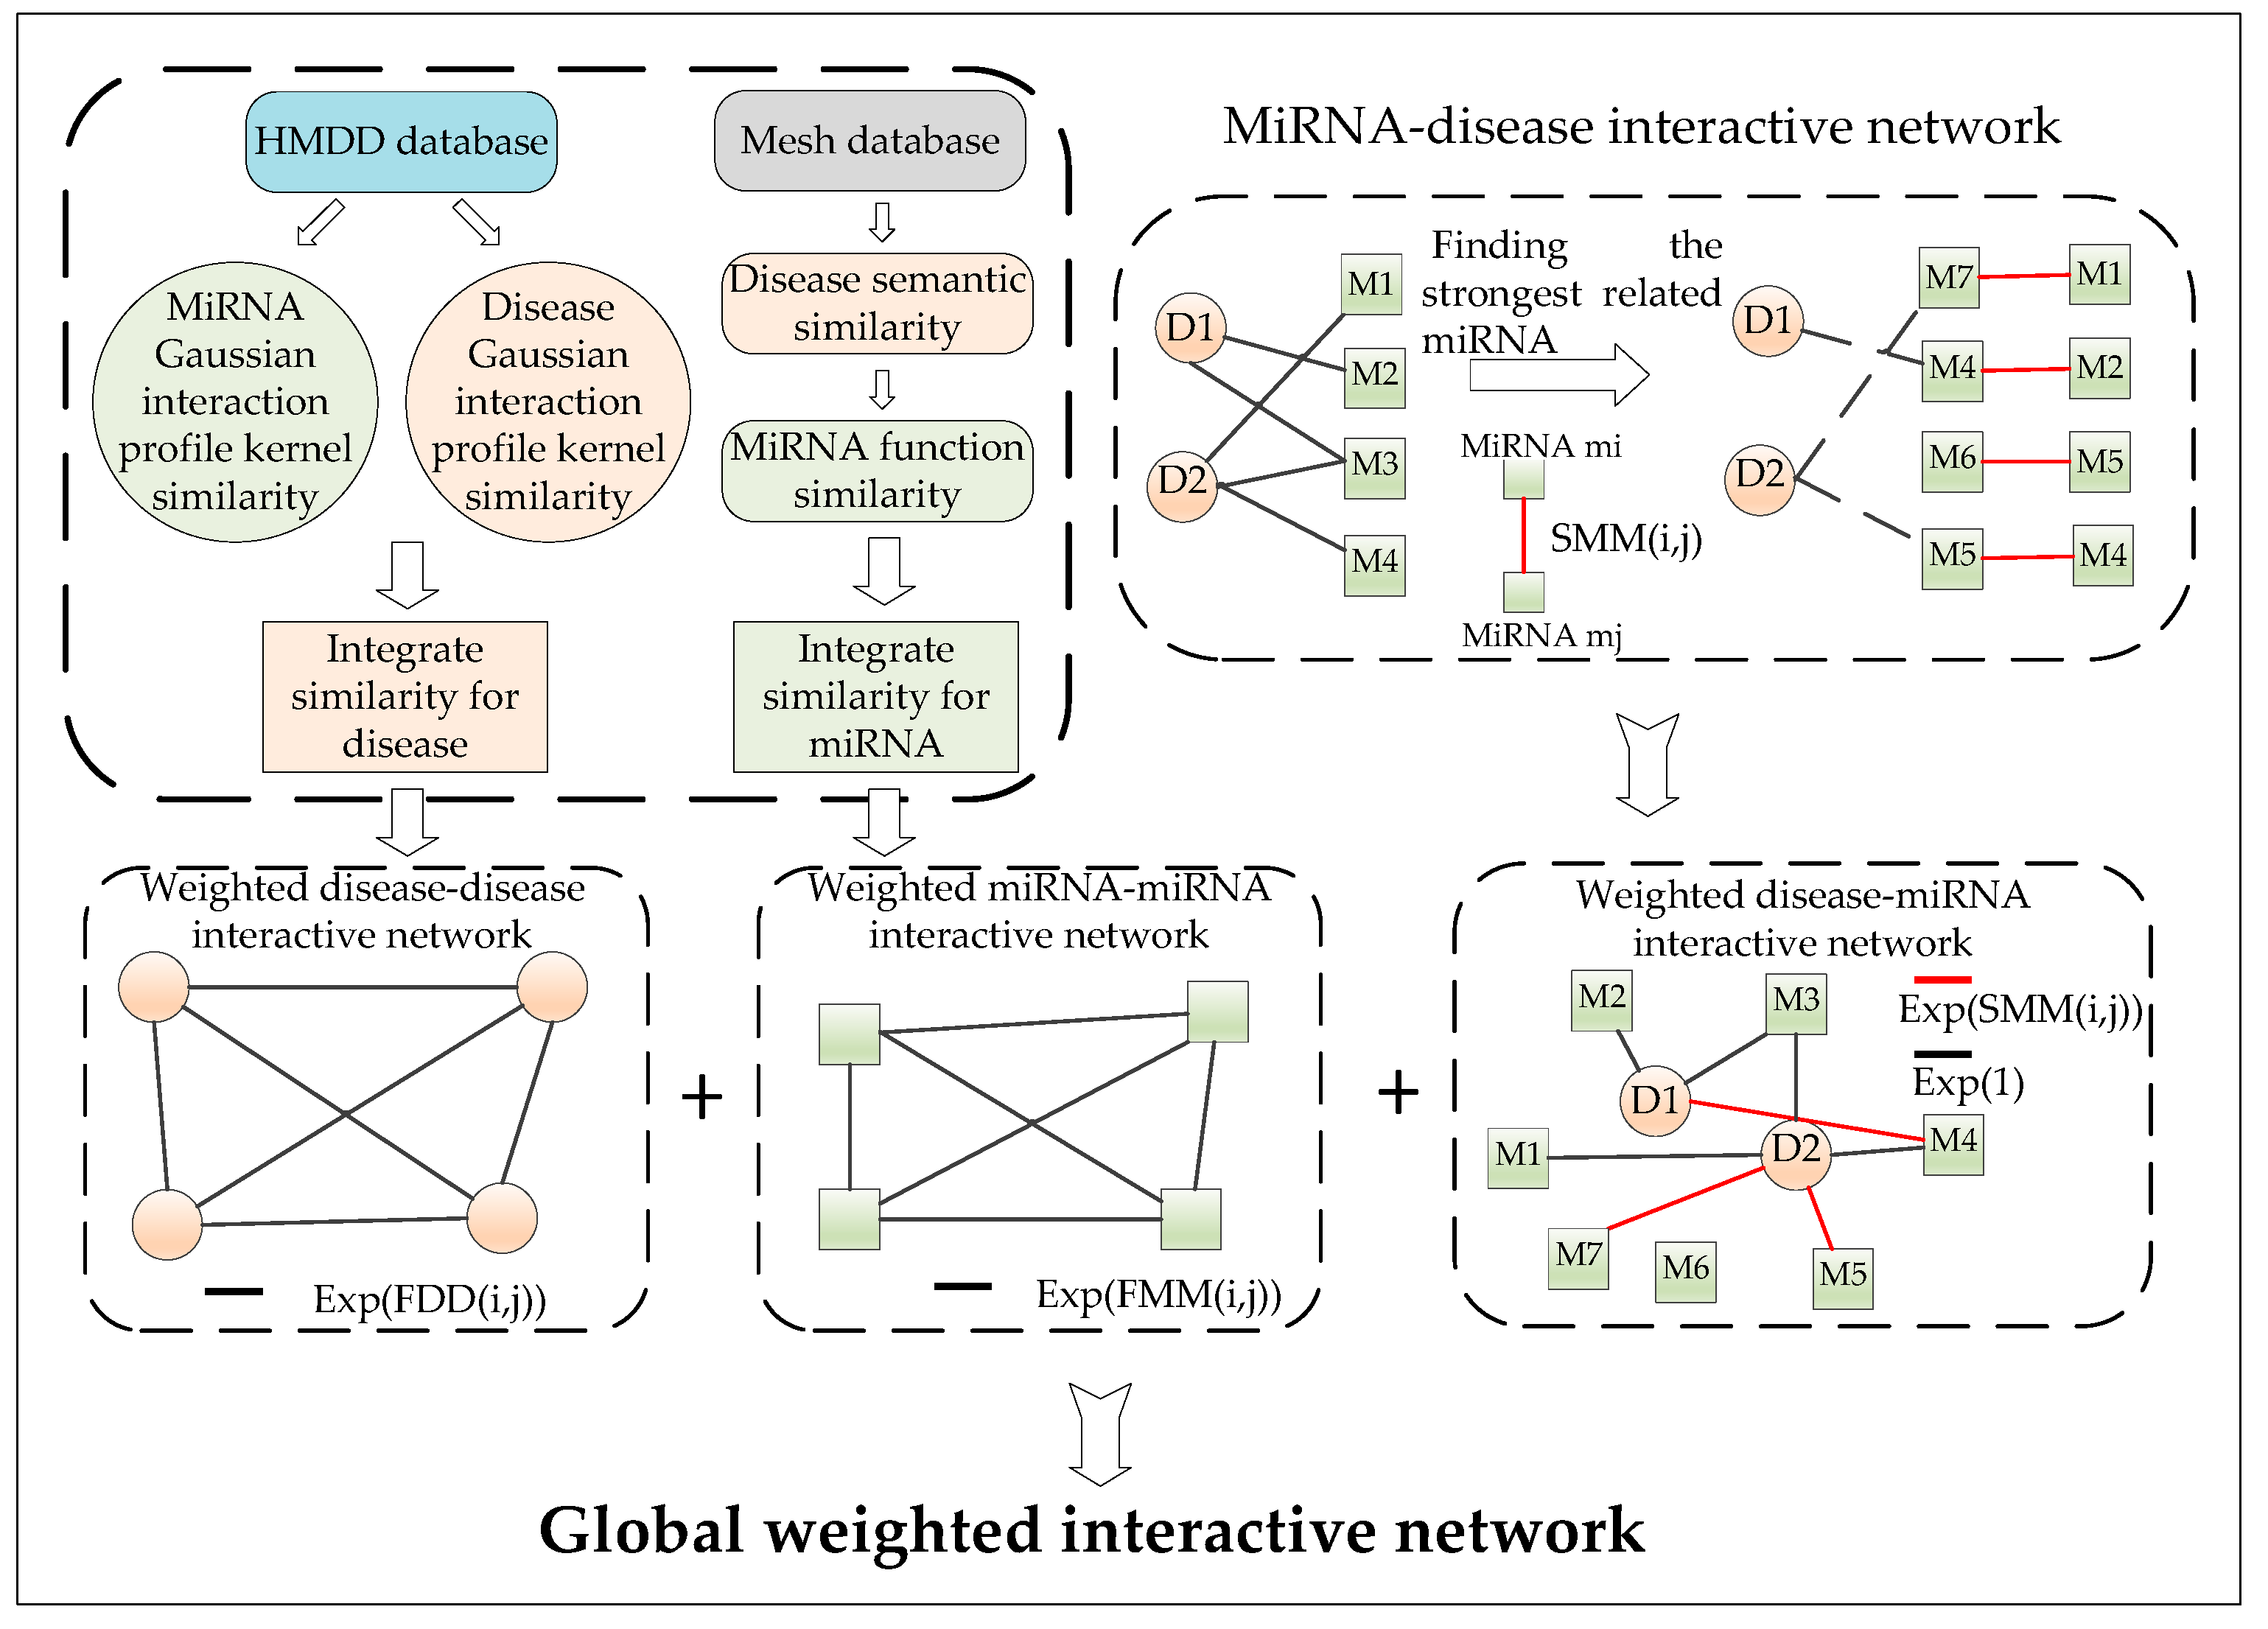
4.1. Construction of the miRNA–Disease Interactive Network

In order to construct the miRNA–disease interactive network, we firstly downloaded known miRNA–disease associations from the HMDD database on 14 July 2018. After eliminating duplicate values, erroneous data, and disorganized data, human miRNA–disease associations were downloaded from the HMDD database, which includes 5430 experimentally validated human miRNA–disease associations involving 495 miRNAs and 383 diseases. (Supplementary file 4) have been collected. Let D represent the number of different disease items and M represent the number of different miRNA items in the HMDD database, respectively; let SD = {d1, d2, ..., dD} represent the set of these D different diseases, and SM= {mD+1, mD+2, ..., mD+M} represent the set of these M different miRNAs. Then, we can construct an miRNA–disease interactive network G = (V, E), where V = SDSM = {d1, d2, ..., dD, mD+1, mD+2..., mD+M} is the set of vertices, E is the edge set of G, and ∀ di     SD, mj     SM. There is an edge between di and mj in E if and only if there is an association between mj and di in the database of HMDD. Thereafter, based on the newly constructed miRNA–disease interactive network G, for any given di SD and mj     SM, we can obtain a D × M dimensional matrix DMM as follows:
D M M ( i , j ) = { 1      i f   d i   i s   r e l a t e d   t o   m j   i n   H M D D 0 o t h e r w i s e

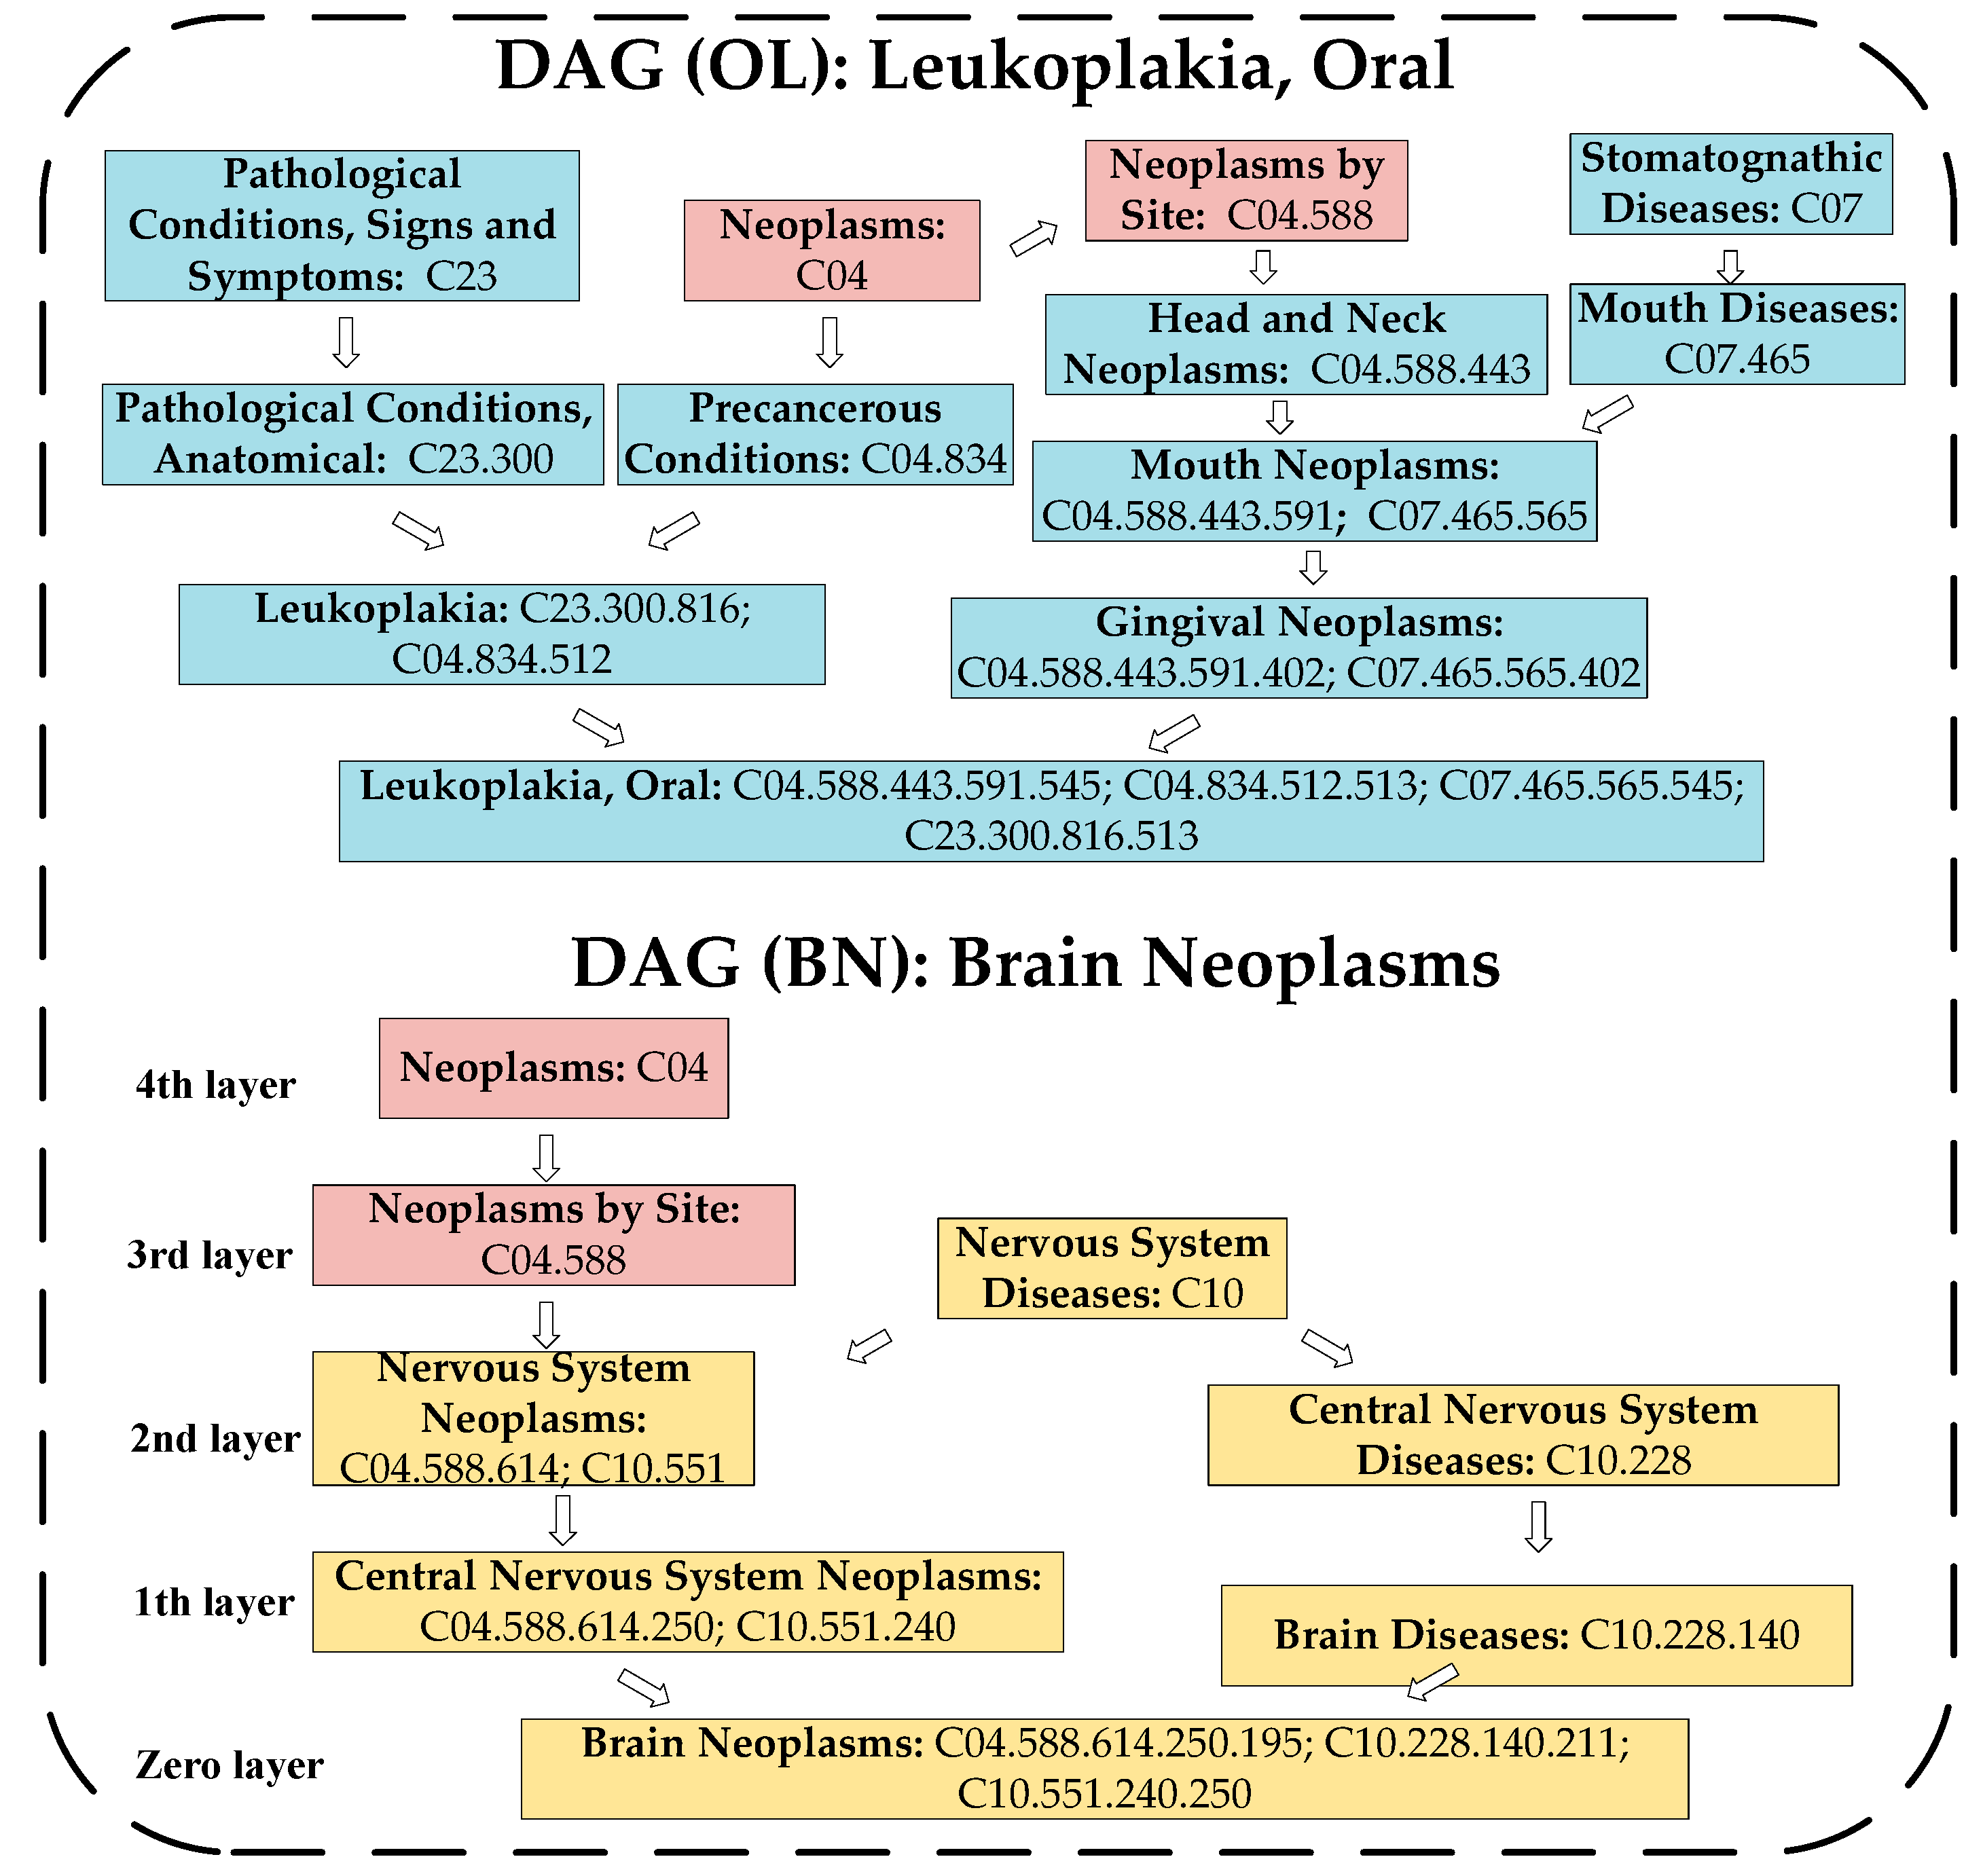
4.2. Calculation of the Disease Semantic Similarity

For any two diseases di and dj that belong to SD, the semantic similarity between di and dj was calculated according to the following steps:
Step 1: Firstly, we collected the Medical Subject Headings (MeSH) descriptors of di and dj from the National Library of Medicine (http://www.nlm.nih.gov/).
Step 2: Secondly, we constructed direct acyclic graphs (DAGs) corresponding to di and dj separately and, as illustrated in the Figure 3, for any given disease H, its DAG can be represented as DAG(H) = (N(H), E(H)), where N(H) is the node set and E(H) is the edge set. Moreover, in DAG(H), each node corresponds to a different disease MeSH descriptor, and all the MeSH descriptors are connected by a direct edge from a more general term (called a parent node) to a more specific term (called a child node). Furthermore, N(H) consists of the node H itself and its ancestor nodes; E(H) consists of corresponding direct edges from a parent node to a child node, and each edge in E(H) represents the relationship between these two nodes connected by it.
Step 3: Thirdly, based on the newly constructed DAG(H), let d be an ancestor node of H in DAG(H); then, we defined the contribution of an ancestor node d to the semantic value of the disease H and the contribution of the semantic value of disease H itself as follows:
{ D H ( d ) = 1 i f   d = H ; D H ( d ) = { α   × β × D H ( d * ) | d * c h i l d r e n   o f   d }   i f   d H .
Here, the parameter α is a semantic contribution attenuation factor with a value between zero and one, and its value was set to 0.5 in this paper according to previous state-of-the-art methods [52,53]. The parameter β is the number of addresses or codes included in the node d * , which indicates the weight of the contribution of disease d *   for H in DAG(H).
Obviously, according to Equation (2), it is easy to know that an ancestor node d with a larger number of child nodes in DAG(H) will make a more significant contribution to the semantic value of H. For instance, in DAG(BN) of Figure 3, the entry on “central nervous system neoplasms” includes two addresses or codes: C04.588.614.250 and C10.551.240; however, the entry on “brain diseases” includes only one code: C10.228.140. Thus, the contribution of “central nervous system neoplasms” to the semantic value of the “brain neoplasms” is 2 × α × 1, while the contribution of “brain diseases” to the semantic value of the “brain neoplasms” is 1 × α × 1 only.
Step 4: Next, based on Equation (2), we calculated the sematic value of disease H by accumulating the contributions of all disease terms to H in DAG(H) as follows:
T S ( H ) = d S ( H ) D H ( d )
For example, according to Equation (3), in DAG(BN) of Figure 3, the semantic value of the disease “brain neoplasms” can be obtained by “the contributions of ‘brain neoplasms’ to it” (= 1 × 1) + “the contributions of ‘central nervous system neoplasms’ to it” (= 2 × 0.5) + “the contributions of ‘brain diseases’ to it” (= 1 × 0.5) + “the contributions of ‘nervous system neoplasms’ to it” (= 2 × 0.5 × 0.5) + “the contributions of ‘central nervous system diseases’ to it” (= 1 × 0.5 × 0.5) + “the contributions of ‘nervous system diseases’ to it” (= 1 × 0.5 × 0.5 × 0.5 + 1 × 0.5 × 0.5 × 0.5) + “the contributions of ‘neoplasms by site’ to it” (= 1 × 0.5 × 0.5 × 0.5) + “the contributions of ‘neoplasms’ to it” (= 1 × 0.5 × 0.5 × 0.5 × 0.5) = 3.6875.
Step 5: Finally, we defined the semantic similarity between di and dj as follows:
S D D ( d i , d j ) = d S ( d i ) S ( d j ) ( D d i ( d ) + D d j ( d ) ) T S ( d i ) + T S ( d j )
Additionally, for any two diseases da and db that belong to SD, if da and db do not have semantic similarity, we define S D D ( d a , d b ) = −1; then, based on Equation (4), it is obvious that we can obtain a D × D dimensional disease semantic similarity matrix SDD (i, j).

4.3. Calculation of the miRNA Functional Similarity

Considering that, in the HMDD database, one miRNA may be associated with multiple disease items and vice versa, and, according to the state-of-the-art literature [39], the functional similarity can be obtained by integrating the semantic similarity of the two groups of diseases associated with these two miRNAs, then, for any two diseases mi and mj that belong to SM, the functional similarity between mi and mj can be calculated according to the following steps:
Step 1: Firstly, let dx be any given disease, and Dgroup= {dy1, dy2, dy3…. dyr} be a set consisting of r different diseases, and then the semantic similarity between dx and Dgroup can be calculated as follows:
S S ( d x , D g r o u p ) = max 1 i r ( S D D ( d x , d y i ) )
For example, let da, db, and dc be three kinds of diseases, Dgroup = {db, dc}, SDD (da, db) = 0.7, and SDD (da, dc) = 0.8; then, the semantic similarity between da and Dgroup is SS (da, Dgroup) = max {SDD (da, db), SDD (da, dc)} = 0.8.
Step 2: Secondly, let Dgroupi and Dgroupj be the sets of diseases associated with mi and mj, respectively; supposing that there are N and M different diseases in Dgroupi and Dgroupj, then we calculated the functional similarity between mi and mj as follows:
S M M ( m i , m j ) = 1 i M S S ( d i ,   D g r o u p i ) + 1 j N S S ( d j ,   D g r o u p j ) M + N ,
where di Dgroupj and dj Dgroupi. For example, let Dgroup1 = {X, Y}, Dgroup2 = {X, Z}, supposing that SDD(X, Y) = 0.6, SDD(X, Z) = 0.7, and SDD(Y, Z) = 0.5, then MM(m1,m2) can be obtained as follows:
S M M ( m 1 , m 2 ) = S S ( X , D g r o u p 1 ) + S S ( Y , D g r o u p 2 ) + S S ( X , D g r o u p 1 ) + S S ( Z , D g r o u p 2 ) 2 + 2 = S D D ( X , X ) + S D D ( Y , X ) + S D D ( X , X ) + S D D ( Z , X ) 4 = 1 + 0.6 + 1 + 0.7 4 = 0.825 .
Additionally, for any two miRNAs ma and mb that belong to SM, if ma and mb do not have semantic similarity, we define S M M ( m a , m b ) =   −1; then, based on Equation (6), it is obvious that we can obtain an M × M dimensional miRNA functional similarity matrix SMM (i, j).

4.4. Disease Gaussian Interaction Profile Kernel Similarity Measurement

On the basis of premises that functionally similar miRNAs may regulate similar diseases and similar diseases tend to associate with functionally similar miRNAs, let DLP(di) represent the i-th row in the matrix DMM; then, for any two diseases di and dj that belong to SD, we can calculate the Gaussian interaction profile kernel similarity between them as follows:
D G S ( d i , d j ) = exp ( D × | | D L P ( d i ) D L P ( d j ) | | 2 i = 1 D | | D L P ( d i ) | | 2 )
Additionally, based on previous work [54], we can further improve the disease Gaussian interaction profile kernel similarity using a logistic function as follows:
F D G S ( i , j ) = 1 1 + e 15 DGS ( d i , d j ) + log ( 9999 )

4.5. MicroRNA Gaussian Interaction Profile Kernel Similarity Measurement

On the basis of premises that functionally similar miRNAs may regulate similar diseases and similar diseases tend to associate with functionally similar miRNAs, let MLP(mi) represent the i-th column in the matrix DMM; then, for any two miRNAs mi and mj that belong to SM, we can calculate the Gaussian interaction profile kernel similarity between them as follows:
F M G S ( i , j ) = exp ( M | | M L P ( m i ) M L P ( m j ) | | 2 i = 1 M | | M L P ( m i ) | | 2 ) .

4.6. Calculation of the Integrated Similarity

Based on Equations (6) and (10), the disease integrated similarity matrix FDD can be calculated based on the disease semantic similarity matrix (SDD) and the disease Gaussian interaction profile kernel similarity matrix (FDGS) as follows:
F D D ( i , j ) = { S D D ( i , j )     i f   S D D ( i , j ) 0 , F D G S ( i , j ) o t h e r w i s e .
Similarly, based on Equations (8) and (11), the miRNA integrated similarity matrix FMM can be calculated based on the miRNA functional similarity matrix (SMM) and the miRNA Gaussian interaction profile kernel similarity matrix (FMGS) as follows:
F M M ( i , j ) = { S M M ( i , j )     i f   S M M ( i , j ) 0 , F M G S ( i , j ) o t h e r w i s e .

4.7. Construction of the Weighted Interactive Network

For any given miRNA mi SM, we define the miRNA mx SM as the most related miRNA to mi, if mx satisfies the following:
F M M ( m x , m i ) = m a x 1 l M ( F M M ( m l , m i ) ) ,   w h e r e   m x m i .
Thereafter, as illustrated in Figure 4, we can construct the weighted interactive network according to the following four steps:
Step1: Firstly, for any given disease di   SD, we define the miRNA mj as a potential miRNA to di if and only if mj satisfies DMM(i,j) = 0; otherwise, we define the miRNA mj as a known miRNA to di. Hence, according to premises that functionally similar miRNAs may regulate similar diseases and similar diseases tend to associate with functionally similar miRNAs, it is reasonable to assume that the miRNA mj is related to di if mj is a potential miRNA to di, mx is a most related miRNA to mj, and mx is also a known miRNA to di at the same time. Thereafter, based on this assumption, for any given disease di   SD and any given miRNA mj   SM, we can define the weight between di and mj as follows:
D M W ( i , j ) = { 1 exp ( max x M R M ( m j ) S M M ( j , x ) )     i f   D M M ( i , j ) = 0   a n d   D M M ( i , x ) 0 , 1 exp ( D M M ( i , j ) ) i f   D M M ( i , j ) 0 , 0 o t h e r w i s e .
Step 2: Secondly, according to Equation (10), for any two given diseases di and dj that belong to SD, we define the weight between di and dj as follows:
D W ( i , j ) = 1 exp ( F D D ( i , j ) ) .
From Equation (14), it is easy to know that the higher the semantic similarity between di and dj is, the smaller the weight between di and dj will be.
Step 3: Similarly, according to Equation (11), for any two given miRNAs mi and mj that belong to SM, we define the weight between mi and mj as follows:
M W ( i , j ) = 1 exp ( F M M ( i , j ) )
From Equation (15), it is also easy to know that the higher the functionally similarity between mi and mj is, the smaller the weight between mi and mj will be.
Thereafter, based on above three steps, for i     [1,D + M] and j     [1,D + M], a weighted miRNA–disease interactive network can finally be constructed as follows:
G F W ( i , j ) = { D W ( d i , d j ) ,     i f   i [ 1 , D ]   and   j [ 1 , D ] , D M W ( d i , m j ) , i f   i [ 1 , D ]   and   j [ D , D + M ] , D M W ( m i , d j ) , i f   i [ D , D + M ]   and   j [ 1 , D ] , M W ( m i , m j ) , i f   i [ D , D + M ]   and   j [ D , D + M ] .

4.8. Calculation of the Shortest Path Based on the Weighted Interactive Network

For any two given nodes A and B in the weighted interactive network G, supposing that there is a path P consisting of n hops such as P0(=A), P1, P2,…,Pn(=B) from A to B in G, then we define the weights of path P as i = 0 n 1 G F W ( i , i + 1 ) . In addition, among all the paths from A to B in G, a path from A to B with smallest weights is called the shortest path from A to B. Thereafter, it is reasonable to assume that, for any two given nodes A and B in the weighted interactive network G, the smaller the weight of the shortest path from A to B is, the more related to each other the nodes A and B will be. Thus, based on this assumption, for any two given nodes A and B in the weighted interactive network G, we can design an algorithm for searching the shortest path from A to B in G as follows:
Step 1: Initially, we define that S = {V0} is a set consisting of an arbitrary node V0 in G, T is a set consisting of all nodes in G other than V0, and DD is a matrix defined as follows:
D D ( i , j ) = { G F W ( i , j )     i f   G F W ( i , j ) > 0 , i f   G F W ( i , j ) = 0 ,
where i     [1,D+M] and j     [1,D+M].
Step 2: Next, we select a node Vk from T randomly, if Vk satisfies that Vk S and the distance from Vk to S is smaller than the distance from any other node other than Vk in T to S. Here, we define the distance from a node x in G to a node set V in G as the smallest value of the distances between x and all nodes in V.
Step 3: Thereafter, if DD (i, j) > DD (i, k) + DD (k, j), then we further modify DD(i,j) to DD(i, j) = DD(i, k) + DD(k, j) in the matrix DD.
Step 4: After repeating step 2 and step 3 until all nodes in G are included in S, then it is obvious that we can transfer the matrix DD to a (D + M) × (D + M) dimensional shortest path matrix (SPM).

4.9. Calculation of the Shortest Path Based on the Weighted Interactive Network

Considering the fact that known miRNA–disease associations are very sparse, for a specific disease di and a specific miRNA mj, as illustrated in Figure 5, in this section, we adopt the concept of T most similar neighbors to estimate the association between di and mj according to the following steps:
Step 1: Firstly, for the disease di, let DKi = {di1, di2, di3…., diT} be a set consisting of the first T nodes in SD after sorting the nodes in SD by the disease integrated similarity between them with di in descending order, and, for the miRNA mj, let MKj = {mj1, mj2, mj3…., mjT} be a set consisting of the first T nodes in SM after sorting the nodes in SM by the miRNA integrated similarity between them with mj in descending order.
Step 2: Secondly, according to premises that functionally similar miRNAs may regulate similar diseases and similar diseases tend to associate with functionally similar miRNAs, we calculate the association between di and MKj and the association between mj and DKi as follows:
S D M ( d i , M K j ) = 1 < q < T S P M ( d i , m j q )
S M D ( m j , M D i ) = 1 < q < T S P M ( m j , d i q )
Step 3: In order to optimize the prediction results, by integrating the above two associations and the matrix SPM, we can obtain our final prediction results as follows:
F P R ( i , j ) = w × ( S D M ( d i , M K j ) + S M D ( m j , M D i ) ) 2 × T + ( 1 w ) × S P M ( i , j )
where w is a weight coefficient with a value from zero to one.

5. Conclusions

In this article, the effective predictive performance of WINMDA was mainly due to several reasons. Firstly, the sematic disease similarity, functional miRNA similarity, and Gaussian interaction profile kernel similarity were integrated. Secondly, we proposed a new method for calculating the semantic similarity of diseases. Thirdly, we constructed a weighted interactive network-based disease similarity, miRNA similarity, and known miRNA–disease associations. Fourthly, the concept of T most similar neighbours was introduced. Finally, an algorithm for searching the shortest path in the weighted interactive network was introduced. Furthermore, in future work, multiple heterogeneous biological data can be collected and pre-processed to be utilized in the weighted interactive network, thus improving the performance of prediction algorithms.

Supplementary Materials

Supplementary materials can be found at https://www.mdpi.com/1422-0067/20/1/110/s1.

Author Contributions

Conceptualization, H.Z. Data curation, H.Z. Formal analysis, L.K. and Q.Z. Funding acquisition, L.W. Investigation, L.K. Methodology, H.Z. Project administration, X.F., Q.Z., and L.W. Resources, X.F. Supervision, X.F. and L.W. Validation, L.K. Writing—original draft, H.Z. Writing—review and editing, L.K. and Q.Z.

Funding

This research was funded by the National Natural Science Foundation of China (No.61873221, No.61472282, No.61672447), the Natural Science Foundation of Hunan Province (No.2018JJ4058, No.2017JJ5036), and the CERNET Next Generation Internet Technology Innovation Project (No. NGII20160305, No. NGII20170109).

Acknowledgments

The authors thank the anonymous referees for suggestions that helped improve the paper substantially.

Conflicts of Interest

The authors declare no conflicts of interest.

Abbreviations

miRNAsMicroRNAs
WINMDAWeighted interactive network for discovering potential miRNA–disease associations
CXCL8C–X–C ligand 8
ROCreceiver operating characteristics
AUCArea of ROC under the curve
LOOCVLeave-one-out cross-validation
OCOvarian cancer
ncRNAsNon-coding RNAs
MeSHMedical Subject Headings
DAGsDirect acyclic graphs
HMDDHuman microRNA Disease Database
LncRNAlong non-coding RNA
NEAT 1nuclear paraspeckle assembly transcript 1
SNPssingle-nucleotide polymorphisms
dbDEMCDifferentially Expressed miRNAs in Human Cancers

References

  1. Chen, X.; Yan, G.Y. Novel human lncRNA–disease association inference based on lncRNA expression profiles. Bioinformatics 2013, 29, 2617–2624. [Google Scholar] [CrossRef] [PubMed] [Green Version]
  2. Consortium, E.P.; Birney, E.; Stamatoyannopoulos, J.A.; Dutta, A.; Guigó, R.; Gingeras, T.R.; Margulies, E.H.; Weng, Z.; Snyder, M.; Dermitzakis, E.T. Identification and analysis of functional elements in 1% of the human genome by the ENCODE pilot project. Nature 2007, 447, 799–816. [Google Scholar] [CrossRef] [Green Version]
  3. Lander, E.S.; Linton, L.M.; Birren, B.; Nusbaum, C.; Zody, M.C.; Baldwin, J.; Devon, K.; Dewar, K.; Doyle, M.; FitzHugh, W. Initial sequencing and analysis of the human genome. Nature 2001, 409, 860–921. [Google Scholar] [CrossRef] [PubMed]
  4. Zou, Q.; Li, J.; Song, L.; Zeng, X.; Wang, G. Similarity computation strategies in the microRNA-disease network: A survey. Brief. Funct. Genom. 2016, 15, 55. [Google Scholar] [CrossRef] [PubMed]
  5. Ambros, V. The functions of animal microRNAs. Nature 2004, 431, 350–355. [Google Scholar] [CrossRef]
  6. Bartel, D.P. MicroRNAs: Target recognition and regulatory functions. Cell 2009, 136, 215–233. [Google Scholar] [CrossRef]
  7. Khella, H.W.; Scorilas, A.; Mozes, R.; Mirham, L.; Lianidou, E.; Krylov, S.N.; Lee, J.Y.; Ordon, M.; Stewart, R.; Jewett, M.A. Low expression of miR-126 is a prognostic marker for metastatic clear cell renal cell carcinoma. Am. J. Pathol. 2015, 185, 693–703. [Google Scholar] [CrossRef]
  8. Nan, D.; Wu, H.; Tao, T.; Peng, E. NEAT1 regulates cell proliferation and apoptosis of ovarian cancer by miR-34a-5p/BCL2. Oncotargets Ther. 2017, 10, 4905–4915. [Google Scholar] [CrossRef]
  9. Xu, X.; Wu, X.; Jiang, Q.; Sun, Y.; Liu, H.; Chen, R.; Wu, S. Downregulation of microRNA-1 and microRNA-145 contributes synergistically to the development of colon cancer. Int. J. Mol. Med. 2015, 36, 1630–1638. [Google Scholar] [CrossRef]
  10. Chen, B.; Duan, L.; Yin, G.; Jing, T.; Jiang, X. Simultaneously expressed miR-424 and miR-381 synergistically suppress the proliferation and survival of renal cancer cells—Cdc2 activity is up-regulated by targeting WEE1. Clinics 2013, 68, 825–833. [Google Scholar] [CrossRef]
  11. Tang, W.; Wan, S.; Yang, Z.; Teschendorff, A.E.; Zou, Q. Tumor origin detection with tissue-specific miRNA and DNA methylation markers. Bioinformatics 2017, 34, 398–406. [Google Scholar] [CrossRef] [PubMed]
  12. Zeng, X.; Liu, L.; Lü, L.; Zou, Q. Prediction of potential disease-associated microRNAs using structural perturbation method. Bioinformatics 2018, 34, 2425–2432. [Google Scholar] [CrossRef] [PubMed]
  13. Ping, P.; Wang, L.; Kuang, L.; Ye, S.; Mfb, I.; Pei, T. A Novel method for lncRNA-disease association prediction based on an lncRNA-disease association network. IEEE/ACM Trans. Comput. Biol. Bioinform. 2018, 1. [Google Scholar] [CrossRef] [PubMed]
  14. Yu, J.; Ping, P.; Wang, L.; Kuang, L.; Li, X.; Wu, Z. A Novel probability model for lncRNA⁻disease association prediction based on the Naïve Bayesian Classifier. Genes 2018, 9, 345. [Google Scholar] [CrossRef] [PubMed]
  15. Kozomara, A.; Griffithsjones, S. miRBase: Annotating high confidence microRNAs using deep sequencing data. Nucleic Acids Res. 2014, 42, D68. [Google Scholar] [CrossRef] [PubMed]
  16. Yang, Z.; Ren, F.; Liu, C.; He, S.; Sun, G.; Gao, Q.; Yao, L.; Zhang, Y.; Miao, R.; Cao, Y. dbDEMC: A database of differentially expressed miRNAs in human cancers. BMC Genom. 2010, 11, S5. [Google Scholar] [CrossRef] [PubMed]
  17. Li, Y.; Qiu, C.; Tu, J.; Geng, B.; Yang, J.; Jiang, T.; Cui, Q. HMDD v2.0: A database for experimentally supported human microRNA and disease associations. Nucleic Acids Res. 2014, 42, D1070. [Google Scholar] [CrossRef] [PubMed]
  18. Jiang, Q.; Wang, Y.; Hao, Y.; Juan, L.; Teng, M.; Zhang, X.; Li, M.; Wang, G.; Liu, Y. miR2Disease: A manually curated database for microRNA deregulation in human disease. Nucleic Acids Res. 2009, 37, D98–D104. [Google Scholar] [CrossRef]
  19. Chen, X.; Wang, L.; Qu, J.; Guan, N.; Li, J. Predicting miRNA–disease association based on inductive matrix completion. Bioinformatics 2018, 34, 4256–4265. [Google Scholar] [CrossRef]
  20. Chen, X.; Xie, D.; Zhao, Q.; You, Z.H. MicroRNAs and complex diseases: From experimental results to computational models. Brief. Bioinform. 2017, 18, 558. [Google Scholar] [CrossRef]
  21. Chen, X.; Zhou, Z. ELLPMDA: Ensemble learning and link prediction for miRNA-disease association prediction. RNA Biol. 2018, 15, 807–818. [Google Scholar] [CrossRef] [PubMed]
  22. Chen, X.; Zhang, D.H.; You, Z.H. A heterogeneous label propagation approach to explore the potential associations between miRNA and disease. J. Transl. Med. 2018, 16, 348. [Google Scholar] [CrossRef] [PubMed]
  23. Chen, X.; Wang, C.C.; Yin, J.; You, Z.H. Novel human miRNA-disease association inference based on random forest. Mol. Ther. Nucleic Acids 2018, 13, 568–579. [Google Scholar] [CrossRef] [PubMed]
  24. Chen, X.; Cheng, J.Y.; Yin, J. Predicting microRNA-disease associations using bipartite local models and hubness-aware regression. RNA Biol. 2018, 15, 1192–1205. [Google Scholar] [CrossRef]
  25. Chen, X.; Liu, M.X.; Yan, G.Y. RWRMDA: Predicting novel human microRNA-disease associations. Mol. Biosyst. 2012, 8, 2792–2798. [Google Scholar] [CrossRef]
  26. Chen, X.; Yan, G.Y. Semi-supervised learning for potential human microRNA-disease associations inference. Sci. Rep. 2014, 4, 5501. [Google Scholar] [CrossRef]
  27. Chen, X.; Yan, C.C.; Zhang, X.; You, Z.H.; Deng, L.; Liu, Y.; Zhang, Y.; Dai, Q. WBSMDA: Within and between score for miRNA-disease association prediction. Sci. Rep. 2016, 6, 21106. [Google Scholar] [CrossRef]
  28. Zou, Q.; Li, J.; Hong, Q.; Lin, Z.; Wu, Y.; Shi, H.; Ying, J. Prediction of microRNA-disease associations based on social network analysis methods. Biomed. Res. Int. 2015, 2015, 810514. [Google Scholar] [CrossRef]
  29. You, Z.H.; Huang, Z.A.; Zhu, Z.; Yan, G.Y.; Li, Z.W.; Wen, Z.; Chen, X. PBMDA: A novel and effective path-based computational model for miRNA-disease association prediction. PLoS Comput. Biol. 2017, 13, e1005455. [Google Scholar] [CrossRef]
  30. Chen, X.; Huang, L. LRSSLMDA: Laplacian regularized sparse subspace learning for miRNA-disease association prediction. PLoS Comput. Biol. 2017, 13, e1005912. [Google Scholar] [CrossRef]
  31. Chen, X.; Yin, J.; Qu, J.; Huang, L. MDHGI: Matrix decomposition and heterogeneous graph inference for miRNA-disease association prediction. PLoS Comput. Biol. 2018, 14, e1006418. [Google Scholar] [CrossRef] [PubMed]
  32. Zhao, H.; Kuang, L.; Wang, L.; Ping, P.; Xuan, Z.; Pei, T.; Wu, Z. Prediction of microRNA-disease associations based on distance correlation set. BMC Bioinform. 2018, 19, 141. [Google Scholar] [CrossRef] [PubMed]
  33. Chen, X.; Huang, L.; Xie, D.; Zhao, Q. EGBMMDA: Extreme gradient boosting machine for miRNA-disease association prediction. Cell Death Dis. 2018, 9, 3. [Google Scholar] [CrossRef] [PubMed]
  34. Chen, X.; Xie, D.; Wang, L.; Zhao, Q.; You, Z.H.; Liu, H. BNPMDA: Bipartite network projection for miRNA-disease association prediction. Bioinformatics 2018, 34, 3178–3186. [Google Scholar] [CrossRef] [PubMed]
  35. Zhang, H.D.; Jiang, L.H.; Sun, D.W.; Li, J.; Ji, Z.L. The role of mir-130a in cancer. Breast Cancer 2017, 24, 521–527. [Google Scholar] [CrossRef] [PubMed]
  36. Depke, J.L.; Onitilo, A.A. Coalition building and the intervention wheel to address breast cancer screening in hmong women. Clin. Med. Res. 2011, 9, 1–6. [Google Scholar] [CrossRef]
  37. Finley, J.W.; Davis, C.D.; Feng, Y. Selenium from high selenium broccoli protects rats from colon cancer. J. Nutr. 2000, 130, 2384. [Google Scholar] [CrossRef]
  38. Bakitas, M.; Ahles, T.A.; Skalla, K.; Brokaw, F.C.; Byock, I.; Hanscom, B.; Lyons, K.D.; Hegel, M.T. Proxy perspectives about end-of-life care for Person’s with cancer. Cancer 2010, 112, 1854–1861. [Google Scholar] [CrossRef]
  39. Heath, D.D.; Devlin, R.H.; Heath, J.W.; Iwama, G.K. Genetic, environmental and interaction effects on the incidence of jacking in Oncorhynchus tshawytscha (chinook salmon). Heredity 1994, 72, 146–154. [Google Scholar] [CrossRef] [Green Version]
  40. Hollis, M.; Nair, K.; Vyas, A.; Chaturvedi, L.S.; Gambhir, S.; Vyas, D. MicroRNAs potential utility in colon cancer: Early detection, prognosis, and chemosensitivity. World J. Gastroenterol. 2015, 21, 8284–8292. [Google Scholar] [CrossRef]
  41. Gomes, S.E.; Simões, A.E.S.; Pereira, D.M.; Rui, E.C.; Rodrigues, C.M.P.; Borralho, P.M. miR-143 or miR-145 overexpression increases cetuximab-mediated antibody-dependent cellular cytotoxicity in human colon cancer cells. Oncotarget 2016, 7, 9368–9387. [Google Scholar] [CrossRef] [PubMed] [Green Version]
  42. Signs, S.A.; Fisher, R.C.; Tran, U.; Chakrabarti, S.; Sarvestani, S.K.; Xiang, S.; Liska, D.; Roche, V.; Lai, W.; Gittleman, H.R. Stromal miR-20a controls paracrine CXCL8 secretion in colitis and colon cancer. Oncotarget 2018, 9, 13048–13059. [Google Scholar] [CrossRef] [PubMed]
  43. Jiang, H.; Ge, F.; Hu, B.; Wu, L.; Yang, H.; Wang, H. rs35301225 polymorphism in miR-34a promotes development of human colon cancer by deregulation of 3′UTR in E2F1 in Chinese population. Cancer Cell Int. 2017, 17, 39. [Google Scholar] [CrossRef] [PubMed]
  44. Ding, S.; Eric, B.R.; Chen, Y.; Scull, B.; Kay, L.P.; Morgan, D. Molecular Imaging of Gastric Neoplasia with Near Infrared Fluorescent (NIRF) Activatable Probes. Mol. Imaging 2012, 11, 507–515. [Google Scholar] [CrossRef] [PubMed]
  45. Zhou, L.; Zhao, X.; Han, Y.; Lu, Y.; Shang, Y.; Liu, C.; Li, T.; Jin, Z.; Fan, D.; Wu, K. Regulation of UHRF1 by miR-146a/b modulates gastric cancer invasion and metastasis. FASEB J. 2013, 27, 4929–4939. [Google Scholar] [CrossRef] [PubMed] [Green Version]
  46. Zhuang, M.; Shi, Q.; Zhang, X.; Ding, Y.; Shan, L.; Shan, X.; Qian, J.; Zhou, X.; Huang, Z.; Zhu, W. Involvement of miR-143 in cisplatin resistance of gastric cancer cells via targeting IGF1R and BCL2. Tumour Biol. 2015, 36, 2737–2745. [Google Scholar] [CrossRef] [PubMed]
  47. Marech, I.; Vacca, A.; Ranieri, G.; Gnoni, A.; Dammacco, F. Novel strategies in the treatment of castration-resistant prostate cancer (Review). Int. J. Oncol. 2012, 40, 1313–1320. [Google Scholar] [CrossRef]
  48. Salinas, C.A.; Tsodikov, A.; Ishakhoward, M.; Cooney, K.A. Prostate Cancer in Young Men: An Important Clinical Entity. Nat. Rev. Urol. 2014, 11, 317–323. [Google Scholar] [CrossRef]
  49. Chu, H.; Zhong, D.; Tang, J.; Li, J.; Xue, Y.; Tong, N.; Qin, C.; Yin, C.; Zhang, Z.; Wang, M. A functional variant in miR-143 promoter contributes to prostate cancer risk. Arch. Toxicol. 2016, 90, 403–414. [Google Scholar] [CrossRef]
  50. Wang, D.; Lu, G.; Shao, Y.; Xu, D. MiR-182 promotes prostate cancer progression through activating Wnt/β-catenin signal pathway. Biomed. Pharmacother. 2018, 99, 334–339. [Google Scholar] [CrossRef]
  51. Taddei, M.L.; Cavallini, L.; Comito, G.; Giannoni, E.; Folini, M.; Marini, A.; Gandellini, P.; Morandi, A.; Pintus, G.; Raspollini, M.R. Senescent stroma promotes prostate cancer progression: The role of miR-210. Mol. Oncol. 2014, 8, 1729–1746. [Google Scholar] [CrossRef] [PubMed]
  52. Wang, D.; Wang, J.; Lu, M.; Song, F.; Cui, Q. Inferring the human microRNA functional similarity and functional network based on microRNA-associated diseases. Bioinformatics 2010, 26, 1644–1650. [Google Scholar] [CrossRef] [PubMed] [Green Version]
  53. Chen, X.; You, Z.H.; Yan, G.Y.; Gong, D.W. IRWRLDA: Improved random walk with restart for lncRNA-disease association prediction. Oncotarget 2016, 7, 57919–57931. [Google Scholar] [CrossRef] [PubMed]
  54. Vanunu, O.; Magger, O.; Ruppin, E.; Shlomi, T.; Sharan, R. Associating genes and protein complexes with disease via network propagation. PLoS Comput. Biol. 2010, 6, e1000641. [Google Scholar] [CrossRef] [PubMed]
Figure 1. The comparison results between the weighted interactive network for miRNA–disease association inference (WINMDA) and four state-of-the-art computational models in terms of global leave-one-out cross-validation (LOOCV).
Ijms 20 00110 g001
Figure 2. The comparison results between WINMDA and four state-of-the-art computational models in terms of local LOOCV.
Ijms 20 00110 g002
Figure 3. The disease directed acyclic graphs (DAGs) of leukoplakia, and oral and brain neoplasms.
Ijms 20 00110 g003
Figure 4. The flowchart detailing the construction of the global weighted interactive network by combining the weighted disease–disease interactive network, the weighted miRNA–miRNA interactive network, and the weighted disease–miRNA interactive network.
Ijms 20 00110 g004
Figure 5. The process of predicting potential miRNA–disease associations based on the concept of k most similar neighbors.
Ijms 20 00110 g005
Table 1. The average area under the receiver operating characteristics (ROC) curve (AUC) achieved by the weighted interactive network for miRNA–disease association inference (WINMDA) under the frameworks of 5-Fold cross-validation and 10-Fold cross-validation.
LOOCV5-Fold Cross-Validation10-Fold Cross-Validation
0.92430.9183 ± 0.00070.9200 ± 0.0004
Table 2. Effects of T on the prediction performance of WINMDA when w = 0.6.
TAUCTAUC
10.9145120.9241
20.9160160.9243
50.9222180.9242
80.9244200.9188
Table 3. Effects of w on the prediction performance of WINMDA when T = 16.
wAUCwAUC
00.91350.60.9243
0.10.91880.70.9239
0.20.92090.80.9222
0.3
0.4
0.5
0.9216
0.9235
0.9241
0.9
1
0.9189
0.9160
Table 4. The potential top 50 predicted microRNAs (miRNAs) related to colon neoplasms obtained by WINMDA based on known associations in the Human microRNA Disease Database (HMDD) database.
Top 1–25
miRNAs
EvidenceTop 26–50
miRNAs
Evidence
hsa-mir-143dbDEMC and miR2Diseasehsa-let-7edbDEMC
hsa-mir-20adbDEMC and miR2Diseasehsa-mir-48626895105
hsa-mir-34adbDEMC and miR2Diseasehsa-mir-133bdbDEMC and miR2Disease
hsa-mir-210dbDEMChsa-mir-200aunconfirmed
hsa-mir-21dbDEMC and miR2Diseasehsa-mir-141dbDEMC and miR2Disease
hsa-mir-155dbDEMC and miR2Diseasehsa-let-7fdbDEMC and miR2Disease
hsa-mir-95dbDEMC and miR2Diseasehsa-mir-29adbDEMC and miR2Disease
hsa-mir-146adbDEMChsa-mir-181adbDEMC and miR2Disease
hsa-mir-16dbDEMChsa-mir-9dbDEMC and miR2Disease
hsa-mir-125bdbDEMChsa-mir-29bdbDEMC and miR2Disease
hsa-mir-92aunconfirmedhsa-let-7cdbDEMC
hsa-mir-31dbDEMC and miR2Diseasehsa-let-7ddbDEMC
hsa-mir-223dbDEMC and miR2Diseasehsa-mir-196adbDEMC and miR2Disease
hsa-mir-221dbDEMC and miR2Diseasehsa-let-7idbDEMC
hsa-mir-222dbDEMChsa-mir-14223619912
hsa-let-7adbDEMC and miR2Diseasehsa-mir-1dbDEMC and miR2Disease
hsa-mir-19bdbDEMC and miR2Diseasehsa-mir-133adbDEMC and miR2Disease
hsa-mir-15adbDEMChsa-mir-192dbDEMC and miR2Disease
hsa-mir-18adbDEMC and miR2Diseasehsa-mir-15026455323
hsa-mir-200bdbDEMChsa-mir-203dbDEMC and miR2Disease
hsa-mir-19adbDEMC and miR2Diseasehsa-mir-451a25484364
hsa-let-7bdbDEMC and miR2Diseasehsa-let-7gdbDEMC and miR2Disease
hsa-mir-24miR2Diseasehsa-mir-124dbDEMC
hsa-mir-199aunconfirmedhsa-mir-224dbDEMC and miR2Disease
hsa-mir-200cdbDEMC and miR2Diseasehsa-mir-146b28466779
Table 5. The potential top 50 predicted miRNAs related to gastric neoplasms obtained by WINMDA based on known associations in the HMDD database.
Top 1–25
miRNAs
EvidenceTop 26–50
miRNAs
Evidence
hsa-mir-146b26673617hsa-mir-20a29450946
hsa-mir-130a25834316hsa-mir-37521343377
hsa-mir-21miR2Diseasehsa-mir-1730024601
hsa-mir-146a28922434hsa-mir-222miR2Disease
hsa-mir-15526950485hsa-mir-10128944848
hsa-mir-145miR2Diseasehsa-mir-199a24655788
hsa-mir-143miR2Diseasehsa-mir-2228482669
hsa-mir-200a25740983hsa-mir-196a24527072
hsa-mir-200b25740983hsa-mir-22322270966
hsa-mir-12626464628hsa-mir-726261179
hsa-mir-200c27766962hsa-mir-34c18803879
hsa-let-7amiR2Diseasehsa-mir-12229509059
hsa-mir-141miR2Diseasehsa-mir-21827696291
hsa-mir-34a25834316hsa-mir-34bunconfirmed
hsa-mir-14221343377hsa-mir-10b25190020
hsa-mir-3119598010hsa-mir-103a29754469
hsa-mir-16miR2Diseasehsa-mir-27amiR2Disease
hsa-mir-19224981590hsa-mir-15020067763
hsa-mir-48626895105hsa-mir-18a26950485
hsa-mir-221miR2Diseasehsa-mir-19a22802949
hsa-mir-107miR2Diseasehsa-mir-106amiR2Disease
hsa-let-7f21533124hsa-mir-928418879
hsa-let-7g25972194hsa-mir-451aunconfirmed
hsa-mir-133b23296701hsa-mir-12427041578
hsa-mir-125b24846940hsa-mir-125874496
Table 6. The potential top 50 predicted miRNAs related to prostate neoplasms obtained by WINMDA based on known associations in the HMDD database.
Top 1–25
miRNAs
EvidenceTop 26–50
miRNAs
Evidence
hsa-mir-143dbDEMC and miR2Diseasehsa-mir-15adbDEMC and miR2Disease
hsa-mir-182dbDEMC and miR2Diseasehsa-mir-181bdbDEMC and miR2Disease
hsa-mir-96dbDEMC and miR2Diseasehsa-mir-375dbDEMC and miR2Disease
hsa-mir-34adbDEMC and miR2Diseasehsa-mir-200adbDEMC
hsa-mir-210miR2Diseasehsa-mir-34bdbDEMC
hsa-mir-150dbDEMChsa-mir-34cdbDEMC
hsa-mir-92aUnconfirmedhsa-let-7bdbDEMC and miR2Disease
hsa-mir-141miR2Diseasehsa-mir-218dbDEMC and miR2Disease
hsa-mir-21dbDEMC and miR2Diseasehsa-mir-101dbDEMC and miR2Disease
hsa-mir-222dbDEMC and miR2Diseasehsa-mir-124dbDEMC
hsa-mir-31dbDEMC and miR2Diseasehsa-mir-223dbDEMC and miR2Disease
hsa-mir-146b25712341hsa-let-7adbDEMC and miR2Disease
hsa-mir-221dbDEMC and miR2Diseasehsa-mir-224dbDEMC and miR2Disease
hsa-mir-20326499781hsa-mir-205dbDEMC and miR2Disease
hsa-mir-126dbDEMC and miR2Diseasehsa-let-7ddbDEMC and miR2Disease
hsa-mir-200bUnconfirmedhsa-mir-1dbDEMC
hsa-mir-200cdbDEMChsa-let-7cdbDEMC and miR2Disease
hsa-mir-146amiR2Diseasehsa-mir-127dbDEMC and miR2Disease
hsa-mir-17miR2Diseasehsa-mir-135bdbDEMC
hsa-mir-100dbDEMC and miR2Diseasehsa-mir-214dbDEMC and miR2Disease
hsa-mir-16dbDEMC and miR2Diseasehsa-mir-9326124181
hsa-mir-199adbDEMC and miR2Diseasehsa-mir-70822552290
hsa-mir-20amiR2Diseasehsa-mir-155dbDEMC
hsa-mir-133bdbDEMChsa-mir-133adbDEMC
hsa-mir-27bdbDEMC and miR2Diseasehsa-mir-195dbDEMC and miR2Disease
Table 7. Effects of w on the prediction performance of WINMDA when T = 16.
DiseaseWINMDABNPMDAPBMDAWBSMDARLSMDA
Breast neoplasms4448463642
Colon neoplasms4745474546
Gastric neoplasms4843464344
Kidney neoplasms4543424245
Liver neoplasms4845454646
Prostate neoplasms4844454244

