Tenogenic Properties of Mesenchymal Progenitor Cells Are Compromised in an Inflammatory Environment


Abstract
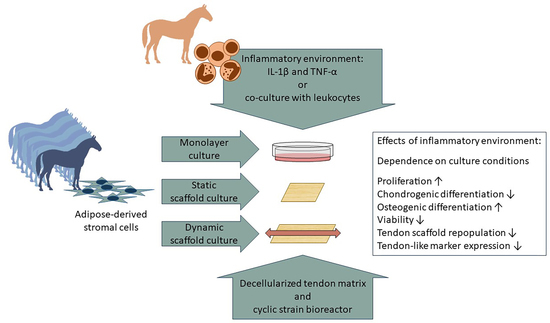
1. Introduction
2. Results
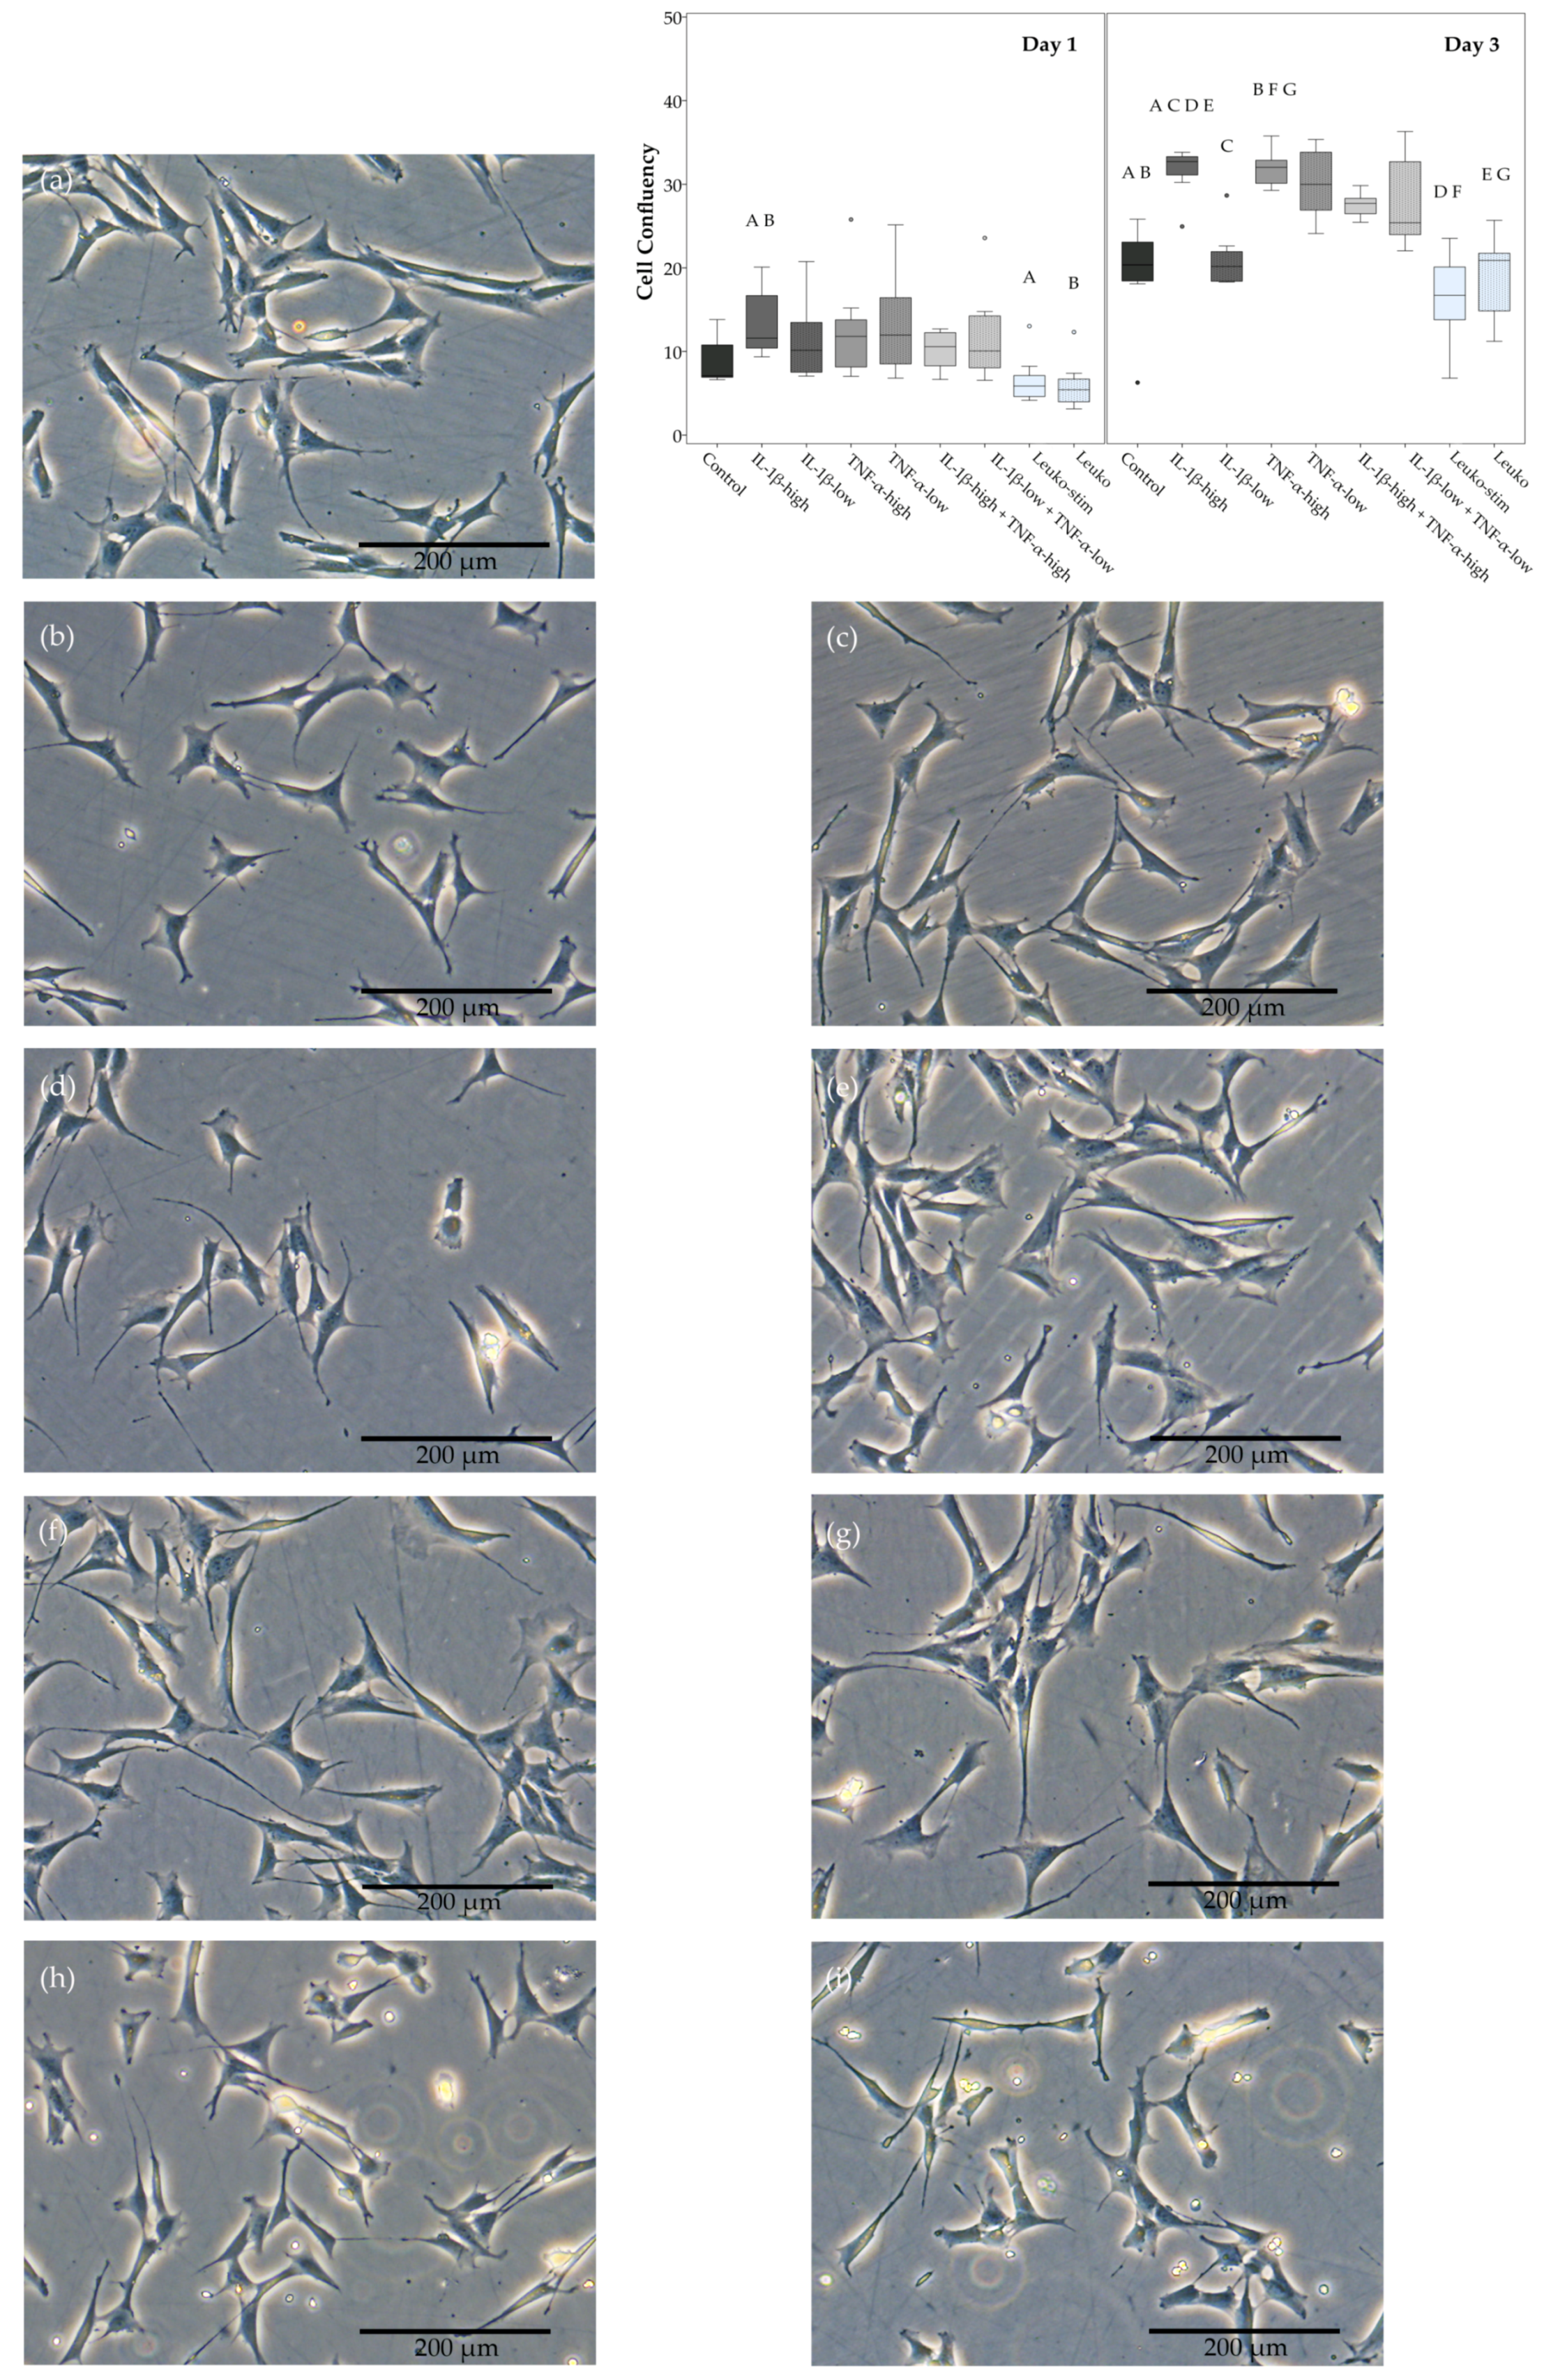
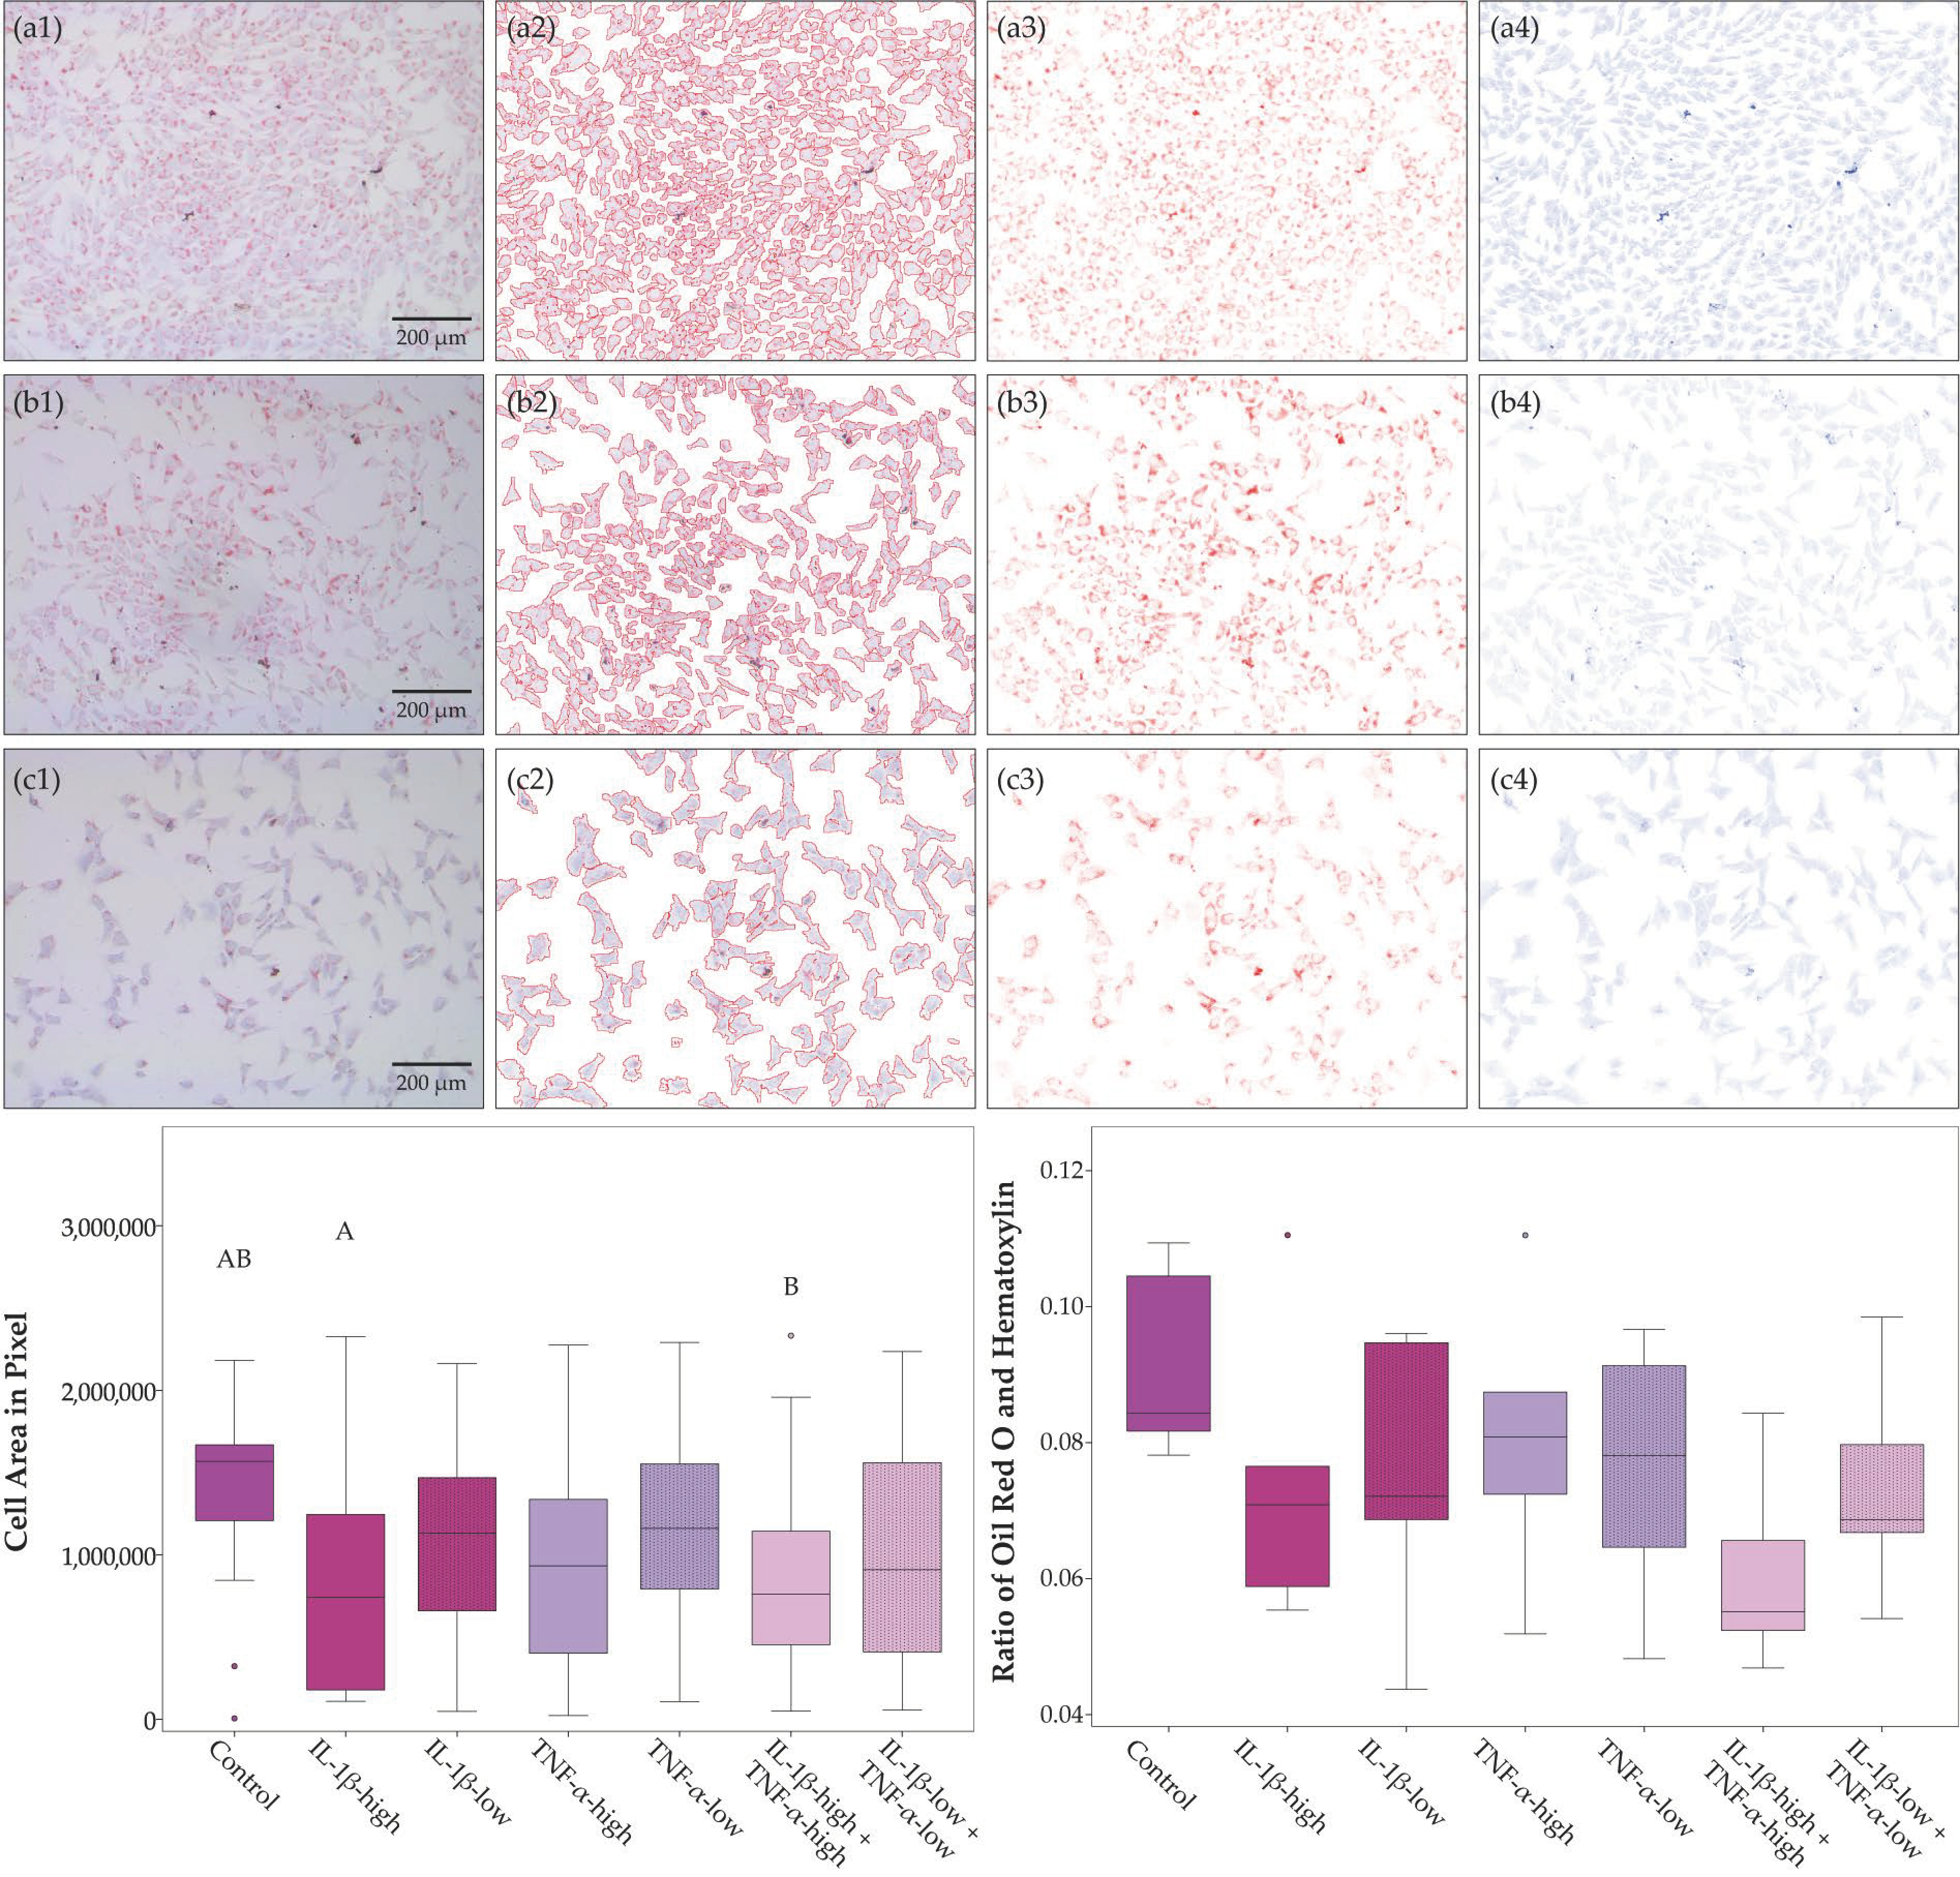
2.1. Cell Morphology, Proliferation, and Trilineage Differentiation
2.2. Cell Viability
2.3. Musculoskeletal Marker Expression
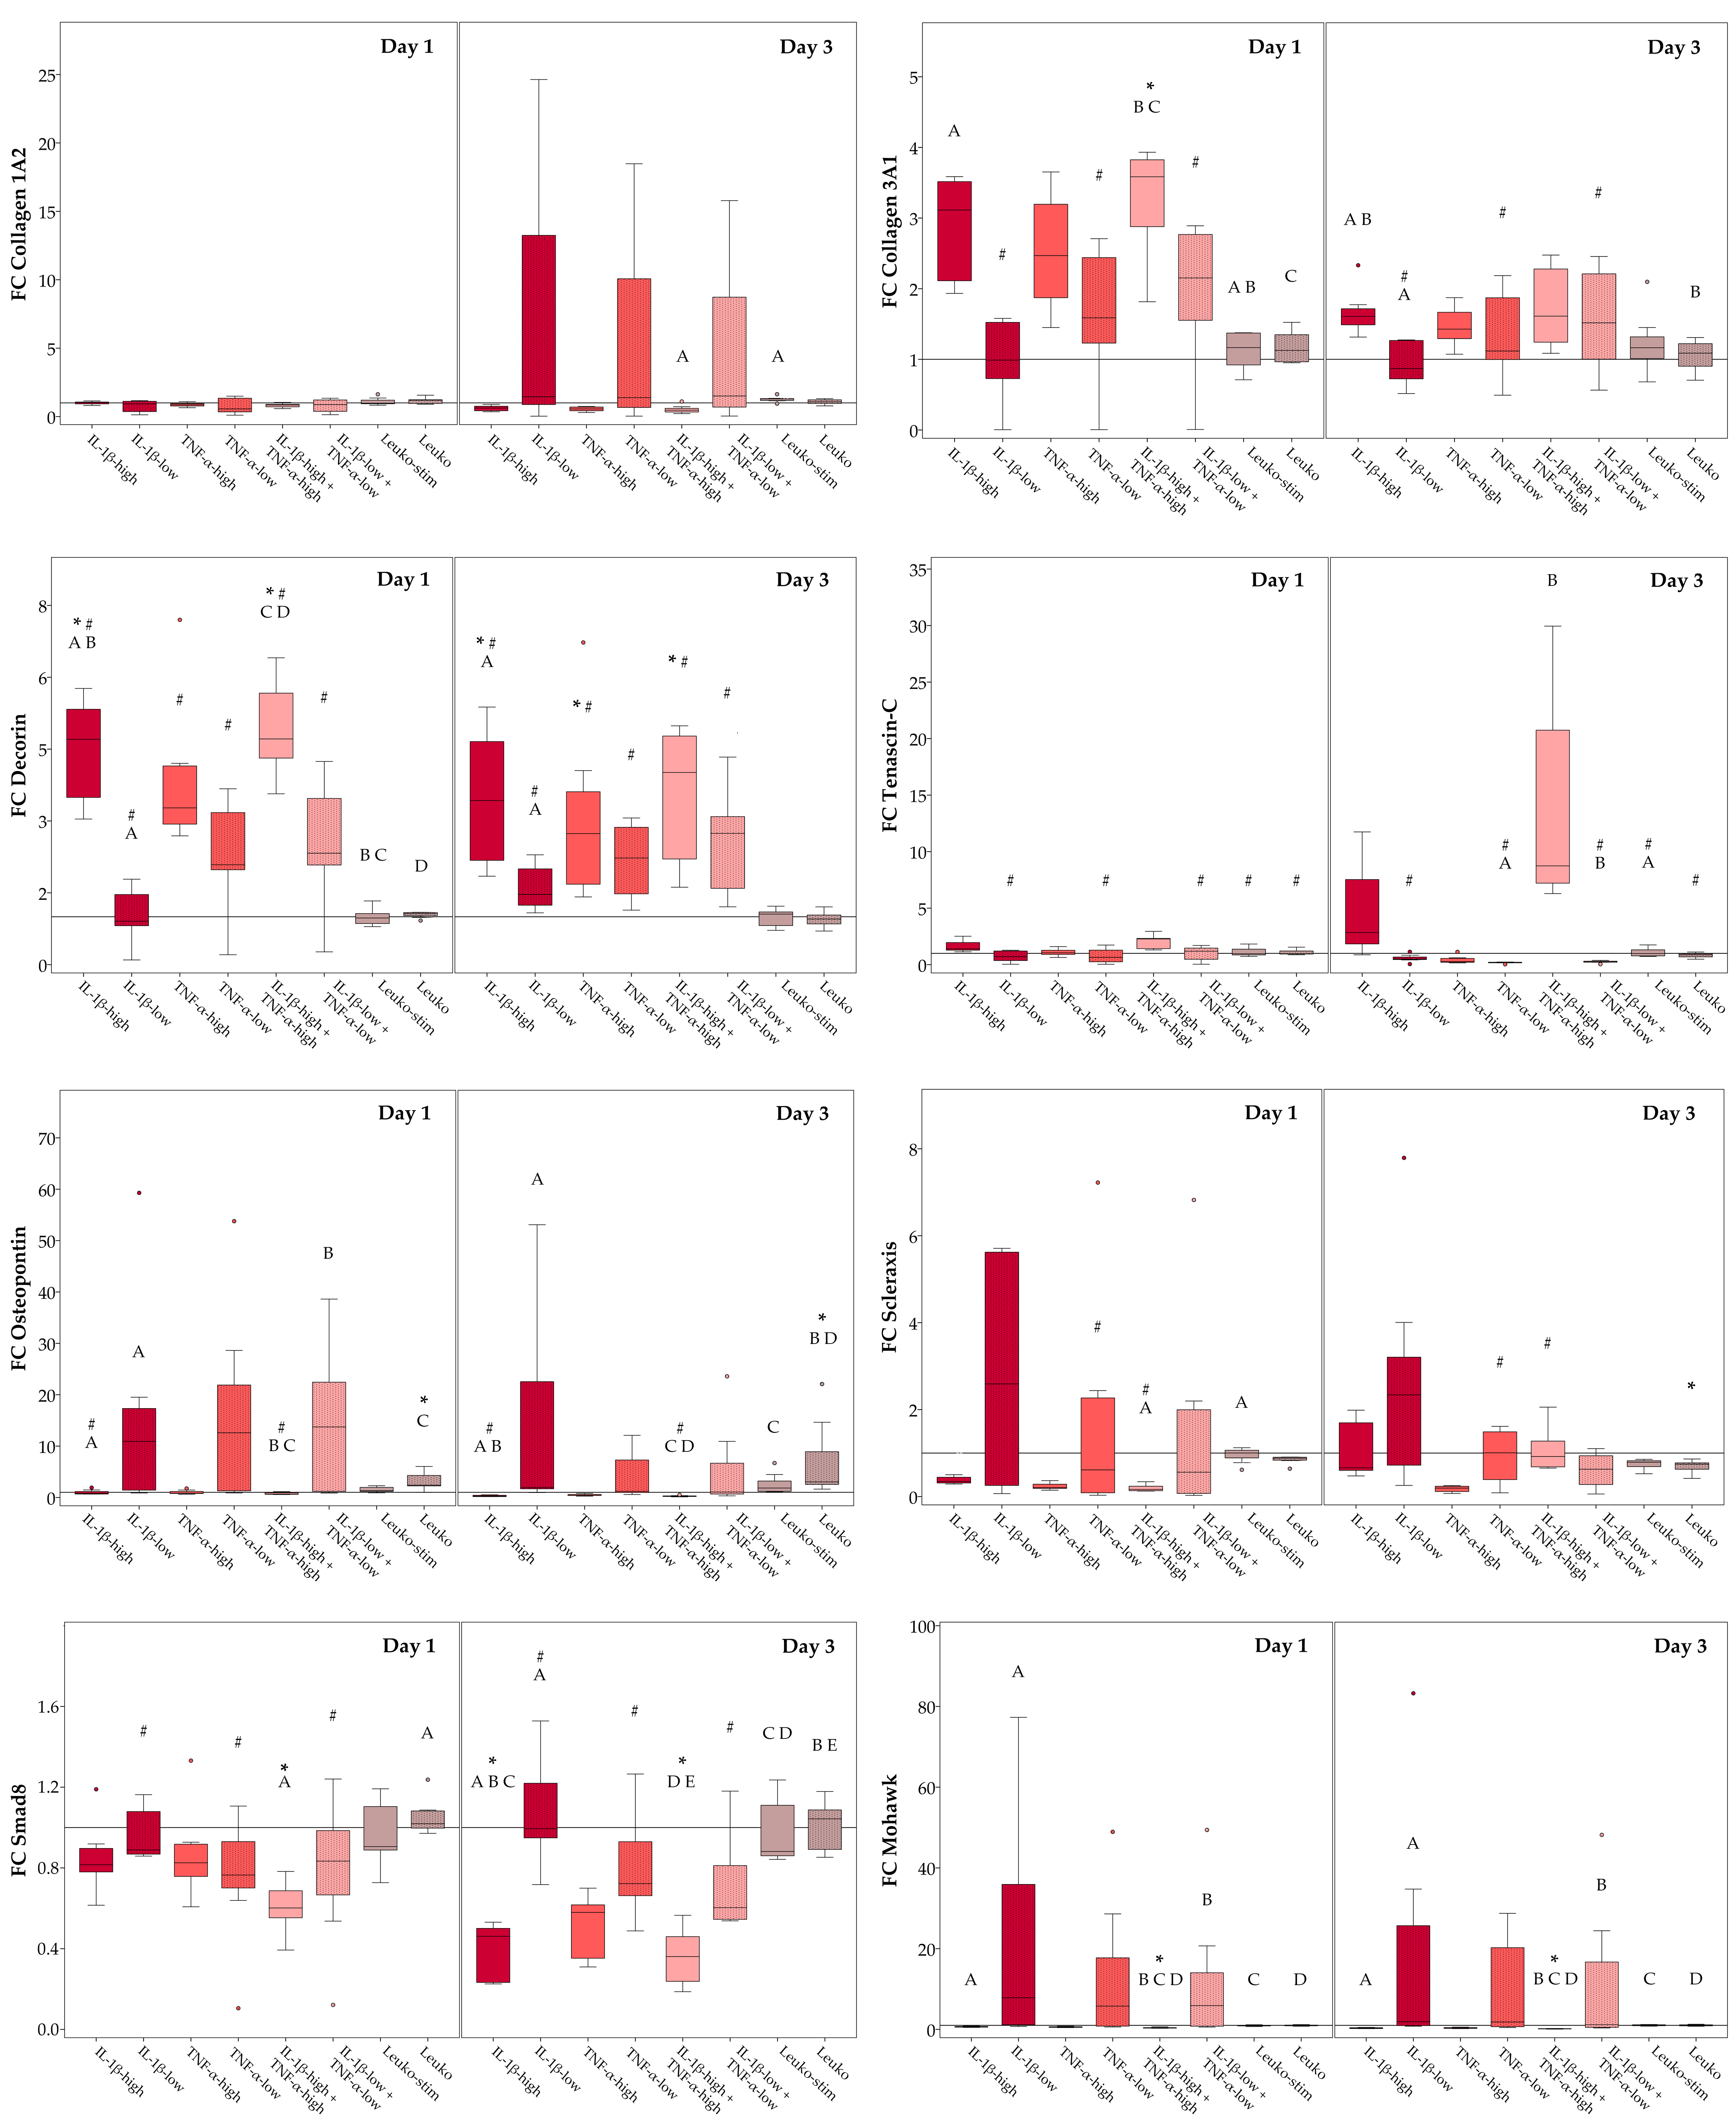
2.3.1. Monolayer Cultures
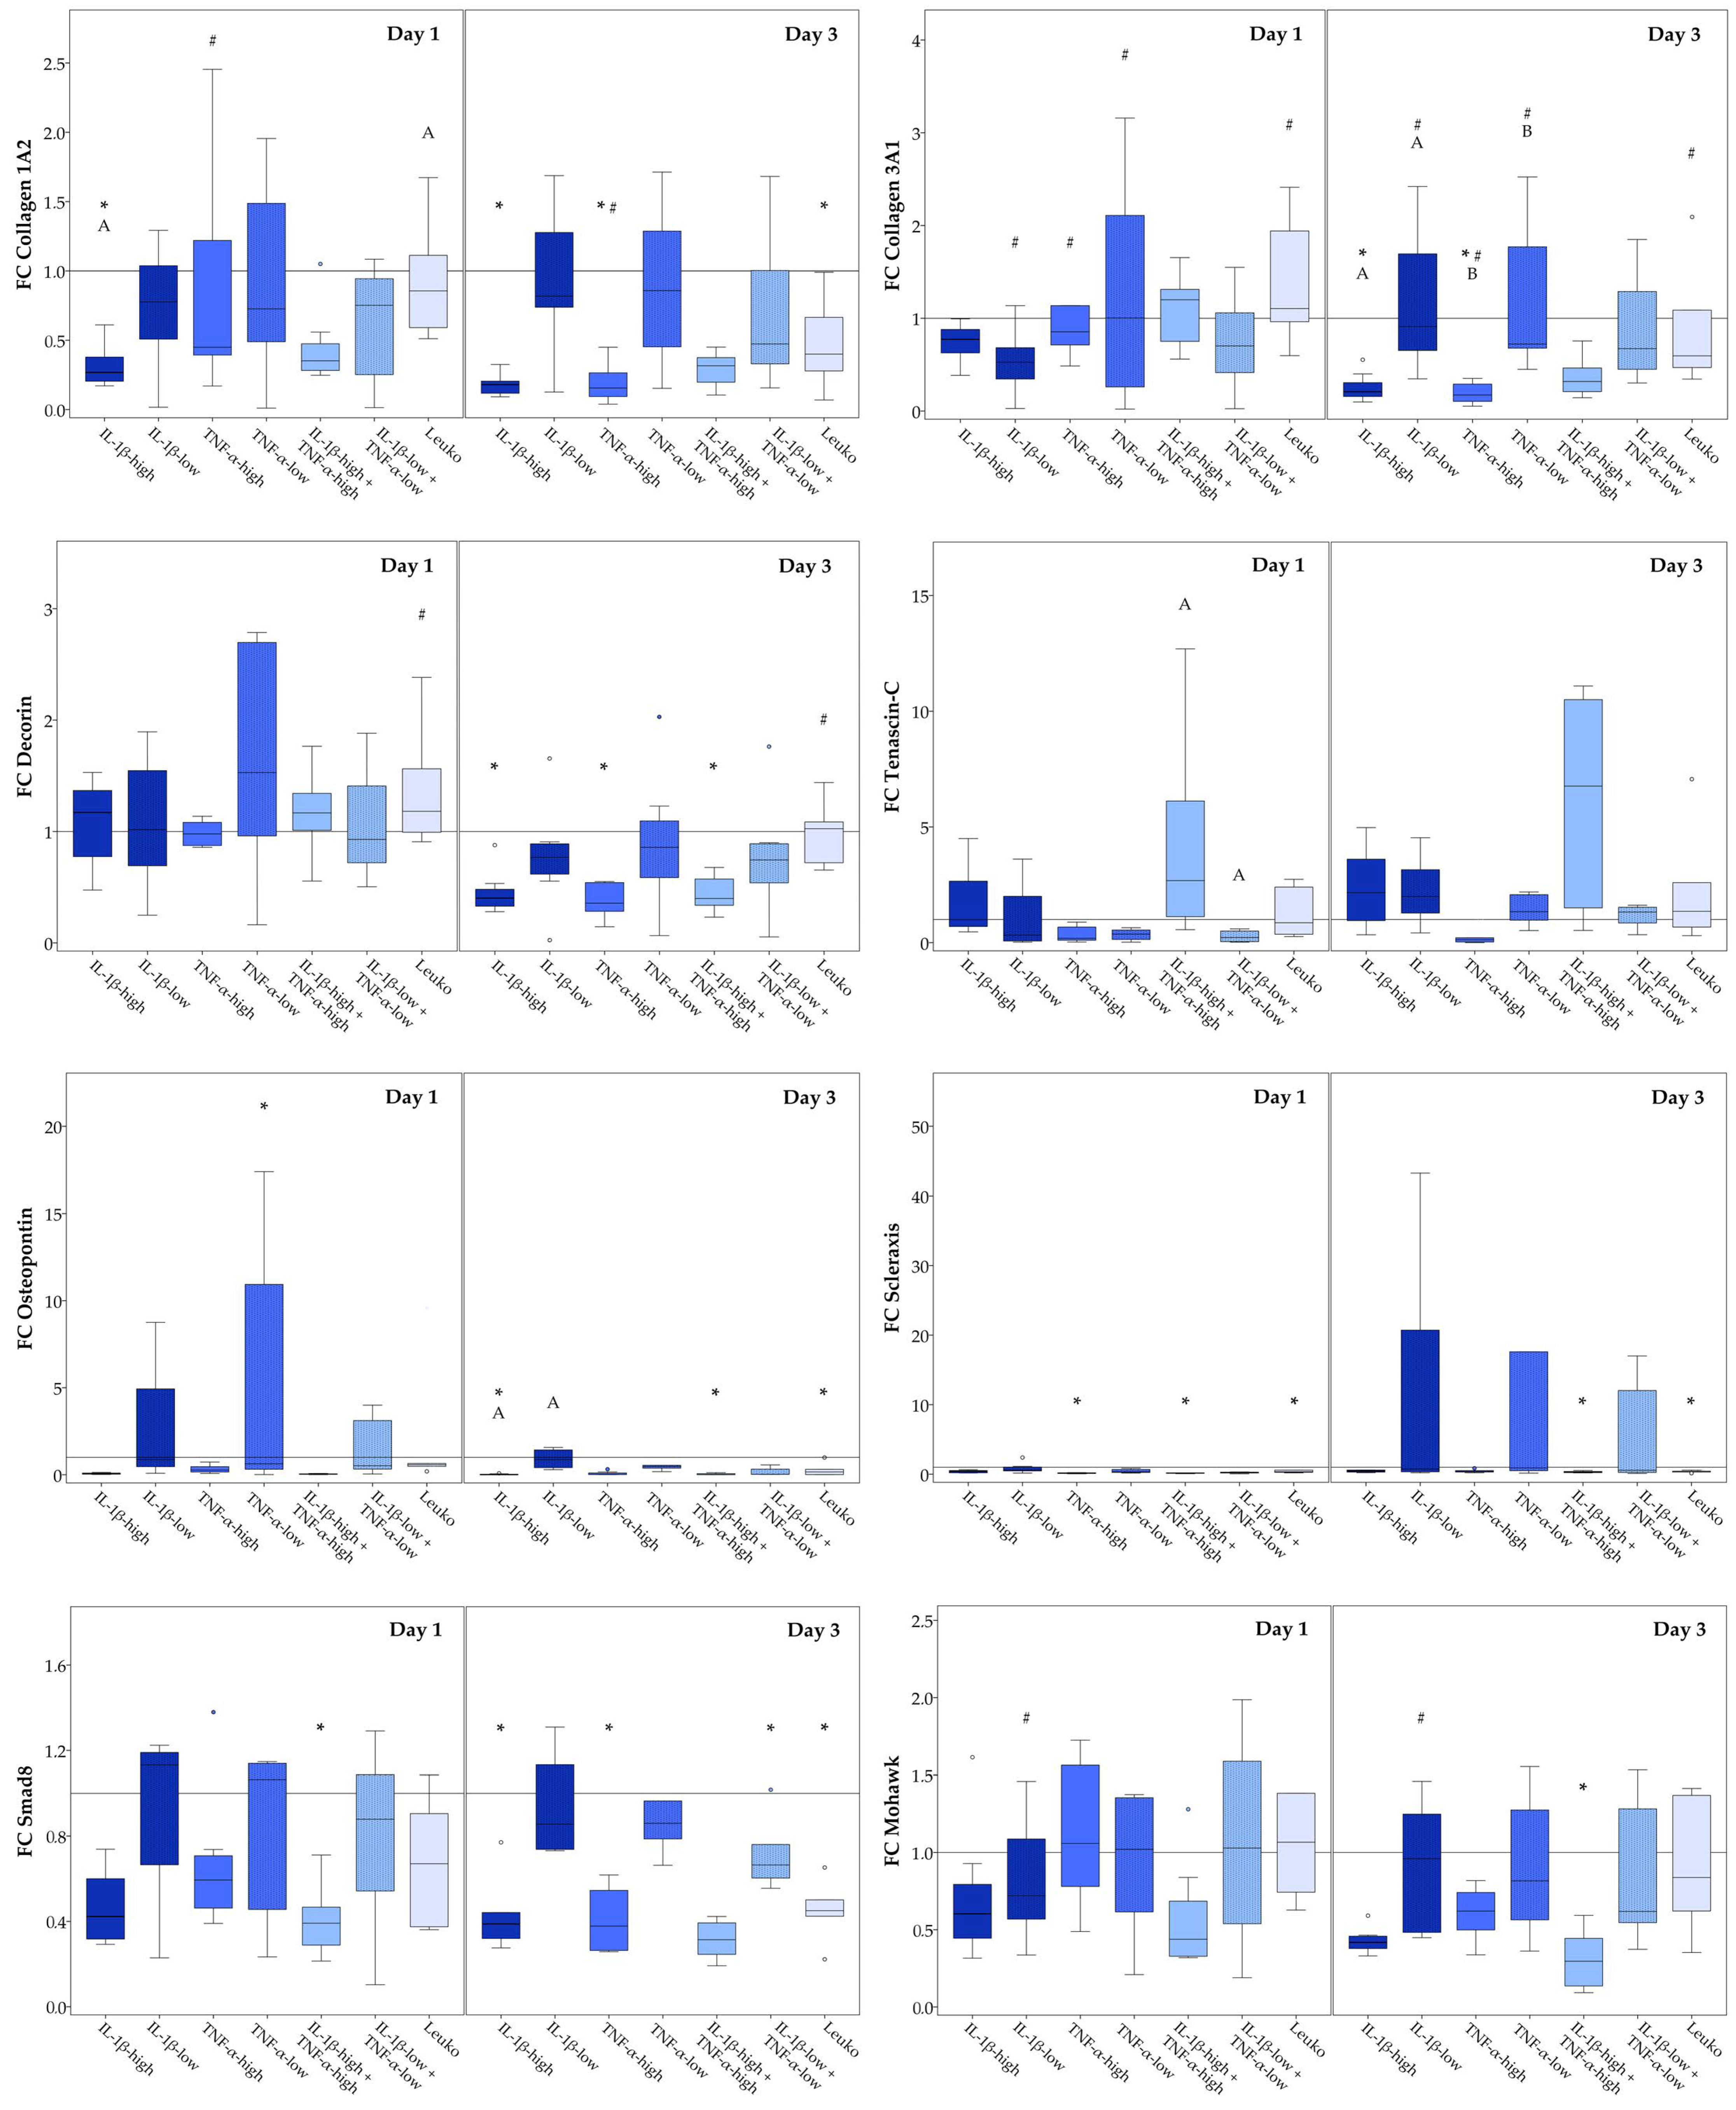
2.3.2. Static Scaffold Cultures
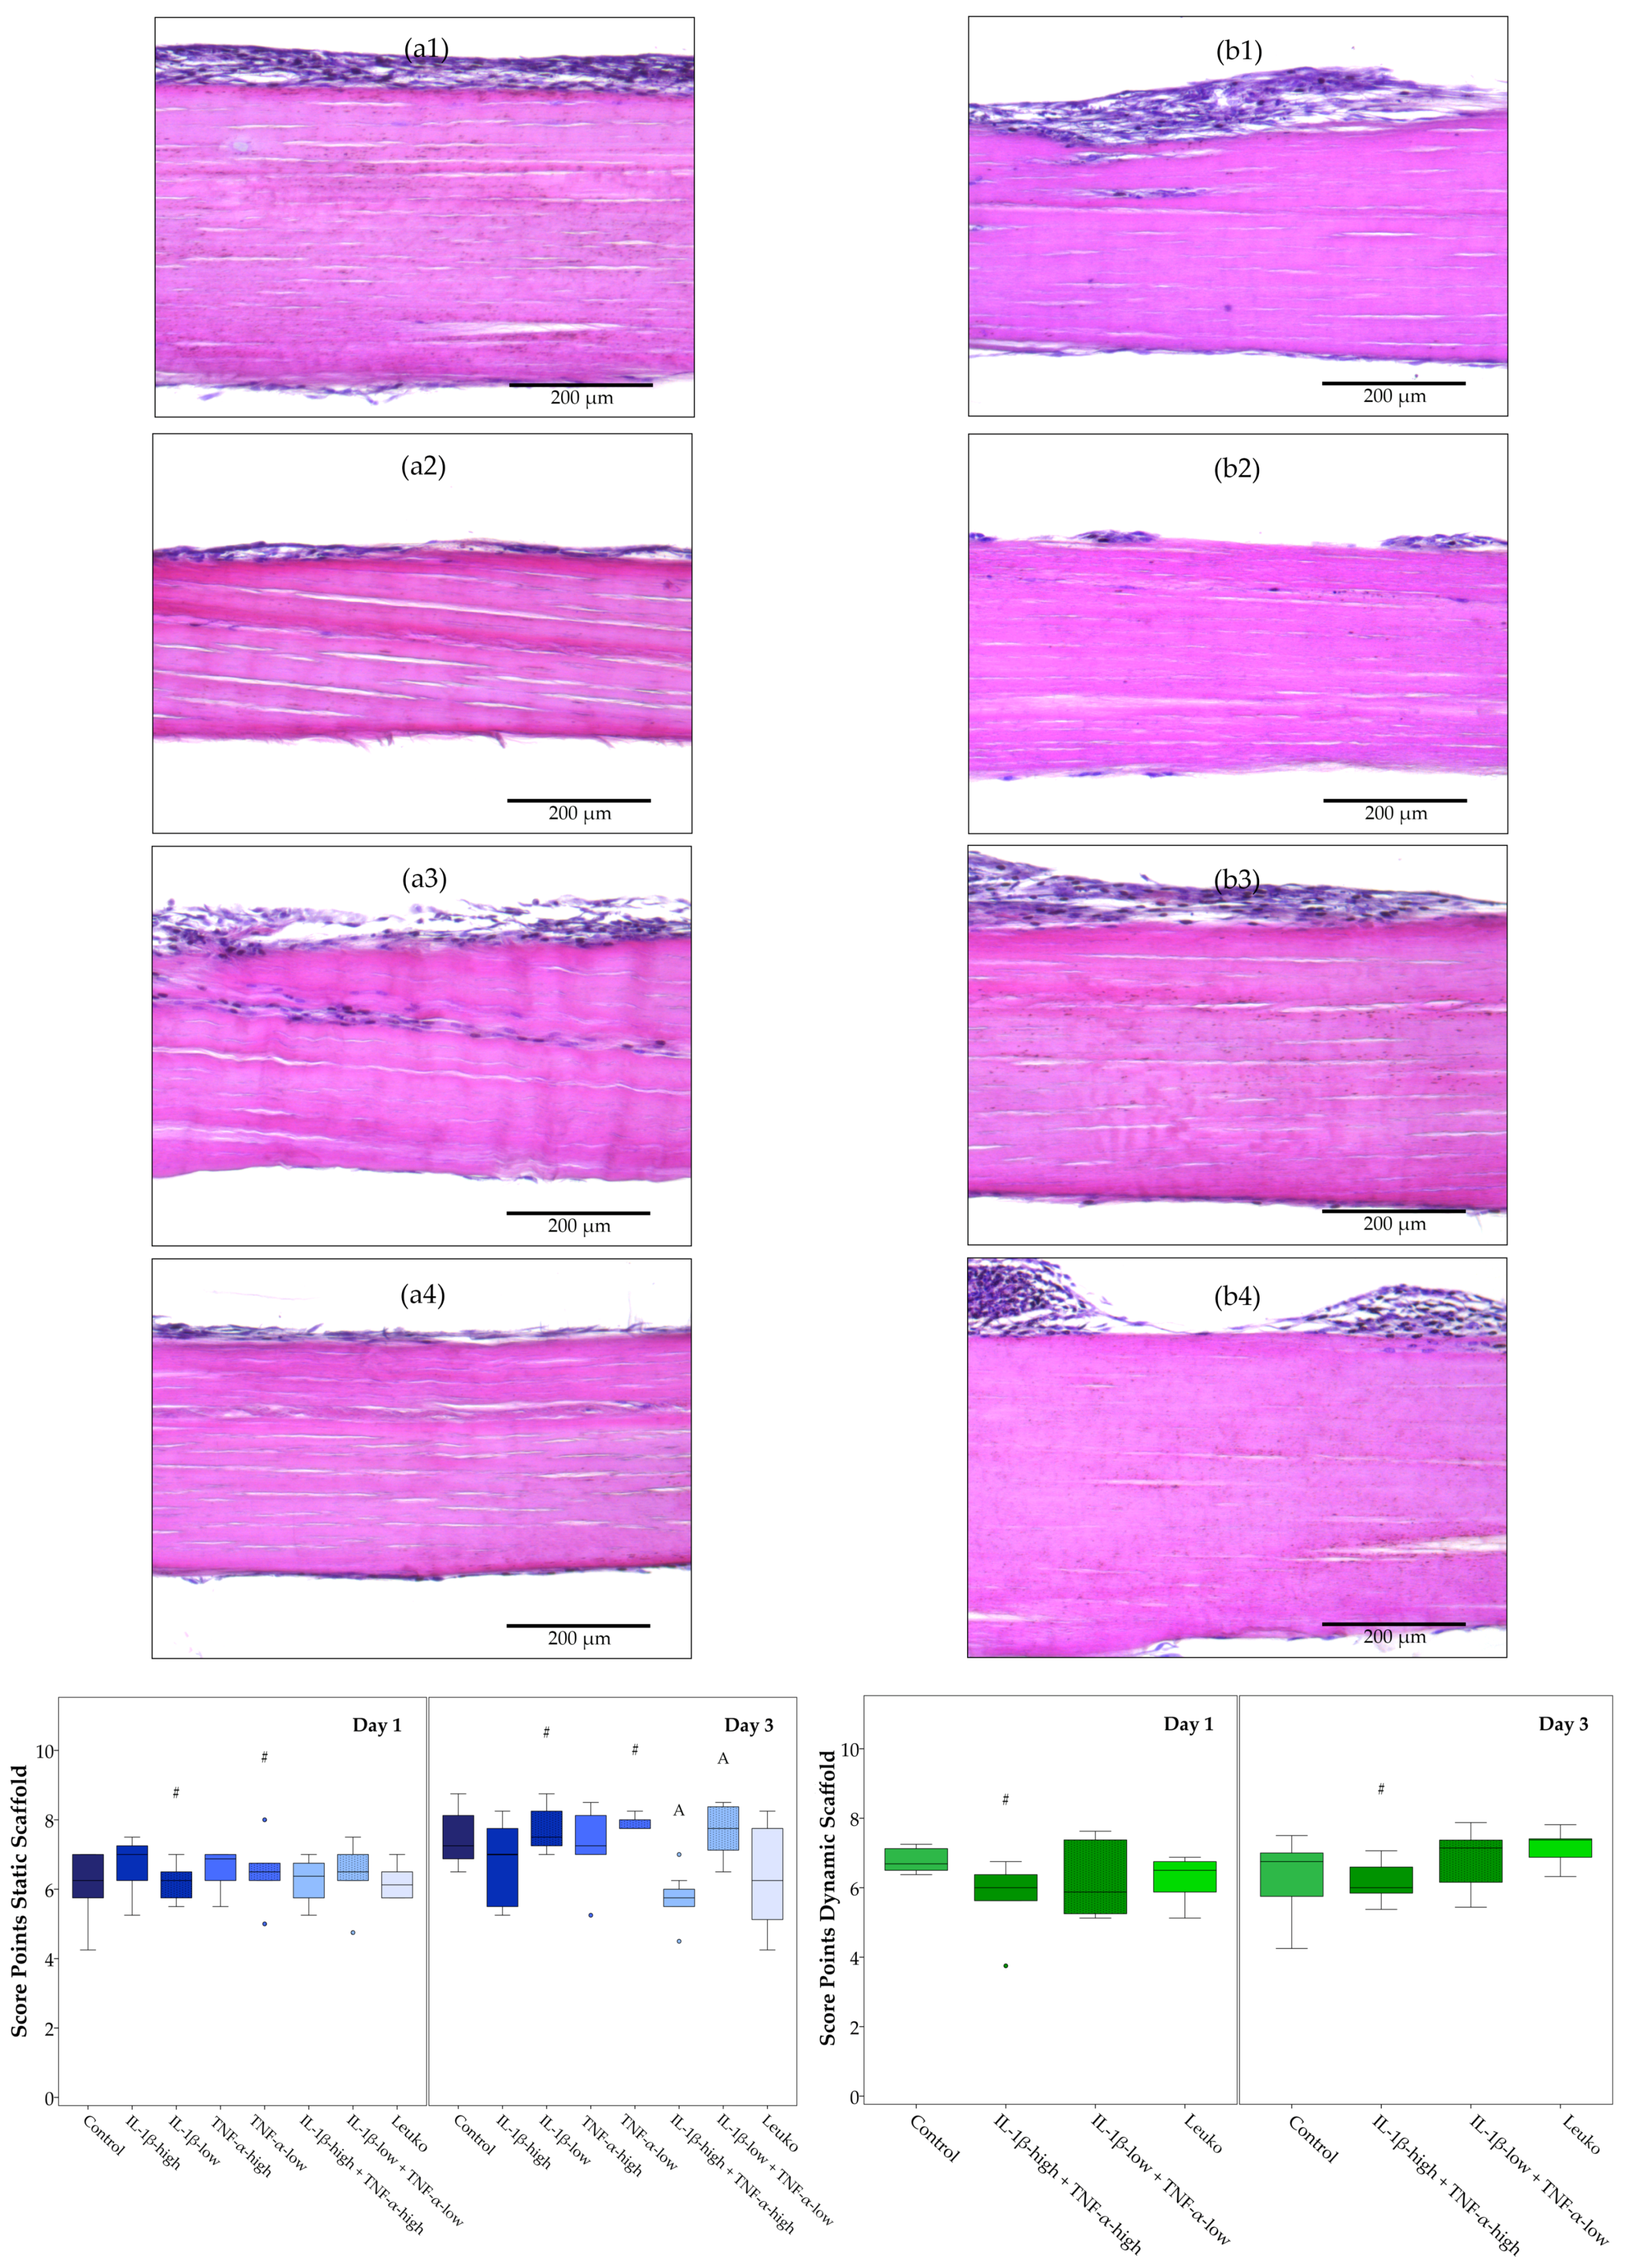
2.3.3. Dynamic Scaffold Cultures
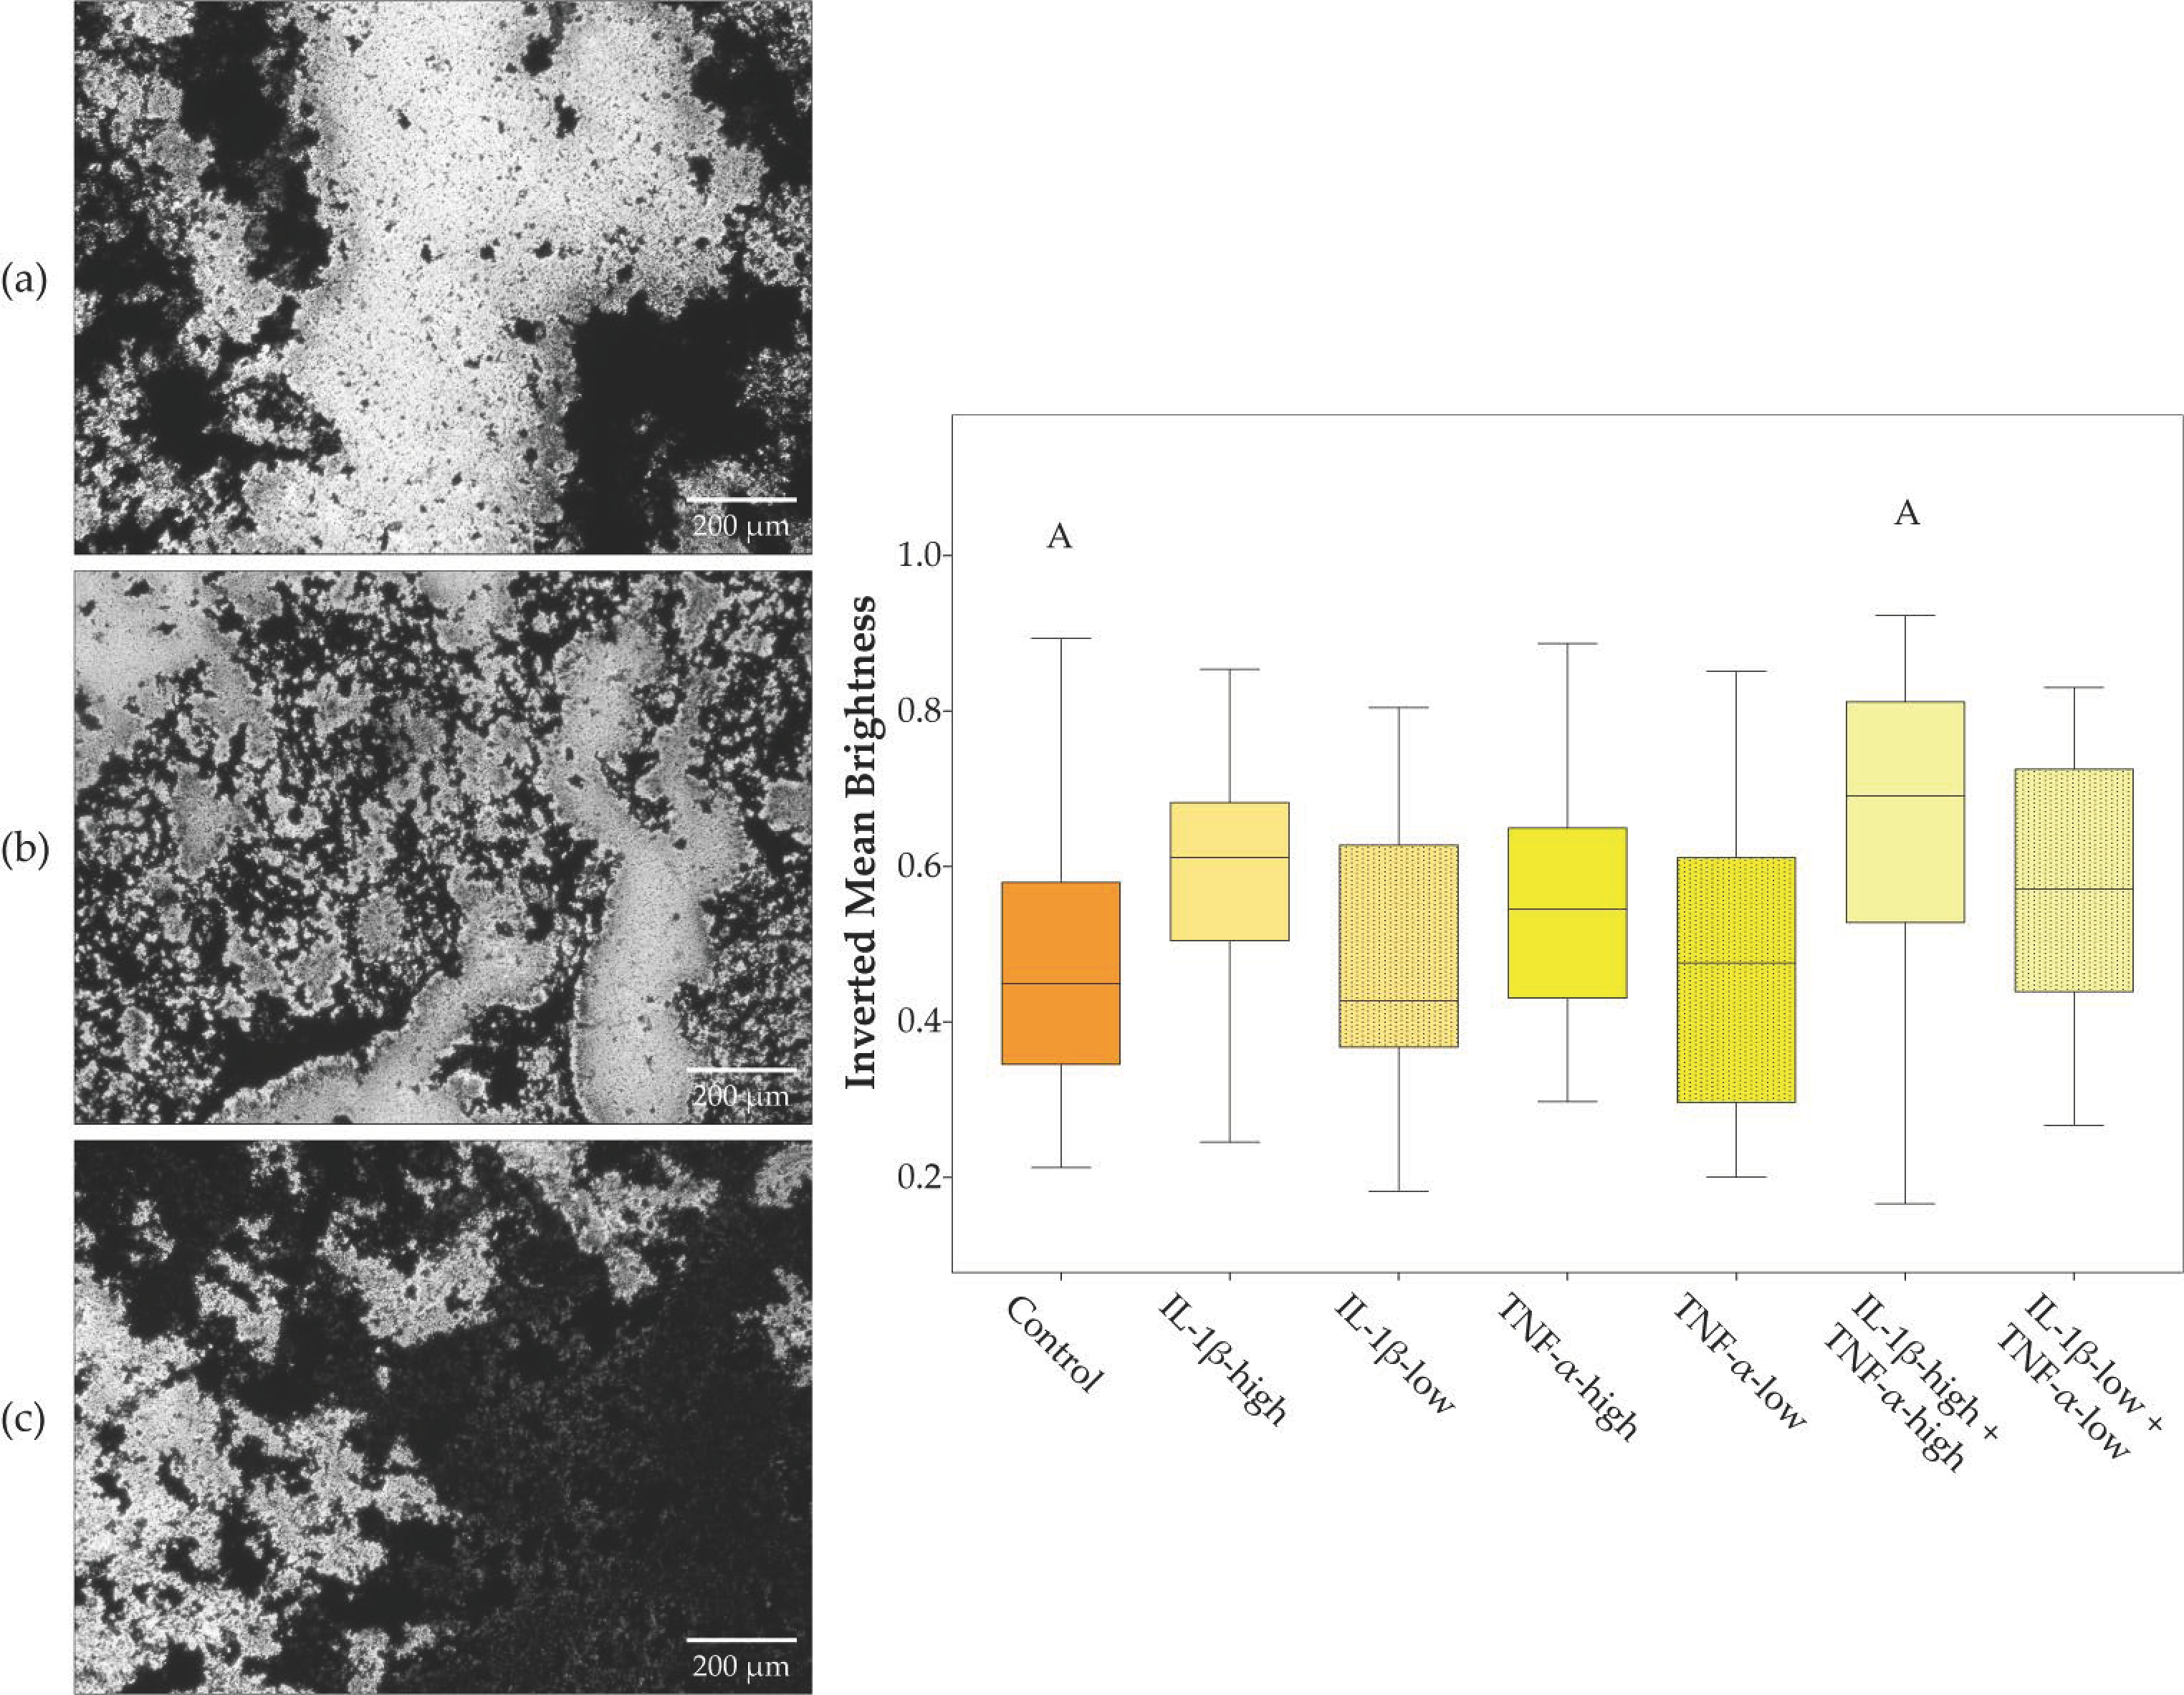
2.4. ASC Alignment on Tendon Scaffolds and Scaffold Repopulation
3. Discussion
4. Materials and Methods
4.1. ASC Recovery and Characterization
4.2. Preparation and Seeding of Tendon Scaffolds
4.3. Dynamic Culture of Tendon Constructs in the Cyclic Strain Bioreactor
4.4. Leukocyte Recovery and Inflammatory Culture Conditions
4.5. Viability Staining and Histology
4.6. Image Analysis
4.6.1. Background Illumination Correction
4.6.2. Color Deconvolution
4.6.3. Analysis of Adipogenic Differentiation
4.6.4. Analysis of Chondrogenic Differentiation
4.6.5. Analysis of Osteogenic Differentiation
4.6.6. Analysis of Unstained Phase Contrast Images
4.6.7. Analysis of LIVE/DEAD
4.7. Real-Time RT-PCR
4.8. Statistical Analysis
Supplementary Materials
Author Contributions
Funding
Acknowledgments
Conflicts of Interest
Abbreviations
| ASC | Adipose-derived stromal cells |
| FC | Fold change |
| IL | Interleukin |
| Leuko | Leukocytes |
| Leuko-stim | Leukocytes stimulated with concanavalin A |
| MSC | Multipotent mesenchymal stromal cells |
| RT-PCR | Reverse transcription polymerase chain reaction |
| TGF | Transforming growth factor |
| TNF | Tumor necrosis factor |
References
- Anderson, J.A.; Little, D.; Toth, A.P.; Moorman, C.T.; Tucker, B.S.; Ciccotti, M.G.; Guilak, F. Stem cell therapies for knee cartilage repair: The current status of preclinical and clinical studies. Am. J. Sports Med. 2014, 42, 2253–2261. [Google Scholar] [CrossRef] [PubMed]
- Lui, P.P.Y. Stem cell technology for tendon regeneration: Current status, challenges, and future research directions. Stem Cells Cloning 2015, 8, 163–174. [Google Scholar] [CrossRef] [PubMed]
- Liu, L.; Hindieh, J.; Leong, D.J.; Sun, H.B. Advances of stem cell based-therapeutic approaches for tendon repair. J. Orthop. Translat. 2017, 9, 69–75. [Google Scholar] [CrossRef] [PubMed]
- Patruno, M.; Martinello, T. Treatments of the injured tendon in Veterinary Medicine: From scaffolds to adult stem cells. Histol. Histopathol. 2014, 29, 417–422. [Google Scholar] [PubMed]
- Smith, R.K.; Korda, M.; Blunn, G.W.; Goodship, A.E. Isolation and implantation of autologous equine mesenchymal stem cells from bone marrow into the superficial digital flexor tendon as a potential novel treatment. Equine Vet. J. 2003, 35, 99–102. [Google Scholar] [CrossRef] [PubMed]
- Patterson-Kane, J.C.; Becker, D.L.; Rich, T. The pathogenesis of tendon microdamage in athletes: The horse as a natural model for basic cellular research. J. Comp. Pathol. 2012, 147, 227–287. [Google Scholar] [CrossRef] [PubMed]
- Hillmann, A.; Ahrberg, A.B.; Brehm, W.; Heller, S.; Josten, C.; Paebst, F.; Burk, J. Comparative Characterization of Human and Equine Mesenchymal Stromal Cells: A Basis for Translational Studies in the Equine Model. Cell Transplant. 2016, 25, 109–124. [Google Scholar] [CrossRef] [PubMed]
- Godwin, E.E.; Young, N.J.; Dudhia, J.; Beamish, I.C.; Smith, R.K. Implantation of bone marrow-derived mesenchymal stem cells demonstrates improved outcome in horses with overstrain injury of the superficial digital flexor tendon. Equine Vet. J. 2012, 44, 25–32. [Google Scholar] [CrossRef] [PubMed]
- Pacini, S.; Spinabella, S.; Trombi, L.; Fazzi, R.; Galimberti, S.; Dini, F.; Carlucci, F.; Petrini, M. Suspension of bone marrow-derived undifferentiated mesenchymal stromal cells for repair of superficial digital flexor tendon in race horses. Tissue Eng. 2007, 13, 2949–2955. [Google Scholar] [CrossRef] [PubMed]
- Smith, R.K.; Werling, N.J.; Dakin, S.G.; Alam, R.; Goodship, A.E.; Dudhia, J. Beneficial effects of autologous bone marrow-derived mesenchymal stem cells in naturally occurring tendinopathy. PLoS ONE 2013, 8, e75697. [Google Scholar] [CrossRef]
- Shearn, J.T.; Kinneberg, K.R.; Dyment, N.A.; Galloway, M.T.; Kenter, K.; Wylie, C.; Butler, D.L. Tendon tissue engineering: Progress, challenges, and translation to the clinic. J. Musculoskelet. Neuronal Interact. 2011, 11, 163–173. [Google Scholar] [PubMed]
- Chong, A.K.; Chang, J.; Go, J.C. Mesenchymal stem cells and tendon healing. Front Biosci. 2009, 14, 4598–4605. [Google Scholar] [CrossRef]
- Andia, I.; Maffulli, N. Biological Therapies in Regenerative Sports Medicine. Sports Med. 2017, 47, 807–828. [Google Scholar] [CrossRef] [PubMed]
- Kavanagh, D.P.J.; Robinson, J.; Kalia, N. Mesenchymal stem cell priming: Fine-tuning adhesion and function. Stem Cell Rev. 2014, 10, 587–599. [Google Scholar] [CrossRef] [PubMed]
- Najar, M.; Krayem, M.; Merimi, M.; Burny, A.; Meuleman, N.; Bron, D.; Raicevic, G.; Lagneaux, L. Insights into inflammatory priming of mesenchymal stromal cells: Functional biological impacts. Inflamm. Res. 2018, 67, 467–477. [Google Scholar] [CrossRef] [PubMed]
- Dakin, S.G.; Dudhia, J.; Smith, R.K. Resolving an inflammatory concept: The importance of inflammation and resolution in tendinopathy. Vet. Immunol. Immunopathol. 2014, 158, 121–127. [Google Scholar] [CrossRef] [PubMed]
- Docheva, D.; Müller, S.A.; Majewski, M.; Evans, C.H. Biologics for tendon repair. Adv. Drug Deliv. Rev. 2015, 84, 222–239. [Google Scholar] [CrossRef] [PubMed]
- Berner, D.; Brehm, W.; Gerlach, K.; Gittel, C.; Offhaus, J.; Paebst, F.; Scharner, D.; Burk, J. Longitudinal Cell Tracking and Simultaneous Monitoring of Tissue Regeneration after Cell Treatment of Natural Tendon Disease by Low-Field Magnetic Resonance Imaging. Stem Cells Int. 2016, 2016, 1207190. [Google Scholar] [CrossRef] [PubMed]
- Burk, J.; Berner, D.; Brehm, W.; Hillmann, A.; Horstmeier, C.; Josten, C.; Paebst, F.; Rossi, G.; Schubert, S.; Ahrberg, A.B. Long-Term Cell Tracking following Local Injection of Mesenchymal Stromal Cells in the Equine Model of Induced Tendon Disease. Cell Transplant. 2016, 25, 2199–2211. [Google Scholar] [CrossRef] [PubMed]
- Geburek, F.; Mundle, K.; Conrad, S.; Hellige, M.; Walliser, U.; van Schie, H.T.; van, W.R.; Skutella, T.; Stadler, P.M. Tracking of autologous adipose tissue-derived mesenchymal stromal cells with in vivo magnetic resonance imaging and histology after intralesional treatment of artificial equine tendon lesions-a pilot study. Stem Cell Res. Ther. 2016, 7, 21. [Google Scholar] [CrossRef] [PubMed]
- Dudhia, J.; Becerra, P.; Valdés, M.A.; Neves, F.; Hartman, N.G.; Smith, R.K. In Vivo Imaging and Tracking of Technetium-99m Labeled Bone Marrow Mesenchymal Stem Cells in Equine Tendinopathy. J. Vis. Exp. 2015, 106, e52748. [Google Scholar] [CrossRef] [PubMed]
- Burk, J.; Plenge, A.; Brehm, W.; Heller, S.; Pfeiffer, B.; Kasper, C. Induction of Tenogenic Differentiation Mediated by Extracellular Tendon Matrix and Short-Term Cyclic Stretching. Stem Cells Int. 2016, 2016, 7342379. [Google Scholar] [CrossRef] [PubMed]
- Youngstrom, D.W.; Rajpar, I.; Kaplan, D.L.; Barrett, J.G. A bioreactor system for in vitro tendon differentiation and tendon tissue engineering. J. Orthop. Res. 2015, 33, 911–918. [Google Scholar] [CrossRef] [PubMed]
- Youngstrom, D.W.; LaDow, J.E.; Barrett, J.G. Tenogenesis of bone marrow-, adipose-, and tendon-derived stem cells in a dynamic bioreactor. Connect. Tissue Res. 2016, 57, 454–465. [Google Scholar] [CrossRef] [PubMed]
- Martinello, T.; Bronzini, I.; Perazzi, A.; Testoni, S.; De Benedictis, G.M.; Negro, A.; Caporale, G.; Mascarello, F.; Iacopetti, I.; Patruno, M. Effects of in vivo applications of peripheral blood-derived mesenchymal stromal cells (PB-MSCs) and platlet-rich plasma (PRP) on experimentally injured deep digital flexor tendons of sheep. J. Orthop. Res. 2013, 31, 306–314. [Google Scholar] [CrossRef] [PubMed]
- Dakin, S.G.; Werling, D.; Hibbert, A.; Abayasekara, D.R.; Young, N.J.; Smith, R.K.; Dudhia, J. Macrophage Sub-Populations and the Lipoxin A(4) Receptor Implicate Active Inflammation during Equine Tendon Repair. PLoS ONE 2012, 7, e32333. [Google Scholar] [CrossRef] [PubMed]
- Hosaka, Y.; Kirisawa, R.; Yamamoto, E.; Ueda, H.; Iwai, H.; Takehana, K. Localization of cytokines in tendinocytes of the superficial digital flexor tendon in the horse. J. Vet. Med. Sci. 2002, 64, 945–947. [Google Scholar] [CrossRef] [PubMed]
- Hosaka, Y.; Teraoka, H.; Yamamoto, E.; Ueda, H.; Takehana, K. Mechanism of cell death in inflamed superficial digital flexor tendon in the horse. J. Comp. Pathol. 2005, 132, 51–58. [Google Scholar] [CrossRef] [PubMed]
- Al-Sadi, O.; Schulze-Tanzil, G.; Kohl, B.; Lohan, A.; Lemke, M.; Ertel, W.; John, T. Tenocytes, pro-inflammatory cytokines and leukocytes: A relationship? Muscles Ligaments Tendons J. 2011, 1, 68–76. [Google Scholar] [PubMed]
- Schulze-Tanzil, G.; Al-Sadi, O.; Wiegand, E.; Ertel, W.; Busch, C.; Kohl, B.; Pufe, T. The role of pro-inflammatory and immunoregulatory cytokines in tendon healing and rupture: New insights. Scand. J. Med. Sci. Sports 2011, 21, 337–351. [Google Scholar] [CrossRef] [PubMed]
- Burk, J.; Paebst, F.; Brehm, W.; Piehler, D.; Schubert, S.; Tarnok, A.; Hillmann, A. Context-sensitive immunomodulation by equine multipotent mesenchymal stromal cells in a novel co-culture assay. In Proceedings of the DVG Expert Group Physiology and Biochemistry, Vienna, Austria, 21–23 February 2018; p. V08. [Google Scholar]
- Cassano, J.M.; Schnabel, L.V.; Goodale, M.B.; Fortier, L.A. Inflammatory licensed equine MSCs are chondroprotective and exhibit enhanced immunomodulation in an inflammatory environment. Stem Cell Res. Ther. 2018, 9, 82. [Google Scholar] [CrossRef] [PubMed]
- Taylor, S.E.; Vaughan-Thomas, A.; Clements, D.N.; Pinchbeck, G.; Macrory, L.C.; Smith, R.K.; Clegg, P.D. Gene expression markers of tendon fibroblasts in normal and diseased tissue compared to monolayer and three dimensional culture systems. BMC Musculoskelet. Disord. 2009, 10, 27. [Google Scholar] [CrossRef] [PubMed]
- Abate, M.; Silbernagel, K.G.; Siljeholm, C.; Di Iorio, A.; De Amicis, D.; Salini, V.; Werner, S.; Paganelli, R. Pathogenesis of tendinopathies: Inflammation or degeneration? Arthritis Res. Ther. 2009, 11, 235. [Google Scholar] [CrossRef] [PubMed]
- Parkinson, J.; Samiric, T.; Ilic, M.Z.; Cook, J.; Handley, C.J. Involvement of proteoglycans in tendinopathy. J. Musculoskelet. Neuronal. Interact. 2011, 11, 86–93. [Google Scholar] [PubMed]
- Roth, S.P.; Schubert, S.; Scheibe, P.; Gross, C.; Brehm, W.; Burk, J. Growth factor-mediated tenogenic induction of multipotent Growth factor-mediated tenogenic induction of multipotent mesenchymal stromal cells is altered by the microenvironment of tendon matrix. Cell Transplant. 2018. submitted. [Google Scholar]
- Vallés, G.; Bensiamar, F.; Crespo, L.; Arruebo, M.; Vilaboa, N.; Saldaña, L. Topographical cues regulate the crosstalk between MSCs and macrophages. Biomaterials 2015, 37, 124–133. [Google Scholar] [CrossRef] [PubMed]
- Proctor, W.R.; Foster, A.J.; Vogt, J.; Summers, C.; Middleton, B.; Pilling, M.A.; Shienson, D.; Kijanska, M.; Ströbel, S.; Kelm, J.M.; et al. Utility of spherical human liver microtissues for prediction of clinical drug-induced liver injury. Arch. Toxicol. 2017, 91, 2849–2863. [Google Scholar] [CrossRef] [PubMed]
- Pourgholaminejad, A.; Aghdami, N.; Baharvand, H.; Moazzeni, S.M. The effect of pro-inflammatory cytokines on immunophenotype, differentiation capacity and immunomodulatory functions of human mesenchymal stem cells. Cytokine 2016, 85, 51–60. [Google Scholar] [CrossRef] [PubMed]
- Lu, Z.-Y.; Chen, W.-C.; Li, Y.-H.; Li, L.; Zhang, H.; Pang, Y.; Xiao, Z.-F.; Xiao, H.-W.; Xiao, Y. TNF-α enhances vascular cell adhesion molecule-1 expression in human bone marrow mesenchymal stem cells via the NF-κB, ERK and JNK signaling pathways. Mol. Med. Rep. 2016, 14, 643–648. [Google Scholar] [CrossRef] [PubMed]
- Jin, P.; Zhao, Y.; Liu, H.; Chen, J.; Ren, J.; Jin, J.; Bedognetti, D.; Liu, S.; Wang, E.; Marincola, F.; et al. Interferon-γ and Tumor Necrosis Factor-α Polarize Bone Marrow Stromal Cells Uniformly to a Th1 Phenotype. Sci. Rep. 2016, 6, 26345. [Google Scholar] [CrossRef] [PubMed]
- Zhang, K.; Asai, S.; Yu, B.; Enomoto-Iwamoto, M. IL-1beta irreversibly inhibits tenogenic differentiation and alters metabolism in injured tendon-derived progenitor cells in vitro. Biochem. Biophys. Res. Commun. 2015, 463, 667–672. [Google Scholar] [CrossRef] [PubMed]
- Gaida, J.E.; Alfredson, H.; Forsgren, S.; Cook, J.L. A pilot study on biomarkers for tendinopathy: Lower levels of serum TNF-α and other cytokines in females but not males with Achilles tendinopathy. BMC Sports Sci. Med. Rehabil. 2016, 8, 5. [Google Scholar] [CrossRef] [PubMed]
- Ackermann, P.W.; Domeij-Arverud, E.; Leclerc, P.; Amoudrouz, P.; Nader, G.A. Anti-inflammatory cytokine profile in early human tendon repair. Knee Surg. Sports Traumatol. Arthrosc. 2013, 21, 1801–1806. [Google Scholar] [CrossRef] [PubMed]
- Han, P.; Cui, Q.; Yang, S.; Wang, H.; Gao, P.; Li, Z. Tumor necrosis factor-α and transforming growth factor-β1 facilitate differentiation and proliferation of tendon-derived stem cells in vitro. Biotechnol. Lett. 2017, 39, 711–719. [Google Scholar] [CrossRef] [PubMed]
- Chen, S.; Deng, G.; Li, K.; Zheng, H.; Wang, G.; Yu, B.; Zhang, K. Interleukin-6 Promotes Proliferation but Inhibits Tenogenic Differentiation via the Janus Kinase/Signal Transducers and Activators of Transcription 3 (JAK/STAT3) Pathway in Tendon-Derived Stem Cells. Med. Sci. Monit. 2018, 24, 1567–1573. [Google Scholar] [CrossRef] [PubMed]
- Zhang, J.; Li, Z.-G.; Si, Y.-M.; Chen, B.; Meng, J. The difference on the osteogenic differentiation between periodontal ligament stem cells and bone marrow mesenchymal stem cells under inflammatory microenviroments. Differentiation 2014, 88, 97–105. [Google Scholar] [CrossRef] [PubMed]
- Ahrberg, A.B.; Horstmeier, C.; Berner, D.; Brehm, W.; Gittel, C.; Hillmann, A.; Josten, C.; Rossi, G.; Schubert, S.; Winter, K.; et al. Effects of mesenchymal stromal cells versus serum on tendon healing in a controlled experimental trial in an equine model. BMC Musculoskelet. Disord. 2018, 19, 230. [Google Scholar] [CrossRef] [PubMed]
- Roth, S.P.; Erbe, I.; Burk, J. Decellularization of Large Tendon Specimens: Combination of Manually Performed Freeze-Thaw Cycles and Detergent Treatment. Methods Mol. Biol. 2017. [Google Scholar] [CrossRef]
- Burk, J.; Erbe, I.; Berner, D.; Kacza, J.; Kasper, C.; Pfeiffer, B.; Winter, K.; Brehm, W. Freeze-thaw cycles enhance decellularization of large tendons. Tissue Eng. Part C Methods 2014, 20, 276–284. [Google Scholar] [CrossRef] [PubMed]
- Scheibe, P. Fast Color Deconvolution for Histological Images with Mathematica. Available online: https://github.com/halirutan/ColorDeconvolution (accessed on 31 July 2018).
- Color Deconvolution ImageJ Plugin. Available online: https://imagej.net/Colour_Deconvolution (accessed on 31 July 2018).
- Ruifrok, A.C.; Johnston, D.A. Quantification of histochemical staining by color deconvolution. Anal. Quant. Cytol. Histol. 2001, 23, 291–299. [Google Scholar] [PubMed]
- Bigras, G. Color deconvolution. Optimizing handling of 3D unitary optical density vectors with polar coordinates. Anal. Quant. Cytol. Histol. 2012, 34, 149–160. [Google Scholar] [PubMed]
- Otsu, N. A Threshold Selection Method from Gray-Level Histograms. IEEE Trans. Syst. Man Cybern. 1979, 9, 62–66. [Google Scholar] [CrossRef]
- Pfaffl, M.W. A new mathematical model for relative quantification in real-time RT-PCR. Nucleic Acids Res. 2001, 29, e45. [Google Scholar] [CrossRef] [PubMed]


| Culture Condition | Treatment Groups |
|---|---|
| Monolayer | Control |
| IL-1β-high | |
| TNF-α-high | |
| IL-1β-low | |
| TNF-α-low | |
| IL-1β-high + TNF-α-high | |
| IL-1β-low + TNF-α-low | |
| Leuko-stim | |
| Leuko | |
| Static scaffold culture | Control |
| IL-1β-high | |
| TNF-α-high | |
| IL-1β-low | |
| TNF-α-low | |
| IL-1β-high + TNF-α-high | |
| IL-1β-low + TNF-α-low | |
| Leuko | |
| Dynamic scaffold culture | Control |
| IL-1β-high + TNF-α-high | |
| IL-1β-low + TNF-α-low | |
| Leuko |
| Category | Description | Score Points |
|---|---|---|
| A. Cell distribution at seeded scaffold surface | No cells | 0 |
| Single cells | 1 | |
| Monolayer | 2 | |
| Partial multilayer | 3 | |
| Constant multilayer | 4 | |
| B. Cell integration within the scaffold | No cells integrated | 0 |
| <10% of cells integrated | 1 | |
| 10–50% of cells integrated | 2 | |
| > 50% of cells integrated | 3 | |
| C. Cell distribution at opposite scaffold surface | No cells | 0 |
| <10% of cells at opposite side | 1 | |
| 10–50% of cells at opposite side | 2 | |
| >50% of cells at opposite side | 3 |
| Gene | Primer Sequences | Accession Number | PCR Product (bp) |
|---|---|---|---|
| ACTB | For: ATCCACGAAACTACCTTCAAC | NM_001081838.1 | 174 |
| Rev: CGCAATGATCTTGATCTTCATC | |||
| GAPDH | For: TGGAGAAAGCTGCCAAATACG | NM_001163856.1 | 309 |
| Rev: GGCCTTTCTCCTTCTCTTGC | |||
| Collagen 1A2 | For: CAACCGGAGATAGAGGACCA | XM_001492939.3 | 243 |
| Rev: CAGGTCCTTGGAAACCTTGA | |||
| Collagen 3A1 | For: AGGGGACCTGGTTACTGCTT | XM_001917620.3 | 216 |
| Rev: TCTCTGGGTTGGGACAGTCT | |||
| Decorin | For: ACCCACTGAAGAGCTCAGGA | NM_001081925.2 | 239 |
| Rev: GCCATTGTCAACAGCAGAGA | |||
| Tenascin-C | For: TCACATCCAGGTGCTTATTCC | XM_001916622.3 | 163 |
| Rev: CTAGAGTGTCTCACTATCAGG | |||
| Osteopontin | For: TGAAGACCAGTATCCTGATGC | XM_001496152.3 | 158 |
| Rev: GCTGACTTGTTTCCTGACTG | |||
| Scleraxis | For: TACCTGGGTTTTCTTCTGGTCACT | NM_001105150.1 | 51 |
| Rev: TATCAAAGACACAAGATGCCAGC | |||
| Mohawk | For: AAGATACTCTTGGCGCTCGG | XM_014737017.1 | 170 |
| Rev: ACACTAAGCCGCTCAGCATT | |||
| Smad8 | For: AGCCTCCGTGCTCTGCATT | AB106117.1 | 200 |
| Rev: CCCAACTCGGTTGTTTAGTTCAT |
© 2018 by the authors. Licensee MDPI, Basel, Switzerland. This article is an open access article distributed under the terms and conditions of the Creative Commons Attribution (CC BY) license (http://creativecommons.org/licenses/by/4.0/).
Share and Cite
Brandt, L.; Schubert, S.; Scheibe, P.; Brehm, W.; Franzen, J.; Gross, C.; Burk, J. Tenogenic Properties of Mesenchymal Progenitor Cells Are Compromised in an Inflammatory Environment. Int. J. Mol. Sci. 2018, 19, 2549. https://doi.org/10.3390/ijms19092549
Brandt L, Schubert S, Scheibe P, Brehm W, Franzen J, Gross C, Burk J. Tenogenic Properties of Mesenchymal Progenitor Cells Are Compromised in an Inflammatory Environment. International Journal of Molecular Sciences. 2018; 19(9):2549. https://doi.org/10.3390/ijms19092549
Chicago/Turabian StyleBrandt, Luisa, Susanna Schubert, Patrick Scheibe, Walter Brehm, Jan Franzen, Claudia Gross, and Janina Burk. 2018. "Tenogenic Properties of Mesenchymal Progenitor Cells Are Compromised in an Inflammatory Environment" International Journal of Molecular Sciences 19, no. 9: 2549. https://doi.org/10.3390/ijms19092549
APA StyleBrandt, L., Schubert, S., Scheibe, P., Brehm, W., Franzen, J., Gross, C., & Burk, J. (2018). Tenogenic Properties of Mesenchymal Progenitor Cells Are Compromised in an Inflammatory Environment. International Journal of Molecular Sciences, 19(9), 2549. https://doi.org/10.3390/ijms19092549