Article

Time-Course of Metabolic and Proteomic Responses to Different Nitrate/Ammonium Availabilities in Roots and Leaves of Maize

Department of Agricultural and Environmental Sciences—Production, Landscape, Agroenergy (DiSAA), Università degli Studi di Milano, Via Celoria 2, 20133 Milano, Italy
*
Author to whom correspondence should be addressed.
Int. J. Mol. Sci. 2018, 19(8), 2202; https://doi.org/10.3390/ijms19082202
Submission received: 13 June 2018 / Revised: 24 July 2018 / Accepted: 25 July 2018 / Published: 27 July 2018

Abstract

:
The availability of nitrate and ammonium significantly affects plant growth. Co-provision of both nutrients is generally the best nutritional condition, due to metabolic interactions not yet fully elucidated. In this study, maize grown in hydroponics was exposed to different nitrogen (N) availabilities, consisting of nitrate, ammonium and co-provision. Roots and leaves were analyzed after 6, 30, and 54 h by biochemical evaluations and proteomics. The ammonium-fed plants showed the lowest biomass accumulation and the lowest ratio of inorganic to organic N content, suggesting a metabolic need to assimilate ammonium that was not evident in plants grown in co-provision. The N sources differently affected the root proteome, inducing changes in abundance of proteins involved in N and carbon (C) metabolisms, cell water homeostasis, and cell wall metabolism. Notable among these changes was that some root enzymes, such as asparagine synthetase, phosphoenolpyruvate (PEP) carboxylase, and formate dehydrogenase showed a relevant upsurge only under the sole ammonium nutrition. However, the leaf proteome appeared mainly influenced by total N availability, showing changes in the abundance of several proteins involved in photosynthesis and in energy metabolism. Overall, the study provides novel information about the biochemical determinants involved in plant adaptation to different N mineral forms.

Graphical Abstract

1. Introduction

Nitrogen (N) is the mineral element required in the highest amount by plants: nitrate (NO3) and ammonium (NH4+) represent the main inorganic N sources [1]. Since the proportion in which NO3 and NH4+ are available in agricultural soils strongly affects crop productivity [2], a better understanding of plant biochemical responses to N sources could help to improve agricultural sustainability. Nitrate and NH4+ have different, and sometimes opposite, effects on plant development, growth rate, root architecture, and leaf expansion [3]. The use of NO3 and NH4+ by plants is sustained by different mechanisms of acquisition, allocation, and assimilation [2,4,5]. After uptake by roots, NO3 is firstly reduced by nitrate reductase (NR) and nitrite reductase (NiR) to generate NH4+, which, together with the quota derived from soil and metabolism, is assimilated into amino acids by the glutamine synthetase/glutamate synthase pathway (GS/GOGAT) [2]. The contribution of roots and leaves in N assimilation is influenced by several factors, but in both cases, the process involves several interactions with carbon (C) metabolism that allow the plant to sustain the requirements of C skeletons and of metabolic energy [6]. The use of NO3 or NH4+ by plants is associated with different balancing among glycolysis, the oxidative pentose pathway, and the tricarboxylic acid (TCA) cycle [2,7]. Considering the theoretical metabolic costs [8] and the demand for reducing equivalents [9], the use of NH4+ by plants seems to be advantageous compared to that of NO3, but this prediction does not often coincide with empirical observations [3]. An exclusive, or excessive, NH4+ nutrition could have adverse impacts on plants, including alterations in root metabolism, plant ionic imbalances, and foliar oxidative stress [10,11]. Plant responses also significantly depend on the relative proportion between the NH4+ and the NO3 available in the soil. The co-provision of both NH4+ and NO3 is generally considered the optimal N condition, in which the two nutrients reveal synergistic beneficial effects [12]. The synergy mainly arises from the reciprocal influences between NH4+ and NO3 on their uptake, on root morphology, on the transport of N compounds from roots to shoots, and on plant C metabolism. Overall, these interactions improve the capabilities of the plants for N acquisition and assimilation [13]. Large-scale approaches have turned out to be very useful to investigate the complexity of N nutrition in plants, as proven by many transcriptomic studies conducted in Arabidopsis thaliana [11,14]. However, several aspects have yet to be fully elucidated, such as the interactions and communications between NO3 and NH4+ and between roots and leaves.
Maize (Zea mays L.) is a crop of worldwide economic relevance, and is characterized by C4 metabolism and a very high demand for N inputs in agricultural systems [15]. Some large-scale studies have been devoted to investigating NO3 metabolism in maize, providing new evidence that this anion acts as a signal influencing its uptake and assimilation both at transcriptional and protein levels [16,17,18]. Moreover, these studies have been useful in revealing new aspects regarding the interlinks between C and N metabolism in plants [19,20]. In particular, comparative proteomics shows that NO3 availability evokes different responses in roots and leaves, highlighting the importance of analyzing both organs [20]. To our knowledge, similar approaches have not yet been applied in maize to study the responses to NH4+, either as sole N nutrient or in combination with NO3.
In this study, maize plants were exposed to NO3, to NH4+, or to co-provision and analyzed over a period of three days, in order to appreciate plant metabolic and biochemical differences. The evaluation of plant growth and nutritional status in roots and leaves was combined with a comparative proteomic approach. This investigation showed that NO3 and NH4+ had different effects on plant growth and that the availability of NO3 in co-provision affected the accumulation and assimilation of NH4+ in roots and leaves. Interestingly, the root proteome was more specifically influenced by the N source, while leaf profiles were mainly affected by the total N availability. Moreover, some proteomic changes were specifically induced by NH4+ as sole nutrient and absent in co-provision or with NO3 nutrition. Taken together, the results suggest that NO3 availability influenced the capability of the plants to manage the content of NH4+ in the cells, probably due also to its action as an osmolyte. Moreover, the study contributes to a better understanding of plant N metabolism, providing novel information about molecular mechanisms involved in plant adaptation to different N sources.

2. Results and Discussion

This study was devised to investigate biochemical responses specific to NO3 or NH4 availability, as well as the interactions between the two nutrients in co-provision, in maize plants during early vegetative growth. Seedlings were grown in a hydroponic system with low N availability (1 mM NO3, 125 µM NH4+) for a total of nine days until the expansion of the second leaf, and then exposed to one of three N treatments: 5 mM NO3 (n); 5 mM NH4+ (a); 2.5 mM NO3 + 2.5 mM NH4+ (na). This experimental design was chosen in order to expose maize seedlings to the same availability of total N, while changing the proportion between NO3 and NH4+. Moreover, since maize is generally fertilized by a single application at sowing [21], this growth stage corresponds to a period in which maize plants are exposed to high levels of N and in which they often show the highest susceptibility to an excess of NH4+ [22]. Plants were analyzed for a period of three days (t0, 6 h, 30 h, and 54 h) to appreciate both early biochemical responses and metabolic acclimations in roots and leaves. After the evaluation of plant growth, nutritional parameters were analyzed in combination with proteomic changes in both organs.

2.1. Plant Growth and Metabolic Status of Roots and Leaves

The estimation of plant growth, measured as the biomass of roots and leaves during the different nutritional treatments, revealed that the two organs grew with a different dynamic (Figure 1).
In plants exposed to NO3 and to co-provision (n, na), root growth was appreciable at the third day, resulting in a biomass increment of about 60% compared with the plants at t0. However, leaf growth was already evident after 30 h in all conditions, leading to a doubling of the biomass at 54 h (Figure 1). This behavior is in agreement with the fact that an increase in N supply promotes an increase in biomass shoot/root ratio in several plant species [3,23]. Although this observation was similar in all conditions, plants supplied only with NH4+ (a) were characterized by a much slower increase in the fresh weight of the roots and showed the lowest leaf growth (Figure 1). These results confirm previous studies reporting that NH4+-fed maize plants accumulate less biomass than those fed with NO3 [24]. Plants grown in co-provision (na) showed a biomass accumulation very similar to that of the NO3-fed plants (n, Figure 1), suggesting that the lower level of NH4+ in the growth medium and/or the presence of NO3 led to a reduction of the negative effects caused by a sole NH4+ nutrition.
The levels of NO3, NH4+, and amino acids were determined in roots and leaves (Figure 2).
In the (n) condition, the content of NO3 reached the highest level at 30 h in roots and at 54 h in leaves, which in comparison to the t0 plants corresponded to an increment of about 140% and 45%, respectively (Figure 2A,B). The plants grown in co-provision (na) showed a similar accumulation of NO3 in both organs, even though the availability of the anion in the growth medium was only half (Figure 2A,B). This observation indicates that the accumulation of the anion was not proportional to the external availability, but it was probably regulated by the requirements of the plants. Moreover, the copresence of NH4+ did not seem to modify this process. These results seem to be inconsistent with the observation that NO3 uptake is reduced in presence of NH4+. However, in barley (Hordeum vulgare L.) and in Arabidopsis this effect was ascribed to an inhibition of the inducible high affinity transport systems [25,26], and it is therefore conceivable that it did not influence the accumulation of NO3 in plants exposed to high N input (>1 mM) for several hours. At the same time, the (a) plants showed a gradual decline in NO3 levels in roots and leaves (Figure 2A,B), probably because the plants continued to use the NO3 reserves in the presence of NH4+.
In (n) plants, the content of NH4+ did not change in roots, while it showed some fluctuations in leaves (Figure 2C,D). However, in plants exposed to NH4+ and to co-provision (a, na) the content of the cation greatly increased, especially in roots, but it never reached levels associated with NH4+ toxicity in maize [22,27]. In these conditions (a, na), in roots the NH4+ content already surged up at 6 h, while an increase of foliar NH4+ was evident only after 54 h (Figure 2C,D).
In this context, it is important to note that in (a) plants, 54 h of treatment led to both the highest accumulation of NH4+ and to an almost total depletion of NO3 (Figure 2). However, the roots of the plants in co-provision (na) were characterized by an NH4+ content much higher than those of the (a) plants, even though the external availability was only half (Figure 2C).
The amino acid levels rose in both organs in all the nutritional conditions. This increase was higher in plants exposed to NH4+ and to co-provision (a, na, Figure 2E,F), in agreement with the observation that, in maize, ammonium-fed plants show higher contents of amino-N compounds than nitrate-fed ones [24]. Interestingly, in roots the accumulation of amino acids was not proportional to the content of NH4+. Indeed, the (a) roots were characterized by an upsurge of amino acid levels at 54 h, which was not evident in (na) plants (Figure 2E). These results suggest that the availability of NO3 could have exerted positive effects on the storage capacity of NH4+ of the plants.
To investigate this hypothesis, we calculated the total content of N in plants as well as the ratio between the inorganic N and organic N in roots and leaves (Table 1). The total N content in plants at 54 h reached similar values in all the nutritional treatments. However, plants showed very different partitioning between inorganic and organic forms of N. The (a) plants were characterized by a particular decrease in this ratio, due to the highest increase in amino acid and protein levels. On the contrary, plants in co-provision showed values more similar to (n) plants, although they had the highest NH4+ content in roots (Figure 2). These results indicate that in co-provision the presence of NO3 promotes a major capability of storage of NH4+ in the roots, and therefore it could contribute to alleviating metabolic stress by reducing the need to assimilate the cation into amino acids.
The evaluation of the contents of sucrose and reducing sugars showed that, after a little increase at 6 h, the levels were only slightly affected by the nutritional treatments, except for a remarkable doubling in the content of reducing sugars in the roots of the (a) plants, not found in co-provision (Figure 3). Although this had already been observed in another maize genotype [27], further studies are needed to clarify the metabolic meaning of this accumulation. However, this result weakens the possibility that the lack of root growth of the (a) plants was due to an insufficient allocation of photoassimilates, as previously proposed in other plant species [2,10].

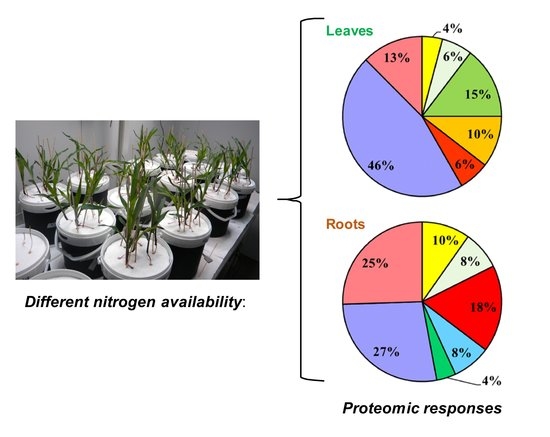
2.2. Comparative Proteomic Analyses in Roots and Leaves of Maize during Exposure to Different N Sources

The analysis of the proteomic changes in roots and leaves of maize plants exposed to different N sources (n, a and na) was done by comparing the total proteome of each organ among all the conditions (three nutritional treatments for three timings). The comparison was performed by means of gel liquid chromatography-mass spectrometry (GeLC-MS/MS): proteins are purified by sodium dodecyl sulphate-polyacrylamide gel electrophoresis (SDS-PAGE), in-gel digested, and then identified and quantified by mass spectrometry [28]. This approach allowed us to analyze the abundance of 336 and 246 proteins in roots and leaves, respectively, with high reliability in identification and a good degree of comparability among samples and conditions (Table 2, Supplementary Data 1).
The proteins that showed changes in abundance of at least two-fold in at least two conditions were further selected by means of the two-way ANOVA to find the main source of variation (time, N sources), and by means of the Tukey-test (p < 0.05) to evaluate the differences among conditions. The selected proteins were named Differentially abundant Proteins (DPs). The DPs identification in roots and leaves, their changes and statistics, are reported in Table 3 and Table 4, respectively.
The cluster representations of the DP abundances in roots and leaves are shown in Figure 4 and Figure 5 (for detailed bar graphs reporting protein levels see Supplementary Data 2).
The DPs accounted for 15% and 19% of the quantified proteins in roots and leaves, respectively (Table 2), showing that the two organs were affected by the treatments to a similar extent. This result is in agreement with our previous two-dimensional gel electrophoresis (2-DE) study, showing comparable effects on root and leaf proteome in maize plants exposed to NO3 [20]. In contrast, a microarray study in Arabidopsis indicated that the responses to NO3 were much more ample in roots than in shoots [29], but this discrepancy probably derives from different approaches and/or nutritional treatments.
The functional classification of the DPs recognized nine main classes, partially overlapping in roots and leaves (Figure 6). “Protein synthesis and folding” was the main category in both organs, indicating a general reprogramming of plant functionalities. Leaves were also characterized by changes in DPs involved in photosynthesis (15%) and energy metabolism (10%), while in roots the DPs related to C metabolism (mainly catabolic processes) were predominant (18%). Moreover, the root proteomic profile was characterized by changes in proteins involved in cell water homeostasis (8%) and cell wall (4%).
The classification of DPs according to the main source of variation (Figure 7, Table 3 and Table 4, Supplementary Data 1) discriminated between the DPs specifically affected by the N source and the DPs that were not influenced by this factor (changes in which were related to time and/or to total N availability). In roots, most of the DPs were specifically affected by the N source (Figure 7A), highlighting that NO3 and NH4+ led to distinct effects. This result is in agreement with a study showing that in Arabidopsis plants exposed for 1.5 h to NO3 or NH4+ more than 40% of the transcriptomic changes in roots were nitrate- or ammonium-specific [30]. However, in the leaf proteome the DPs were more equally distributed between the two categories (Figure 7B), indicating that the leaf metabolism was less specifically affected by the kind of N source respect than the root one. Overall, this response was consistent with the physiological and biochemical data. Indeed, the treatments differently affected root growth but all of them sustained an increment in leaf biomass. Moreover, the nutritional treatments induced metabolic changes which were more different among conditions in roots than in leaves (Figure 1, Figure 2 and Figure 3). As highlighted by previous studies [20,22,27], this proteomic profiling confirmed the fundamental role of roots in plant adaptation to the kind of N source.

2.3. Proteomic Changes Involved in Nitrogen (N) Assimilation and Amino Acid Metabolism

The proteomic analysis showed that the nutritional treatments induced changes in the levels of Ferredoxin-Nitrite Reductase (Fd-NiR) in roots (R74, Figure 4) and in leaves (L149, Figure 5), with trends similar to the contents of NO3 in the organ (Figure 2). This was particularly evident in (n) plants, in which Fd-NiR reached the maximum level after 30 h and 54 h in roots and leaves, in conjunction with the peak of NO3 accumulation. Moreover, the Fd-NiR levels in (na) plants (Figure 4 and Figure 5) suggest that NO3 reduction was sustained even in the presence of NH4+.
Considering that plastid Fd-NADP+ reductase (FNR, R68, Table 3) reduces the Fd-like electron carrier for NiR [31], it is of interest that FNR and Fd-NiR showed similar profiles in roots (Figure 4). These results confirmed that both enzymes are strictly coordinated and take part in the “root primary response to NO3” [29,32].
On the contrary, the trends observed for two glutamine synthetases (GS) were dissimilar in roots and leaves, probably because the two enzymes were different isoforms with well-known specific roles. In leaves, the enzyme (L177, Table 4) belongs to the chloroplast GS2 type (92.8% of identity with GS2 P25462) which plays a pivotal role in NO3 assimilation. Its decrease in the course of time (Figure 5) could be due to leaf age and/or to amino acid accumulation, as previously observed [33]. Instead, in roots GS was identified as the cytosolic GS1-1 isoform (R64, Table 3, 99.7% of identity with GS1-1 P38559) that surged up in plants exposed to NH4+ (a, na, Figure 4), confirming its role in NH4+ assimilation [27].
The concurrent increases of GS1, of the glutamate synthase 1 [NADH] chloroplastic (R189, Table 3) and of the amino acid levels in roots of (a) plants (Figure 2F and Figure 4) indicated a relevant induction of NH4+ assimilation. Interestingly, all these traits were lower in the roots of the (na) plants, even if the NH4+ content was higher (Figure 2C and Figure 4), confirming that the copresence of NO3 could somehow reduce the need to quickly assimilate the NH4+ ions (see below).
This hypothesis was further supported by the profile of the asparagine synthetase (AS), the enzyme that catalyzes the ATP-dependent synthesis of asparagine by the transfer of the amino group from glutamine to aspartate. In several plant species, some members of the AS gene family are upregulated by increases in the levels of amino acids and/or of internal NH4+, suggesting that AS could contribute to its assimilation during nutritional stress conditions [34]. In our study, one AS (R103) was greatly induced in the roots of the NH4+-supplied plants (a), while it was almost undetectable in plants exposed to nitrate or to co-provision (n, na, Figure 4), confirming that the presence of NO3 could reduce the stress induced by NH4+ accumulation in roots.
In this context, it is important to note that it was proposed that glutamate dehydrogenase (GDH) could contribute to the assimilative process when plants are exposed to an excessive NH4+ nutrition [2]. Our proteomic analysis revealed that in roots GDH did not change in abundance during any treatment (R104, Supplementary Table S1). This observation is in agreement with the fact that the NH4+ content in roots never reached levels associated with toxicity in maize [22,27], but it does not exclude the idea that the enzyme could have relevant roles at higher NH4+ inputs or during longer exposures.
On the whole, the proteomic analysis provided evidence that co-provision could also have positive effects on plants’ growth because of the ability of NO3 to change the balance between the quota of NH4+ drained by assimilation and the quota of NH4+ delivered to vacuole storage.
At the same time, the proteomic analysis revealed changes in the levels of enzymes involved in amino acid metabolism in roots and leaves, most of which were not specifically related to the N source (Figure 7). In leaves, enzymes involved in glycine (L193), methionine (L22), and aromatic amino acid (L194) metabolisms increased in abundance over time (Table 4, Figure 5), in agreement with a raising of the leaf anabolic processes after the N inputs. In roots, the members of this class were differently affected as regards both trends and sources of variation. The levels of phenylalanine ammonia-lyase (PAL) decreased in plants exposed to NH4+, both during (a) and (na) treatment (R6, Table 3, Figure 4). These data suggest that, similarly to NO3 [20,35], the NH4+ contents could also exert negative feedback at the enzyme level, probably to reduce additional release of the cation via PAL activity.

2.4. Changes in Proteins Involved in Photosynthesis, Energy, and Carbon Metabolism

The leaf proteome was characterized by DPs involved in photosynthesis and energy metabolism, many of which were mainly influenced by time and/or by the total N availability (Figure 6 and Figure 7). The increases in the Photosystem I P700 chlorophyll a apoproteins A1 and A2 (L31, L85, Table 4, Figure 5), which are the large subunits PsaA and PsaB that form the core of the Photosystem I complex (PSI) [36], support the hypothesis that a general increase of PSI functionality occurred to sustain N assimilation.
On the other hand, in leaves in all conditions (n, a, and na) at 54 h, several events occurred at once, along with the increase in NH4+ and amino acid content (Figure 2). Firstly, it was possible to observe a decrease in abundance of the PSI reaction center subunit V (L132, also known as PsaG) and of the PSI H subunit1 (L196), which are involved in the interaction of the PSI with the light harvesting complexes I (LCHI) and LCHII, respectively [36]. In addition, it was possible to observe an increase of the oxygen evolving enhancer (OEE) protein 3 (L113), which belongs to the photosystem subunit Q (PsbQ) family involved in stabilizing the PSII-LCHII complex [37]. These results support the hypothesis that, at 54 h, the leaves went through a modulation of the energy balance between the two Photosystems (i.e., a transition from State II to State I) that promoted PSII functionality and linear electron flow. This condition corresponds to an optimization of the photosynthetic machinery to generate both adenosine triphosphate (ATP) and reduced form of nicotinamide adenine dinucleotide phosphate (NADPH) required by the Calvin Cycle [38]. It coincided with an increase of three subunits of chloroplast ATP synthase (L115, L225, and L155) and of the pyruvate phosphate dikinase regulatory protein (L162), which regulates CO2 fixation in C4 plants [39]. Finally, the concomitant increases of the triose phosphate/phosphate translocator (L212), which mediates the export of fixed carbon from chloroplast to cytosol [40], of two nucleoside diphosphate kinases (L130 and L236), cytosolic enzymes involved in balancing between the pools of ATP and the nucleosides [41], as well as of two glycolytic enzymes (L192 and L191) and of the mitochondrial malate dehydrogenase (L110) suggested a general upsurge in energy production and in respiratory metabolism (Table 4, Figure 5). On the whole, considering that in plants the maintenance of low levels of NH4+ in tissues is one of the main strategies to avoid metabolic stresses [11], it is possible to propose that, at 54 h, the NH4+ accumulation in leaves led to an increment of the photosynthetic machinery and of C metabolism to sustain the synthesis of amino acids. In this regard, the high content of reducing sugars in the roots of the (a) plants at 54 h could indicate that a massive allocation of photoassimilates in this organ occurred when NH4+ was provided as the sole N nutrient (Figure 3C). This response, curiously absent in co-provision, could be one of the causes contributing to the slower leaf growth (Figure 1B).
In roots, C metabolism was instead more specifically affected by the kind of N source (Table 3, Figure 7). Seeing that the oxidative pentose pathway is induced by NO3, as indicated in maize root plastids [42] and by transcriptomics in Arabidopsis roots [30], it is important to analyze the changes of two isoforms of glucose-6-phosphate 1-dehydrogenase (G6PDH, Table 3). The first one, the R207, which is probably a cytosolic form (80% of identity with P37830, a cytoplasmic isoform of S. tuberosum), increased with time. However, the second one, the R85, which belongs to the plastid protein cluster, showed a higher level in (n) and (na) plants, and it almost disappeared in (a) roots after 54 h (Table 3, Figure 4). These results are in agreement with the fact that in barley (H. vulgare L.) the cytosolic G6PDH activity seems to be correlated with general growth processes, while the plastidic one is induced to a higher extent by NO3 than by NH4+ [43].
Similarly, some root glycolytic enzymes were differently affected by the nutritional treatments (Table 3). The pyrophosphate-fructose 6-phosphate 1-phosphotransferase (R168, also known as phosphofructokinase) was induced by NO3 in (n) and (na) roots (Figure 4). Although some studies exclude a key role for this enzyme in the control of glycolysis [44], in our opinion, this response deserves further investigation. Moreover, since changes in the phosphoglycerate mutase levels seem to have dramatic effects on metabolism [44], the increases in abundance of this enzyme (R19), together with citrate synthase (R119) and PEP carboxylase (R28) suggested an upsurge of respiratory metabolism in roots of the (a) plants at 54 h (Figure 4). With this in view, these results confirm that in roots of NH4+-fed plants the PEP carboxylase could play an important anaplerotic role for TCA replenishment, as previously proposed by several authors [2,10,45]. Taken together, these results provide new evidence that NO3 and NH4+ have different effects on C metabolism in roots, according to different requirements for reducing power and C skeletons.
Overall, this proteomic study highlights the different metabolic roles for roots and leaves and it allows us to propose novel molecular determinants involved in the adaptation of plants to different N sources.

2.5. Root Proteomic Changes Involved in Cell Water Homeostasis and Cell Wall Metabolism

The root proteomic profile was characterized by DPs involved in cell water homeostasis and cell wall metabolism that were all specifically affected by the N source (Table 3, Figure 6A and Figure 7A). Considering the interactions between K and N nutrition on ion uptake, transport, and assimilation in plants [46], it is appropriate to highlight that the β subunit of a V-gated K+ channel (R290, Table 3) was specifically induced in (n) plants, where it reached its highest abundance after 30 h. Although to lesser extent, this effect was also appreciable in roots of the (na) plants but it was absent in the NH4+-fed plants (Figure 4). This observation could be associated with the fact that, at high external concentrations, the acquisition rates of NO3 and K+ are often positively correlated ([46] and references therein), a relation that in barley roots was recently attributed to the stimulative effect of NO3 on the K+ low-affinity influx system [47]. Whether this effect derives from an improvement in cell electrical balance and/or from a regulative molecular mechanism is as yet an unresolved question, which deserves future physiological and molecular studies.
The N sources also differently affected the accumulation of some aquaporins located at both plasma membrane (PIP) and tonoplast (TIP) (Table 3). In particular, PIP2.1 (R127) maintained the highest levels in (n) and (na) roots but decreased by half at 54 h in (a) plants, while PIP2-5 (R193) was specifically accumulated in roots exposed to NO3 (n and na, Figure 4). Several authors have proposed that the increment in root hydraulic conductivity during NO3 exposure involves changes in PIP functionality [48]). However, a study conducted in maize indicated that NO3 induces an increase in root hydraulic conductivity, but it does not correlate with any changes in the expression of the aquaporin genes, at least within 4 h of treatment [49]. It seems likely that the discrepancy between that study and our proteomic profiles derives from different exposure timing. For instance, it is possible that 54 h NO3 accumulation in root tissues (Figure 2A) could have had effects on aquaporin abundances. Moreover, TIP2.1 (R285) is very similar to the aquaporin AtTIP2-3 (77% identity with Q9FGL2) which in Arabidopsis is involved in NH3 transport into the vacuole [50]. This protein was more abundant in the roots of (n) plants (Figure 4), suggesting that high NH4+ external inputs could exert inhibitory effects on the channel.
Although future studies are needed for a conclusive verification, these observations allow us to propose that the presence of NO3 might promote a higher accumulation of K+ channels and aquaporins in roots, maybe acting as an osmolyte. Considering that both protein families are involved in the NH4+/NH3 transport [11], it is possible to conceive some relationship between their induction by NO3 and the highest NH4+ content in roots in co-provision (Figure 2D).
Furthermore, several authors have proposed links among aquaporin expression, cell water potential, and cell expansion in growing tissues [48]. Starting from these considerations, it is interesting to correlate the changes in aquaporins with the changes of the DPs involved in cell wall metabolism in roots. The proteomic analysis revealed that a hydroxyproline-rich glycoprotein dramatically decreased in abundance after 54 h of (n) nutrition (R92), while O-methyltransferase ZRP4 (R154) was specifically accumulated after 54 h of (a) exposure (Table 3, Figure 4). Since in maize roots these proteins are associated with the lignification and suberization of the secondary cell wall [51,52], these results could suggest that NO3, in contrast with NH4+, induced changes sustaining root growth and development. This hypothesis is also consistent with the differences in root growth in (n) and (a) plants (Figure 1A). This topic deserves future investigation, which could also contribute to elucidating the molecular mechanisms underlying the differences in root morphology between NO3- and NH4+-fed plants.

2.6. Proteomic Changes Related to Protein Synthesis and Folding

The “protein synthesis and folding” was the major functional class both in roots and leaves, accounting for 27% and 46% of the DPs, respectively (Figure 6). In both cases, most of them were not specifically affected by the N source (Figure 7), probably because the modulation of protein synthesis was mainly associated with plant growth after exposure to high N availabilities. This class encompasses many kinds of proteins, among which are an initiation factor (L69), three heat shock proteins (R4, L19, and L64), and an endopeptidase (L154) (Table 3 and Table 4).
Ribosomal proteins accounted for 36% and 59% of the category in roots and leaves, respectively, and, in particular, in leaves they were identified as both chloroplastic (30%) and cytosolic (70%) members (Table 3 and Table 4). In general, the trends observed were very specific for each ribosomal DPs (Figure 4 and Figure 5), probably due to a modulation of the ribosome composition. This conclusion is in agreement with a previous study showing that the replenishment of NO3 in N-starved Arabidopsis seedlings induces changes in the expression of more than 100 genes encoding ribosomal proteins [53]. However, it is very difficult to draw conclusions about the biochemical meanings of these changes because of the complexity that characterizes the plant ribosome. Plant ribosomes are composed of a large number of heterogeneous proteins grouped into many families, currently numbering 80 in the Arabidopsis genome [54], encoded by several gene paralogs, with specific developmental roles, for which transcriptional regulation is still unclear [55,56]. To unravel these aspects is far beyond the aims of this work, but we believe that the information provided by this proteomic profiling can be useful for future studies dealing with this fundamental issue of plant biology.
Several peptidyl-prolyl cis-trans isomerases (PPIases) of the cyclophilin-type (Cyp), namely, two in the roots (R131 and R216, Table 3) and three in leaves (L70, L204, and L243, Table 4) decreased in abundance in all the nutritional treatments over time (Figure 4 and Figure 5). The PPIases catalyse the cis-trans isomerization of prolyl bonds in polypeptide chains avoiding the accumulation of misfolded proteins, both during de novo synthesis and in restructuring of mature polypeptides [57]. In plants, one of the first Cyp was discovered in maize and its function was related to responses to abiotic stresses [58]. Moreover, in humans, Cyp18 seems to be involved in the elimination of damaged proteins accumulated under oxidative stress [59]. Since oxidative stress and protein synthesis alterations are often associated with nutrient deficiency, it is possible that the decline of these proteins was due to the exposure of the plants to high N inputs. This result supports the hypothesis that the Cyp proteins could contribute to plant defense responses during nutritional shortages.
Summing up, this proteomic profiling provides new evidence that the modulation of protein synthesis is a crucial and multi-faceted element in plant adaptation to N availability, which requires coordination of several protein families.

2.7. Stress Responses and Other Functions

The DPs related to stress responses and other functions allow us to point out two interesting differences between (a) and (na) plants, which are therefore probably related to the presence of NO3 in co-provision. In particular, after 54 h of treatment, (a) plants were characterized by a relevant upsurge in abundance of formate dehydrogenase (R105) in roots and of lipoxygenase (L76) in leaves (Table 3 and Table 4, Figure 4 and Figure 5). Both increases were not significant in (na) plants, indicating that these responses were reduced by NO3 availability although the NH4+ content was higher in roots and similar in leaves (Figure 2).
Formate dehydrogenase is a mitochondrial enzyme that catalyzes the NAD+ dependent oxidation of formate to CO2 [60]. In non-photosynthetic tissues, one of the most plausible routes for formate production is the catabolism of serine and glycine [61]. It is conceivable that this metabolic condition may have occurred in response to the high accumulation of amino acids in roots during NH4+ nutrition, a trait that was less pronounced in co-provision (Figure 2). Moreover, in plants the induction of formate dehydrogenase is often induced by several abiotic stress, such as darkness and anoxia. Recently it was related with aluminium toxicity, caused by a metal cation whose detoxification shows several similarities with plant responses to NH4+, such as the production of organic acids and the vacuolar sequestration of this cation [62]. Considering that one-carbon metabolism could have roles in sustaining amino acid biosynthesis in non-photosynthetic tissues, our results suggest that formate dehydrogenase could be participating in mechanisms of tolerance to NH4+ in maize plants.
Plant lipoxygenases (LOX) are involved in polyunsaturated fatty acid and membrane metabolisms, but it has also been proposed that these enzymes could be accumulated as vegetative storage proteins in leaves, as observed in soybean (Glycine max L.) in response to sink limitation [63]. In one of our previous proteomic studies in maize, we were able to establish that the LOX identified in this analysis (codified by ZmLOX10) was accumulated in the leaf in response to high NO3 supply (i.e., 10 mM NO3, 30 h) [20]. Although it is not possible to exclude an involvement in the protection of stress induced by NH4+, all together these results support the hypothesis that LOX accumulation in the leaf could be a way to store N, a new and intriguing role of LOX in cereal crops.
In addition, three root peroxidases of the class III (Prxs) showed significant changes in abundance (R112, R133, and R300, Table 3, Figure 4). Since Prxs play several roles in plants [64], it is difficult to assign specific biochemical meaning to these results. However, the relations among Prxs, cell wall metabolism in roots and N nutritional status in plants seem to be worthy of further investigation. Similarly, it is interesting to note that the broad class of “other functions” includes several proteins localized in plant cell organelles, such as a peroxisomal fatty acid beta-oxidation multifunctional protein (R236), a mitochondrial prohibitin (R301), and two thylakoid luminal 19 kDa and 16.5 KDa proteins (L189 and L201) with unknown function (Table 3 and Table 4). This observation leads us to assume that, within the next few years, subcellular proteomics studies will be very useful to obtain novel information about the roles played by cell organelles in plant adaptation to total N availability as well as to different N sources.

3. Materials and Methods

3.1. Plant Material and Nutritional Treatments

Maize (Zea mays L.) seeds of the line PR33A46 (Pioneer Hi-Bred Italia®, Gadesco Pieve Delmona, CR, Italy) were germinated in the dark at 26 °C for 72 h. Seedlings were then grown by a hydroponic system in a growth chamber with a 16/8 h day/night regime, at 26/22 °C, constant relative humidity of 65%, and PPFD of 500 μmol·m−2·s−1. After 48 h of incubation in 4 mM CaSO4, the plants were transferred into a growth solution with low N input (1 mM KNO3, 2 mM K2SO4, 0.875 mM KH2PO4, 0.5 mM MgSO4, 0.4 mM CaSO4, 62.5 μM (NH4)2SO4, 60 μM Fe-EDTA, 25 μM KCl, 12.5 μM H3BO3, 1 μM MnSO4, 0.25 μM CuSO4, 0.25 μM ZnSO4, 0.25 μM Na2MoO4, pH = 6.1). After six days, at the beginning of the day (t0), the plants were transferred into new growth solutions in which N availability was changed according to the following treatments (abbreviated by letters in brackets): (i) 5 mM NO3 (n); (ii) 5 mM NH4+ (a); (iii) 2.5 mM NO3 + 2.5 mM NH4+ (na). All the solutions were balanced with K2SO4 and continuously aerated by electric pumps. The plants were sampled at t0 and after 6, 30, and 54 h of treatment. Roots were rinsed with water and blotted with paper towels. Roots and leaves were separately collected, weighed and immediately frozen in liquid N2. Each biological sample was composed of roots or leaves collected from four plants. Samples were stored at −80 °C. The significance of the changes in the biomass accumulation in roots and in leaves (n = 8) was assessed by the ANOVA test (p < 0.05, Tukey post hoc method).

3.2. Determination of the Contents of Nitrate, Ammonium, Amino Acids, Sucrose and Reducing Sugars

Nitrate was extracted from leaf and root samples as previously described [20], and measured according to Cataldo et al. [65].
The contents of NH4+ in roots and leaves were measured by the o-phthalaldehyde (OPA) method, as described by Coskun and coworkers [66]. Briefly, samples were powdered in liquid N2, homogenized in 5 volumes of ice-cold 10 mM formic acid (FA), and centrifuged at 14,000 g for 10 min at 4 °C. The supernatants were filtered by Millipore Millex HC cartridges (0.45 μm). An aliquot of the extract was added to 3 mL of OPA reagent (100 mM KH2PO4, 100 mM K2HPO4, 3.75 mM OPA, 2 mM 2-mercaptoethanol (2-ME), pH = 7). After incubation for 30 min in the dark, the sample absorbance was determined at 410 nm.
Amino acids, reducing sugars and sucrose were extracted from leaf and root samples as previously described [20]. Amino acid concentration was measured by the ninhydrin method [67], while the contents of sucrose and reducing sugars were determined according to Nelson [68]. The total content of N in roots and leaves was calculated as the sum of the inorganic N (derived from the contents of NO3 and NH4+) plus the organic N (derived from the contents of amino acids and proteins, applying the conversion factor of 6.25 that is generally used in corn [69]). All of the analyses were replicated on three independent biological samples (n = 3) and compared by the ANOVA test (p < 0.05, Tukey post hoc method).

3.3. Protein Extraction, Gel Electrophoresis and in-Gel Digestion

Frozen samples of roots or leaves were powdered in liquid N2 using a mortar and pestle and an aliquot of 200 mg was suspended in 3 volumes of extraction buffer (150 mM Tris-HCl pH 6.8, 10% (w/v) glycerol, 2% (w/v) sodium dodecyl sulfate (SDS), 2% (v/v) 2-ME, 0.1 mg·mL−1 Pefablock (Fluka)). Samples were vortexed for 10 min at room temperature and incubated for 30 min at 90 °C. After centrifugation at 14,000× g for 15 min, the collected supernatants were recentrifuged at 14,000× g for 5 min. The supernatants were stored at −80 °C until further use. Protein concentration was measured by 2-D Quant Kit (GE Healthcare, Milan, Italy).
Protein samples were colored with traces of bromophenol blue and aliquots of 15 µg were purified by partial 1D SDS-PAGE (1-dimensional SDS-polyacrylamide gel electrophoresis) conducted on 16% (w/v) polyacrylamide gel [70], monitoring by the Full-Range Rainbow Markers (Mr 12 000-225 000) (GE Healthcare). Briefly, the run was conducted applying 60 mV for 30 min until protein samples completely entered in the running gel. The gels were then incubated for 1 h in fixing solution (10% (v/v) acetic acid, 50% (v/v) methanol), stained for 1 h with Coomassie Brilliant Blue (CBB) (0.1% (w/v) CBB R-250, 10% (v/v) acetic acid), and destained in 10% (v/v) acetic acid.
The portion of gel containing proteins was excised and subjected to tryptic digestion. In-gel digestion was performed as previously described [20] with the following refinements. The volumes of solutions were adjusted to completely cover all gel samples (previously cut into 12 portions), and each sample was treated with 3 µg of trypsin (V5111, Promega, Madison, WI, USA). The extracted peptides were suspended in 0.1% (v/v) formic acid (FA). All of the procedures were replicated on three independent biological samples (n = 3).

3.4. Mass Spectrometry Analysis

All mass spectrometry experiments were conducted on an Agilent 6520 Q-TOF mass spectrometer equipped with an HPLC Chip Cube source driven by a 1200 series nano/capillary LC system (Agilent Technologies, Cernusco Sul Naviglio, MI, Italy)). Both systems were controlled by a MassHunter Workstation (version B.02.01, B2116.20; Agilent Technologies). Chromatography was performed into Polaris-HR-Chip-3C18 (Agilent Technologies), consisted of a 360-nL trap column and a 75 μm × 150-mm analytical column (Polaris C18-A, 180 Å, 3 µm). An aliquot of sample was loaded onto the trap column at 2 µL·min−1 in 0.1% (v/v) FA. The peptides were then eluted during a 100-min non-linear gradient of acetonitrile (from 3% to 50% v/v) in 0.1% (v/v) FA at 0.4 µL·min−1. The mass spectrometer ran in positive ion mode and MS scans were acquired over a range from 300 to 3000 mass-to-charge ratio (m/z) at 4 spectra·s−1. Precursor ions were selected by auto-MS/MS with a maximum of 4 precursors per cycle and active exclusion set at 2 spectra for 0.1 min.
Analysis of MS/MS spectra were performed by Spectrum Mill MS Proteomics Workbench (Rev B.04.00.127; Agilent Technologies). Cysteine carbamidomethylation and methionine oxidation were used as fixed and variable modifications, admitting 2 tryptic missed cleavages per peptide. The search was conducted against the database of Zea mays (ID 4577) protein sequences (Aug 2017, 130162 entries) downloaded from UniProtKB/Swiss-Prot (http://www.uniprot.org/), and concatenated with the reverse one. The threshold used for protein identification was false discovery rate (FDR) ≤ 1%, number of unique peptides (NUP) ≥ 2, protein amino acid coverage ≥ 5% if NUP < 4. Peptide quantification was obtained as the spectrum intensity (SI) of the precursor (MH+). Protein quantification was obtained summing the SI of all the identified peptides in the protein. Protein abundance was normalized as the % with respect to the abundance of all validated proteins in the sample (%SI). Proteins showing at least a two-fold change in their %SI among at least 2 of all the experimental conditions were analysed according to the two-way ANOVA test to ascertain the source of variations and then by one-way ANOVA to assess the significance of the differences (Tukey post hoc, p < 0.05).

Supplementary Materials

Supplementary materials can be found at https://www.mdpi.com/1422-0067/19/8/2202/s1. Supplementary Data 1. Comparative proteomic profiles of maize plants. The file reports data about the comparative characterization of the root (Supplementary Table S1) and leaf (Supplementary Table S2) proteomes. Supplementary Data 2. Changes in the level of proteins differentially accumulated in roots and leaves of maize plants. The file reports as bar charts the levels of the proteins differentially accumulated in roots and leaves of maize plants during the different nutritional treatments.

Author Contributions

Conceptualization, B.P. and L.E.; Formal analysis, B.P.; Investigation, B.P. and L.E.; Validation, B.P. and L.E.; Visualization, B.P.; Writing—original draft, B.P.; Writing—review & editing, B.P.

Funding

This work was supported by grant Finanziamento delle attività base di ricerca from the Italian Ministry for Education, University and Research (MUIR) assigned to Dr. Bhakti Prinsi.

Acknowledgments

The authors thank Lesley Currah for polishing the English in the manuscript.

Conflicts of Interest

The authors declare no conflict of interest.

Abbreviations

2-ME2-Mercaptoethanol
CBBCoomassie Brilliant Blue
DPsDifferentially abundant Proteins
FAFormic acid
NUPNumber of unique peptides
OPAo-Phthalaldehyde
SDSSodium dodecyl sulfate
SISpectrum intensity

References

  1. Hawkesford, M.; Horst, W.; Kichey, T.; Lambers, H.; Schjoerring, J.; Møller, I.S.; White, P. Marschner’s Mineral Nutrition of Higher Plants, 3rd ed.; Elsevier/Academic Press: Amsterdam, The Netherlands, 2011; pp. 135–151. ISBN 978-0-12-384905-2. [Google Scholar]
  2. Miller, A.J.; Cramer, M.D. Root nitrogen acquisition and assimilation. Plant Soil 2004, 274, 1–36. [Google Scholar] [CrossRef]
  3. Andrews, M.; Raven, J.A.; Lea, P.J. Do plants need nitrate? The mechanisms by which nitrogen form affects plants. Ann. Appl. Biol. 2013, 163, 174–199. [Google Scholar] [CrossRef]
  4. Krapp, A. Plant nitrogen assimilation and its regulation: A complex puzzle with missing pieces. Curr. Opin. Plant Biol. 2015, 25, 115–122. [Google Scholar] [CrossRef] [PubMed]
  5. Kiba, T.; Krapp, A. Plant nitrogen acquisition under low availability: Regulation of uptake and root architecture. Plant Cell Physiol. 2016, 57, 707–714. [Google Scholar] [CrossRef] [PubMed]
  6. Nunes-Nesi, A.; Fernie, A.R.; Stitt, M. Metabolic and signaling aspects underpinning the regulation of plant carbon nitrogen interactions. Mol. Plant 2010, 3, 973–996. [Google Scholar] [CrossRef] [PubMed]
  7. Masakapalli, S.K.; Kruger, N.J.; Ratcliffe, R.G. The metabolic flux phenotype of heterotrophic Arabidopsis cells reveals a complex response to changes in nitrogen supply. Plant J. 2013, 74, 569–582. [Google Scholar] [CrossRef] [PubMed]
  8. Andrews, M.; Lea, P.J.; Raven, J.A.; Azevedo, R.A. Nitrogen use efficiency. 3. Nitrogen fixation. Genes and costs. Ann. Appl. Biol. 2009, 155, 1–13. [Google Scholar] [CrossRef]
  9. Meyer, C.; Stitt, M. Nitrate reduction and signaling. In Plant Nitrogen; Lea, P.J., Morot-Gaudry, J.F., Eds.; Springer: Berlin, Germany, 2001; pp. 37–59. ISBN 3-540-67799-2. [Google Scholar]
  10. Britto, D.T.; Kronzucker, H.J. NH4+ toxicity in higher plants: A critical review. J. Plant Physiol. 2002, 159, 567–584. [Google Scholar] [CrossRef]
  11. Esteban, R.; Ariz, I.; Crus, C.; Moran, J.F. Review: Mechanisms of ammonium toxicity and the quest for tolerance. Plant Sci. 2016, 248, 92–101. [Google Scholar] [CrossRef] [PubMed]
  12. Touraine, B. Nitrate uptake by roots—Transporters and root development. In Nitrogen Acquisition and Assimilation in Higher Plants; Amâncio, S., Stulen, I., Eds.; Kluwer Academic Publishers: Dordrecht, The Netherlands, 2004; pp. 1–34. ISBN 1-4020-2727-3. [Google Scholar]
  13. Hachiya, T.; Sakakibara, H. Interactions between nitrate and ammonium in their uptake, allocation, assimilation, and signalling in plants. J. Exp. Bot. 2017, 68, 2501–2512. [Google Scholar] [CrossRef] [PubMed]
  14. O’Brien, J.A.; Vega, A.; Bouguyon, E.; Krouk, G.; Gojon, A.; Coruzzi, G.; Gutiérrez, R.A. Nitrate transport, sensing, and responses in plants. Mol. Plant 2016, 9, 837–856. [Google Scholar] [CrossRef] [PubMed]
  15. Hirel, B.; Le Gouis, J.; Ney, B.; Gallais, A. The challenge of improving nitrogen use efficiency in crop plants: Towards a more central role for genetic variability and quantitative genetics within integrated approaches. J. Exp. Bot. 2007, 58, 2369–2387. [Google Scholar] [CrossRef] [PubMed]
  16. Liu, J.; Han, L.; Chen, F.; Bao, J.; Zhang, F.; Mi, G. Microarray analysis reveals early responsive genes possibly involved in localized nitrate stimulation of lateral root development in maize (Zea mays L.). Plant Sci. 2008, 175, 272–282. [Google Scholar] [CrossRef]
  17. Zamboni, A.; Astolfi, S.; Zuchi, S.; Pii, Y.; Guardini, K.; Tononi, P.; Varanini, Z. Nitrate induction triggers different transcriptional changes in a high and a low nitrogen use efficiency maize inbred line. J. Integr. Plant Biol. 2014, 56, 1080–1094. [Google Scholar] [CrossRef] [PubMed] [Green Version]
  18. Pii, Y.; Alessandrini, M.; Dall’Osto, L.; Guardini, K.; Prinsi, B.; Espen, L.; Zamboni, A.; Varanini, Z. Time-resolved investigation of molecular components involved in the induction of NO3 High Affinity Transport system in maize roots. Front. Plant Sci. 2016, 7, 1657. [Google Scholar] [CrossRef] [PubMed]
  19. Amiour, N.; Imbaud, S.; Clément, G.; Agier, N.; Zivy, M.; Valot, B.; Balliau, T.; Armengaud, P.; Quilleré, I.; Cañas, R.; et al. The use of metabolomics integrated with transcriptomic and proteomic studies for identifying key steps involved in the control of nitrogen metabolism in crops such as maize. J. Exp. Bot. 2012, 63, 5017–5033. [Google Scholar] [CrossRef] [PubMed] [Green Version]
  20. Prinsi, B.; Negri, A.S.; Pesaresi, P.; Cocucci, M.; Espen, L. Evaluation of protein pattern changes in roots and leaves of Zea mays plants in response to nitrate availability by two-dimensional gel electrophoresis analysis. BMC Plant Biol. 2009, 9, 113. [Google Scholar] [CrossRef] [PubMed]
  21. Plénet, D.; Lemaire, G. Relationships between dynamics of nitrogen uptake and dry matter accumulation in maize crops. Determination of critical N concentration. Plant Soil 2000, 216, 65–82. [Google Scholar] [CrossRef]
  22. Schortemeyer, M.; Stamp, P.; Feil, B. Ammonium tolerance and carbohydrate status in maize cultivars. Ann. Bot. 1997, 79, 25–30. [Google Scholar] [CrossRef]
  23. Andrews, M.; Raven, J.A.; Sprent, J.I. Environmental effects on dry matter partitioning between shoot and root of crop plants: Relations with growth and shoot protein concentration. Ann. Appl. Biol. 2001, 138, 57–68. [Google Scholar] [CrossRef]
  24. Cramer, M.D.; Lewis, O.A.M. The influence of NO3 and NH4+ on the carbon and nitrogen partitioning characteristics of wheat (Triticum aestivum L.) and maize (Zea mays L.) plants. Plant Soil 1993, 154, 289–300. [Google Scholar] [CrossRef]
  25. Kronzucker, H.J.; Glass, A.D.M.; Siddiqi, M.Y. Inhibition of nitrate uptake by ammonium in barley. Analysis of the component fluxes. Plant Physiol. 1999, 120, 283–291. [Google Scholar] [CrossRef] [PubMed]
  26. Cerezo, M.; Tillard, P.; Filleur, S.; Muños, S.; Daniel-Vedele, F.; Gojon, A. Major alterations of the regulation of root NO3 uptake are associated with the mutation of Nrt2.1 and Nrt2.2 genes in Arabidopsis. Plant Physiol. 2001, 127, 262–271. [Google Scholar] [CrossRef] [PubMed]
  27. Prinsi, B.; Espen, L. Mineral nitrogen sources differently affect root glutamine synthetase isoforms and amino acid balance among organs in maize. BMC Plant Biol. 2015, 15, 96. [Google Scholar] [CrossRef] [PubMed]
  28. Gilmore, J.M.; Washburn, M.P. Advances in shotgun proteomics and the analysis of membrane proteomes. J. Proteom. 2010, 73, 2078–2091. [Google Scholar] [CrossRef] [PubMed]
  29. Wang, R.; Okamoto, M.; Xing, X.; Crawford, N.M. Microarray analysis of the nitrate response in Arabidopsis roots and shoots reveals over 1000 rapidly responding genes and new linkages to glucose, trehalose-6-phosphate, iron and sulphate metabolism. Plant Physiol. 2003, 132, 556–567. [Google Scholar] [CrossRef] [PubMed]
  30. Patterson, K.; Cakmak, T.; Cooper, A.; Larger, I.; Rasmusson, A.G.; Escobar, M.A. Distinct signalling pathways and transcriptome response signatures differentiate ammonium- and nitrate-supplied plants. Plant Cell Environ. 2010, 33, 1486–1501. [Google Scholar] [CrossRef] [PubMed]
  31. Suzuki, A.; Oaks, A.; Jacquot, J.-P.; Vidal, J.; Gadal, P. An electron transport system in maize roots for reactions of glutamate synthase and nitrite reductase. Plant Physiol. 1985, 78, 374–378. [Google Scholar] [CrossRef] [PubMed]
  32. Redinbaugh, M.G.; Campbell, W.H. Higher plant responses to environmental nitrate. Physiol. Plant. 1991, 82, 640–650. [Google Scholar] [CrossRef]
  33. Cren, M.; Hirel, B. Glutamine synthetase in higher plants: Regulation of gene and protein expression from the organ to cell. Plant Cell Physiol. 1999, 40, 1187–1193. [Google Scholar] [CrossRef]
  34. Lea, P.J.; Sodek, L.; Parry, M.A.J.; Shewry, P.R.; Halford, N.G. Asparagine in plants. Ann. Appl. Biol. 2007, 150, 1–26. [Google Scholar] [CrossRef] [Green Version]
  35. Fritz, C.; Palacios-Rojas, N.; Feil, R.; Stitt, M. Regulation of secondary metabolism by the carbon-nitrogen status in tobacco: Nitrate inhibits large sectors of phenylpropanoid metabolism. Plant J. 2006, 46, 533–548. [Google Scholar] [CrossRef] [PubMed]
  36. Amunts, A.; Nelson, N. Functional organization of a plant Photosystem I: Evolution of a highly efficient photochemical machine. Plant Physiol. Biochem. 2008, 46, 228–237. [Google Scholar] [CrossRef] [PubMed]
  37. Allahverdiyeva, Y.; Suorsa, M.; Rossi, F.; Pavesi, A.; Kater, M.M.; Antonacci, A.; Tadini, L.; Pribil, M.; Schneider, A.; Wanner, G.; et al. Arabidopsis plants lacking PsbQ and PsbR subunits of the oxygen-evolving complex show altered PSII super-complex organization and short-term adaptive mechanisms. Plant J. 2013, 75, 671–684. [Google Scholar] [CrossRef] [PubMed] [Green Version]
  38. Wollman, F.-A. State transitions reveal the dynamics and flexibility of the photosynthetic apparatus. EMBO J. 2001, 20, 3623–3630. [Google Scholar] [CrossRef] [PubMed]
  39. Chen, Y.-B.; Lu, T.-C.; Wang, H.-X.; Shen, J.; Bu, T.-T.; Chao, Q.; Gao, Z.-F.; Zhu, X.-G.; Wang, Y.-F.; Wang, B.-C. Posttranslational modification of maize chloroplast pyruvate orthophosphate dikinase reveals the precise regulatory mechanism of its enzymatic activity. Plant Physiol. 2014, 165, 534–549. [Google Scholar] [CrossRef] [PubMed]
  40. Flügge, U.-I. Phosphate translocators in plastids. Annu. Rev. Plant Physiol. Plant Mol. Biol. 1999, 50, 27–45. [Google Scholar] [CrossRef] [PubMed]
  41. Hammargren, J.; Sundström, J.; Johansson, M.; Bergman, P.; Knorpp, C. On the phylogeny, expression and targeting of plant nucleoside diphosphate kinases. Physiol. Plant. 2007, 129, 79–89. [Google Scholar] [CrossRef]
  42. Redinbaugh, M.G.; Campbell, W.H. Nitrate regulation of the oxidative pentose phosphate pathway in maize (Zea mays L.) root plastids: Induction of 6-phosphogluconate dehydrogenase activity, protein and transcript levels. Plant Sci. 1998, 134, 129–140. [Google Scholar] [CrossRef]
  43. Esposito, S.; Guerriero, G.; Vona, V.; Di Martino Rigano, V.; Carfagna, S.; Rigano, C. Glutamate synthase activities and protein changes in relation to nitrogen nutrition in barley: The dependence on different plastidic glucose-6P dehydrogenase isoforms. J. Exp. Bot. 2005, 56, 55–64. [Google Scholar] [CrossRef] [PubMed]
  44. Fernie, A.R.; Carrari, F.; Sweetlove, L.J. Respiratory metabolism: Glycolysis, the TCA cycle and mitochondrial electron transport. Curr. Opin. Plant Biol. 2004, 7, 254–261. [Google Scholar] [CrossRef] [PubMed]
  45. Britto, D.T.; Kronzucker, H.J. Nitrogen acquisition, PEP carboxylase, and cellular pH homeostasis: New views on old paradigms. Plant Cell Environ. 2005, 28, 1396–1409. [Google Scholar] [CrossRef]
  46. Coskun, D.; Britto, D.V.; Kronzucker, H.J. The nitrogen-potassium intersections: Membranes, metabolism, and mechanism. Plant Cell Environ. 2017, 40, 2029–2041. [Google Scholar] [CrossRef] [PubMed]
  47. Coskun, D.; Britto, D.T.; Li, M.; Oh, S.; Kronzucker, H.J. Capacity and plasticity of potassium channels and high-affinity transporters in roots of barley and Arabidopsis. Plant Physiol. 2013, 162, 496–511. [Google Scholar] [CrossRef] [PubMed]
  48. Maurel, C.; Verdoucq, L.; Luu, D.-T.; Santoni, V. Plant aquaporins: Membrane channels with multiple integrated functions. Annu. Rev. Plant Biol. 2008, 59, 595–624. [Google Scholar] [CrossRef] [PubMed]
  49. Gorska, A.; Zwieniecka, A.; Holbrook, N.M.; Zwieniecki, M.A. Nitrate induction of root hydraulic conductivity in maize is not correlated with aquaporin expression. Planta 2008, 228, 989–998. [Google Scholar] [CrossRef] [PubMed]
  50. Loqué, D.; Ludewig, U.; Yuan, L.; von Wirén, N. Tonoplast intrinsic proteins AtTIP2;1 and AtTIP2;3 facilitate NH3 transport into the vacuole. Plant Physiol. 2005, 137, 671–680. [Google Scholar] [CrossRef] [PubMed]
  51. Stiefel, V.; Ruiz-Avila, L.; Raz, R.; Pilar Vallés, M.; Gómez, J.; Pagés, M.; Martinez-Izquierdo, J.A.; Ludevid, M.D.; Langdale, J.A.; Nelson, T.; Puigdomènech, P. Expression of a maize cell wall hydroxyproline-rich glycoprotein gene in early leaf and root vascular differentiation. Plant Cell 1990, 2, 785–793. [Google Scholar] [CrossRef] [PubMed]
  52. Held, B.M.; Wang, H.; John, I.; Syrkin Wurtele, E.S.; Colbert, J.T. An mRNA putatively coding for an O-methyltransferase accumulates preferentially in maize roots and is located predominantly in the region of the endodermis. Plant Physiol. 1993, 102, 1001–1008. [Google Scholar] [CrossRef] [PubMed]
  53. Scheible, W.R.; Morcuende, R.; Czechowski, T.; Fritz, C.; Osuna, D.; Palacio-Rojas, N.; Schindelasch, D.; Thimm, O.; Udvardi, M.K.; Stitt, M. Genome-wide reprogramming of primary and secondary metabolism, protein synthesis, cellular growth processes, ant the regulatory infrastructure of Arabidopsis in response to nitrogen. Plant Physiol. 2004, 136, 2483–2499. [Google Scholar] [CrossRef] [PubMed]
  54. Barakat, A.; Szick-Miranda, K.; Chang, I.-F.; Guyot, R.; Blanc, G.; Cooke, R.; Delseny, M.; Bailey-Serres, J. The organization of cytoplasmic ribosomal protein genes in the Arabidopsis genome. Plant Physiol. 2001, 127, 398–415. [Google Scholar] [CrossRef] [PubMed]
  55. Sormani, R.; Masclaux-Daubresse, C.; Daniel-Vedele, F.; Chardon, F. Transcriptional regulation of ribosome components are determined by stress according to cellular compartment in Arabidopsis thaliana. PLoS ONE 2011, 6, e28070. [Google Scholar] [CrossRef] [PubMed]
  56. Carroll, A.J. The Arabidopsis cytosolic ribosomal proteome: From form to function. Front. Plant Sci. 2013, 4, 32. [Google Scholar] [CrossRef] [PubMed]
  57. Schiene, C.; Fischer, G. Enzymes that catalyse the restructuring of proteins. Curr. Opin. Struct. Biol. 2000, 10, 40–45. [Google Scholar] [CrossRef]
  58. Marivet, J.; Frenso, P.; Burkard, G. Effects of abiotic stresses on cyclophilin gene expression in maize and bean and sequence analysis of bean cyclophilin cDNA. Plant Sci. 1992, 84, 171–178. [Google Scholar] [CrossRef]
  59. Lee, J.-P.; Palfrey, H.C.; Bindokas, V.P.; Ghadge, G.D.; Ma, L.; Miller, R.J.; Roos, R.P. The role of immunophilins in mutant superoxide dismutase-1-linked familial amylotrophic lateral sclerosis. Proc. Natl. Acad. Sci. USA 1999, 96, 3251–3256. [Google Scholar] [CrossRef] [PubMed]
  60. Colas des Francs-Small, C.; Ambard-Breteville, F.; Small, F.; Rémy, R. Identification of a major soluble protein in mitochondria from nonphotosynthetic tissues as NAD-dependent formate dehydrogenase. Plant Physiol. 1993, 102, 1171–1177. [Google Scholar] [CrossRef] [PubMed] [Green Version]
  61. Hanson, A.D.; Gage, D.A.; Shachar-Hill, Y. Plant one-carbon metabolism and its engineering. Trends Plant Sci. 2000, 5, 206–213. [Google Scholar] [CrossRef]
  62. Lou, H.Q.; Gong, Y.L.; Fan, W.; Xu, J.M.; Liu, Y.; Cao, M.J.; Wang, M.-H.; Yang, J.L.; Zheng, S.J. A formate dehydrogenase confers tolerance to aluminum and low pH. Plant Physiol. 2016, 171, 294–305. [Google Scholar] [CrossRef] [PubMed]
  63. Porta, H.; Rocha-Sosa, M. Plant lipoxygenases. Physiological and molecular features. Plant Physiol. 2002, 130, 15–21. [Google Scholar] [CrossRef] [PubMed]
  64. Shigeto, J.; Tsutsumi, Y. Diverse functions and reactions of class III peroxidases. New Phytol. 2016, 209, 1395–1402. [Google Scholar] [CrossRef] [PubMed]
  65. Cataldo, D.A.; Maroon, M.; Schrader, L.E.; Youngs, V.L. Rapid colorimetric determination of nitrate in plant tissue by nitration of salicylic acid. Commun. Soil Sci. Plant Anal. 1975, 6, 71–80. [Google Scholar] [CrossRef]
  66. Coskun, D.; Britto, D.T.; Jean, Y.-K.; Schulze, L.M.; Backer, A.; Kronzucker, H.J. Silver ions disrupt K+ homeostasis and cellular integrity in intact barley (Hordeum vulgare L.) roots. J. Exp. Bot. 2012, 63, 151–162. [Google Scholar] [CrossRef] [PubMed]
  67. Moore, S.; Stein, W.H. A modified ninhydrin reagent for the photometric determination of amino acids and related compounds. J. Biol. Chem. 1954, 211, 907–913. [Google Scholar] [PubMed]
  68. Nelson, N. A photometric adaptation of the Somogy method for the determination of glucose. J. Biol. Chem 1944, 153, 375–380. [Google Scholar]
  69. Mariotti, F.; Tomé, D.; Patureau Mirand, P. Converting nitrogen into protein—Beyond 6.25 and Jones’ factors. Crit. Rev. Food Sci. 2008, 48, 177–184. [Google Scholar] [CrossRef] [PubMed]
  70. Laemmli, U.K. Cleavage of structural proteins during the assembly of the head of bacteriophage T4. Nature 1970, 227, 680–685. [Google Scholar] [CrossRef] [PubMed]
Figure 1. Plant growth evaluated as the fresh biomass of roots (A) and leaves (B) per plant (g FW plant1). Maize plants were collected at t0 (white bar) or after 6 h (light grey bars), 30 h (grey bars) and 54 h (dark grey bars) of growth in the presence of 5 mM NO3 (n), 5 mM NH4+ (a) and of 2.5 mM NO3 + 2.5 mM NH4+ (na). Values are the mean ± standard error (SE) (n = 8). The statistical significance was assessed by analysis of variance (ANOVA) test (p < 0.05, Tukey post hoc method).
Ijms 19 02202 g001
Figure 2. Content of NO3, NH4+ and amino acids in roots and leaves. The graphs report the content of NO3 in roots (A) and in leaves (B); the content of NH4+ in roots (C) and in leaves (D); the content of amino acids in roots (E) and in leaves (F). Maize plants were collected at t0 (white bar) or after 6 h (light grey bars), 30 h (grey bars), and 54 h (dark grey bars) of growth in presence of 5 mM NO3 (n), 5 mM NH4+ (a), and 2.5 mM NO3 + 2.5 mM NH4+ (na). Values are the mean ± SE (n = 3). The statistical significance was assessed by ANOVA test (p < 0.05, Tukey post hoc method).
Ijms 19 02202 g002
Figure 3. Contents of sucrose (A,B) and reducing sugars (C,D) in roots (A,C) and leaves (B,D). Maize plants were collected at t0 (white bar) or after 6 h (light grey bars), 30 h (grey bars), or 54 h (dark grey bars) of growth in presence of 5 mM NO3 (n), 5 mM NH4+ (a) and 2.5 mM NO3 + 2.5 mM NH4+ (na). Values are the mean ± SE (n = 3). The statistical significance was assessed by ANOVA test (p < 0.05, Tukey post hoc method).
Ijms 19 02202 g003
Figure 4. Abundance of the differentially accumulated proteins in maize roots. Maize plants were exposed for 6, 30, and 54 h to the presence of 5 mM NO3 (n), 5 mM NH4+ (a), and 2.5 mM NO3 + 2.5 mM NH4+ (na). The image was obtained by means of the PermutMatrix graphical interface after Z-score normalization of the averages of protein Spectrum Intensity % (%SI, n = 3). Each colored cell represents the average of the %SI according to the color scale.
Ijms 19 02202 g004
Figure 5. Abundance of the differentially accumulated proteins in maize leaves. Maize plants were exposed for 6, 30, and 54 h to the presence of 5 mM NO3 (n), 5 mM NH4+ (a), and 2.5 mM NO3 + 2.5 mM NH4+ (na). The image was obtained by means of the PermutMatrix graphical interface after Z-score normalization of the averages of protein Spectrum Intensity % (%SI, n = 3). Each colored cell represents the average of the %SI according to the color scale.
Ijms 19 02202 g005
Figure 6. Functional distribution of the differentially accumulated proteins in maize plants. The proteins differentially accumulated were grouped in classes according to literature and GeneBank. (A) Proteins differentially accumulated in roots; (B) proteins differentially accumulated in leaves. The functional distribution indicates the percentage of each class as compared to the total number of proteins differentially accumulated.
Ijms 19 02202 g006
Figure 7. Classification of the differentially accumulated proteins according to the main source of variation in roots (A) and in leaves (B). The proteins differentially accumulated, sorted in functional classes, are categorized in two groups: proteins whose changes were specifically related to the N source (dark grey bars) and proteins whose changes were not related to N sources, but to other factors, such as time and the total N availability (light grey bars).
Ijms 19 02202 g007
Table 1. Total nitrogen (N) in plants and the ratio between the inorganic and organic forms in roots and leaves. Maize plants were collected at t0 and after 6 h, 30 h, and 54 h of growth in presence of 5 mM NO3 (n), 5 mM NH4+ (a), and 2.5 mM NO3 + 2.5 mM NH4+ (na). Values are the mean ± SE (n = 3). The statistical significance was assessed by ANOVA test (p < 0.05, Tukey post hoc method).
ConditionTime (h)Total N Plant−1
(mg g−1 FW)
Inorganic N/Organic N
Roots
Inorganic N/Organic N
Leaves
03.37 ± 0.02 (a)0.50 ± 0.07 (bc)0.24 ± 0.03 (abc)
Nitrate
(n)
63.73 ± 0.06 (ab)0.80 ± 0.01 (de)0.23 ± 0.01 (ab)
304.25 ± 0.10 (cd)1.28 ± 0.10 (f)0.26 ± 0.02 (bc)
544.38 ± 0.10 (cd)0.91 ± 0.07 (e)0.34 ± 0.01 (c)
Ammonium
(a)
64.13 ± 0.04 (bc)0.49 ± 0.08 (bc)0.28 ± 0.01 (bc)
304.55 ± 0.03 (de)0.34 ± 0.03 (ab)0.21 ± 0.01 (ab)
544.50 ± 0.06 (cde)0.13 ± 0.01 (a)0.14 ± 0.01 (a)
Nitrate + Ammonium
(na)
64.34 ± 0.14 (cd)0.74 ± 0.02 (cde)0.28 ± 0.03 (bc)
304.90 ± 0.10 (e)0.74 ± 0.07 (cde)0.28 ± 0.02 (bc)
544.60 ± 0.06 (de)0.61 ± 0.04 (bcd)0.30 ± 0.04 (bc)
Table 2. Evaluation of the comparative proteomic analyses in roots and leaves of maize.
ParameterRootLeaf
n. of total peptides39,51631,739
Average of peptides per sample (±SE, n = 27) 1464 ± 151176 ± 11
Average of peptides per condition (±SE, n = 9)4391 ± 553527 ± 50
Average of unique peptide per protein (±SE)6.8 ± 0.36.4 ± 0.4
Average amino acid coverage % (±SE)22.5 ± 0.822.4 ± 0.9
n. of identified proteins336246
n. of differentially accumulated proteins (%)51 (15%)48 (19%)
Table 3. Proteins differentially accumulated in root proteome. Proteins are grouped according to the functional classifications. FC: maximum fold change among conditions, n.d.: not detectable, the protein was absent in at least one condition. V: main source of variation (two-way ANOVA, p < 0.05); t: time, s: N source; i: interaction. Differences: h: hours of exposure to 5 mM NO3 (n), 5 mM NH4+ (a), and 2.5 mM NO3 + 2.5 mM NH4+ (na). a: annotated by basic local alignment search tool (BLAST). Different letters indicate significant difference (* p < 0.05, Tukey post-hoc); letters are arranged in ascending order according to the increase in protein abundance. Bold letters indicate significant difference within each N source. NADH: Nicotinamide adenine dinucleotide; NADP: Nicotinamide adenine dinucleotide phosphate; PIP: plasma membrane intrinsic proteins; TIP: tonoplast intrinsic proteins.
IDEntry—Protein NameFC Differences
Vh (n)h (a)h (na)
tsi063054063054063054
Nitrogen assimilation
R74B6SY01—Ferredoxin-nitrite reductase7.57 *abcdcdabcabaabcbcdabc
R64B4FR61—Glutamine synthetase (cytosol)2.60 *aaaabccaacb
R189A0A1D6NFK0—Glutamate synthase 1 [NADH] chloroplastic8.54** aabaaabbaaab
R103B5U8J8—Asparagine synthetasen.d. *aaaabcaaa
R68B4G043—Ferredoxin-NADP reductase5.48 *cbcbccbabacbababc
Amino acid metabolism
R6B6U4D6—Phenylalanine ammonia-lyase2.88 *bcabcbcbcaacabcab
R107P80608—Cysteine synthase2.74 *abcabababcabcabc
R49A0A1D6FUX8S-adenosylmethionine synthase2.16* baababababbabab
R96K7TSD2—Serine hydroxymethyltransferase2.08* bababababaabaa
Carbon metabolism
R207C0PMR3—Glucose-6-phosphate 1-dehydrogenase (cytosol)7.66* abbabaababababab
R85A0A1D6J424—Glucose-6-phosphate 1-dehydrogenase (chloroplast)224 * abbababaaababab
R57A0A1D6NVZ7—Transketolase 12.98** abaababaababa
R231Q8L5G8—Phosphotransferase7.59* abbabaababaabab
R168A0A1D6NR86—Pyrophosphate-fructose 6-phosphate 1-phosphotransferase subunit beta2.85 *ababaaaabab
R243B4F820—Triosephosphate isomerase a3.67* aababcaabcabcabcbc
R19C0HHU2—2,3-bisphosphoglycerate-independent phosphoglycerate mutase 12.35 *aababaabcaacb
R119A0A1D6H4C4—Citrate synthase2.87 *ababaaabbaaba
R28Q9SAZ6—Phosphoenolpyruvate carboxylase3.20** aabaababbaabab
Cell water homeostasis
R290B6T7A1—Voltage-gated potassium channel beta subunit2.21** abcbcabababaabcabc
R127B6T634—Aquaporin PIP2.12.75 *ababbababaabbb
R193A0A1R3N4Y1—Aquaporin PIP2-55.52** aabccababcababcabcbc
R285B6TNY0—Aquaporin TIP2.12.81** ababbabaabababab
Cell wall metabolism
R92A0A1D6IMH7—Hydroxyproline-rich glycoprotein family protein4.07 *baaababababaab
R154B6UD26O-methyltransferase ZRP43.66 *abababaabababab
Protein synthesis and folding
R58C0PCQ6—40S ribosomal protein S2-13.21* caabbcabcabcbcababc
R255A0A1D6PYT7—Ribosomal protein S252.80 *bcababcabcaabcabab
R309A0A1D6FKZ4—60S acidic ribosomal protein P2-56.66* ababababaababab
R87C4JA45—60S ribosomal protein L5-1 homolog b2.52* abbababbabbab
R122B6T267—Ribosomal protein L1518.7* bcababccabcabcabcaabc
R4B7ZZ42—Heat shock 70 kDa protein 32.25 *bcaabcbcabcabcaab
R100B6U0V6—Endoplasmin5.19* abababaabaabbab
R188B6SXW8—RuBisCO large subunit-binding protein sub. alpha3.92* aababaabaabab
R297A0A1D6FAH0—T-complex protein 1 subunit epsilon4.66* ababaababaabbab
R131B4FZZ2—Peptidyl-prolyl cis-trans isomerase4.68* caabcaabbcaab
R216A0A1D6LN79—Peptidyl-prolyl cis-trans isomerase15.7* daabccdabcdabcdbcdababcd
R145A0A1D6F8L7—Coatomer subunit gamma3.43* aababaaaaba
R205A0A1D6PJW1—Proteasome subunit alpha typen.d.** aaabaaaaa
R230B4FB55—Ras-related protein ARA-32.40** abbbaabababbab
Stress response and other functions
R105C0P848—Formate dehydrogenase, mitochondrial14.2* aaaaabaabab
R99B8A2B4—Guanine nucleotide-binding protein beta subunit-like protein a2.22* abcacababcbcabbc
R112A5H452—Peroxidase 702.75* caabcabcabcabcbcabab
R133A0A1D6E530—Peroxidase3.56* abbababababaabab
R300B6SIU4—Peroxidasen.d. *bcabcabcabaabcabcab
R31C0PH85—Tubulin beta chain2.88** dcbcbcabacbcabc
R79Q6RW10—Allene oxide synthase2.27 *ababaababababab
R225A0A1D6HSR3—Putative carboxylesterase 15n.d. *aaaabcaabb
R236A0A1D6QNT6—Peroxisomal fatty acid beta-oxidation multifunctional protein a3.86* aababababababab
R271Q71RX2—Isopentenyl pyrophosphate isomerasen.d.** abcbcaabcabcabcbc
R272B6TKK2—Gibberellin receptor GID1L2n.d.* ababbabababaaab
R301B6TP36—Prohibitin3.56* abbcabcaabcabcabcabc
R318B6T7H0—Glutathione S-transferase 6n.d. *aabbaaaaaa
Table 4. Proteins differentially accumulated in leaf proteome. Proteins are grouped according to the functional classifications. FC: maximum fold change among conditions, n.d.: not detectable, the protein was absent in at least one condition. V: main source of variation (two-way ANOVA, p < 0.05); t: time, s: N source; i: interaction. Differences: h: hours of exposure to 5 mM NO3 (n), 5 mM NH4+ (a), and 2.5 mM NO3 + 2.5 mM NH4+ (na). a: annotated by BLAST. Different letters indicate significant difference (* p < 0.05, Tukey post-hoc); letters are arranged in ascending order according to the increase in protein abundance. Bold letters indicate significant difference within each N source. ATP: adenosine triphosphate; HSP: heat shock protein.
IDEntry—Protein NameFC Differences
Vh (n)h (a)h (na)
tsi063054063054063054
Nitrogen assimilation
L149B6SY01—Ferredoxin-nitrite reductase3.00* aabbaaababaab
L177B6TE43—Glutamine synthetase (chloroplast)3.92* ababababaababa
Amino acid metabolism
L193B6TQ06—Aminomethyltransferase2.31* ababbabaabababab
L22C0P5Y3—5-methyltetrahydropteroyltriglutamate -homocysteine methyltransferase 1 (MetE)3.57* abaabababbababab
L194A0A1D6KDZ0—Shikimate kinase family protein2.85* abcabcababcabcabc
Photosynthesis
L31P04966—Photosystem I P700 chlorophyll a apoprotein A12.48* aabbabababbab
L85P04967—Photosystem I P700 chlorophyll a apoprotein A22.62 *abcababcabababab
L132B6U534—Photosystem I reaction center subunit V3.85* ccabccabcbcab
L196B4FLT7—Photosystem I H subunit12.99** bcddababccdaabbcda
L113B6SP64—Oxygen evolving enhancer protein 3 containing protein2.34* aabaabaab
L162B8A3D1—Pyruvate phosphate dikinase regulatory protein, chloroplastic a6.68* aaabaabaaab
L212B6TKB3—Triose phosphate/phosphate translocator, non-green plastid, chloroplastn.d.* aaabaabaab
Energy metabolism
L115B6T908—ATP synthase B chain8.19** ababccaababcababcbc
L225B6SP77—ATP synthase C chain77.8* aabaaabaaab
L155B6T168—ATP synthase epsilon chain3.09* aabcbcaabcbcabcabc
L130B4FK49—Nucleoside diphosphate kinase4.88** aababcabcabcbcabcabc
L236C0HHC4—Nucleoside diphosphate kinase7.24* aabaabaab
Carbon metabolism
L192A0A1D6N8I0—2,3-bisphosphoglycerate-independent phosphoglycerate mutase 14.77* abaababababababb
L191B8A0W7—Enolase 1 a13.1* aaabcababcaac
L110B4FZU8—Malate dehydrogenase2.31* aabaabaab
Protein synthesis and folding
L69A0A0B4J303—Eukaryotic initiation factor4a3.01* abcaabcababbcabac
L111A0A1D6LAB8—RNA helicase43.98 *aaaaaaaab
L205A0A1X7YHC0—30S ribosomal protein S2, chloroplastic an.d.* ababaababababa
L127C0PEC4—30S ribosomal protein S5 chloroplastic4.70* ababbababababab
L211P08530—30S ribosomal protein S8, chloroplastic3.27* ababcababbcabac
L137B4FR40—30S ribosomal protein S9 chloroplasticn.d.* abaaabbaababa
L145B6UGL6—40S ribosomal protein S52.27** aabaabaab
L118A0A1D6P3R8—40S ribosomal protein S142.15 *abaababbabaabab
L88B6SNQ7—40S ribosomal protein S16n.d. *aaabaababaab
L171B6UF84—50S ribosomal protein L32.23* abaababababababb
L195B6SK79—60S ribosomal protein L43.28* abaabababababbb
L216B6SHW0—60S ribosomal protein L62.33* aaababaabaabb
L126A0A1D6GM13—60S ribosomal protein L10 a2.40* abaabababababab
L239B6TM00—60 ribosomal protein L142.66** ababcbcbcbcababc
L240B6SJH2—60S ribosomal protein L172.65* aabaabaab
L15A0A1X7YIM9—RuBisCO large subunit-binding protein subunit alpha, chloroplastic a2.10* cabccabcccabc
L19B7ZZ42—Heat shock 70 kDa protein 32.73 * abaababbabbabb
L64C3UZ63—HSP protein6.72* abcacbabcabcbcababcc
L70A0A1D6LIK1—Peptidyl-prolyl cis-trans isomerase2.04* dabcdacdabcabbcdabcda
L204B4FZZ2—Peptidyl-prolyl cis-trans isomerasen.d.* baacaabcaa
L243A0A1D6FAW5—Peptidyl-prolyl cis-trans isomerasen.d.* baabaabaa
L154B6TCN7—Threonine endopeptidase3.58 *aababcaacababc
Stress response and other functions
L76A1XCI5—Lipoxygenase4.44** aaaaabaaab
L189B6T2W9—Thylakoid lumenal 19 kDa protein2.84 *baabaabababaab
L201B6SU36—Thylakoid lumenal 16.5 kDa protein10.3 *aabbabaabababab
L143B6T7W8—Cortical cell-delineating protein2.57* ababababbabab
L180K7UGI3—Putative thioredoxin superfamily protein4.52* abcabcdabcdabcdabad
L208C4J9Y2—Aluminum-induced protein homolog110.5* ababaaababaab

