Article

Sequencing, Characterization, and Comparative Analyses of the Plastome of Caragana rosea var. rosea

Key Laboratory of Bioactive Substances and Resource Utilization of Chinese Herbal Medicine from Ministry of Education, Institute of Medicinal Plant Development, Chinese Academy of Medical Sciences, Peking Union Medical College, Beijing 100193, China
*
Author to whom correspondence should be addressed.
Int. J. Mol. Sci. 2018, 19(5), 1419; https://doi.org/10.3390/ijms19051419
Submission received: 23 April 2018 / Revised: 6 May 2018 / Accepted: 7 May 2018 / Published: 9 May 2018
(This article belongs to the Special Issue Chloroplast)

Abstract

:
To exploit the drought-resistant Caragana species, we performed a comparative study of the plastomes from four species: Caragana rosea, C. microphylla, C. kozlowii, and C. Korshinskii. The complete plastome sequence of the C. rosea was obtained using the next generation DNA sequencing technology. The genome is a circular structure of 133,122 bases and it lacks inverted repeat. It contains 111 unique genes, including 76 protein-coding, 30 tRNA, and four rRNA genes. Repeat analyses obtained 239, 244, 258, and 246 simple sequence repeats in C. rosea, C. microphylla, C. kozlowii, and C. korshinskii, respectively. Analyses of sequence divergence found two intergenic regions: trnI-CAU-ycf2 and trnN-GUU-ycf1, exhibiting a high degree of variations. Phylogenetic analyses showed that the four Caragana species belong to a monophyletic clade. Analyses of Ka/Ks ratios revealed that five genes: rpl16, rpl20, rps11, rps7, and ycf1 and several sites having undergone strong positive selection in the Caragana branch. The results lay the foundation for the development of molecular markers and the understanding of the evolutionary process for drought-resistant characteristics.

1. Introduction

The genus Caragana has more than 100 species and it belongs to the family of Leguminosae. The plants mainly grow in arid and semi-arid areas of Asia and Europe. Plants from this genus are well-known in resisting drought, barren, cold, and heat, and have a strong adaptability to the sand environment to prevent wind and fixate sand [1]. Sixty two species of Caragana are distributed in China [2], most of them can afforest barren hills and preserve water and soil. The distributions of several Caragana species have been well-studied in China. C. microphylla and C. korshinskii are distributed in Northeast China, North China, and Northwest China [3]. C. microphylla is adapted to the typical steppe zone, forest steppe zone, and deciduous broad-leaved forest steppe zone of the Mongolian plateau. C. korshinskii is suitable for the fixed and semi fixed sand land in the steppe desert and the typical desert belt zone. C kozlowii origins in the Lancang River and Tibet, and was mostly found in riverside with 3600–4000 m altitude [4]. C rosea is mainly from Northeast China, North China, East China, Henan, and southern Gansu Province, growing in slopes and valleys [5]. In addition to its drought adaptability, its medicinal value, such as strengthening the spleen and tonifying the kidney, was also well known [1]. Furthermore, it was shown that chemical constituents in C. rosea have anti-HIV activities [6]. Until now, the plastome of C. korshinskii, C. microphylla, and C. kozlowii were reported, while the plastome of C. rosea has not been studied.
Plants live in constantly changing environments that impose many biotic stress, such as pathogen infection and herbivore attack and abiotic stress, such as drought, heat, cold, nutrient deficiency, and excess of salt or toxic metals. Through the past years, many abiotic stress signaling and response pathways in plants have been discovered, with the core pathways involve protein kinases related to the yeast SNF1 and mammalian AMPK [7]. There is also research from the evolution of chloroplast genes adapted to contrasting habitats. For example, the Cardamine resedifolia plastid gene has undergone a more aggressive positive selection than Cardamine impatiens, which is located at lower elevations, which is why it is more adapted to the plateau environment [8,9]. For Caragana species, dozens of studies have been carried out on the morphological changes, such as stomatal status, leaf water state, cellular carbon metabolism, and etc., in drought responses [3,10]. However, little studies have been reported on the molecular bases for the stress responses in Caragana species at this time.
Different species of Caragana exhibit significantly varied abilities in drought resistance. For example, C. rosea, C. microphylla, C. korshinskii, and C. kozlowii have been evaluated for their strength of drought resistance based on leaf microstructure analysis, the drought resistance order from large to small is C. korshinskii > C. microphylla > C. rosea > C. kozlowii [11]. Furthermore, C. microphylla and C. korshinskii are closed related phylogenatically but difficult to differentiate morphologically [1,3]. Therefore, it is important to develop molecular markers to distinguish species accurately and to promote the rational use of species.
The plastome is an ideal choice for the development of molecular markers. It has many biological characteristics when compared with the nuclear genome, such as uni-parental inheritance, simpler structure, and being easier to obtain. Moreover, it provides more genetic information than a single gene/locus, resulting in much higher resolution in distinguishing closely related species. Furthermore, the plastome contains a series of genes that are related to photosynthesis, and the photosystem II (PSII) is a key part of drought stress, high temperature, and many other stresses [12,13]. Leaf physiological characteristics, such as photosynthetic capacity, which is related to the plastome function, and stomatal conductance, are the fixed indicators of water-use efficiency [14]. The water-use efficiency is critical for plants to cope with drought stress [15]. Therefore, a comparative analysis of the plastome of Caragana would shed light into the molecular bases for their tolerance drought.
Here, the complete plastome of C. rosea was sequenced and analyzed, which complements the plastid genome database of environmental stresses-resistant plants. Comparative analyses of the plastomes from C. rosea and other three Caragana species e.g., C. korshinskii, C. microphylla, and C. kozlowii were performed. The results that were obtained here provided valuable resources to illustrate molecular mechanisms that are related to drought resistance of C. rosea, to carry out chloroplast genetic engineering experiments and to select for plant individuals with favorable characteristics using molecular breeding. Furthermore, the results also provide useful information for future phylogenetic and taxonomic studies in the Caragana species.

2. Results

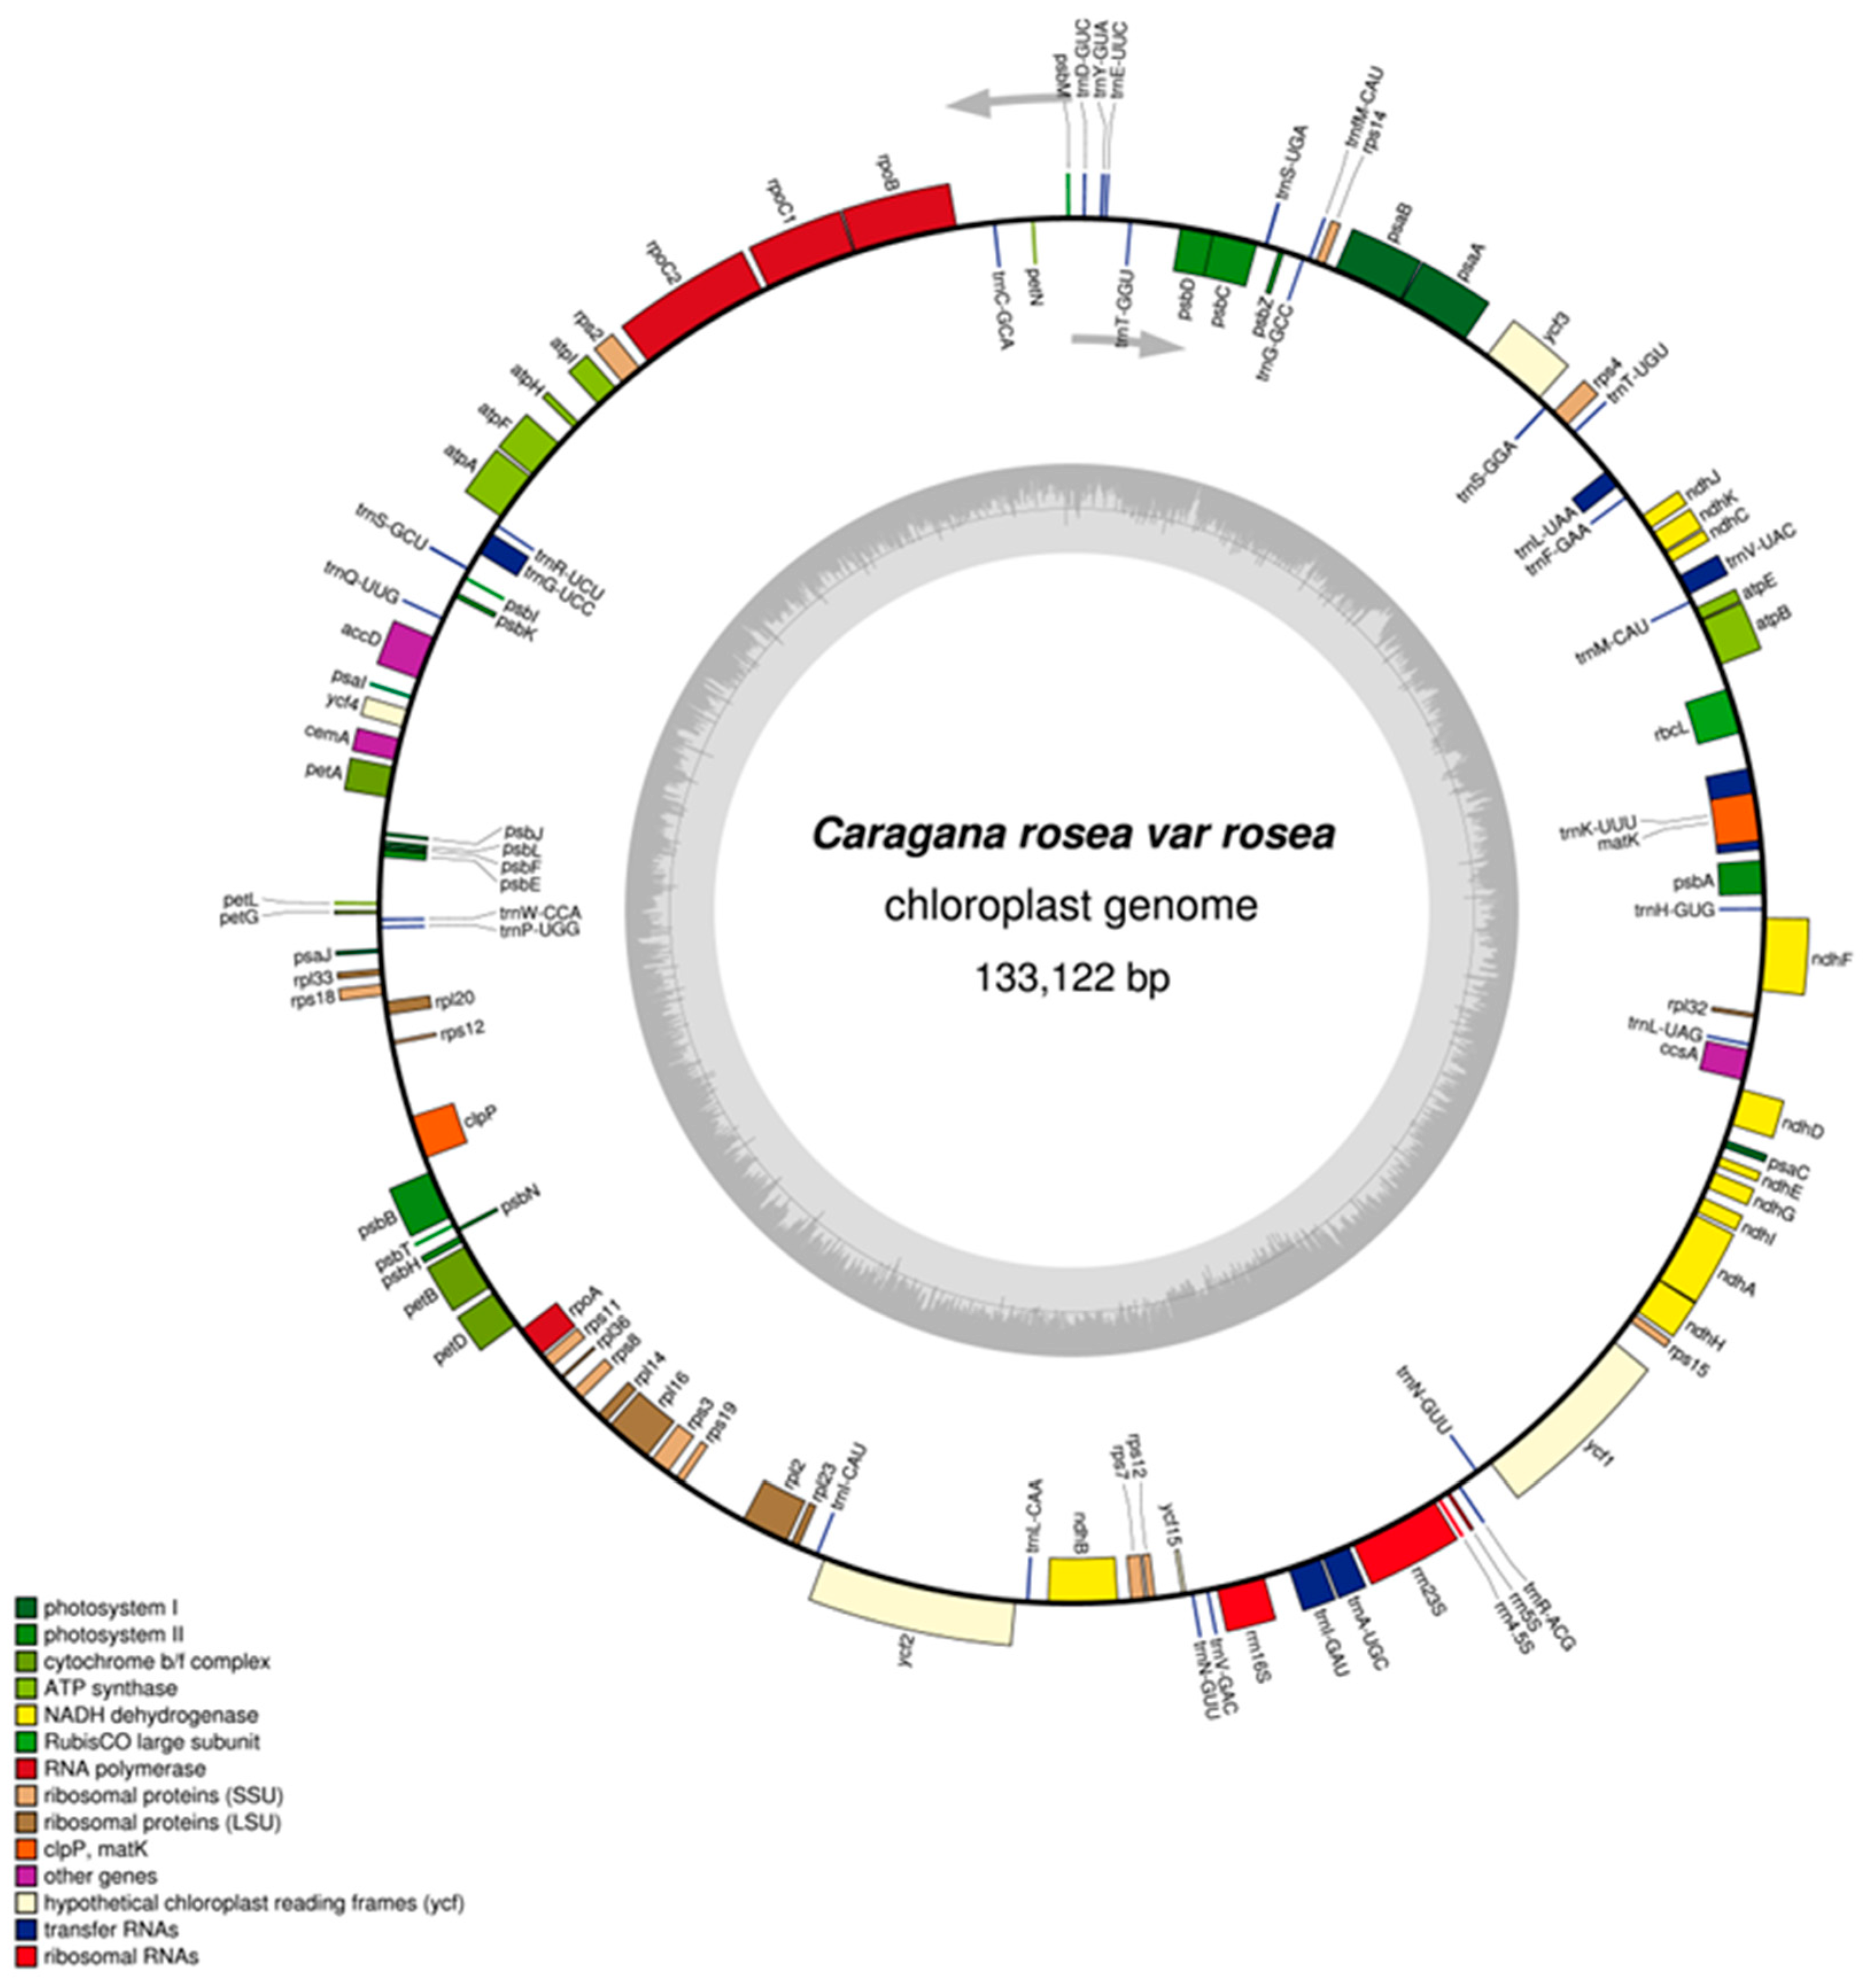
2.1. General Features of the Plastome

The complete plastome of C. rosea var. rosea is 133,122 bases in length and it lacks inverted repeat (Figure 1). This genome has been deposited in GenBank (accession number: MF593790). In the legume family, the phenomenon of IR regions loss was commonly found [16,17]. The sequence of protein-coding, tRNA, and rRNA regions accounted for 49.76%, 1.77%, and 3.4% of the whole genome, respectively; and, the rest are intergenic regions (Table 1). Moreover, a total of 111 unique genes were annotated, including 77 protein-coding, 30 tRNA, and four rRNA genes. The functional classification of these genes is shown in Table S1. The C. rosea plastome has 16 intron-containing genes, including 10 protein-coding genes and six tRNA genes. A total of 10 genes have only one intron, and only the ycf3 contains two introns (Table S2). The trnK-UUU has the largest intron (2485 bases), which contains the matK gene. The rps12 gene, which has the intron in the plastomes of other legume species [18], does not have the intron in the plastome of Caragana. Previous studies have shown that the loss of rps12 intron may have occurred after the loss of the IR [19].
The overall GC content of the C. rosea plastome is 34.84%, whereas that for the protein-coding regions is 37.13%. The GC contents for the first, second, and third codon position with the protein-coding regions are 45.36%, 37.62%, and 28.41%, respectively. A bias towards a higher AT representation at the third codon position has also been observed in other land plant plastomes [20,21,22]. The 77 protein-coding genes comprise 66,243 bases coding for 22,081 codons. Among these codons, 2336 (10.58%) encode leucine, whereas just 258 (1.17%) encode cysteine, which are the most and least frequently amino acid in C. rosea plastome, respectively. The 30 unique tRNA genes include all the 20 amino acids required for protein biosynthesis (Table S3). However, there are 61 codons (excluding the three stop codons) that are found in the coding sequence (CDs) of the plastome, Since 31 of them do not have the corresponding tRNAs, the translation of their amino acids have to depend on tRNAs encoded in the nuclear genome.
The basic characteristics of cp genome from C. rosea and other three Caragana species (C. microphylla, C. kozlowii, and C. korshinskii) are shown in Table 1. As shown, the lengths of the four genomes are quite different, ranging from 129,331 bp to 133,122 bp. However, the length of the coding sequence differs by only 12 bp; and, the sizes of the tRNA genes and rRNA genes are also very similar. This suggests that the difference in the length of the cp genomes is caused by those of the intergenic spacers (IGS). In addition, the gene numbers, gene types, and GC contents in the four cp genomes are very similar.

2.2. Gene Loss Analysis

Chloroplast gene losses were analyzed between IRLC (inverted-repeat-lacking clade) of Papilionoideae in 34 species in detail (Table 2). The species are arranged in the same order as they are shown in the phylogenetic tree (see below). The rpl22 gene and the rps16 gene were both absent in all plastome. Moreover, the gene rpl22 and rps16 have been lost in most members of the angiosperm [23,24]. The two genes, which are essential for plant survival, have been transferred to the nucleus to maintain the plant’s photosynthetic capacity [25,26]. In addition, only two (Wisteria floribunda and Wisteria sinensis) plastomes possess the gene ycf15. The ycf15 gene belongs to the PFAM protein family PF10705 and its function is unknown. In fact, in some plant species, the ycf15 gene may not produce any protein because of a premature stop codons in the coding sequences of these species [27]. Because the ycf15 genes in the GenBank are highly variable in terms of gene length and sequence, it has been difficult to annotate this gene. The absence of the ycf4 gene occurs in many species of Papilionatae [23,28,29], whereas the plastome of four Caragana species contains this gene. Psal, ycf1, rpl23, rps18, and ndhB genes were absent in 5, 4, 3, 3, 2 species, respectively, and the rps32 gene was also found to be transferred to nuclear genomes from plastomes in several species [30,31]. The losses of accD, atpE, ndhA, psbJ, psbL, psbZ, and rps2 were only found in Trifolium boissieri, Astragalus mongholicus var. nakaianus, Medicago falcate, Lathyrus littoralis, Medicago falcate, Lens culinaris, and Medicago falcate, respectively; the deletion of these genes rarely occurs in the plastome of angiosperms [23]. Overall, the losses of genes are monophyletic. However, exceptions can be found in the Medicago falcate and several species in the genus Lathyrus, including L. sativus, L. odoratus, L. inconspicuus, L. tingitanus, L. davidii, and L. pubescens.

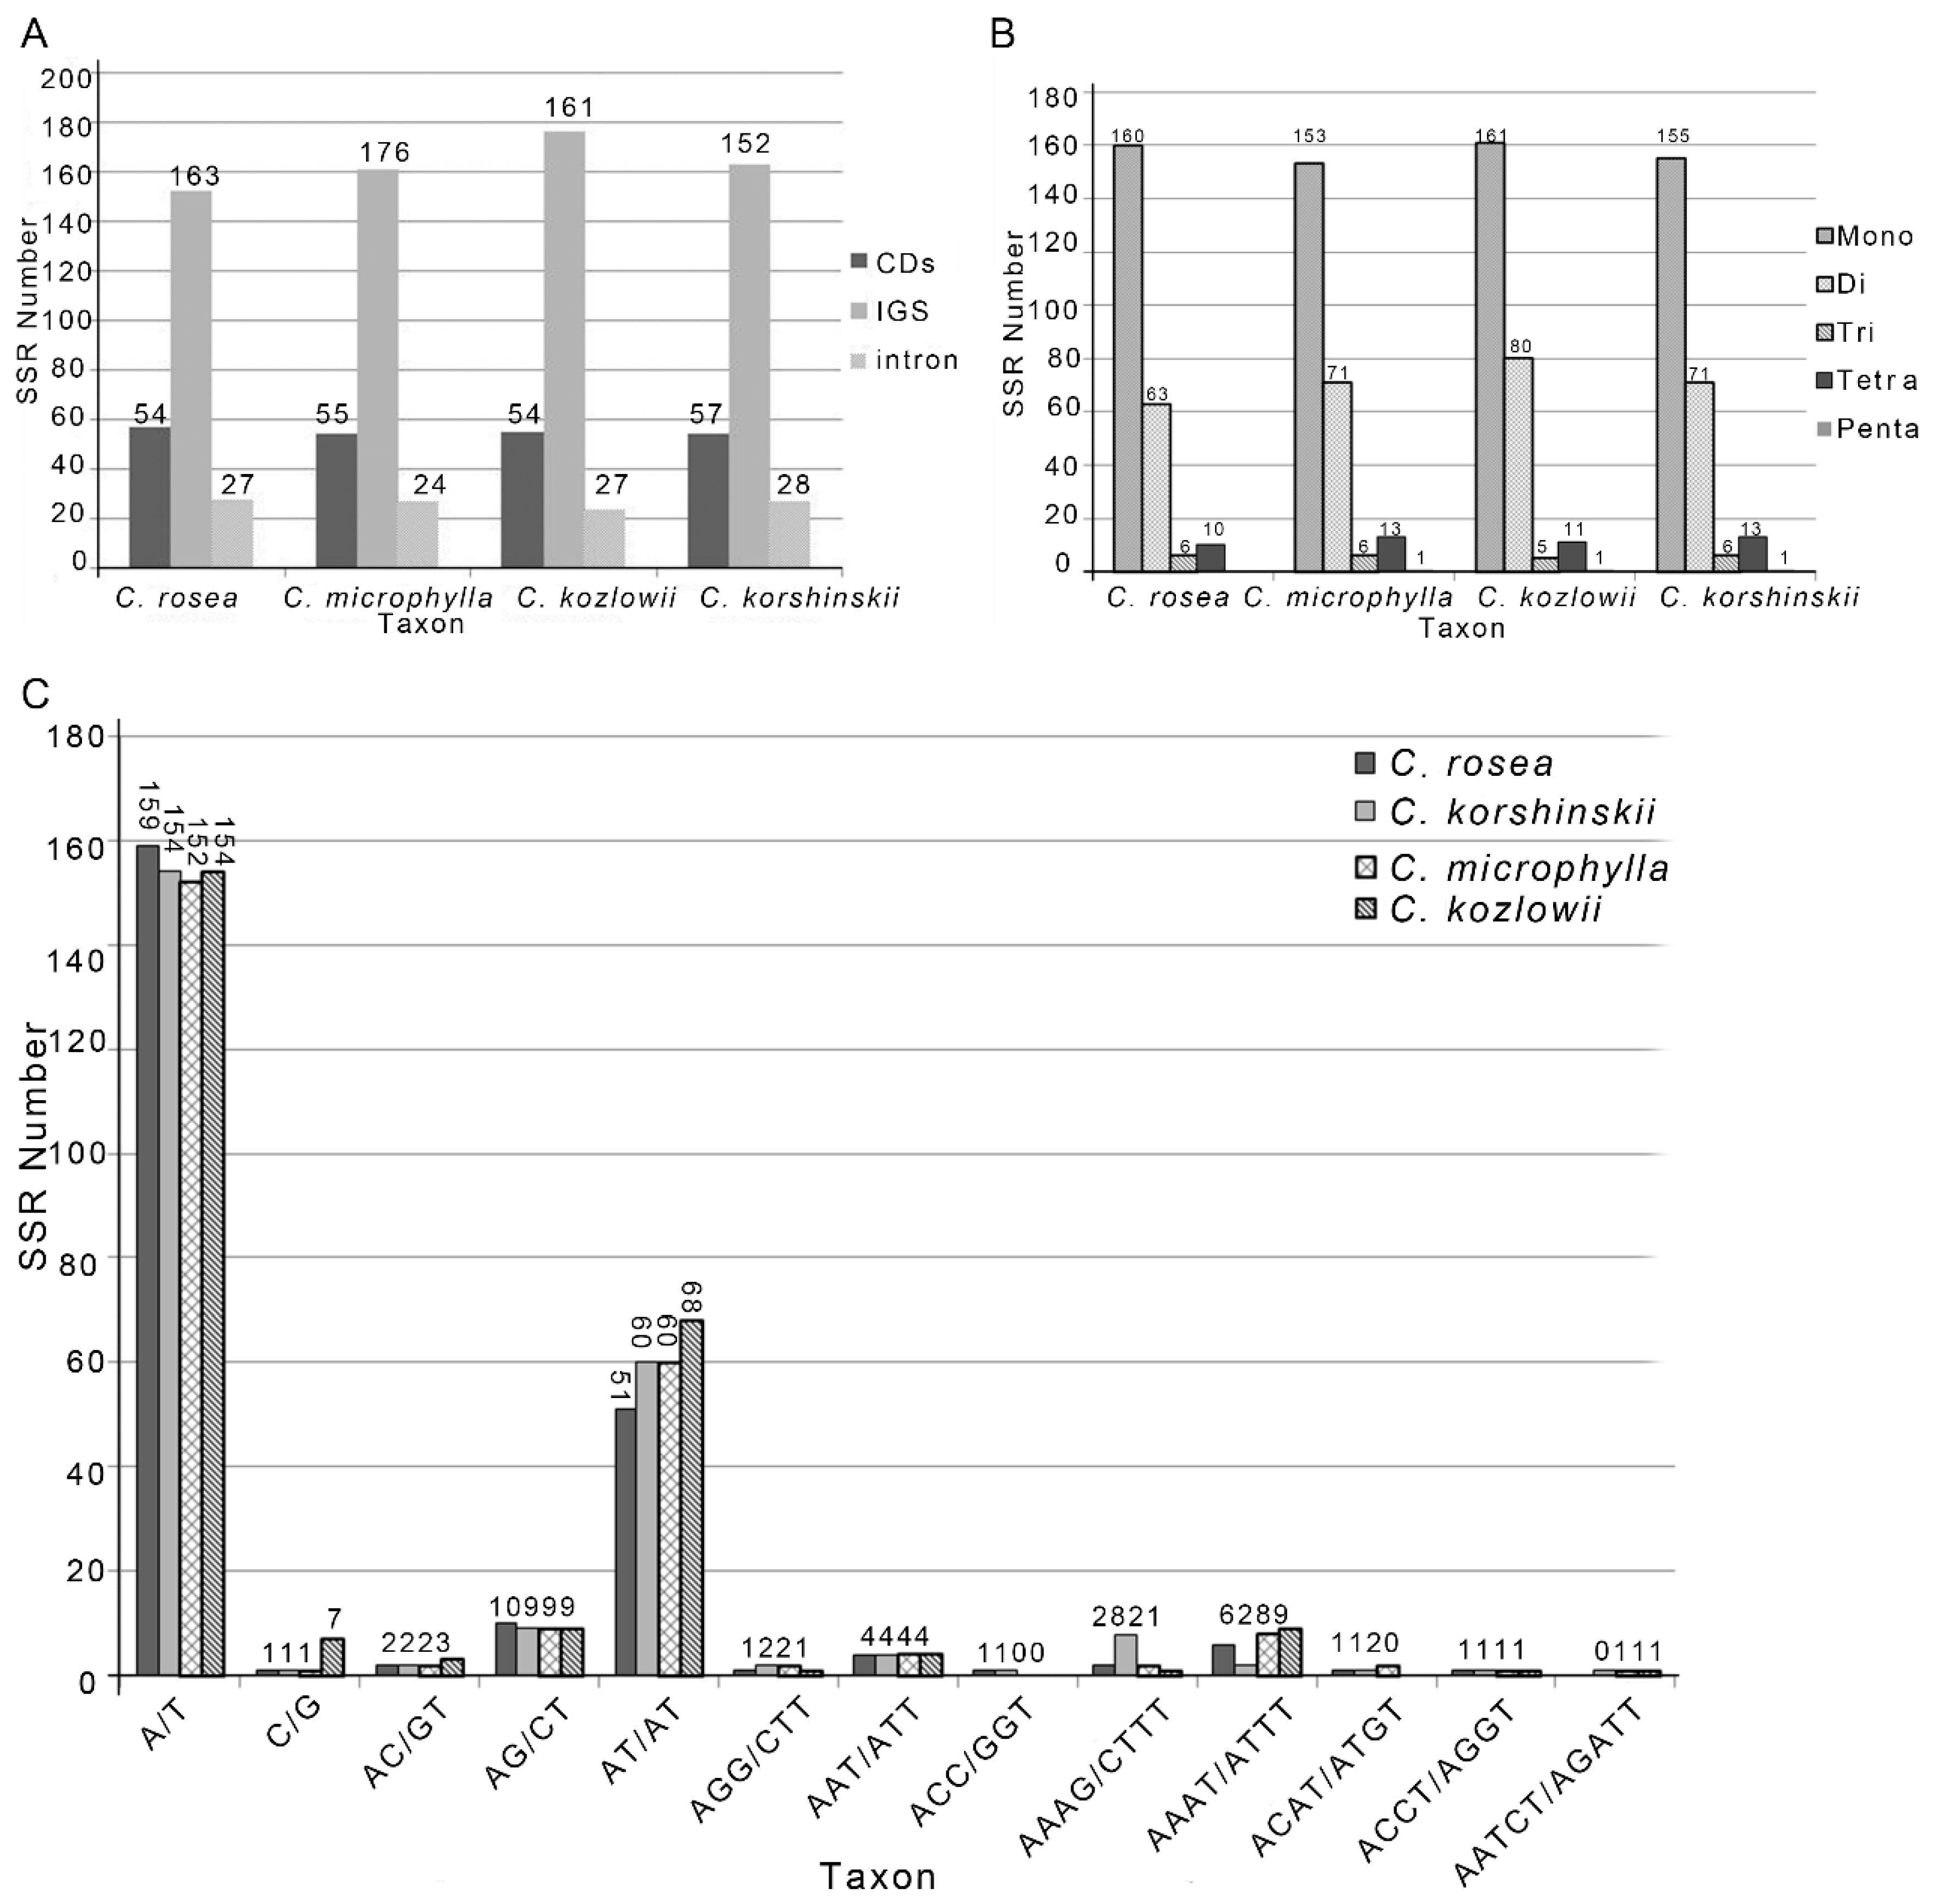
2.3. Repeat Analysis

Repeated units play an important role in genome evolution, such as structural rearrangements and size evolution [32,33]. We analyzed the content and distribution of repeated sequences in the C. rosea plastomes. A total of 19 repeated elements that were longer than 30 bases were identified. The similarities between all the repeated elements were greater than 90%. Tandem, forward, and palindromic repeats presented a similar pattern of distribution. Most of them were found in the intergenic spacer region (IGS), around 31.6% were found in the protein-coding region, and only one repeat was found in the tRNA gene. However, the length of repeats among C. rosea plastome was obviously longer than those in other legumes [24,34], the largest repeat unit was 291 base long and was located in the spacer between the genes rps12 and clpP. The type, location, and sequence of the repeat units are shown in Table S4.
More remarkably, we found that 31.6% and 21.1% of these repeats were located in the IGS(rps12-clpP) and IGS(rps19-rpl2) regions, with the total length of the IGS regions being 2139 bases and 4060 bases, respectively. By contrast, the other three Caragana species do not have so many repeat units in the same regions. For example, the length of the corresponding IGS(rps12-clpP) regions in C. microphylla and C. korshinskii are less than 1 kb. Repeats are known to play a major role in plastome size evolution in angiosperm [35], the presence of abundant repeat sequences may be the reason why the genome of C. rosea is larger than the other three Caragana species.
Simple sequence repeat (SSR) loci are effective molecular markers because of their high variability that are wide distribution throughout the whole plastome [36]. SSR can provide useful information in polymorphism investigations and population genetics [37,38]. We identified SSRs in the plastome of four Caragana species. The number of SSRs ranges from 239 to 258 (Figure 2). In Caragana rosea, 66.9% are mono-nucleotide repeats, as compared with only 26.4%, 2.5%, and 4.2%, of di-, tri-, and tetra-nucleotide repeats, respectively. Of these SSR loci, 159 contained A or T, whereas only one had G or C; similarly, most dinucleotide repeat sequences were composed of AT/AT repeats. This result is consistent with previous reports that most of the SSR in plastomes are composed of short polyA or polyT repeats, while tandem repeats of G or C are rare [39]. We also analyzed the occurrence of SSRs in the CDs and found that there are fewer SSRs in the protein-coding regions than in the non-coding regions. The plastomes of the other three Caragana species are similar to that of C. rosea in terms of the number, distribution, and the GC contents of the SSRs.

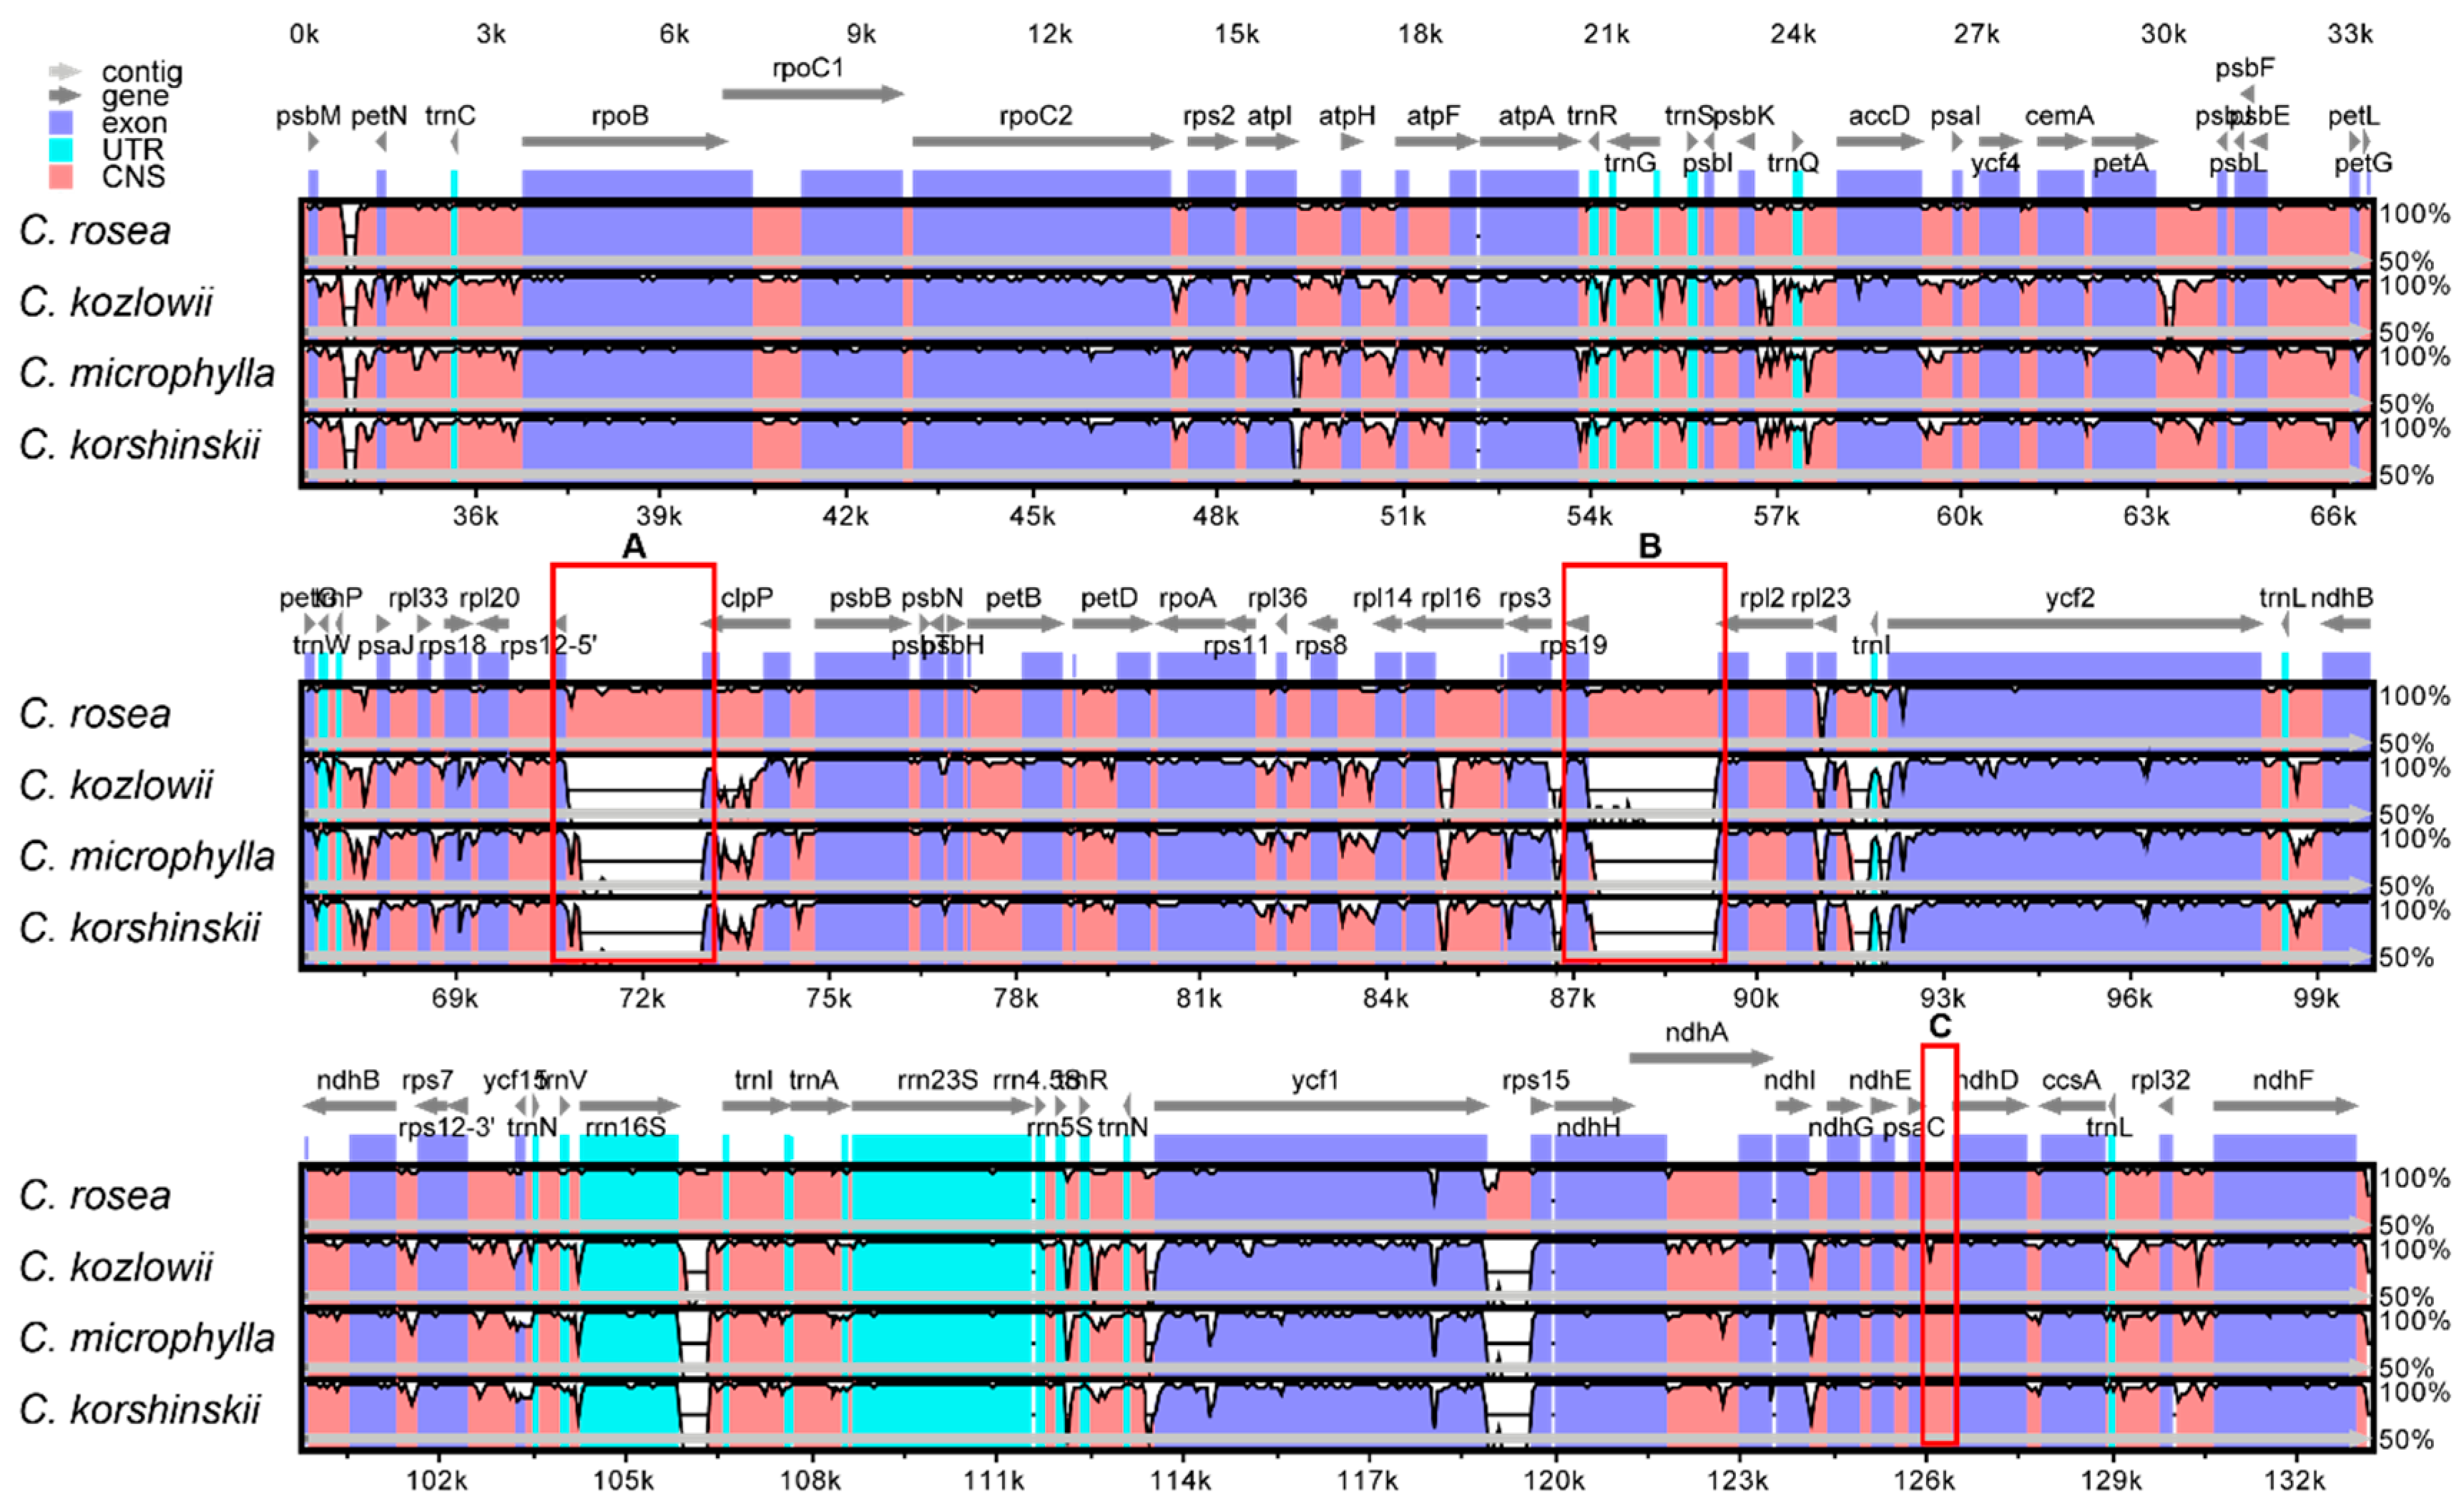
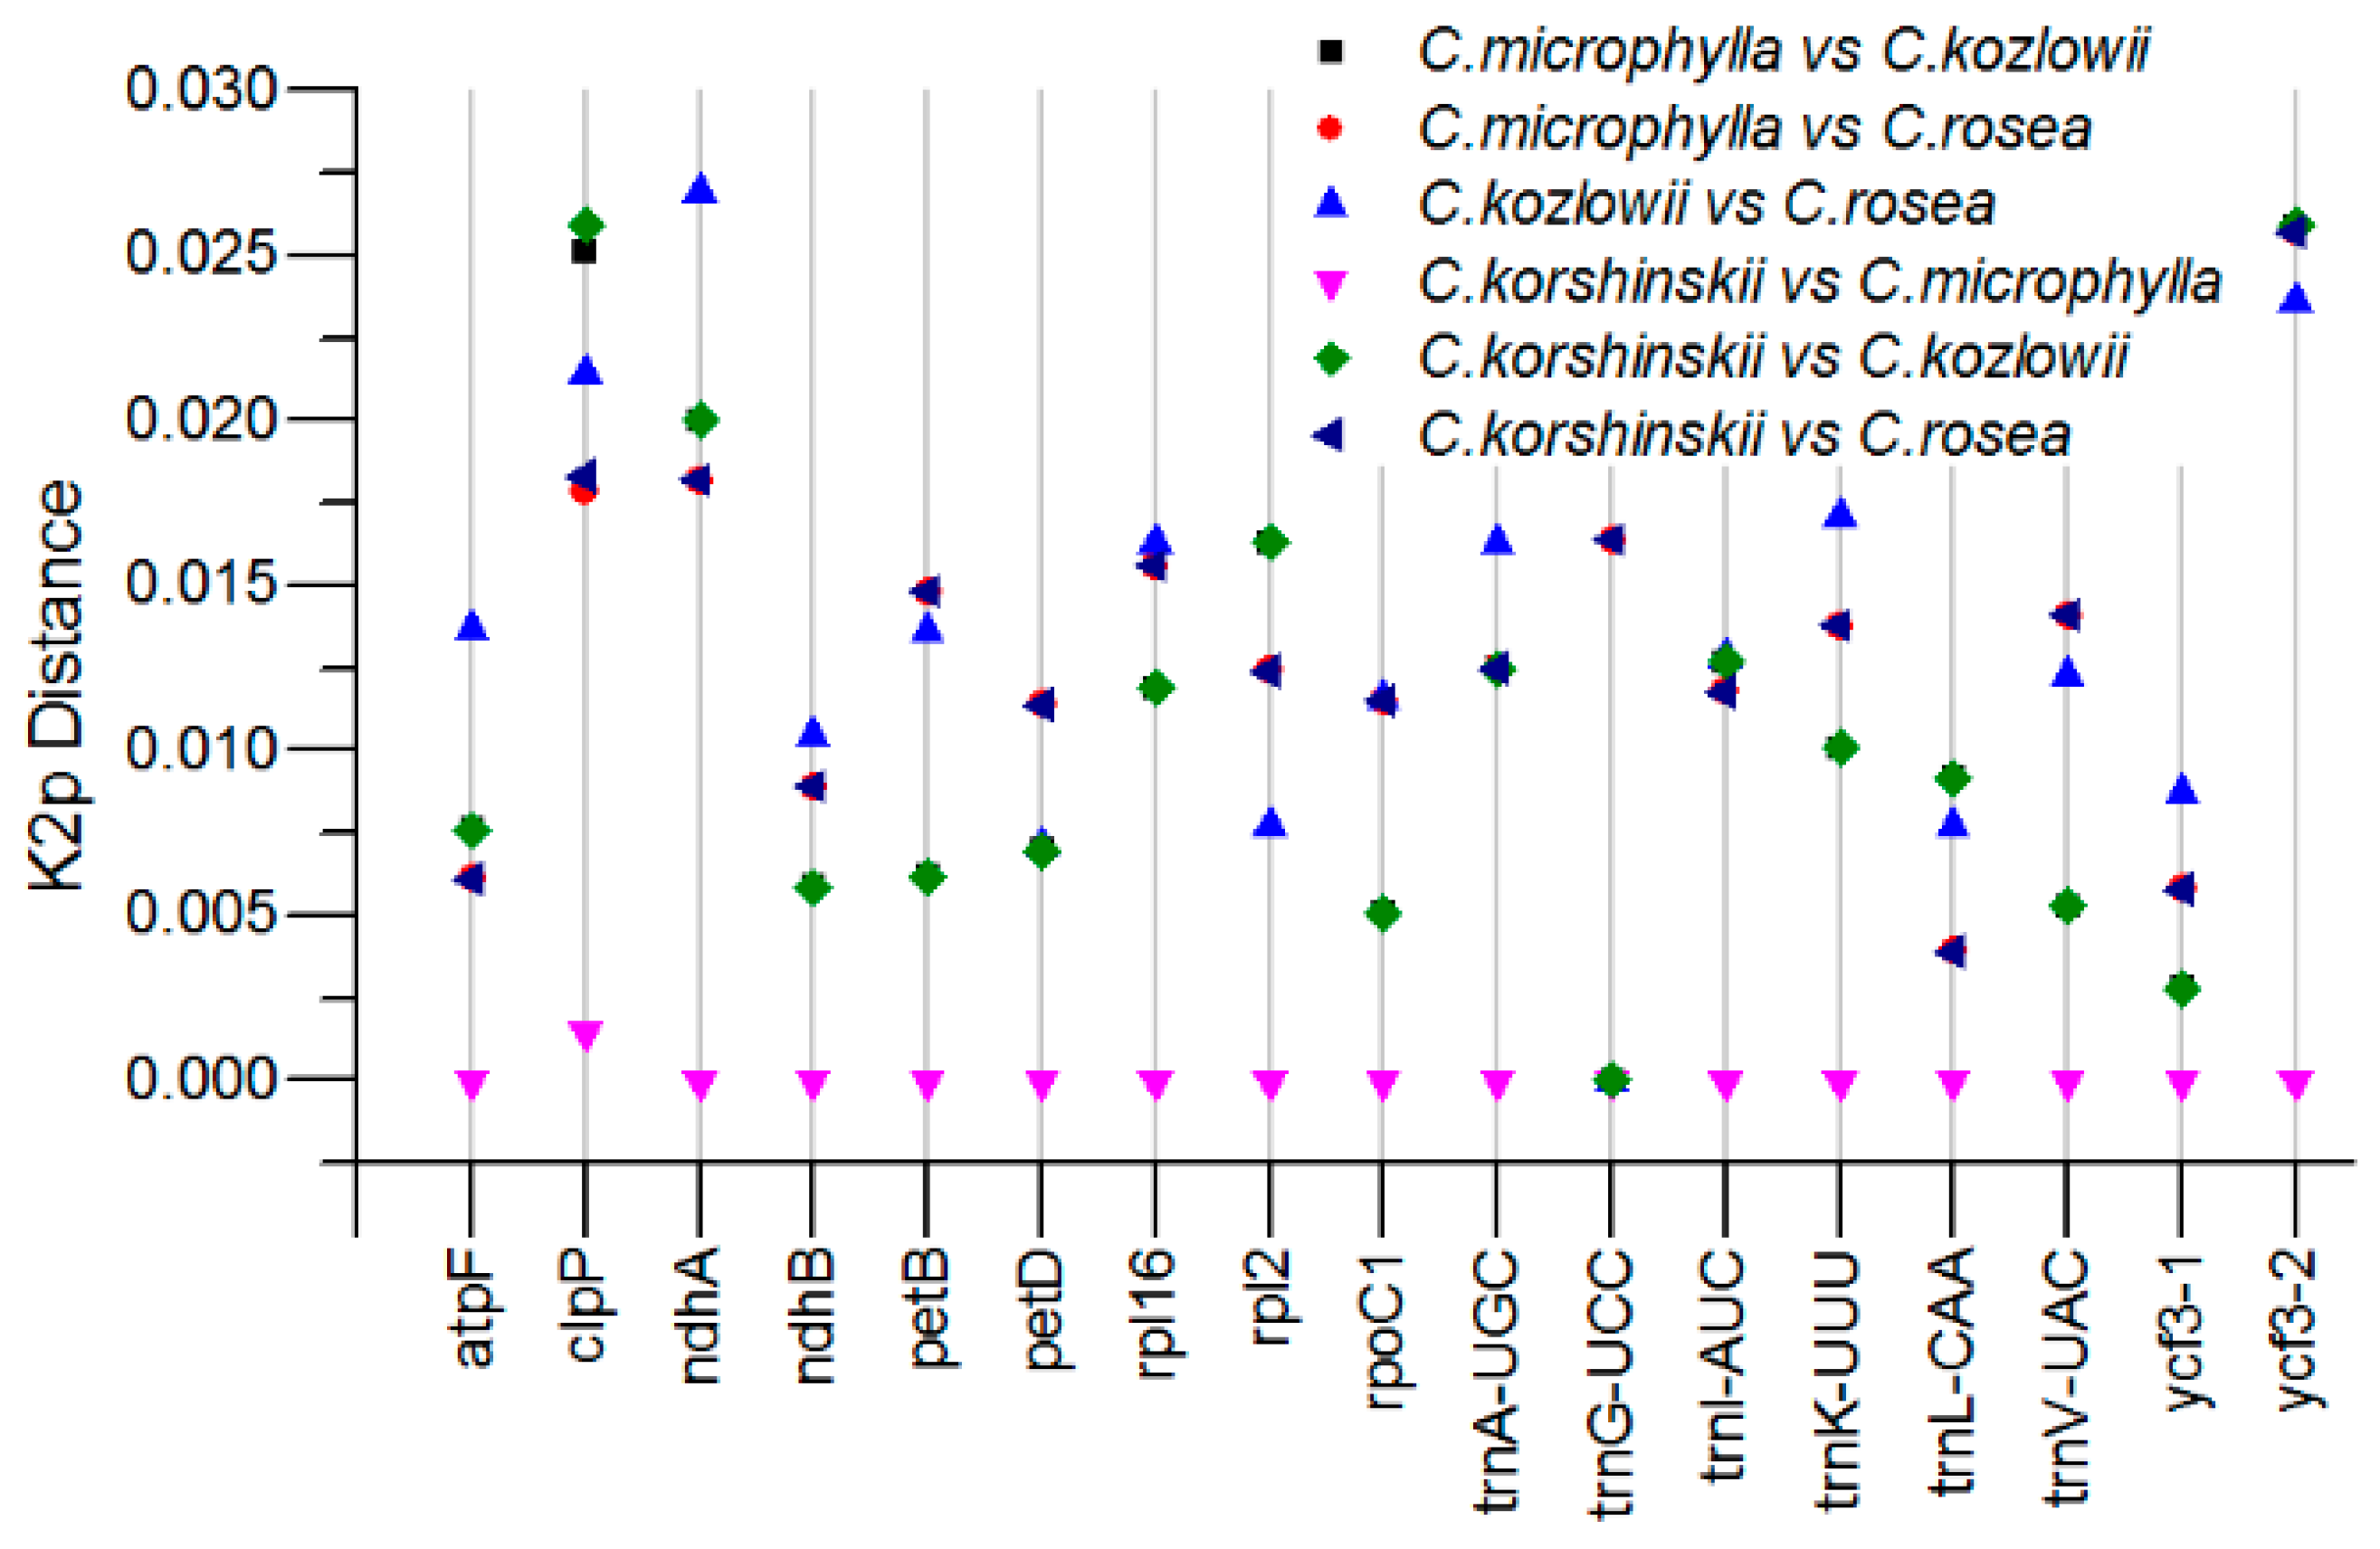
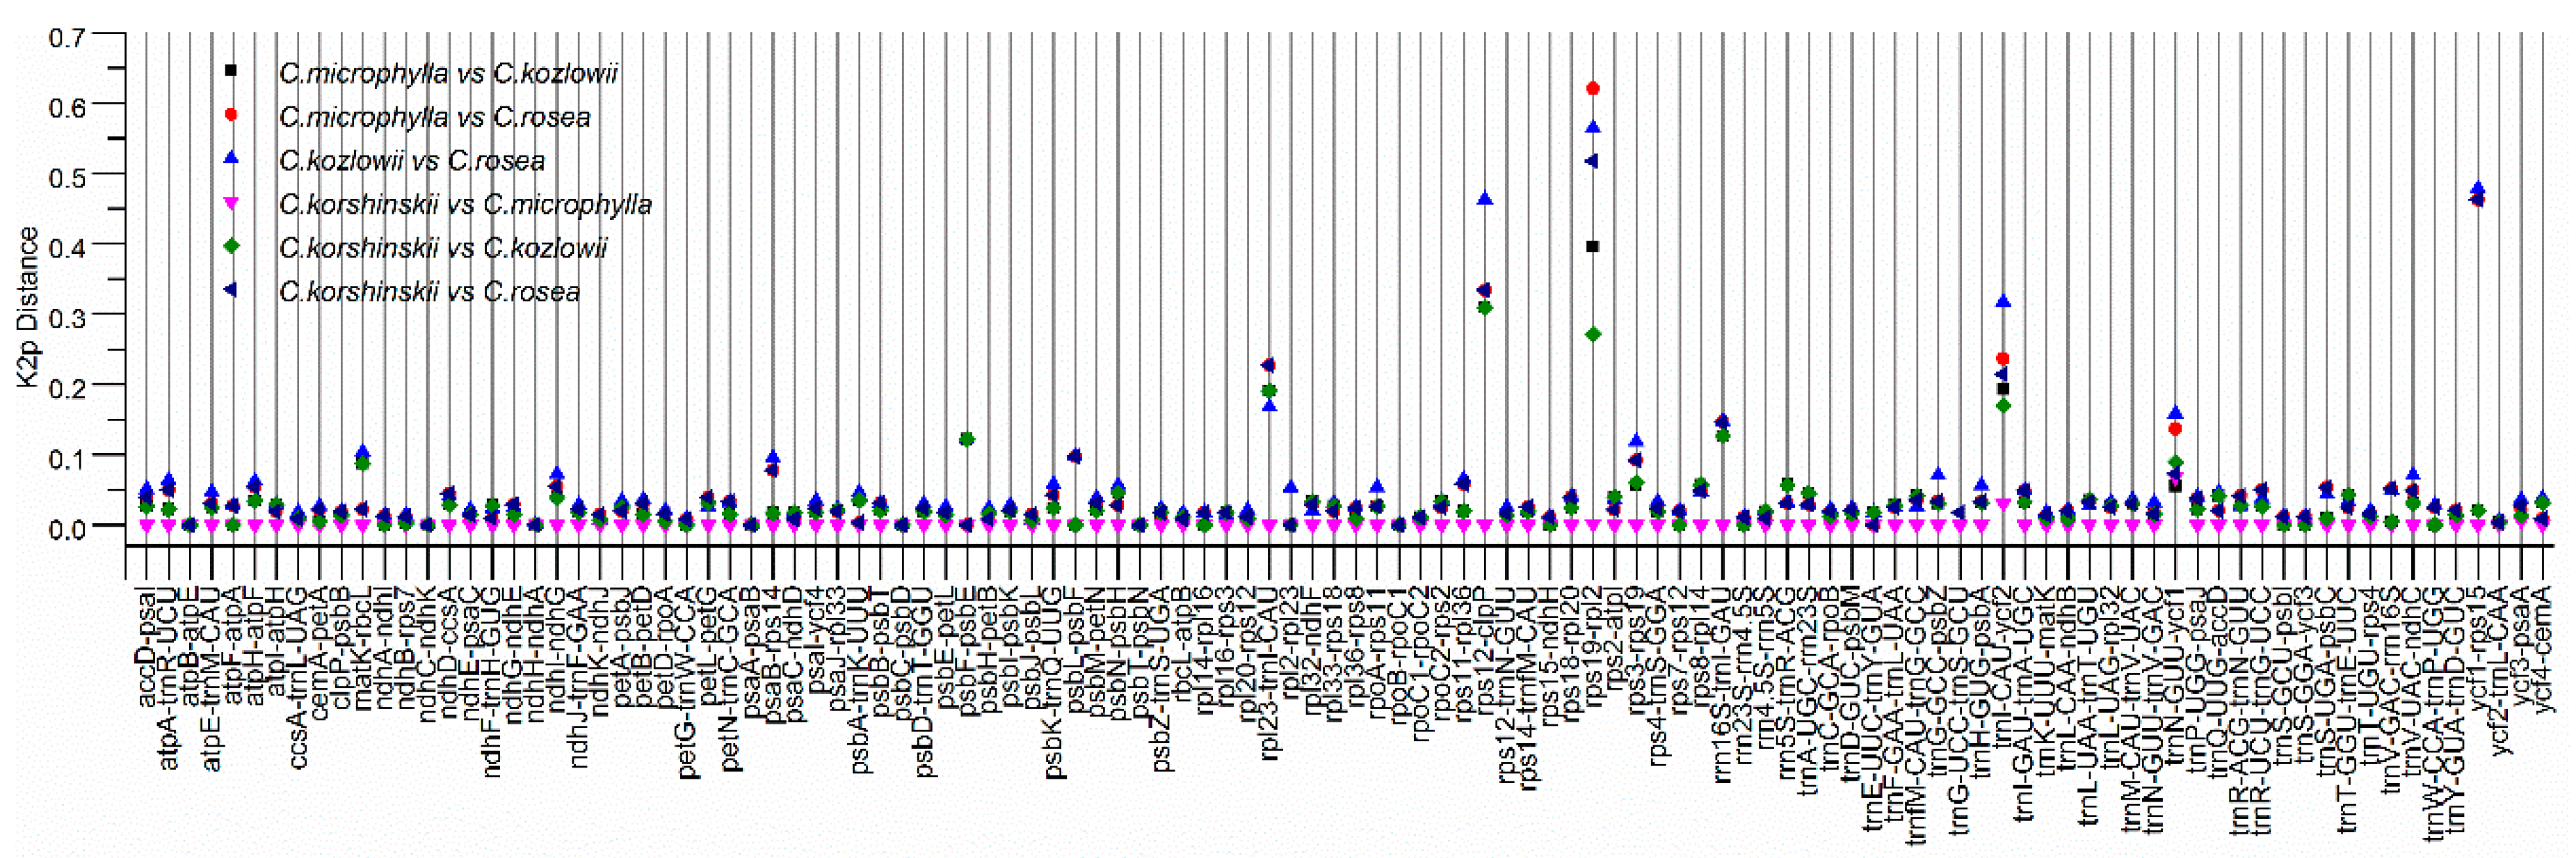
2.4. Sequence Divergence Analysis among Caragana Species

To elucidate the level of sequence similarities between the C. rosea and the other three Caragana, the plastome sequences were compared while using the annotated C. rosea plastome as the reference (Figure 3). As shown, the four plastome sequences are highly similar. However, there are significant differences between C. rosea and other three Caragana species in some IGS, such as IGS(rps12-clpP) (square A), IGS(rps19-rpl2) (square B), and etc., which may be related to the unique large repeat fragments in the C. rosea plastome. For the regions IGS(psaC-ndhD) (square C), the sequence of C. rosea plastome is highly similar to those of C. microphylla and C. korshinskii, but it is quite different from that of C. kozlowii. Overall, the protein-coding regions are highly conserved, while the non-coding regions have different degrees of divergence between the C. rosea plastome and those of the other three. This suggests that the IGS of Caragana species has evolved rapidly.
Highly variable sites in the genome can be used to develop molecular markers. We set out to identify the highly variable sites. We conducted pairwise distance comparison analysis for each non-coding region, including the intergenic region and the intron region using Kimura 2-parameter (K2p) model to identify divergence hotspot regions among the Caragana species. As expected, the variation of the intron sequence is relatively low, and the K2p distances ranged from 0.000 to 0.0269 (Figure 4, Table S5). The clpP, ndhA introns and the second intron of ycf3 show the highest K2p values among the four Caragana species.
For IGSs, the K2p values ranged from 0 to 0.6207 (Figure 5). As described in the method section, we calculatecd the mean+2*STD (Standard Deviation) as the threshold for a IGS to be highly variable. It is 0.1649 in this case. The sequence divergences of the IGS regions ranged from 0 to 0.395 between C. microphylla and C. kozlowii, ranged from 0 to 0.6207 between C. microphylla and C. rosea, ranged from 0 to 0.5641 between C. kozlowii and C. rosea, ranged from 0 to 0.068 between C. korshinskii and C. microphylla, ranged from 0 to 0.3094 between C. korshinskii vs C. kozlowii, and ranged from 0 to 0.5176 between C. korshinskii vs C. rosea. The seven IGS regions (atpB-atpE, ndhC-ndhK, ndhH-ndhA, psaA-psaB, psbC-psbD, psbT-psbN, and rpoB-rpoC1) are 100% identical with the K2p values of 0. Meanwhile, we found that the K2p values were particularly high for the five IGS regions: rpl23-trnI-CAU, rps12-clpP, rps19-rpl2, trnI-CAU-ycf2, and ycf1-rps15.
The high degree of similarity among the plastomes of C. korshinskii and C. microphylla is consistent with their high degree of similarity in morphological characteristics. To determine whether these species can be distinguished with common molecular markers, such as ITS, rbcL, and matK, we compared the sequences of these markers from these species. It is found that these regions could not be used to distinguish the two confusable species with 99%, 100%, and 100% identities among these marker sequences, respectively. Interestingly, two regions IGS(trnI-CAU-ycf2) and IGS(trnN-GUU-ycf1) from C. korshinskii and C. microphylla have large K2p distances, indicating a high degree of sequence divergences. Moreover, these two regions have relatively high K2p values in the pairwise distance comparison analysis of these four species, which can be used to develop novel molecular markers to distinguish the four Caragana species accurately.

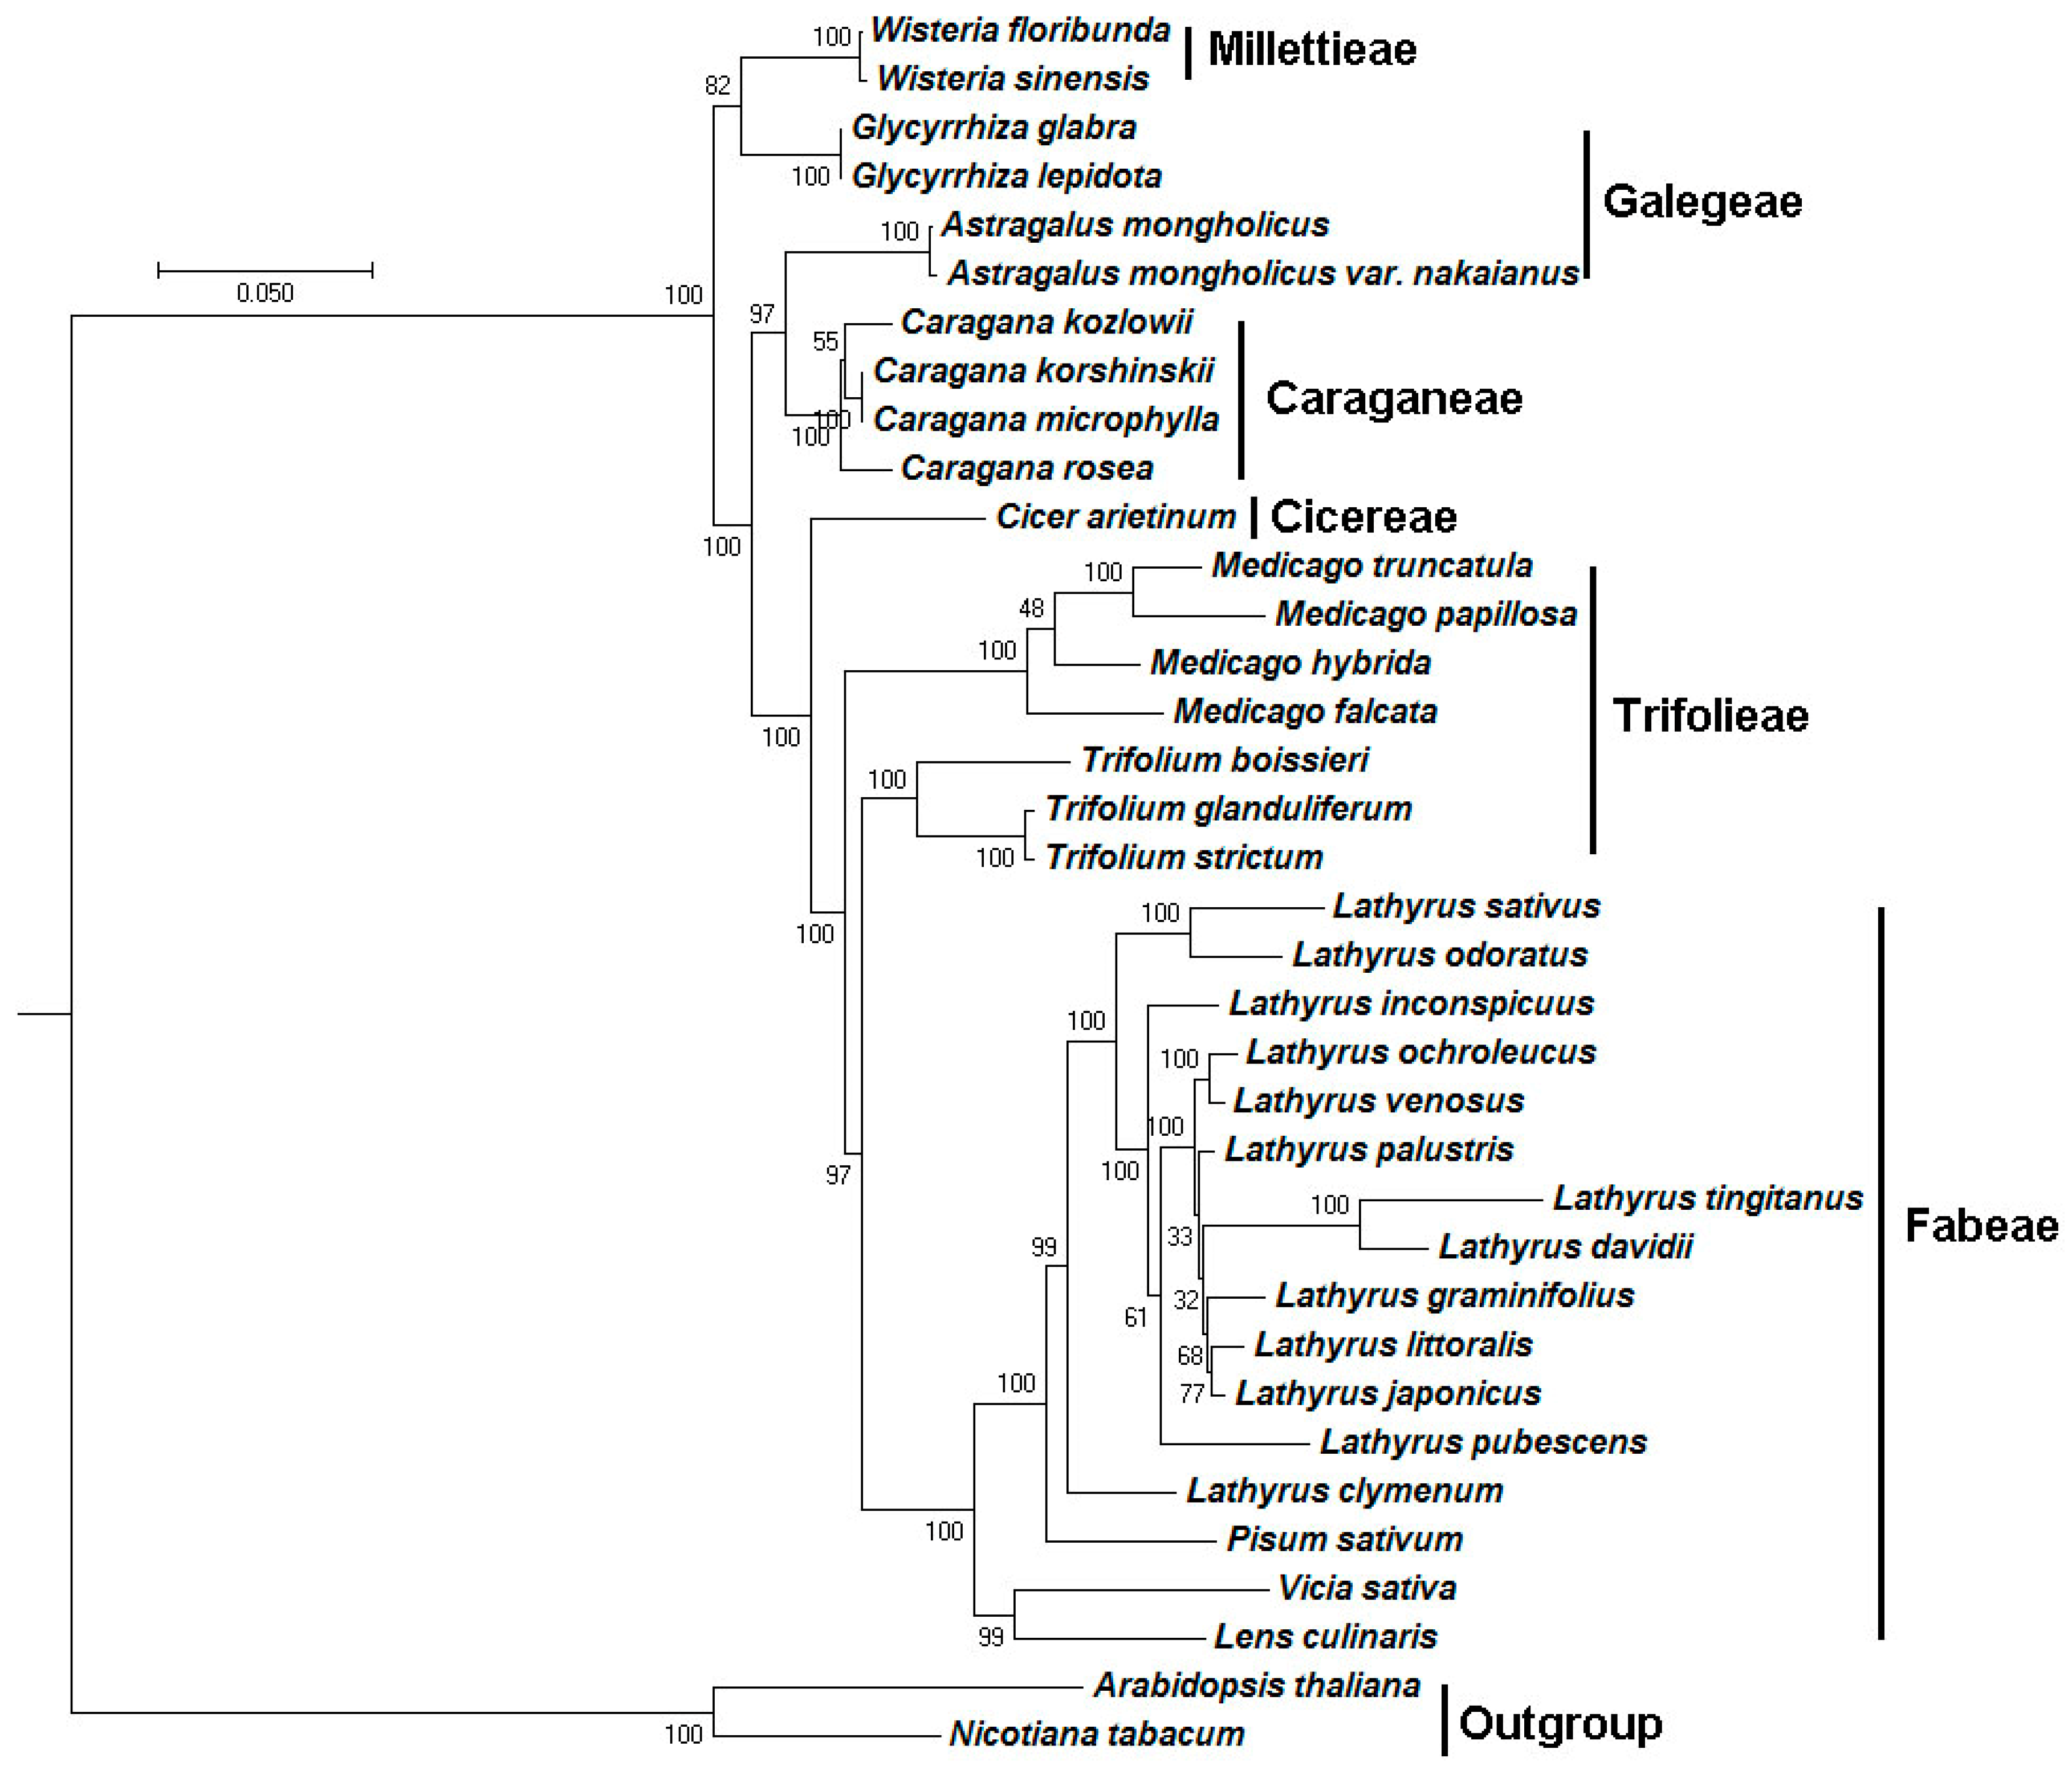
2.5. Phylogenetic Analysis

The plastome sequence is an important resource for studying phylogenetic relationships and taxonomic status in the angiosperm [28]. In order to determine the phylogenetic position of Caragana in the Papilionoideae, we conducted multiple sequence alignments while using 63 common protein sequences from the plastomes of 36 species. Arabidopsis thaliana and Nicotiana tabacum were set as outgroup. The other 34 species contained six plant families that belong to the IRLC of Papilionoideae, including Galegeae (4), Caraganeae (4), Cicereae (1), Fabeae (16), Trifolieae (7), and Millettieae (2). The numbers in the parentheses represent the number of species in the corresponding taxa. The final dataset comprised 18745 positions and were subjected to phylogentic analysis using RaxML. Without surprise, C. rosea is found to locate in the same branch as the other three Caragana species, with 100% bootstrap values (Figure 6).

2.6. Selective Pressure Analysis

As synonymous substitutions accumulate nearly neutrally, non-synonyous substitutions are subject to selective pressures of varying degree and direction (positive or negative). In general, the ratio of nonsynonymous to synonymous substitution (ω) measures the levels of selective pressure operating in a protein coding gene. To test which genes were subject to positive selection at the Caragana branch, we conducted the selection analysis of the exons of each protein-encoding gene using the adaptive Branch-Site Random Effects Likelihood (aBSREL) model. A total of 69 branches among 36 species (listed in Section 2.5) were tested for diversifying selection. Significance was assessed using the Likelihood Ratio Test at a threshold of p ≤ 0.05, after correcting for multiple testing.
Five genes (rpl16, rpl20, rps11, rps7, and ycf1) were found to have evolved under positive selection in Caragana branch in the phylogeny, the significance and number of rate categories inferred at the Caragana branch are provided in Table 3. The optimized branch length of the Caragana branch is 0.0128. The genes can be classified into two groups. The first group contains four ribosomal protein-coding genes. There is very strong evidence in selective pressure for the rpl20 and rps11 genes: positive selection was detected in 16 branches for both genes. In contrast, four branches (Medicago hybrida, Medicago papillosa, Medicago falcata, and Caragana) have experienced positive selection for the rpl16 gene. Two branches (Lathyrus clymenum, Caragana) excluding those for the outgroup have experienced positive selection for the rps7 gene, with two rate classes per branch. The second group containd the ycf1 gene. The analysis did not include four species (Lens culinaris, Wisteria floribunda, Wisteria sinensis, and Medicago falcata) lacking the ycf1 gene. The aBSREL model selection procedure identifies 42 branches for ycf1 to have been significantly selected.
To find out which sites were subject to positive selection along the Caragana branch, codeml from PAML (v4.9) were used to analyze the Ka/Ks for the four genes: rpl16, rpl20, rps11, and rps7, using the branch-site model. The Caragana branch shown in Figure 6 were set as the foreground branch and all the other branches were set as the background branches. It is found that two sites: 36Y and 67Q was potentially under positive selection for the rpl16 gene along the Caragana branch. In contrast, one site: 97Y were potentially under positive selection for the rpl20 gene. Seven sites: 32K, 72T, 86N, 92V, 97Q, 103I, 137T were potential positively selected for the rps11 gene. Four sites: 59E, 60T, 65V, 132V were positively selected for the rps7 gene. As no three-dimensional (3D) structures are available for Caragana proteins, we cannot determine the functional and evolutionary significance of these sites at this time.

3. Discussion

Caragana species are xeromorphic, heat-resistant, and cold-resistant plants. Understanding the underlying molecular mechanism of this genus is of great interest for molecular breeding. As sessile organisms, plants must cope with abiotic stresses, such as soil salinity, drought, and extreme temperatures. Stress signaling pathways in plants have been extensively studied and reviewed [7,40]. All of these signaling pathways involve protein kinases that are related to yeast SNF1 and mammalian AMPK, suggesting that stress signaling in plants evolved from energy sensing.
Signals that are caused by limited water (drought stress) or excessive salt (salt stress) can be divided into primary and secondary types. The primary signal caused by drought is also called hyperosmotic stress. Salt stress exerts both osmotic and ionic effects on cells. The secondary effects are rather complex and they include oxidative stress; such effects include damage to cellular components (such as membrane lipids, proteins, and nucleic acids), chloroplast, mitochondria, ER, and metabolic dysfunction [7].
Chloroplast is an organelle where photosynthetic electron transport and many metabolic reactions occur. Environmental stress can easily perturb the metabolic balance in chloroplasts. The disturbance in chloroplast homeostasis is then passed to the nucleus through retrograde signals; as such, all cellular activities can be adjusted and coordinated. The chloroplast is a major site for the production of reactive oxygen species (ROS), such as superoxide anion, hydrogen peroxide, hydroxyl radical, and singlet oxygen [41]. Various environmental stresses, particularly high light stress, can exacerbate ROS production, thereby disrupting ROS-managing systems and generating various secondary messengers.
The relationship between protein synthesis and stress response has been studied [7]. The accuracy of protein synthesis is critical for life because a high degree of fidelity of the translation of the genetic information is required to accomplish the needs for cellular functions and to preserve variability developed by evolution. Even in simple organisms, this process involves more than 100 macromolecules, such as ribosomal proteins, translation factors, aminoacyl-tRNA synthetases, ribosomal RNAs, and transfer RNAs. Moreover, in vivo or in vitro experiments indicated that several macromolecules that participate in translation are the targets of oxidation; hence, translation is directly targeted by oxidative species. In bacteria, target macromolecules include elongation factors, such as Tu [42,43], Ts (EF-Ts) [44], and G (EF-G) [45,46,47,48]; several ribosomal proteins [49,50,51,31,36,37]; tRNAs [38,39,40,41,42,52,53]; and, aminoacyl-tRNA synthetases (aaRS) [43,49,50,51,54]. In particular, the disulfide bond formation of ribosomal proteins S7 and L16 are affected by oxidative stress [51]. Furthermore, scholars have identified the covalent binding of ribosomal protein S11 to chaperon/oxido-reductase protein through cysteine bond [43].
Previous studies showed that environmental stress can cause oxidative stress, which in turn affects the translation system, particularly in prokaryote originated systems, such as chloroplast. When considering the axis of environmental stress->oxidative stress->translation system, we can speculate that ribosomal protein-coding genes, such as rps7, rps11, rpl16, and rpl20, are strongly selected to maintain the integrity of the protein synthesis machinery under various environmental stresses. This phenomenon might, at least in part, contribute to the strong environmental stress resistance characteristics of the Caragana species. Additional analyses would be needed to confirm this hypothesis.

4. Materials and Methods

4.1. Plant Material, DNA Extraction, and Sequencing

The fresh leaves of the C. rosea were collected from the Institute of Medicinal Plant Development, China. After washing, the leaves were kept in the −80 refrigerator until use. DNA from about 100 mg leaves was extracted using the modified CTAB (Cetyltrimethylammonium bromide) method. Subsequently, the extracted DNA integrity and concentration were detected by electrophoresis in 1% (w/v) agarose gel and spectrophotometer (Nanodrop 2000, Thermo Fisher Scientific, Waltham, MA, USA). The genomic DNA of C. rosea was subjected to high-throughput sequencing using an Illumina Hiseq2000 sequencer (Illumina Inc., San Diego, CA, USA), with insert sizes of 500 bases for the library.
A total of 18,932,846 paired-end reads were obtained with 100 bases long. The other three plastome sequences of Caragana e.g., C. korshinskii (Accession number: NC_035229), C. kozlowii (Accession number NC_035228), C. microphylla (Accession number NC_032691), and ITS (Accession number: FJ537266, FJ537264) were obtained from Genbank.

4.2. Genome Assembly and Gap Filling

In order to extract the reads belonging to the plastome from those for the total DNAs, we downloaded 1688 plastome sequences from GenBank in February 2016, which were used to search against Illumina paired-end reads using BLASTN with an E-value cutoff of 1 × 10⁵ [55]. The genome sequence of C. kozlowii was found to have the highest similarity and it was chosen as the reference sequence for the following assembly.
A total of 3076 paired-end reads similar to the C. kozlowii plastome sequence were selected and assembled by AbySS (v1.5.2) [56] and CLC Genomics Workbench (v7) Software. Nine and seven contigs were obtained using the two software tools, respectively. Then, the 16 sequences were further assembled by the Seqman module of DNAStar (v6.10.01), resulting in three contigs. The gaps between the contigs were filled with PCR amplification and Sanger sequencing using the sequence-specific primers (Table S6) designed to cross the gaps. Finally, the draft plastome sequence was validated by mapping the raw Illumina paired-end reads against it using Bowtie2 (v2.0.1) with default settings [57].

4.3. Genome Annotation and Characteristics Analysis

The C. rosea plastome sequence was annotated by CpGAVAS web service [58], with the default parameter. The tRNA genes were annotated using ARAGORN [59] and tRNAscan-SE [60]; the protein sequences were verified again by BLASP against the GenBank sequences. Subsequently, the intron/exon boundaries and the start/stop codons of predicted genes are manually edited using the Apollo program (v1.11.8) [61]. The circular plastome map of C. rosea was drawn using OrganellarGenomeDRAW [62]. Both GC contents and codon usage were calculated using the programs Cusp and Compseq from EMBOSS (v6.3.1) [63].

4.4. Repeat and SSR Analysis

Repeats (palindrome and forward repeats) were identified by REPuter web service [64], with the settings of 3 for the Hamming Distance (sequence identity ≥ 90%) and 30 for Minimal Repeat Size, as reported previously [34,65]. The number and location of tandem repeated elements in the Caragana genus plastome were determined using the Tandem Repeats Finder [66], with the following parameters: matches, mismatches and indels, minimum alignment score, and the maximum period size were 2, 7, 50, and 500, respectively. We manually verified all of the detected repeats and removed nested and redundant sequences. SSR in the plastome was analyzed by MISA software with the same parameters as reported previously [67]. Briefly, the cutoff for the numbers of units for mono-, di-, tri-, tetra-, penta-, and hexa-nucleotides were 8, 4, 4, 3, 3, and 3, respectively.

4.5. Comparative Genomic Analysis

The complete plastome sequence of C. rosea was compared with the those of C. korshinskii, C. kozlowii, and C. microphylla, using the mVISTA program in a Shuffle-LAGAN mode with default parameters [68]. The annotated C. rosea plastome was used as the reference. In order to analyze sequence diversity and selective pressure, a total of 112 intergenic regions, 17 introns, and 76 exons were extracted from the four plastomes using custom MatLab scripts. The corresponding nucleotide sequences were aligned using the CLUSTALW2 (v2.0.12) program with options “-type = DNA -gapopen = 10 -gapext = 2” [69]. Pairwise distance were determined with the Distmat program that was implemented in EMBOSS (v6.3.1) [63] using the Kimura 2-parameters (K2p) evolution model [70] for intergenic regions and introns. To determine the threshold for the K2p distance to be highly variable, we calculated the mean and the standard deviation for all the K2p values. The mean + 2*STD were then set as the threshold. The 76 exons sequences were aligned using the RevTrans (v2.0) [71] with the option of CLUSTALW2 program. Subsequently, the selective pressure analysis were conducted using adaptive branch-site random effects likelihood (aBSREL) model [72], implemented in HyPhy (https://veg.github.io/hyphy-site/getting-started/#characterizing-selective-pressures). Finally, we analyzed which sites were subject to positive selection along Caragana branch using the Codeml program that was implemented in PAML (v4.9) [73].

4.6. Phylogenetic Analysis

The plastome sequences of 33 species belonging to the IRLC (inverted-repeat-lackingclade) of Papilionoideae and two outgroup species (Arabidopsis thaliana and Nicotiana tabacum) were downloaded from NCBI RefSeq database, and a total of 63 protein sequences that were present in all of the 35 species and C. rosea were obtained by manual detection (ATPA, ATPB, ATPF, ATPH, ATPI, CCSA, CEMA, CLPP, MATK, NDHC, NDHD, NDHE, NDHF, NDHG, NDHH, NDHI, NDHJ, NDHK, PETA, PETB, PETD, PETG, PETL, PETN, PSAA, PSAB, PSAC, PSAJ, PSBA, PSBB, PSBC, PSBD, PSBE, PSBF, PSBH, PSBI, PSBK, PSBM, PSBN, PSBT, RBCL, RPL14, RPL16, RPL2, RPL20, RPL32, RPL33, RPL36, RPOA, RPOB, RPOC1, RPOC2, RPS11, RPS12, RPS14, RPS15, RPS19, RPS3, RPS4, RPS7, RPS8, YCF2, and YCF3) (Table S7). For the phylogenetic analysis, these protein sequences were aligned using the CLUSTALW2 (v2.0.12) program with options “-gapopen = 10 -gapext = 2 -output = phylip”. The Maximum Likelihood method implemented in RaxML (v8.2.4) [69] was used to inferred the evolutionary history, using “raxmlHPC-PTHREADS-SSE3 -f a -N 1000 -m PROTGAMMACPREV -x 551314260 -p 551314260 -o A_thaliana, N_tabacum -T 20”. Subsequently, the Bootstrap analysis was also performed with 1000 replicates for the phylogenetic tree.

5. Conclusions

In this study, we sequenced the plastome of C. rosea and carried out a comparative study with those from C. microphylla, C. kozlowii, and C. korshinskii. Phylogenetic analyses showed that four Caragana species were on a monophyletic clade, with 100% bootstrap values. Analyses of selective pressure revealed that five genes: rpl16, rpl20, rps11, rps7, and ycf1 were evolved undergoing positive selection. Analyses of sequence divergence found two sites: IGS(trnI-CAU-ycf2) and IGS(trnN-GUU-ycf1) had high degree of variations and might be sources for markers that can be used to distinguish these four species. The results presented in this paper will facilitate the further investigation for these four species in terms the molecular mechanisms for drought-resistance.

Supplementary Materials

Supplementary materials can be found at https://www.mdpi.com/1422-0067/19/5/1419/s1.

Author Contributions

C.L. conceived the study; M.J. collected samples of C. rosea var. rosea, extracted DNA for next-generation sequencing, assembled the genome, performed data analysis, conducted PCR validation and drafted the manuscript; H.C. annotated the genome; L.W. wrote the matlab scripts. S.H. and A.J.C. reviewed the manuscript critically. All authors have read and agreed the contents of the manuscript.

Funding

This work was supported by the CAMS Innovation Fund for Medical Sciences (CIFMS) (2016-I2M-3-016, 2017-I2M-1-013) from Chinese Academy of Medical Science. The funders were not involved in the study design, data collection and analysis, decision to publish, or manuscript preparation.

Conflicts of Interest

The authors declare no conflict of interest.

References

  1. Meng, Q.; Niu, Y.; Niu, X.; Roubin, R.H.; Hanrahan, J.R. Ethnobotany, phytochemistry and pharmacology of the genus Caragana used in traditional chinese medicine. J. Ethnopharmacol. 2009, 124, 350–368. [Google Scholar] [CrossRef] [PubMed]
  2. Delectis Flora Reipublicae Popularis Sinicae Agendae Academiae Sinicae Edita. Flora Reipublicae Popularis Sinicae; Science Press: Beijing, China, 1993; Volume 42, p. 18. [Google Scholar]
  3. Ma, F.; Na, X.; Xu, T. Drought responses of three closely related Caragana species: Implication for their vicarious distribution. Ecol. Evol. 2016, 6, 2763–2773. [Google Scholar] [CrossRef] [PubMed]
  4. Delectis Flora Reipublicae Popularis Sinicae Agendae Academiae Sinicae Edita. Flora Reipublicae Popularis Sinicae; Science Press: Beijing, China, 1993; Volume 42, p. 31. [Google Scholar]
  5. Delectis Flora Reipublicae Popularis Sinicae Agendae Academiae Sinicae Edita. Flora Reipublicae Popularis Sinicae; Science Press: Beijing, China, 1993; Volume 42, p. 60. [Google Scholar]
  6. Yang, G.X.; Qi, J.B.; Cheng, K.J.; Hu, C.Q. Anti-HIV chemical constituents of aerial parts of Caragana rosea. Yao Xue Xue Bao (Acta Pharm. Sin.) 2007, 42, 179–182. [Google Scholar]
  7. Zhu, J.K. Abiotic stress signaling and responses in plants. Cell 2016, 167, 313–324. [Google Scholar] [CrossRef] [PubMed]
  8. Hu, S.; Sablok, G.; Wang, B.; Qu, D.; Barbaro, E.; Viola, R.; Li, M.; Varotto, C. Plastome organization and evolution of chloroplast genes in Cardamine species adapted to contrasting habitats. BMC Genom. 2015, 16, 306. [Google Scholar] [CrossRef] [PubMed]
  9. Ometto, L.; Li, M.; Bresadola, L.; Varotto, C. Rates of evolution in stress-related genes are associated with habitat preference in two Cardamine lineages. BMC Evol. Biol. 2012, 12, 7. [Google Scholar] [CrossRef] [PubMed]
  10. Gong, C.; Bai, J.; Wang, J.; Zhou, Y.; Kang, T.; Wang, J.; Hu, C.; Guo, H.; Chen, P.; Xie, P.; et al. Carbon storage patterns of Caragana korshinskii in areas of reduced environmental moisture on the loess plateau, China. Sci. Rep. 2016, 6, 28883. [Google Scholar] [CrossRef] [PubMed]
  11. Li, M.; Liu, D.; Liu, Y. Evaluation on drought-resistant characteristics of ten Caragana species based on leaf micromorphological structure. J. Desert Res. 2016, 3, 708–717. [Google Scholar] [CrossRef]
  12. Yamamoto, Y.; Aminaka, R.; Yoshioka, M.; Khatoon, M.; Komayama, K.; Takenaka, D.; Yamashita, A.; Nijo, N.; Inagawa, K.; Morita, N.; et al. Quality control of photosystem II: Impact of light and heat stresses. Photosynth. Res. 2008, 98, 589–608. [Google Scholar] [CrossRef] [PubMed]
  13. Mulo, P.; Sakurai, I.; Aro, E.M. Strategies for psba gene expression in cyanobacteria, green algae and higher plants: From transcription to psii repair. Biochim. Biophys. Acta 2012, 1817, 247–257. [Google Scholar] [CrossRef] [PubMed]
  14. Wright, I.J.; Reich, P.B.; Westoby, M.; Ackerly, D.D.; Baruch, Z.; Bongers, F.; Cavender-Bares, J.; Chapin, T.; Cornelissen, J.H.; Diemer, M.; et al. The worldwide leaf economics spectrum. Nature 2004, 428, 821–827. [Google Scholar] [CrossRef] [PubMed]
  15. Neufeld, H.S. Plant physiological ecology. Photosynthetica 1999, 80, 1785–1787. [Google Scholar] [CrossRef]
  16. Sabir, J.; Schwarz, E.; Ellison, N.; Zhang, J.; Baeshen, N.A.; Mutwakil, M.; Jansen, R.; Ruhlman, T. Evolutionary and biotechnology implications of plastid genome variation in the inverted-repeat-lacking clade of legumes. Plant Biotechnol. J. 2014, 12, 743–754. [Google Scholar] [CrossRef] [PubMed]
  17. Cardoso, D.; de Queiroz, L.P.; Pennington, R.T.; de Lima, H.C.; Fonty, E.; Wojciechowski, M.F.; Lavin, M. Revisiting the phylogeny of papilionoid legumes: New insights from comprehensively sampled early-branching lineages. Am. J. Bot. 2012, 99, 1991–2013. [Google Scholar] [CrossRef] [PubMed]
  18. Dugas, D.V.; Hernandez, D.; Koenen, E.J.; Schwarz, E.; Straub, S.; Hughes, C.E.; Jansen, R.K.; Nageswara-Rao, M.; Staats, M.; Trujillo, J.T.; et al. Mimosoid legume plastome evolution: Ir expansion, tandem repeat expansions, and accelerated rate of evolution in clpP. Sci. Rep. 2015, 5, 16958. [Google Scholar] [CrossRef] [PubMed] [Green Version]
  19. Jansen, R.K.; Wojciechowski, M.F.; Sanniyasi, E.; Lee, S.B.; Daniell, H. Complete plastid genome sequence of the chickpea (Cicer arietinum) and the phylogenetic distribution of rps12 and clpP intron losses among legumes (leguminosae). Mol. Phylogenet. Evol. 2008, 48, 1204–1217. [Google Scholar] [CrossRef] [PubMed]
  20. Qian, J.; Song, J.; Gao, H.; Zhu, Y.; Xu, J.; Pang, X.; Yao, H.; Sun, C.; Li, X.; Li, C.; et al. The complete chloroplast genome sequence of the medicinal plant Salvia miltiorrhiza. PLoS ONE 2013, 8, e57607. [Google Scholar] [CrossRef] [PubMed]
  21. Shen, X.; Wu, M.; Liao, B.; Liu, Z.; Bai, R.; Xiao, S.; Li, X.; Zhang, B.; Xu, J.; Chen, S. Complete chloroplast genome sequence and phylogenetic analysis of the medicinal plant Artemisia annua. Molecules 2017, 22, 1330. [Google Scholar] [CrossRef] [PubMed]
  22. He, L.; Qian, J.; Li, X.; Sun, Z.; Xu, X.; Chen, S. Complete chloroplast genome of medicinal plant Lonicera japonica: Genome rearrangement, intron gain and loss, and implications for phylogenetic studies. Molecules 2017, 22, 249. [Google Scholar] [CrossRef] [PubMed]
  23. Daniell, H.; Lin, C.S.; Yu, M.; Chang, W.J. Chloroplast genomes: Diversity, evolution, and applications in genetic engineering. Genome Biol. 2016, 17, 134. [Google Scholar] [CrossRef] [PubMed]
  24. Keller, J.; Rousseau-Gueutin, M.; Martin, G.E.; Morice, J.; Boutte, J.; Coissac, E.; Ourari, M.; Ainouche, M.; Salmon, A.; Cabello-Hurtado, F.; et al. The evolutionary fate of the chloroplast and nuclear rps16 genes as revealed through the sequencing and comparative analyses of four novel legume chloroplast genomes from Lupinus. DNA Res. Int. J. Rapid Publ. Rep. Genes Genomes 2017, 24, 343–358. [Google Scholar] [CrossRef] [PubMed]
  25. Jansen, R.K.; Saski, C.; Lee, S.B.; Hansen, A.K.; Daniell, H. Complete plastid genome sequences of three rosids (Castanea, Prunus, Theobroma): Evidence for at least two independent transfers of rpl22 to the nucleus. Mol. Biol. Evol. 2011, 28, 835–847. [Google Scholar] [CrossRef] [PubMed]
  26. Gantt, J.S.; Baldauf, S.L.; Calie, P.J.; Weeden, N.F.; Palmer, J.D. Transfer of rpl22 to the nucleus greatly preceded its loss from the chloroplast and involved the gain of an intron. EMBO J. 1991, 10, 3073–3078. [Google Scholar] [PubMed]
  27. Steane, D.A. Complete nucleotide sequence of the chloroplast genome from the tasmanian blue gum, Eucalyptus globulus (Myrtaceae). DNA Res. Int. J. Rapid Publ. Rep. Genes Genomes 2005, 12, 215–220. [Google Scholar] [CrossRef] [PubMed]
  28. Jansen, R.K.; Cai, Z.; Raubeson, L.A.; Daniell, H.; Depamphilis, C.W.; Leebens-Mack, J.; Muller, K.F.; Guisinger-Bellian, M.; Haberle, R.C.; Hansen, A.K.; et al. Analysis of 81 genes from 64 plastid genomes resolves relationships in angiosperms and identifies genome-scale evolutionary patterns. Proc. Nat. Acad. Sci. USA 2007, 104, 19369–19374. [Google Scholar] [CrossRef] [PubMed]
  29. Magee, A.M.; Aspinall, S.; Rice, D.W.; Cusack, B.P.; Semon, M.; Perry, A.S.; Stefanovic, S.; Milbourne, D.; Barth, S.; Palmer, J.D.; et al. Localized hypermutation and associated gene losses in legume chloroplast genomes. Genome Res. 2010, 20, 1700–1710. [Google Scholar] [CrossRef] [PubMed]
  30. Park, S.; Jansen, R.K.; Park, S. Complete plastome sequence of Thalictrum coreanum (ranunculaceae) and transfer of the rpl32 gene to the nucleus in the ancestor of the subfamily thalictroideae. BMC Plant Biol. 2015, 15, 40. [Google Scholar] [CrossRef] [PubMed]
  31. Ueda, M.; Fujimoto, M.; Arimura, S.; Murata, J.; Tsutsumi, N.; Kadowaki, K. Loss of the rpl32 gene from the chloroplast genome and subsequent acquisition of a preexisting transit peptide within the nuclear gene in Populus. Gene 2007, 402, 51–56. [Google Scholar] [CrossRef] [PubMed]
  32. Jo, Y.D.; Park, J.; Kim, J.; Song, W.; Hur, C.G.; Lee, Y.H.; Kang, B.C. Complete sequencing and comparative analyses of the pepper (Capsicum annuum L.) plastome revealed high frequency of tandem repeats and large insertion/deletions on pepper plastome. Plant Cell Rep. 2011, 30, 217–229. [Google Scholar] [CrossRef] [PubMed]
  33. Sloan, D.B.; Triant, D.A.; Forrester, N.J.; Bergner, L.M.; Wu, M.; Taylor, D.R. A recurring syndrome of accelerated plastid genome evolution in the angiosperm tribe Sileneae (caryophyllaceae). Mol. Phylogenet. Evol. 2014, 72, 82–89. [Google Scholar] [CrossRef] [PubMed]
  34. Martin, G.E.; Rousseau-Gueutin, M.; Cordonnier, S.; Lima, O.; Michon-Coudouel, S.; Naquin, D.; de Carvalho, J.F.; Ainouche, M.; Salmon, A.; Ainouche, A. The first complete chloroplast genome of the genistoid legume Lupinus luteus: Evidence for a novel major lineage-specific rearrangement and new insights regarding plastome evolution in the legume family. Annu. Bot. 2014, 113, 1197–1210. [Google Scholar] [CrossRef] [PubMed] [Green Version]
  35. Haberle, R.C.; Fourcade, H.M.; Boore, J.L.; Jansen, R.K. Extensive rearrangements in the chloroplast genome of Trachelium caeruleum are associated with repeats and tRNA genes. J. Mol. Evol. 2008, 66, 350–361. [Google Scholar] [CrossRef] [PubMed]
  36. Provan, J.; Corbett, G.; McNicol, J.W.; Powell, W. Chloroplast DNA variability in wild and cultivated rice (Oryza spp.) revealed by polymorphic chloroplast simple sequence repeats. Genome 1997, 40, 104–110. [Google Scholar] [CrossRef] [PubMed]
  37. Xue, J.; Wang, S.; Zhou, S.L. Polymorphic chloroplast microsatellite loci in Nelumbo (nelumbonaceae). Am. J. Bot. 2012, 99, e240–e244. [Google Scholar] [CrossRef] [PubMed]
  38. Pauwels, M.; Vekemans, X.; Gode, C.; Frerot, H.; Castric, V.; Saumitou-Laprade, P. Nuclear and chloroplast DNA phylogeography reveals vicariance among european populations of the model species for the study of metal tolerance, Arabidopsis halleri (Brassicaceae). New Phytol. 2012, 193, 916–928. [Google Scholar] [CrossRef] [PubMed]
  39. Kuang, D.Y.; Wu, H.; Wang, Y.L.; Gao, L.M.; Zhang, S.Z.; Lu, L. Complete chloroplast genome sequence of Magnolia kwangsiensis (Magnoliaceae): Implication for DNA barcoding and population genetics. Genome 2011, 54, 663–673. [Google Scholar] [CrossRef] [PubMed]
  40. Zhu, J.K. Salt and drought stress signal transduction in plants. Annu. Rev. Plant Biol. 2002, 53, 247–273. [Google Scholar] [CrossRef] [PubMed]
  41. Mignolet-Spruyt, L.; Xu, E.; Idanheimo, N.; Hoeberichts, F.A.; Muhlenbock, P.; Brosche, M.; van Breusegem, F.; Kangasjarvi, J. Spreading the news: Subcellular and organellar reactive oxygen species production and signalling. J. Exp. Bot. 2016, 67, 3831–3844. [Google Scholar] [CrossRef] [PubMed]
  42. Ichimura, K.; Mizoguchi, T.; Yoshida, R.; Yuasa, T.; Shinozaki, K. Various abiotic stresses rapidly activate Arabidopsis MAP kinases ATMPK4 and ATMPK6. Plant J. Cell Mol. Biol. 2000, 24, 655–665. [Google Scholar] [CrossRef]
  43. Iuchi, S.; Kobayashi, M.; Taji, T.; Naramoto, M.; Seki, M.; Kato, T.; Tabata, S.; Kakubari, Y.; Yamaguchi-Shinozaki, K.; Shinozaki, K. Regulation of drought tolerance by gene manipulation of 9-cis-epoxycarotenoid dioxygenase, a key enzyme in abscisic acid biosynthesis in Arabidopsis. Plant J. Cell Mol. Biol. 2001, 27, 325–333. [Google Scholar] [CrossRef]
  44. Ishitani, M.; Liu, J.; Halfter, U.; Kim, C.S.; Shi, W.; Zhu, J.K. Sos3 function in plant salt tolerance requires n-myristoylation and calcium binding. Plant Cell 2000, 12, 1667–1678. [Google Scholar] [CrossRef] [PubMed]
  45. Chen, H.H.; Li, P.H.; Brenner, M.L. Involvement of abscisic acid in potato cold acclimation. Plant Physiol. 1983, 71, 362–365. [Google Scholar] [CrossRef] [PubMed]
  46. Choi, H.; Hong, J.; Ha, J.; Kang, J.; Kim, S.Y. ABFs, a family of ABA-responsive element binding factors. J. Biol. Chem. 2000, 275, 1723–1730. [Google Scholar] [CrossRef] [PubMed]
  47. Gustin, M.C.; Albertyn, J.; Alexander, M.; Davenport, K. MAP kinase pathways in the yeast Saccharomyces cerevisiae. Microbiol. Mol. Biol. Rev. (MMBR) 1998, 62, 1264–1300. [Google Scholar] [PubMed]
  48. Jacob, T.; Ritchie, S.; Assmann, S.M.; Gilroy, S. Abscisic acid signal transduction in guard cells is mediated by phospholipase D activity. Proc. Nat. Acad. Sci. USA 1999, 96, 12192–12197. [Google Scholar] [CrossRef] [PubMed]
  49. Ingram, J.; Bartels, D. The molecular basis of dehydration tolerance in plants. Annu. Rev. Plant Physiol. Plant Mol. Biol. 1996, 47, 377–403. [Google Scholar] [CrossRef] [PubMed]
  50. Jaglo-Ottosen, K.R.; Gilmour, S.J.; Zarka, D.G.; Schabenberger, O.; Thomashow, M.F. Arabidopsis CBF1 overexpression induces COR genes and enhances freezing tolerance. Science 1998, 280, 104–106. [Google Scholar] [CrossRef] [PubMed]
  51. Jonak, C.; Kiegerl, S.; Ligterink, W.; Barker, P.J.; Huskisson, N.S.; Hirt, H. Stress signaling in plants: A mitogen-activated protein kinase pathway is activated by cold and drought. Proc. Nat. Acad. Sci. USA 1996, 93, 11274–11279. [Google Scholar] [CrossRef] [PubMed]
  52. Knight, H.; Trewavas, A.J.; Knight, M.R. Calcium signalling in Arabidopsis thaliana responding to drought and salinity. Plant J. Cell Mol. Biol. 1997, 12, 1067–1078. [Google Scholar] [CrossRef]
  53. Katagiri, T.; Takahashi, S.; Shinozaki, K. Involvement of a novel Arabidopsis phospholipase D, AtPLDδ, in dehydration-inducible accumulation of phosphatidic acid in stress signalling. Plant J. Cell Mol. Biol. 2001, 26, 595–605. [Google Scholar] [CrossRef]
  54. Kovtun, Y.; Chiu, W.L.; Tena, G.; Sheen, J. Functional analysis of oxidative stress-activated mitogen-activated protein kinase cascade in plants. Proc. Nat. Acad. Sci. USA 2000, 97, 2940–2945. [Google Scholar] [CrossRef] [PubMed]
  55. Camacho, C.; Coulouris, G.; Avagyan, V.; Ma, N.; Papadopoulos, J.; Bealer, K.; Madden, T.L. Blast+: Architecture and applications. BMC Bioinform. 2009, 10, 421. [Google Scholar] [CrossRef] [PubMed]
  56. Simpson, J.T.; Wong, K.; Jackman, S.D.; Schein, J.E.; Jones, S.J.; Birol, I. ABySS: A parallel assembler for short read sequence data. Genome Res. 2009, 19, 1117–1123. [Google Scholar] [CrossRef] [PubMed]
  57. Langmead, B.; Trapnell, C.; Pop, M.; Salzberg, S.L. Ultrafast and memory-efficient alignment of short DNA sequences to the human genome. Genome Biol. 2009, 10, R25. [Google Scholar] [CrossRef] [PubMed]
  58. Liu, C.; Shi, L.; Zhu, Y.; Chen, H.; Zhang, J.; Lin, X.; Guan, X. CpGAVAS, an integrated web server for the annotation, visualization, analysis, and genbank submission of completely sequenced chloroplast genome sequences. BMC Genom. 2012, 13, 715. [Google Scholar] [CrossRef] [PubMed]
  59. Laslett, D.; Canback, B. ARAGORN, a program to detect tRNA genes and tmRNA genes in nucleotide sequences. Nucleic Acids Res. 2004, 32, 11–16. [Google Scholar] [CrossRef] [PubMed]
  60. Schattner, P.; Brooks, A.N.; Lowe, T.M. The tRNAscan-SE, snoscan and snoGPS web servers for the detection of tRNAs and snoRNAs. Nucleic Acids Res. 2005, 33, W686–W689. [Google Scholar] [CrossRef] [PubMed]
  61. Misra, S.; Harris, N. Using apollo to browse and edit genome annotations. Curr. Protocol. Bioinform. 2006. Chapter 9, Unit 9 5. [Google Scholar] [CrossRef]
  62. Lohse, M.; Drechsel, O.; Bock, R. Organellargenomedraw (OGDRAW): A tool for the easy generation of high-quality custom graphical maps of plastid and mitochondrial genomes. Curr. Genet. 2007, 52, 267–274. [Google Scholar] [CrossRef] [PubMed]
  63. Rice, P.; Longden, I.; Bleasby, A. Emboss: The European molecular biology open software suite. Trends Genet. (TIG) 2000, 16, 276–277. [Google Scholar] [CrossRef]
  64. Kurtz, S.; Choudhuri, J.V.; Ohlebusch, E.; Schleiermacher, C.; Stoye, J.; Giegerich, R. REPuter: The manifold applications of repeat analysis on a genomic scale. Nucleic Acids Res. 2001, 29, 4633–4642. [Google Scholar] [CrossRef] [PubMed]
  65. Tangphatsornruang, S.; Sangsrakru, D.; Chanprasert, J.; Uthaipaisanwong, P.; Yoocha, T.; Jomchai, N.; Tragoonrung, S. The chloroplast genome sequence of mungbean (Vigna radiata) determined by high-throughput pyrosequencing: Structural organization and phylogenetic relationships. DNA Res. Int. J. Rapid Publ. Rep. Genes Genomes 2010, 17, 11–22. [Google Scholar] [CrossRef] [PubMed]
  66. Benson, G. Tandem repeats finder: A program to analyze DNA sequences. Nucleic Acids Res. 1999, 27, 573–580. [Google Scholar] [CrossRef] [PubMed]
  67. Lei, W.; Ni, D.; Wang, Y.; Shao, J.; Wang, X.; Yang, D.; Wang, J.; Chen, H.; Liu, C.; Lei, W. Intraspecific and heteroplasmic variations, gene losses and inversions in the chloroplast genome of Astragalus membranaceus. Sci. Rep. 2016, 6, 21669. [Google Scholar] [CrossRef] [PubMed]
  68. Frazer, K.A.; Pachter, L.; Poliakov, A.; Rubin, E.M.; Dubchak, I. Vista: Computational tools for comparative genomics. Nucleic Acids Res. 2004, 32, W273–W279. [Google Scholar] [CrossRef] [PubMed]
  69. Stamatakis, A. Raxml version 8: A tool for phylogenetic analysis and post-analysis of large phylogenies. Bioinformatics 2014, 30, 1312–1313. [Google Scholar] [CrossRef] [PubMed]
  70. Kimura, M. A simple method for estimating evolutionary rates of base substitutions through comparative studies of nucleotide sequences. J. Mol. Evol. 1980, 16, 111–120. [Google Scholar] [CrossRef] [PubMed]
  71. Wernersson, R.; Pedersen, A.G. RevTrans: Multiple alignment of coding DNA from aligned amino acid sequences. Nucleic Acids Res. 2003, 31, 3537–3539. [Google Scholar] [CrossRef] [PubMed]
  72. Smith, M.D.; Wertheim, J.O.; Weaver, S.; Murrell, B.; Scheffler, K.; Kosakovsky Pond, S.L. Less is more: An adaptive branch-site random effects model for efficient detection of episodic diversifying selection. Mol. Biol. Evol. 2015, 32, 1342–1353. [Google Scholar] [CrossRef] [PubMed]
  73. Yang, Z.; Nielsen, R. Codon-substitution models for detecting molecular adaptation at individual sites along specific lineages. Mol. Biol. Evol. 2002, 19, 908–917. [Google Scholar] [CrossRef] [PubMed]
Figure 1. Circular gene map of the C. rosea plastome. Genes drawn inside the circle are transcribed clockwise, and those outside the circle are transcribed counterclockwise. Genes belonging to different functional groups are color codes. The inner circle shows the GC content. The two grey arrows represent the direction of transcription.
Ijms 19 01419 g001
Figure 2. Statistics of simple sequence repeat (SSRs) detected in the plastome of four Caragana species. (A) Numbers of SSRs found in the coding (CDS), intergenic (IGS), and intronic regions, respectively; (B) number of different SSR types identified in the four genomes; and, (C) number of identified SSR motifs in different repeat class types.
Ijms 19 01419 g002
Figure 3. Structure comparison of the four plastomes by using the mVISTA program. Gray arrows and thick black lines above the alignment indicate genes with their orientation and the position of the IRs, respectively. A cut-off value of 70% identity was used for the plots, and the Y-scale represents the percent identity between 50% and 100%. UTR: Untranlated Regions; CNS: Conserved Non-coding Sequences. A: IGS(rps12-clpP); B: IGS(rps19-rp12); C: IGS(psaC-ndhD).
Ijms 19 01419 g003
Figure 4. K2p distances for introns among C. rosea, C. microphylla, C. kozlowii, and C. korshinskii.
Ijms 19 01419 g004
Figure 5. K2p distances for IGS regions among C. rosea, C. microphylla, C. kozlowii, and C. korshinskii.
Ijms 19 01419 g005
Figure 6. Molecular phylogenetic analyses of plastomes in the inverted-repeat-lacking clade of Papilionoideae. The tree was constructed with the sequences of 63 proteins present in all 36 species by using the maximum likelihood method implemented in RAxML. Bootstrap supports were calculated from 1000 replicates. Nicotiana tabacum and Arabidopsis thaliana were set as outgroups.
Ijms 19 01419 g006
Table 1. Characteristics of Caragana plastome.
Plastome CharacteristicsC. roseaC. microphyllaC. kozlowiiC. korshinskii
complete genome length133,122 bp130,029 bp131,274 bp129,331 bp
No.of unique genes110110110110
No.of unique protein-coding genes76767676
No.of unique tRNA genes30303030
No.of unique rRNA genes4444
Size of protein-coding genes66,243 bp (49.76%)66,231 bp (50.94%)66,234 bp (50.45%)66,231 bp (51.21%)
Size of tRNA genes2359 bp (1.77%)2370 bp (1.82%)2285 bp (1.74%)2370 bp (1.83)
Size of rRNA genes4537 bp (3.4%)4520 bp (3.48%)4521 bp (3.44%)4520 bp (3.49)
Overall GC contents34.84%34.26%34.50%34.36%
GC contents of protein-coding genes Coding GC 37.13% Coding GC 36.88% Coding GC 37.03% Coding GC 36.88%
#1st position 45.36% #1st position 44.98% #1st position 45.30% #1st position 44.96%
#2nd position 37.62% #2nd position 37.67% #2nd position 37.58% #2nd position 37.67%
#3rd position 28.41%#3rd position 27.99%#3rd position 28.21%#3rd position 27.99%
GC contents of tRNA genes52.73%53.14%53.15%53.05%
GC contents of rRNA genes54.77%54.82%54.75%54.82%
Table 2. Gene losses in the plastomes from the inverted-repeat-lacking clade (IRLC) of Papilionoideae.
CategoryName of Speciesrps16rpl22ycf15ycf4psaIycf1rpl23rps18ndhB
MillettieaeW. floribunda++++++
W. sinensis+++++
GalegeaeG. glabra++++++
G. lepidota++++++
A. mongholicus++++++
A. mongholicus var. nakaianus++++++
CaraganeaeC. kozlowii++++++
C. korshinskii++++++
C. microphylla++++++
C. rosea var. rosea++++++
CicereaeC. arietinum+++++
TrifolieaeM. truncatula+++++
M. papillosa+++++
M. hybrida+++++
M. falcata++++
T. boissieri+++++
T. glanduliferum+++++
FabeaeT. strictum+++++
L. sativus++++
L. odoratus+++
L. inconspicuus++++
L. ochroleucus+++++
L. venosus+++++
L. palustris+++++
L. tingitanus++++
L. davidii++++
L. graminifolius+++++
L. littoralis+++++
L. japonicus+++++
L. pubescens++++
L. clymenum+++++
P. sativum++++
V. sativa++++
L. culinaris+++
Number a3434322254332
a The number refers to the total number of species that do not have the gene. “+”: presence; “−” absence.
Table 3. The results of positive selection genes at Caragana branch.
GeneBLRTTest p-ValueUncorrected p-Valueω Distribution over Sites
rpl160.012817.42340.00370.0001ω1 = 0.121 (98%)
ω2 = 781 (1.9%)
rpl200.012831.040100ω1 = 0.147 (99%)
ω2 = 290 (0.92%)
rps110.012812.03030.04520.0008ω1 = 0.226 (100%)
ω2 = 0.824 (0.20%)
ω3 = 10000 (0.14%)
rps70.012824.32890.00010ω1 = 0.00 (100%)
ω2 = 286 (0.43%)
ycf10.012834.437200ω1 = 0.384 (99%)
ω2 = 91.3 (0.74%)
B: Optimized branch length; LRT: Likelihood ratio test statistic for selection; Test p-value: p-value corrected for multiple testing; Uncorrected p-value: Raw p-value without correction for multiple testing.

