Polysaccharides Extracted from Rhizoma Pleionis Have Antitumor Properties In Vitro and in an H22 Mouse Hepatoma Ascites Model In Vivo

Abstract

1. Introduction
2. Results
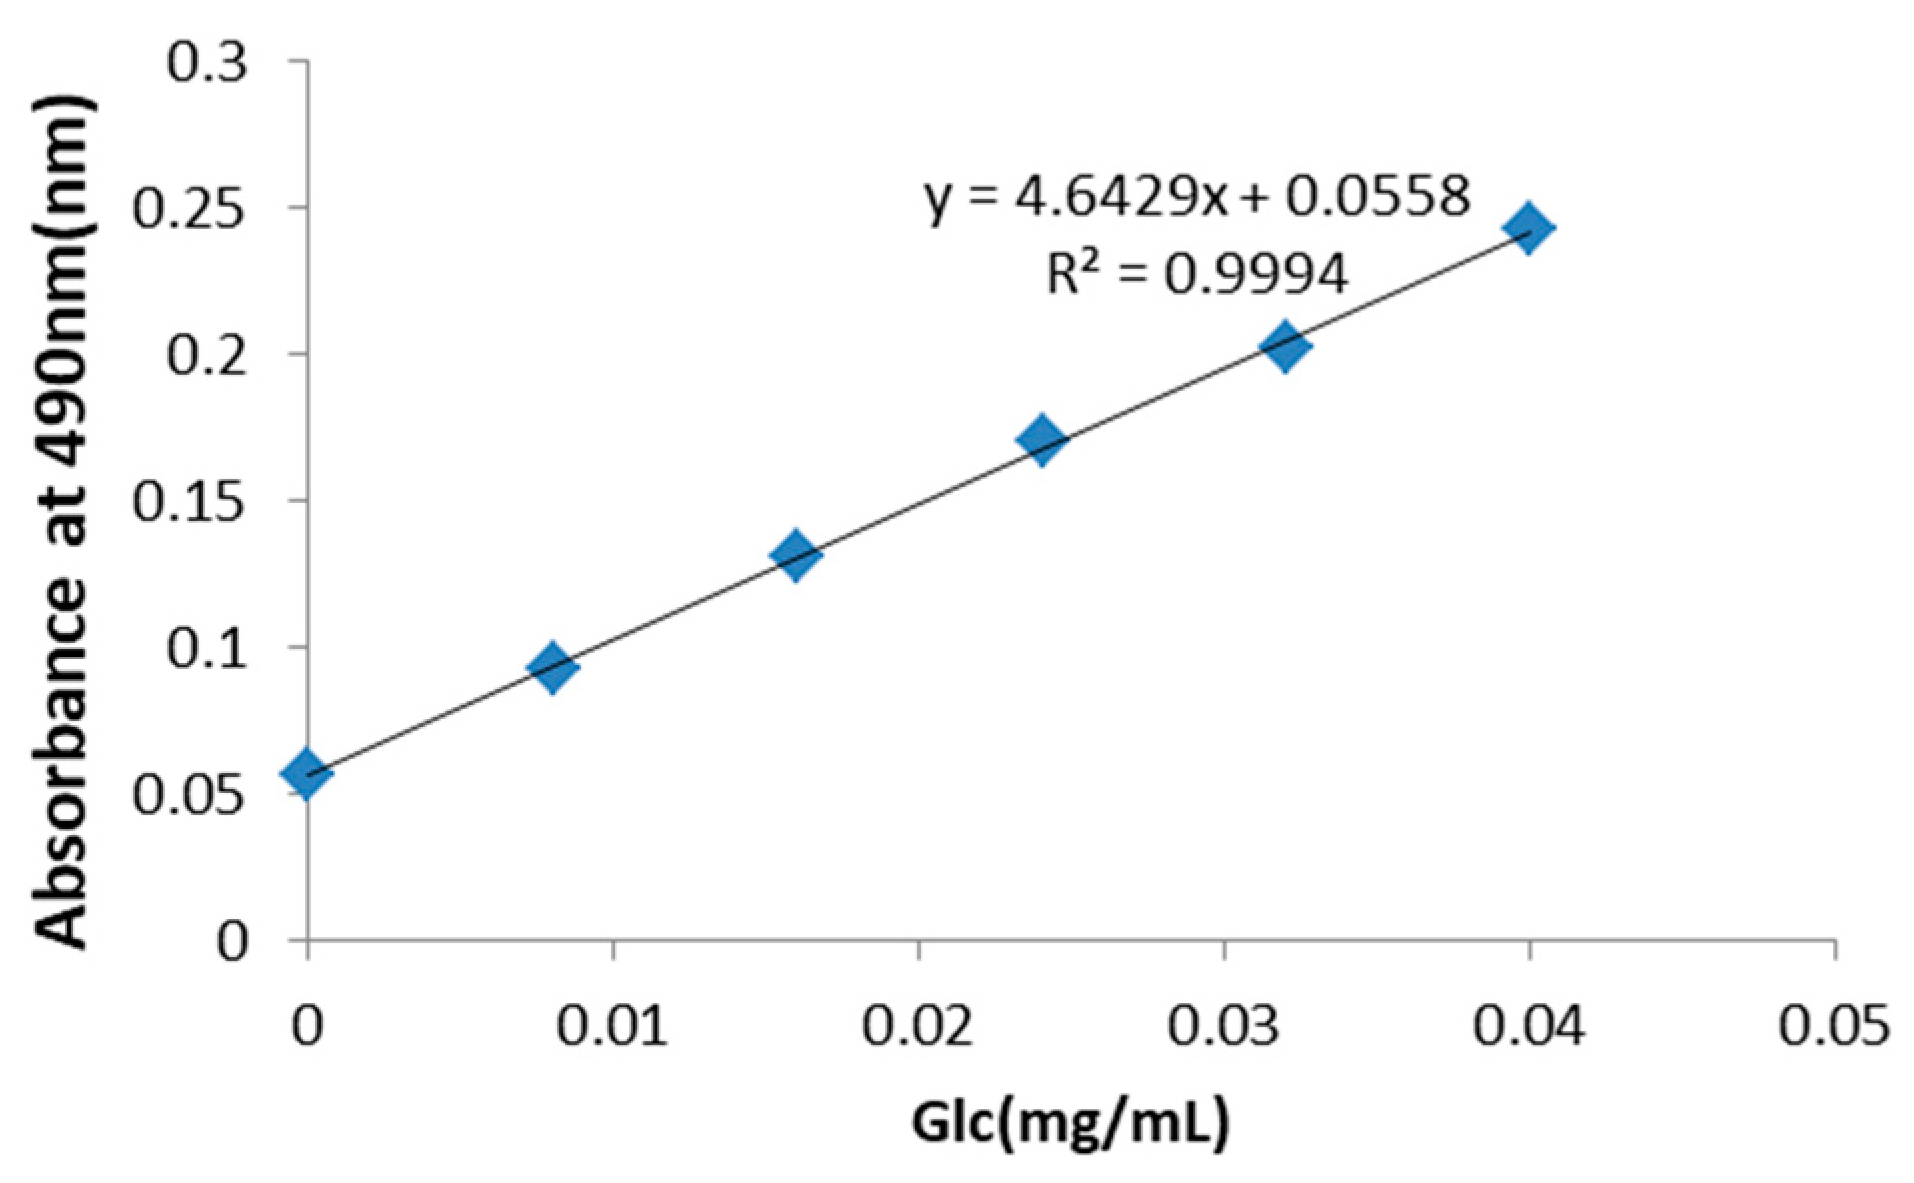
2.1. PRP Analysis
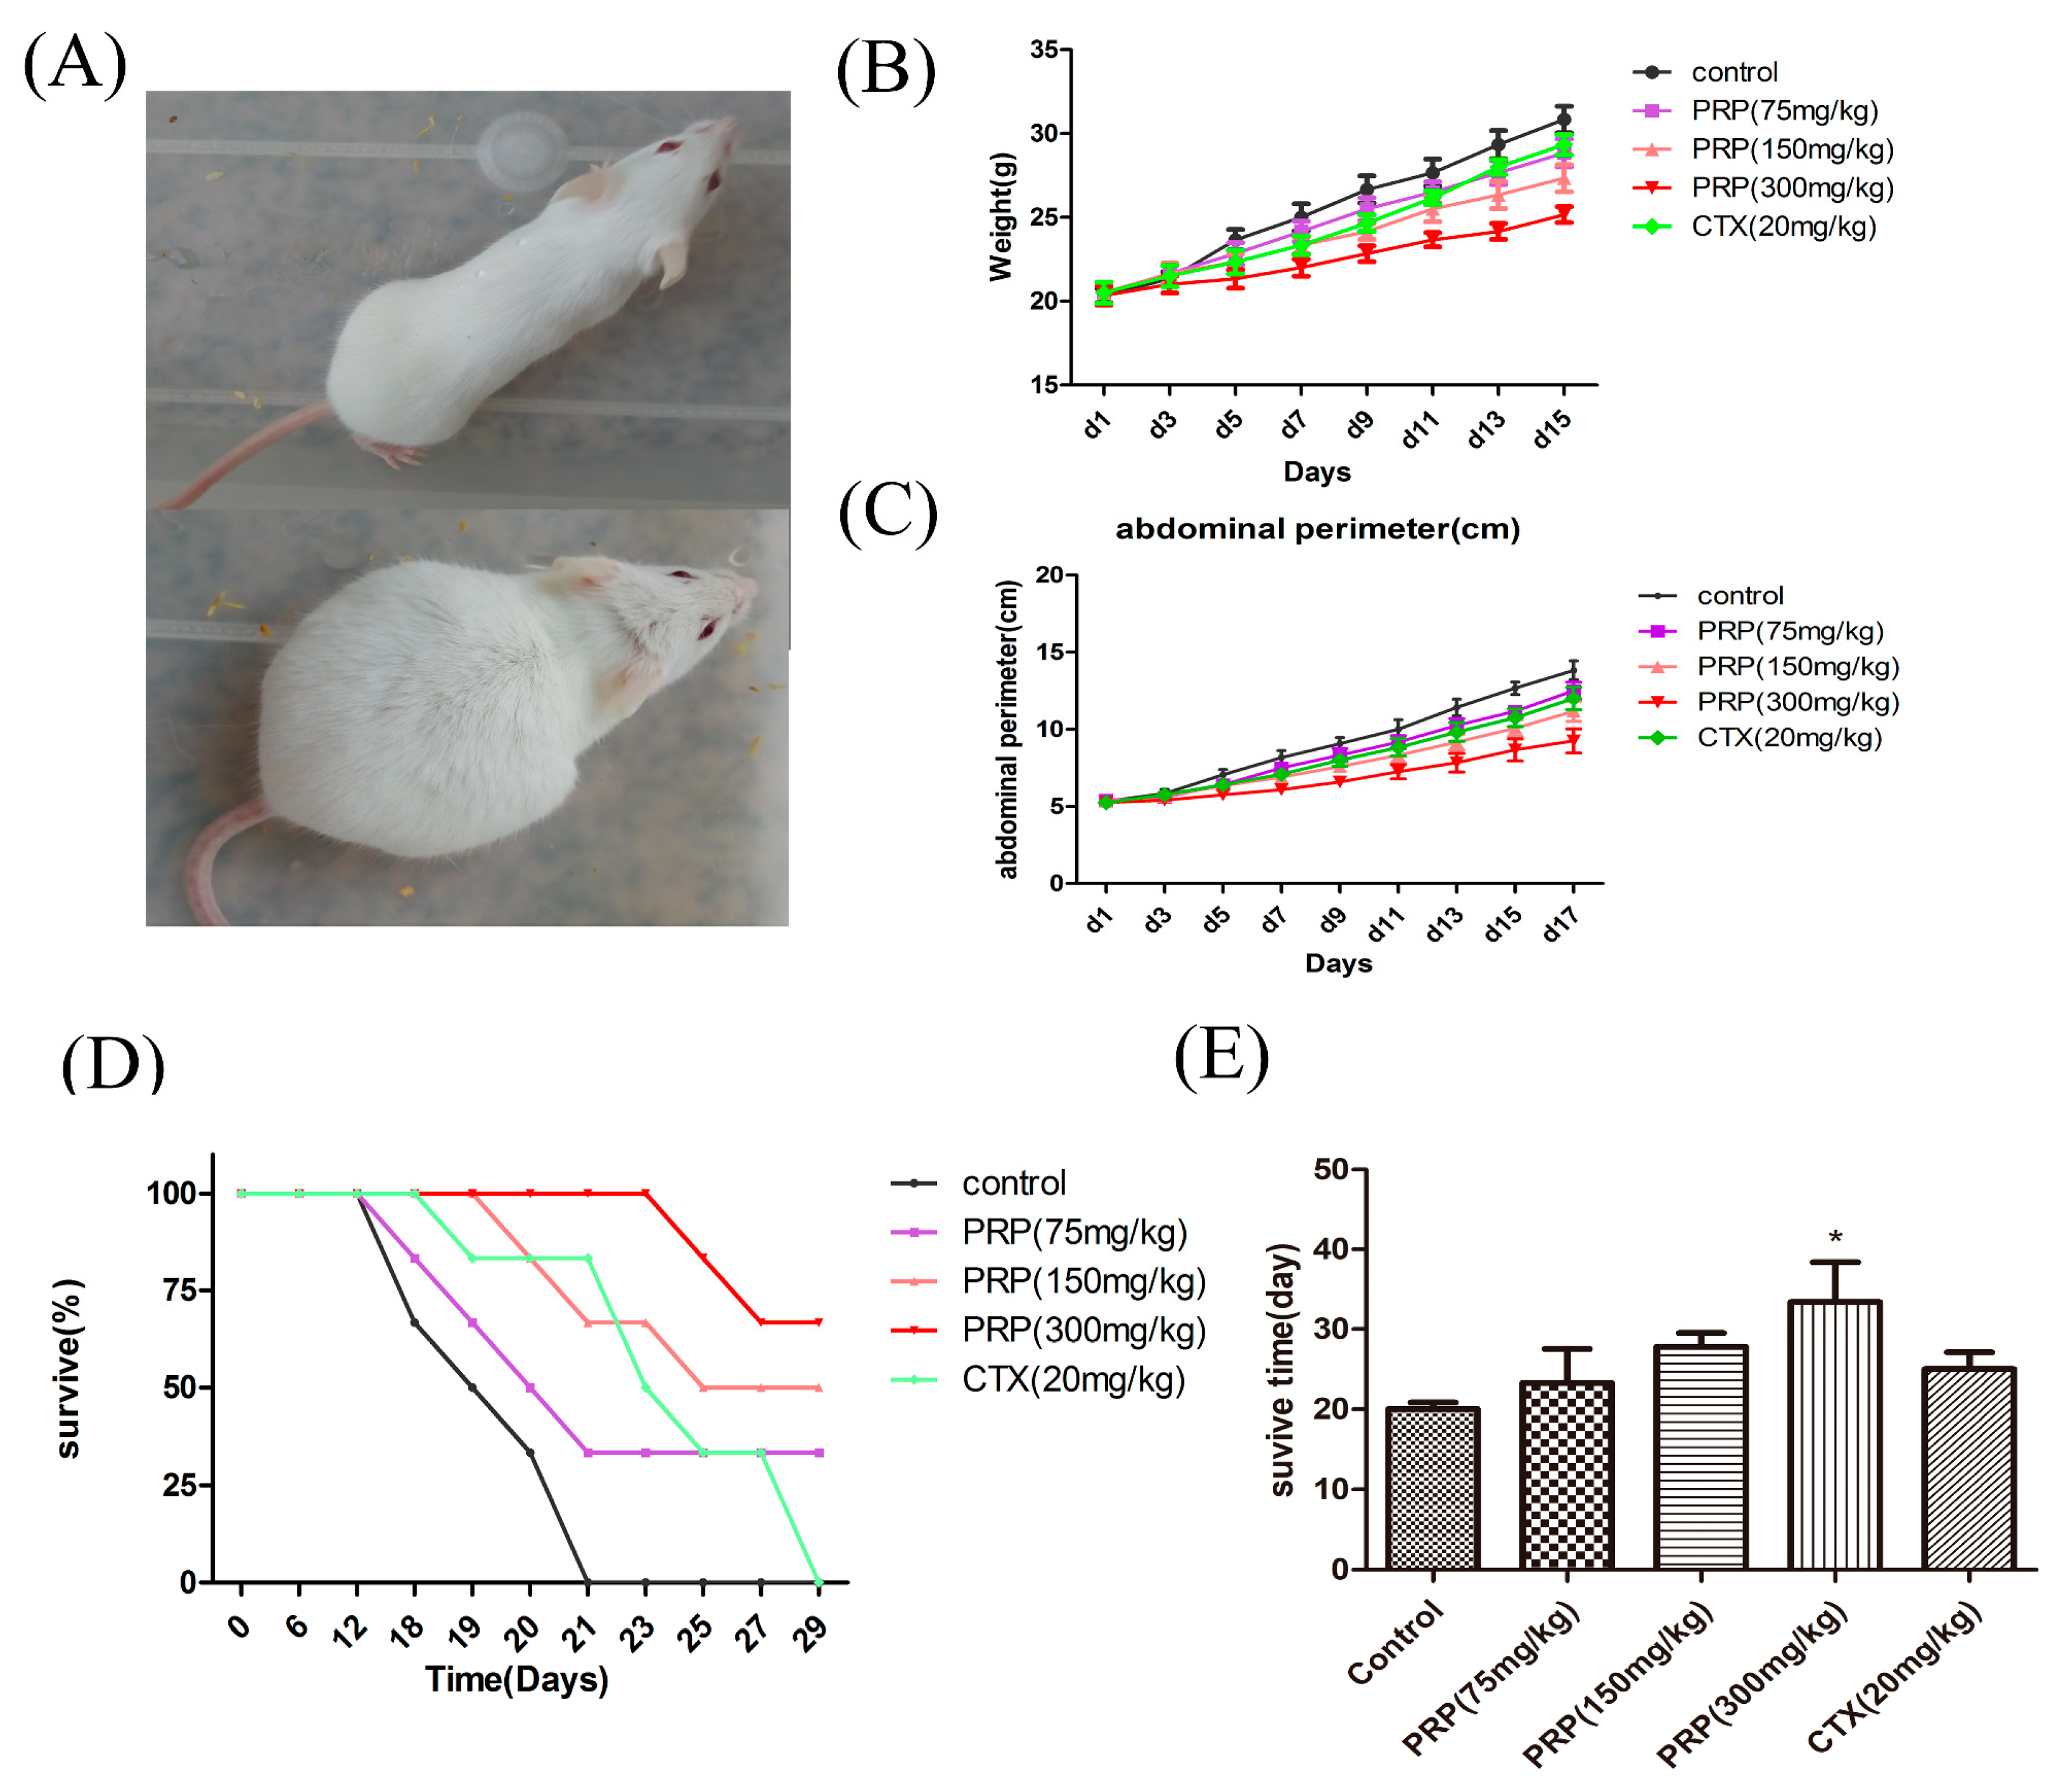
2.2. Antitumor Effects of PRP In Vivo
2.3. PRP-Mediated Effects on Cell Proliferation
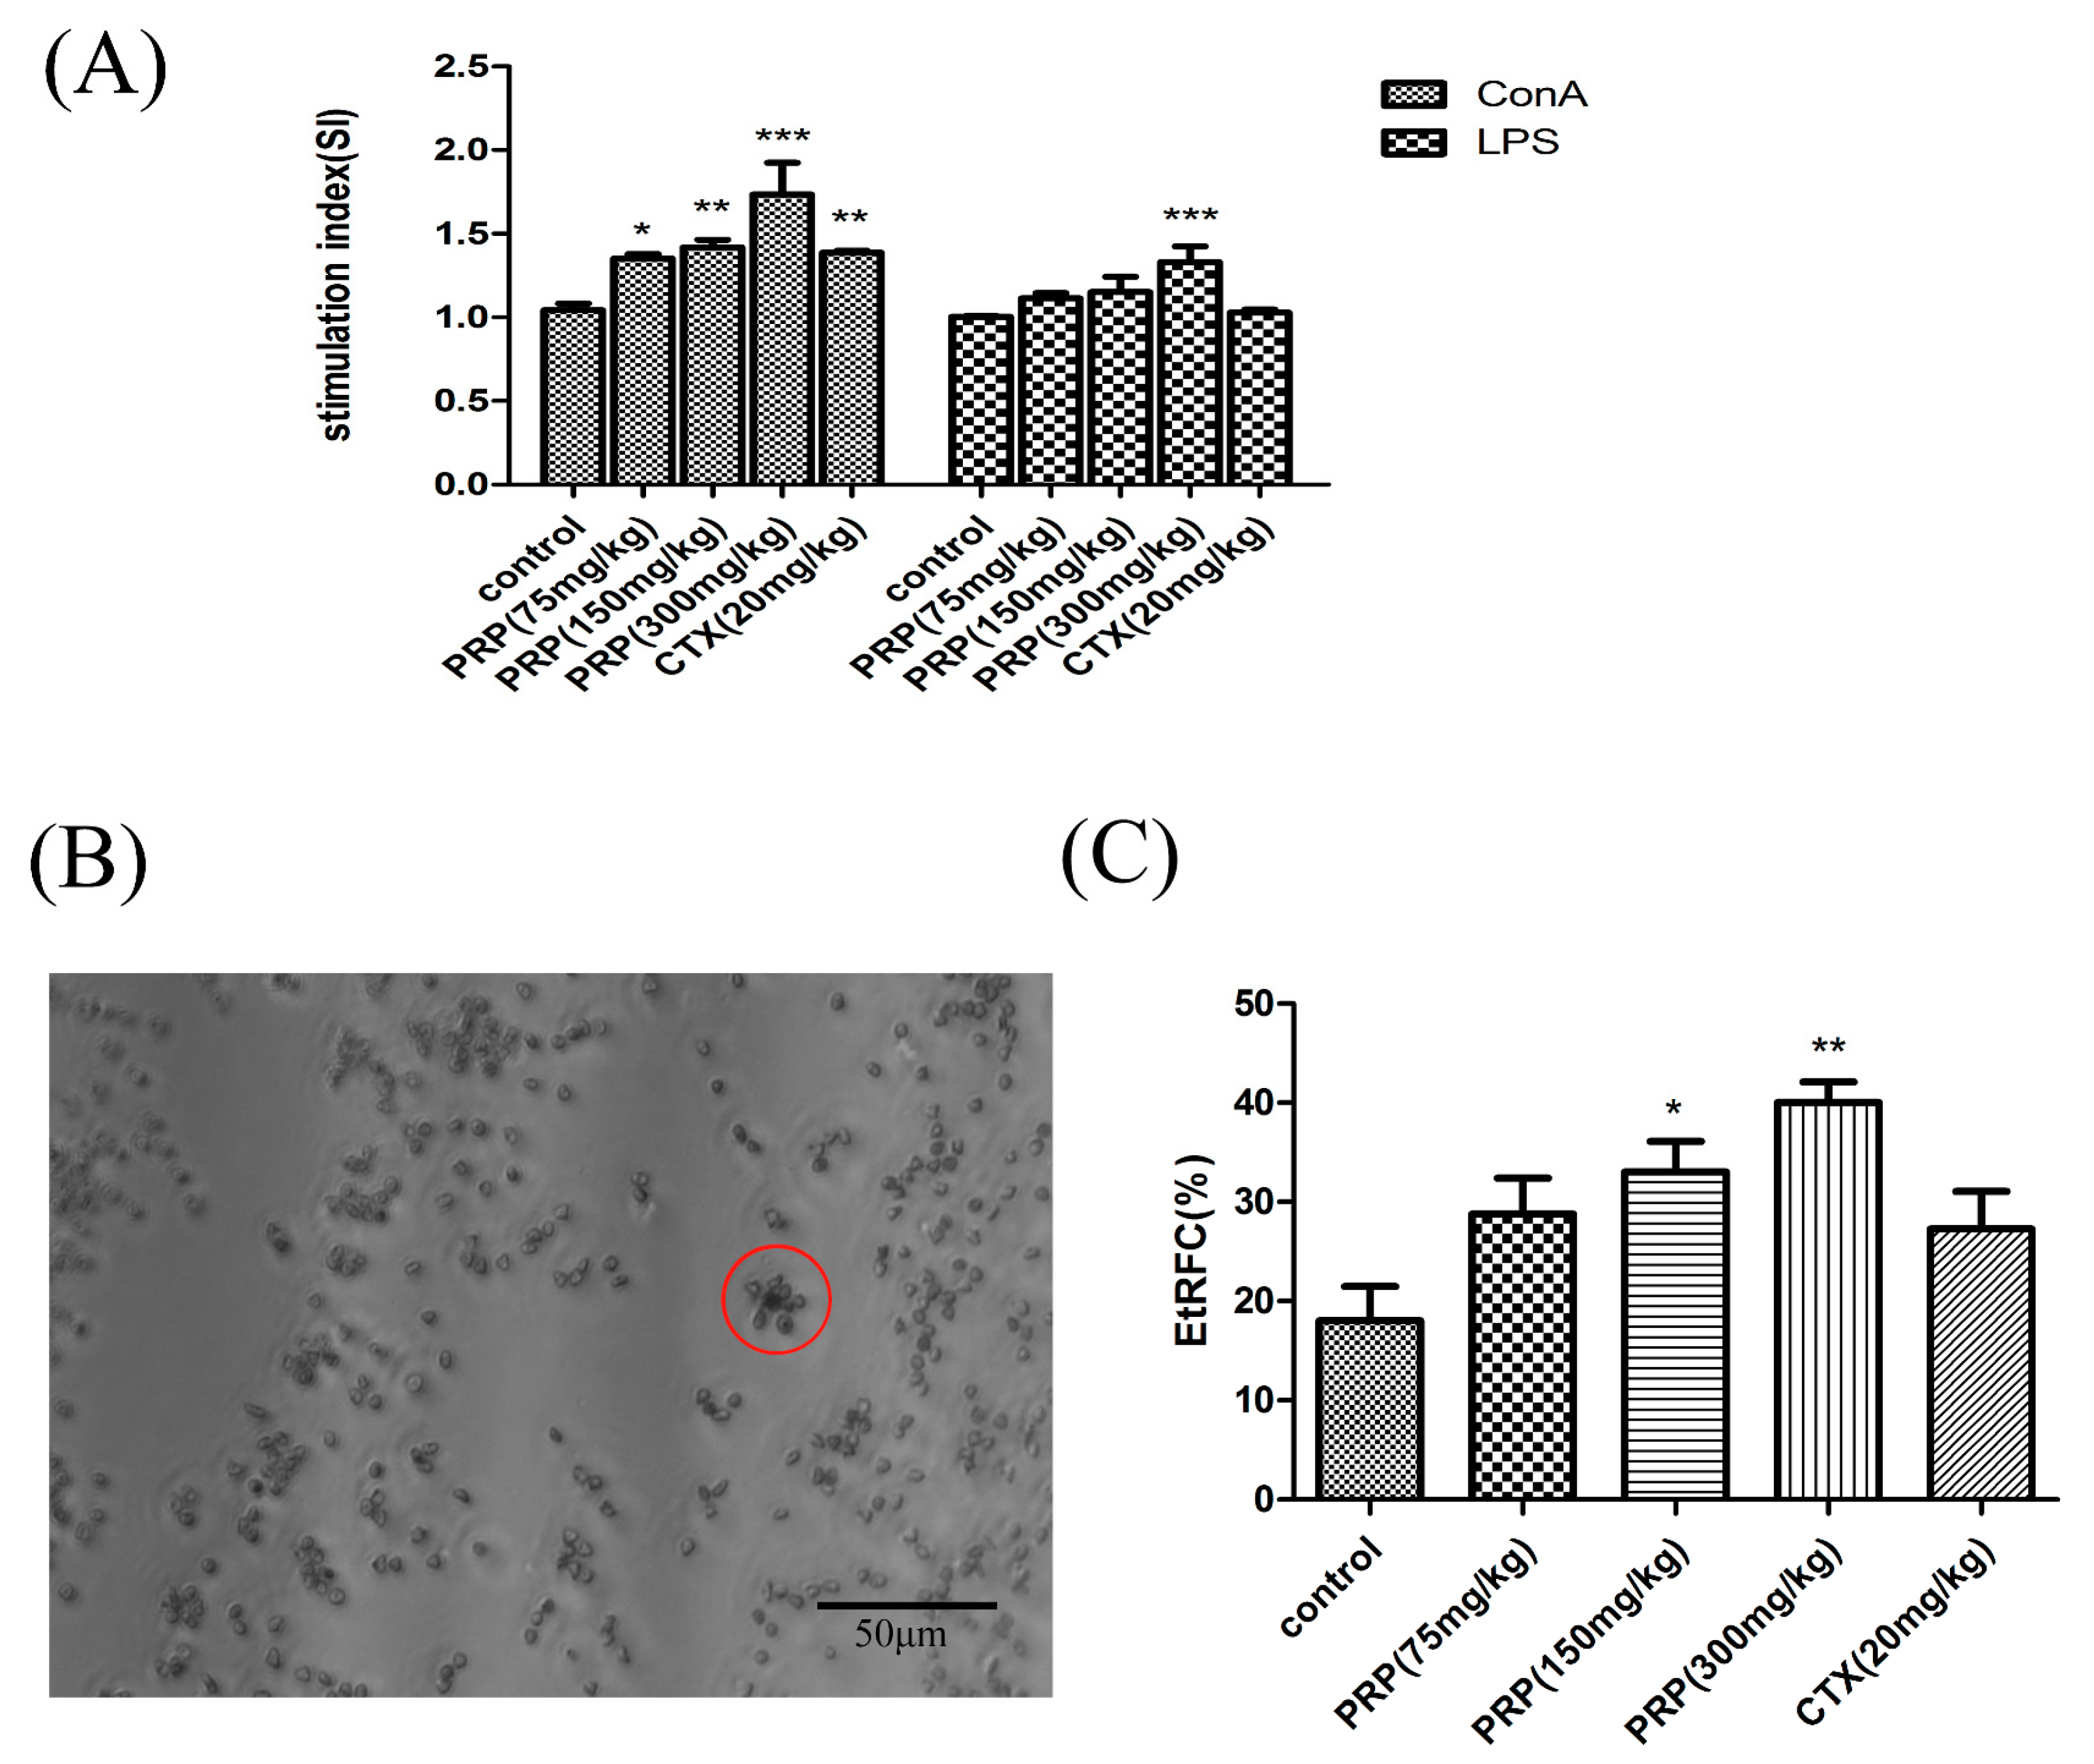
2.3.1. Effects of PRP on T Cell and B Cell Spleen Lymphocyte Proliferation
2.3.2. Effects of PRP on CD8+ T Lymphocytes and NK Cells and Foxp3 mRNA Expression
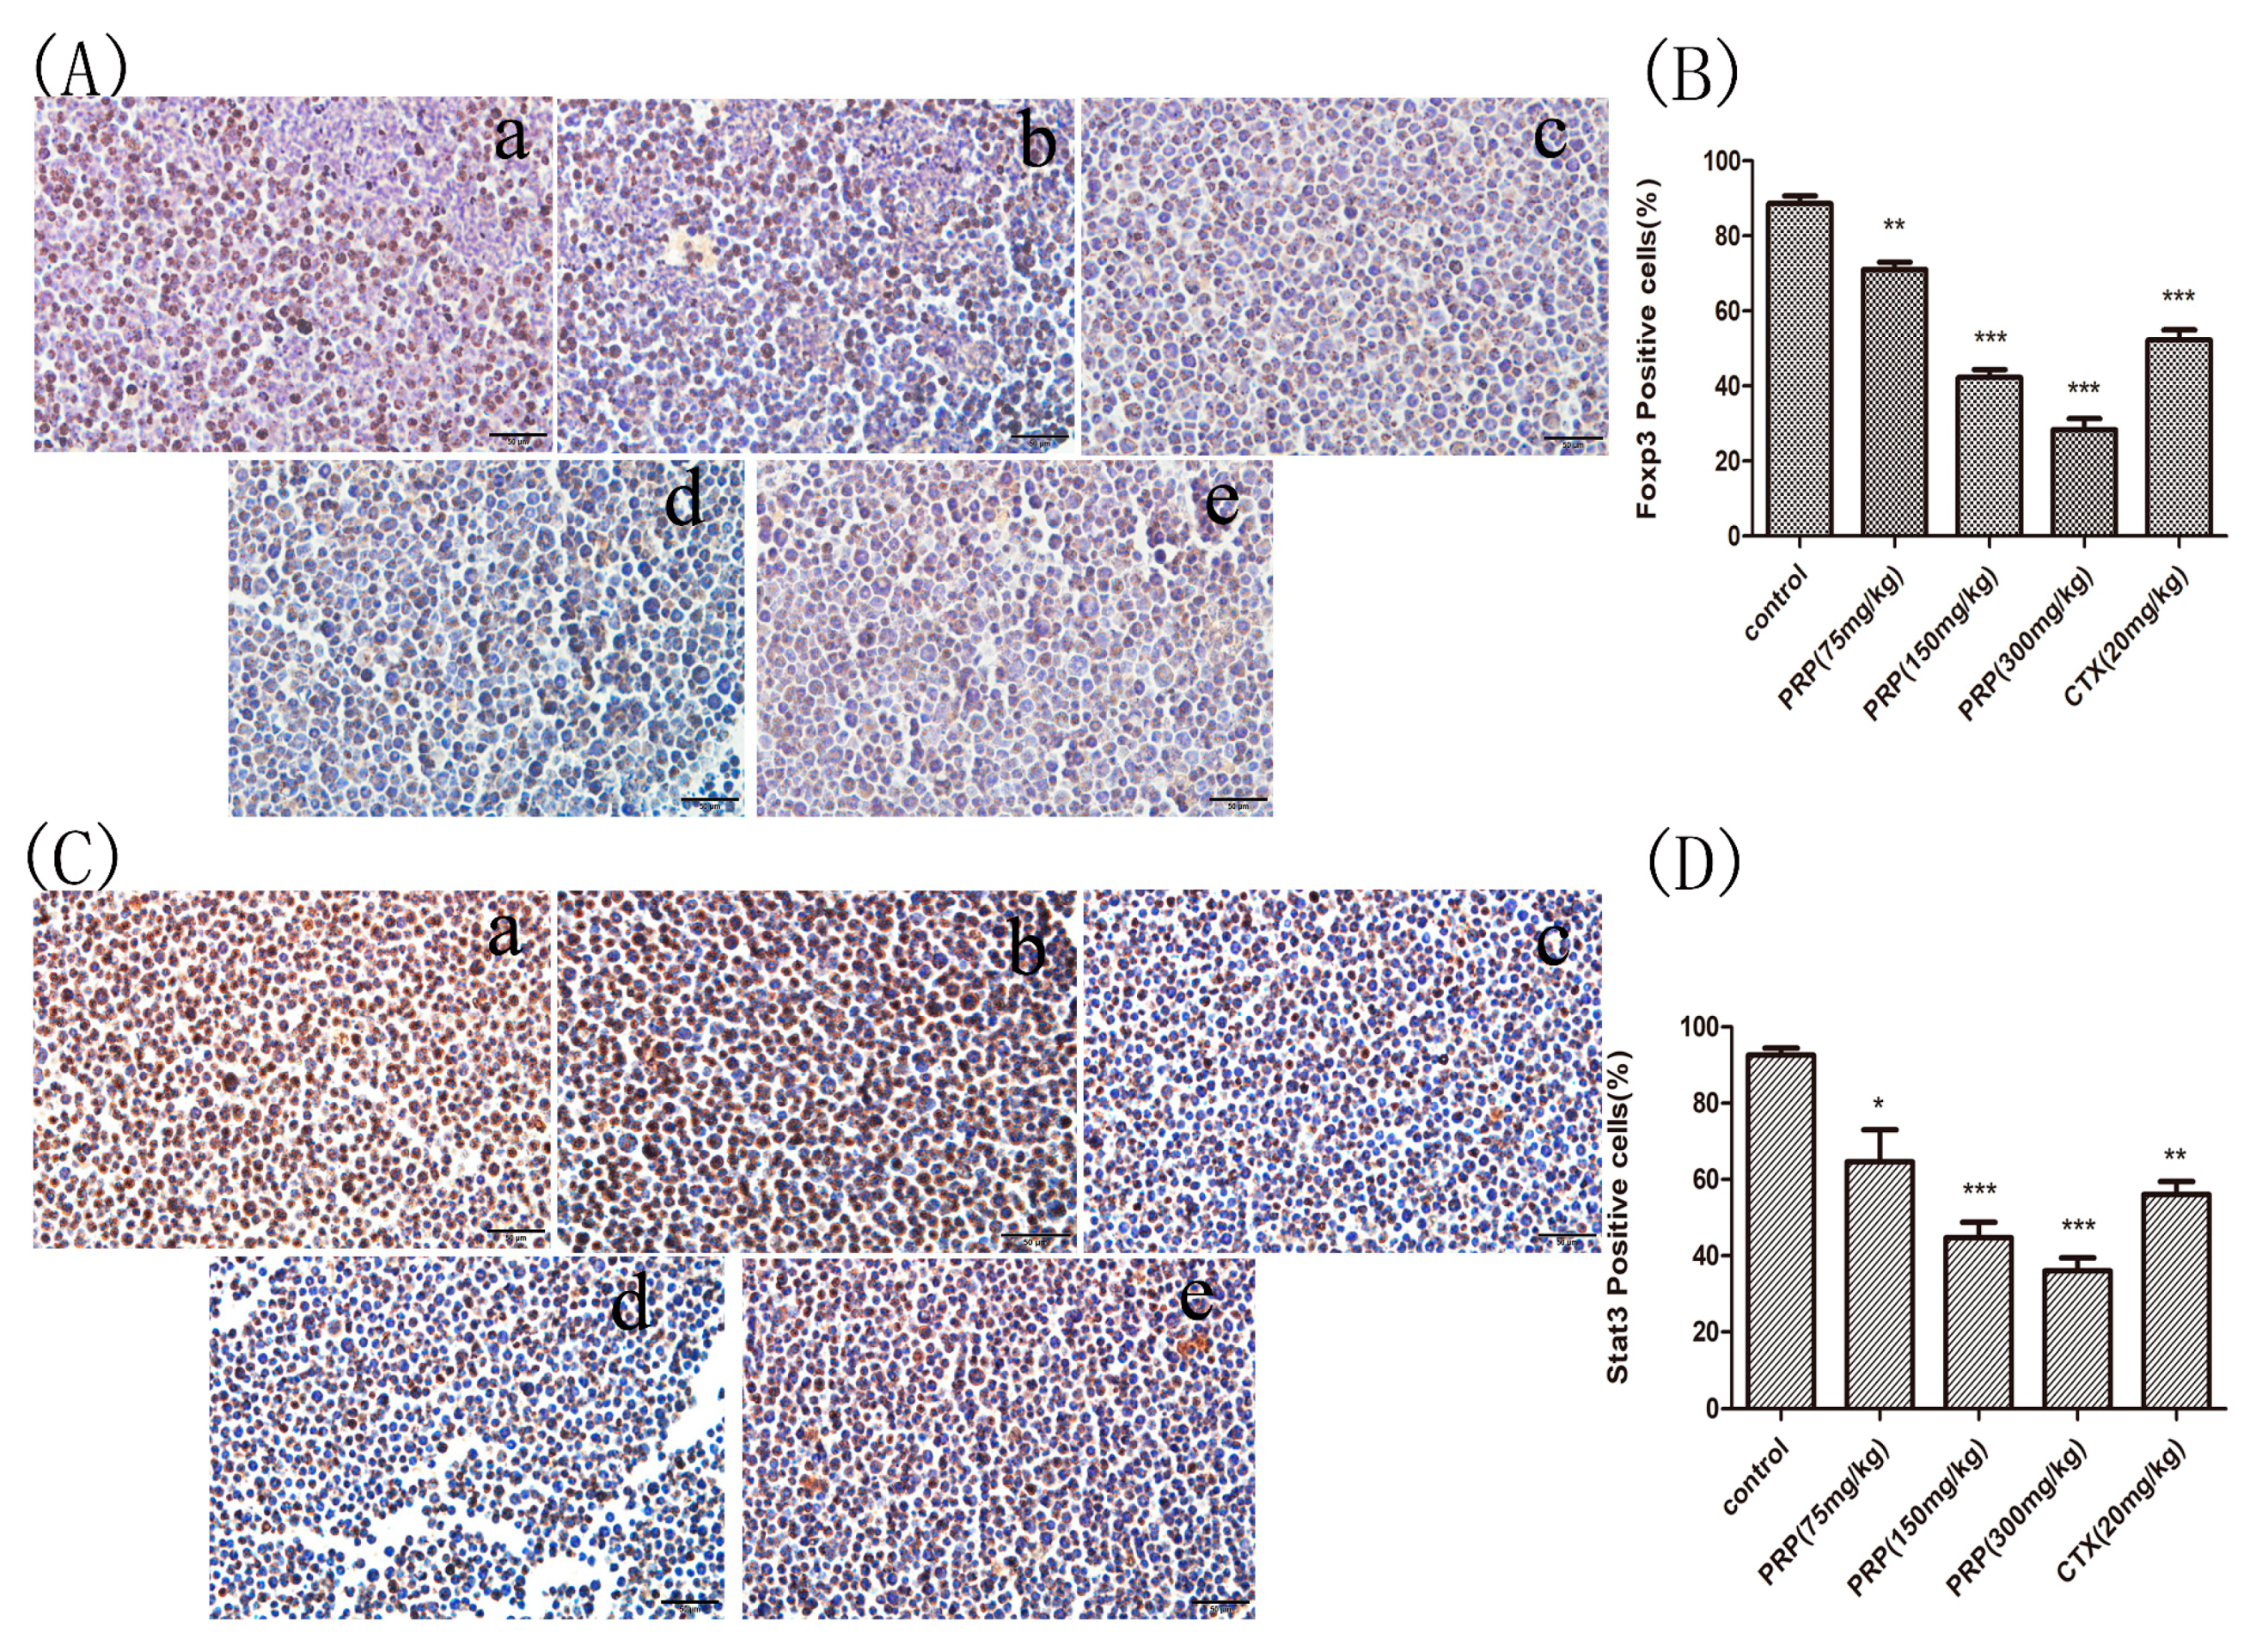
2.3.3. Foxp3 and Stat3 Immunocytochemical Analysis of Mouse Peritoneal Cells
2.3.4. PRP-Mediated Effects on Serum and Ascites Cytokine Levels
2.3.5. Mannose and Glucose Serum Concentrations
2.4. PRP Antitumor Properties In Vitro
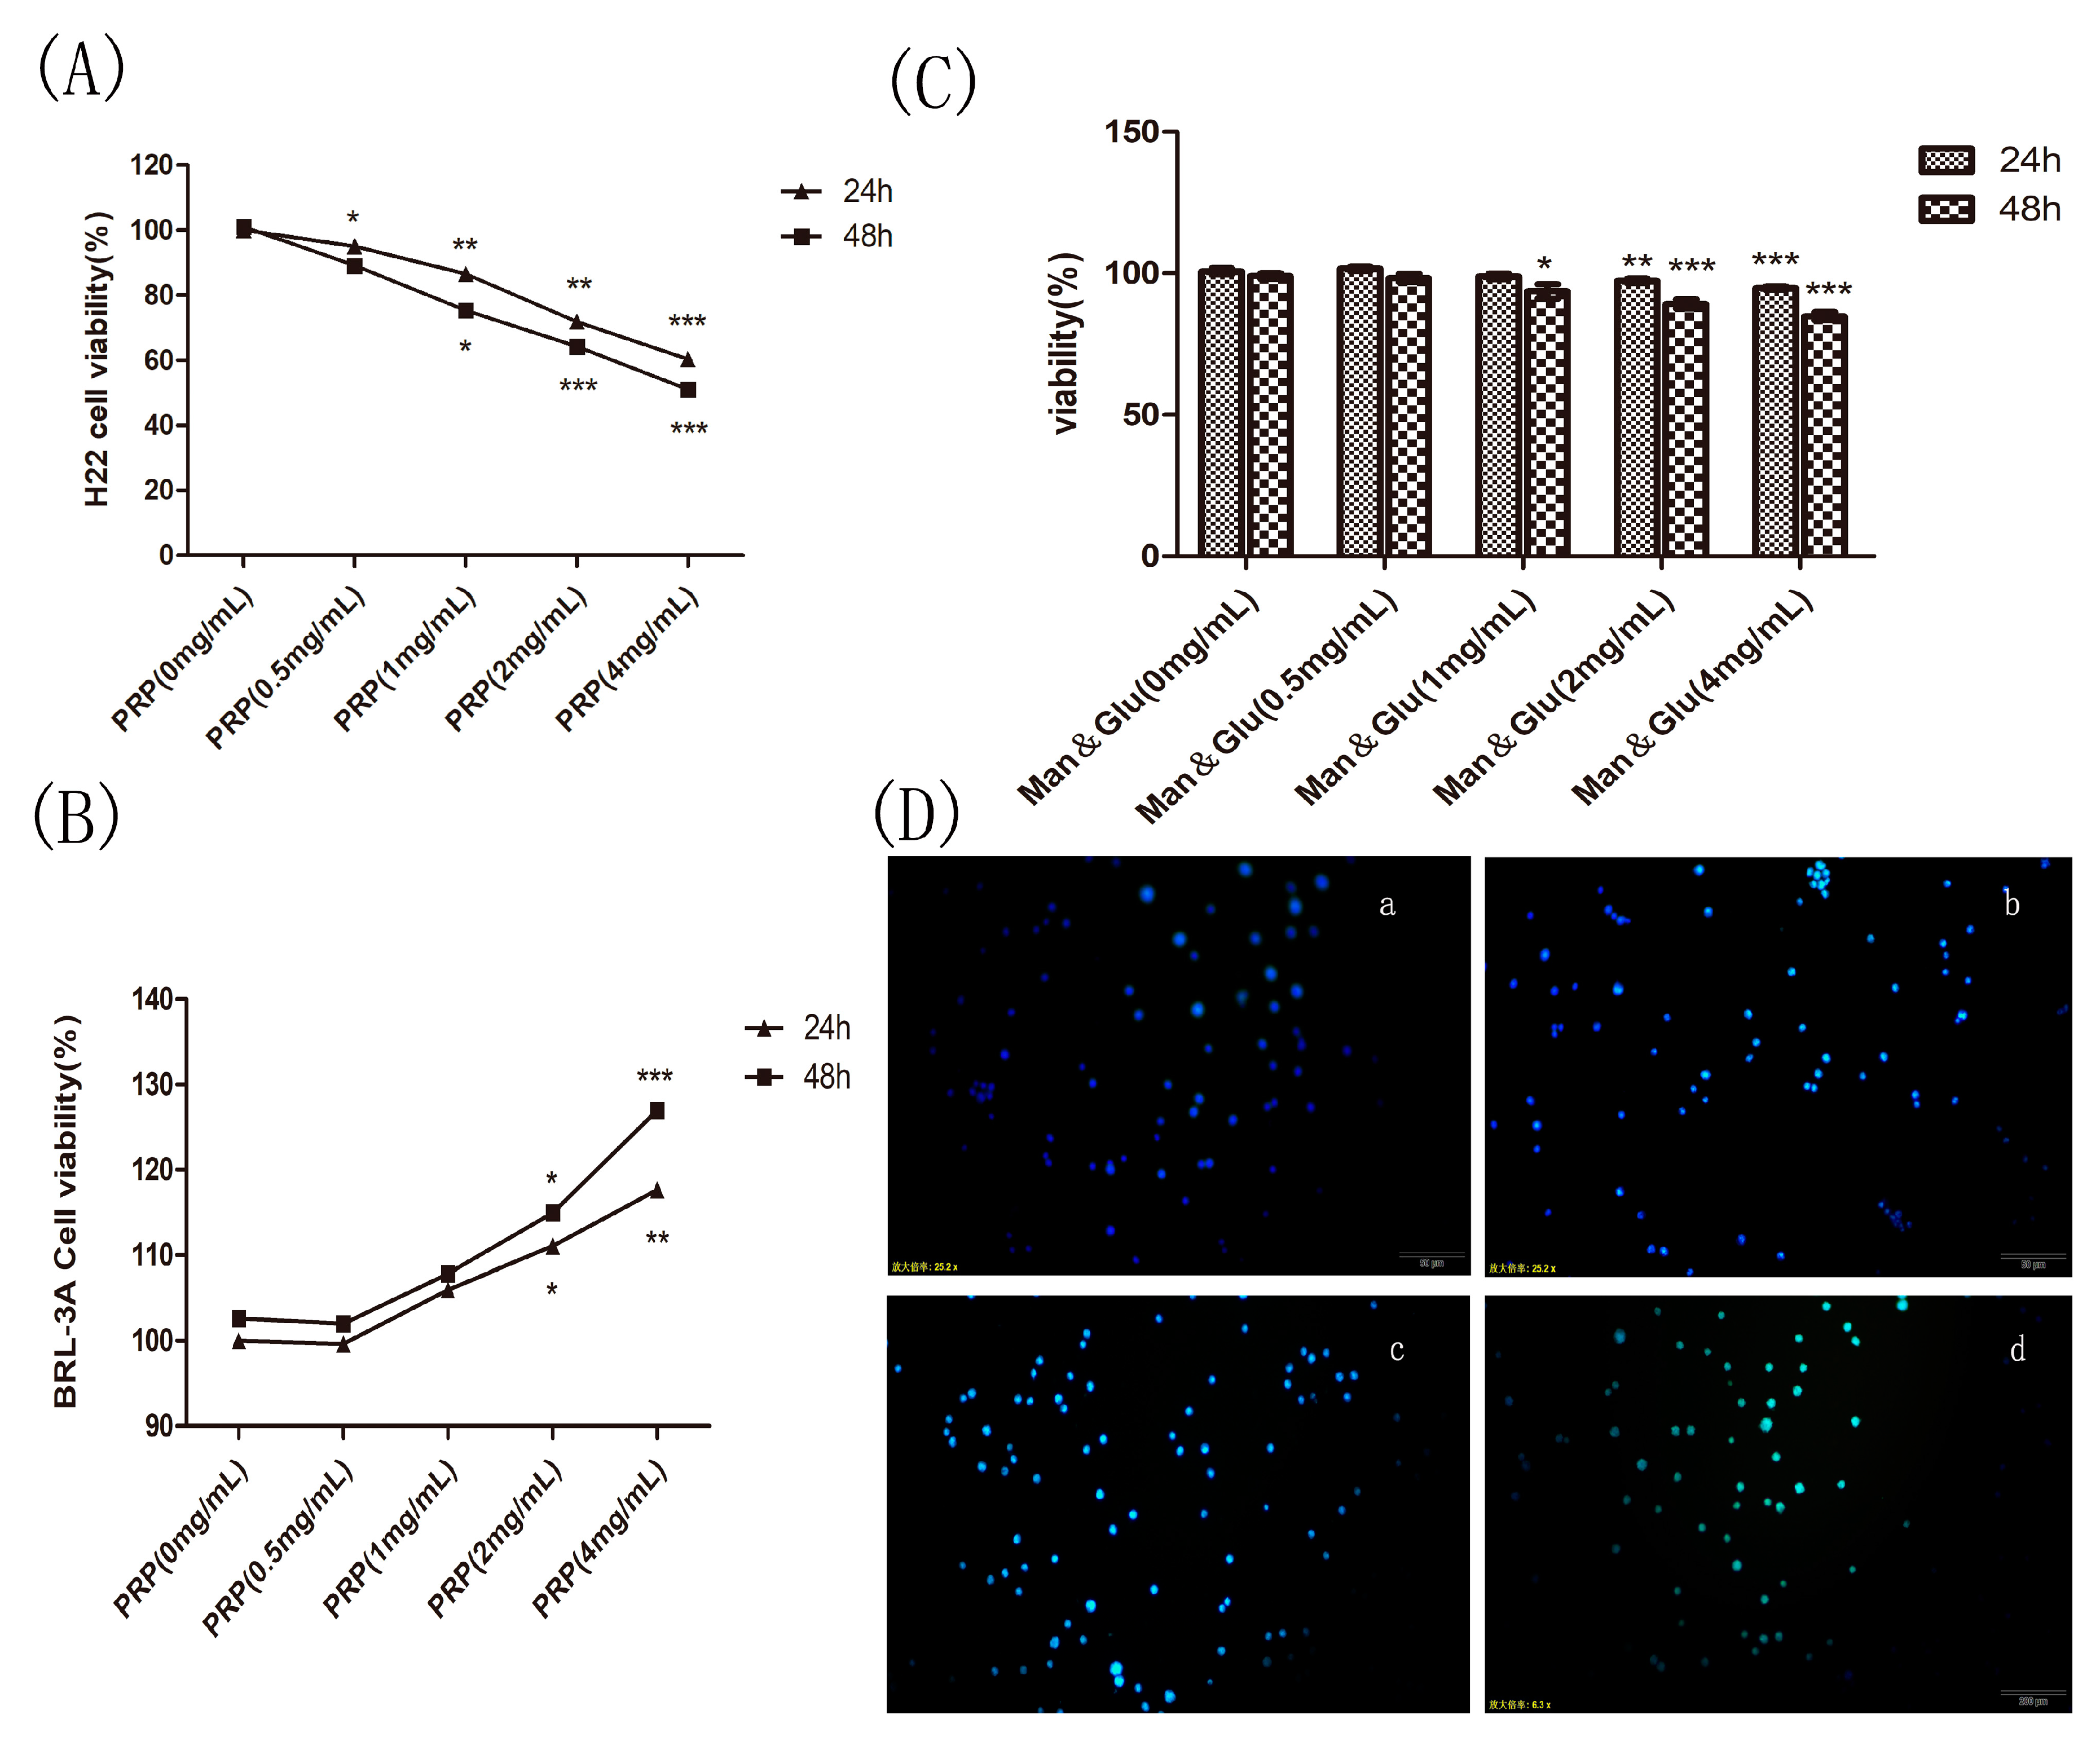
2.4.1. Effect of PRP on H22 Tumor Cells and BRL-3A Rat Hepatoma Normal Cells In Vitro
2.4.2. Effect of Mannose and Glucose on H22 Tumor Cells
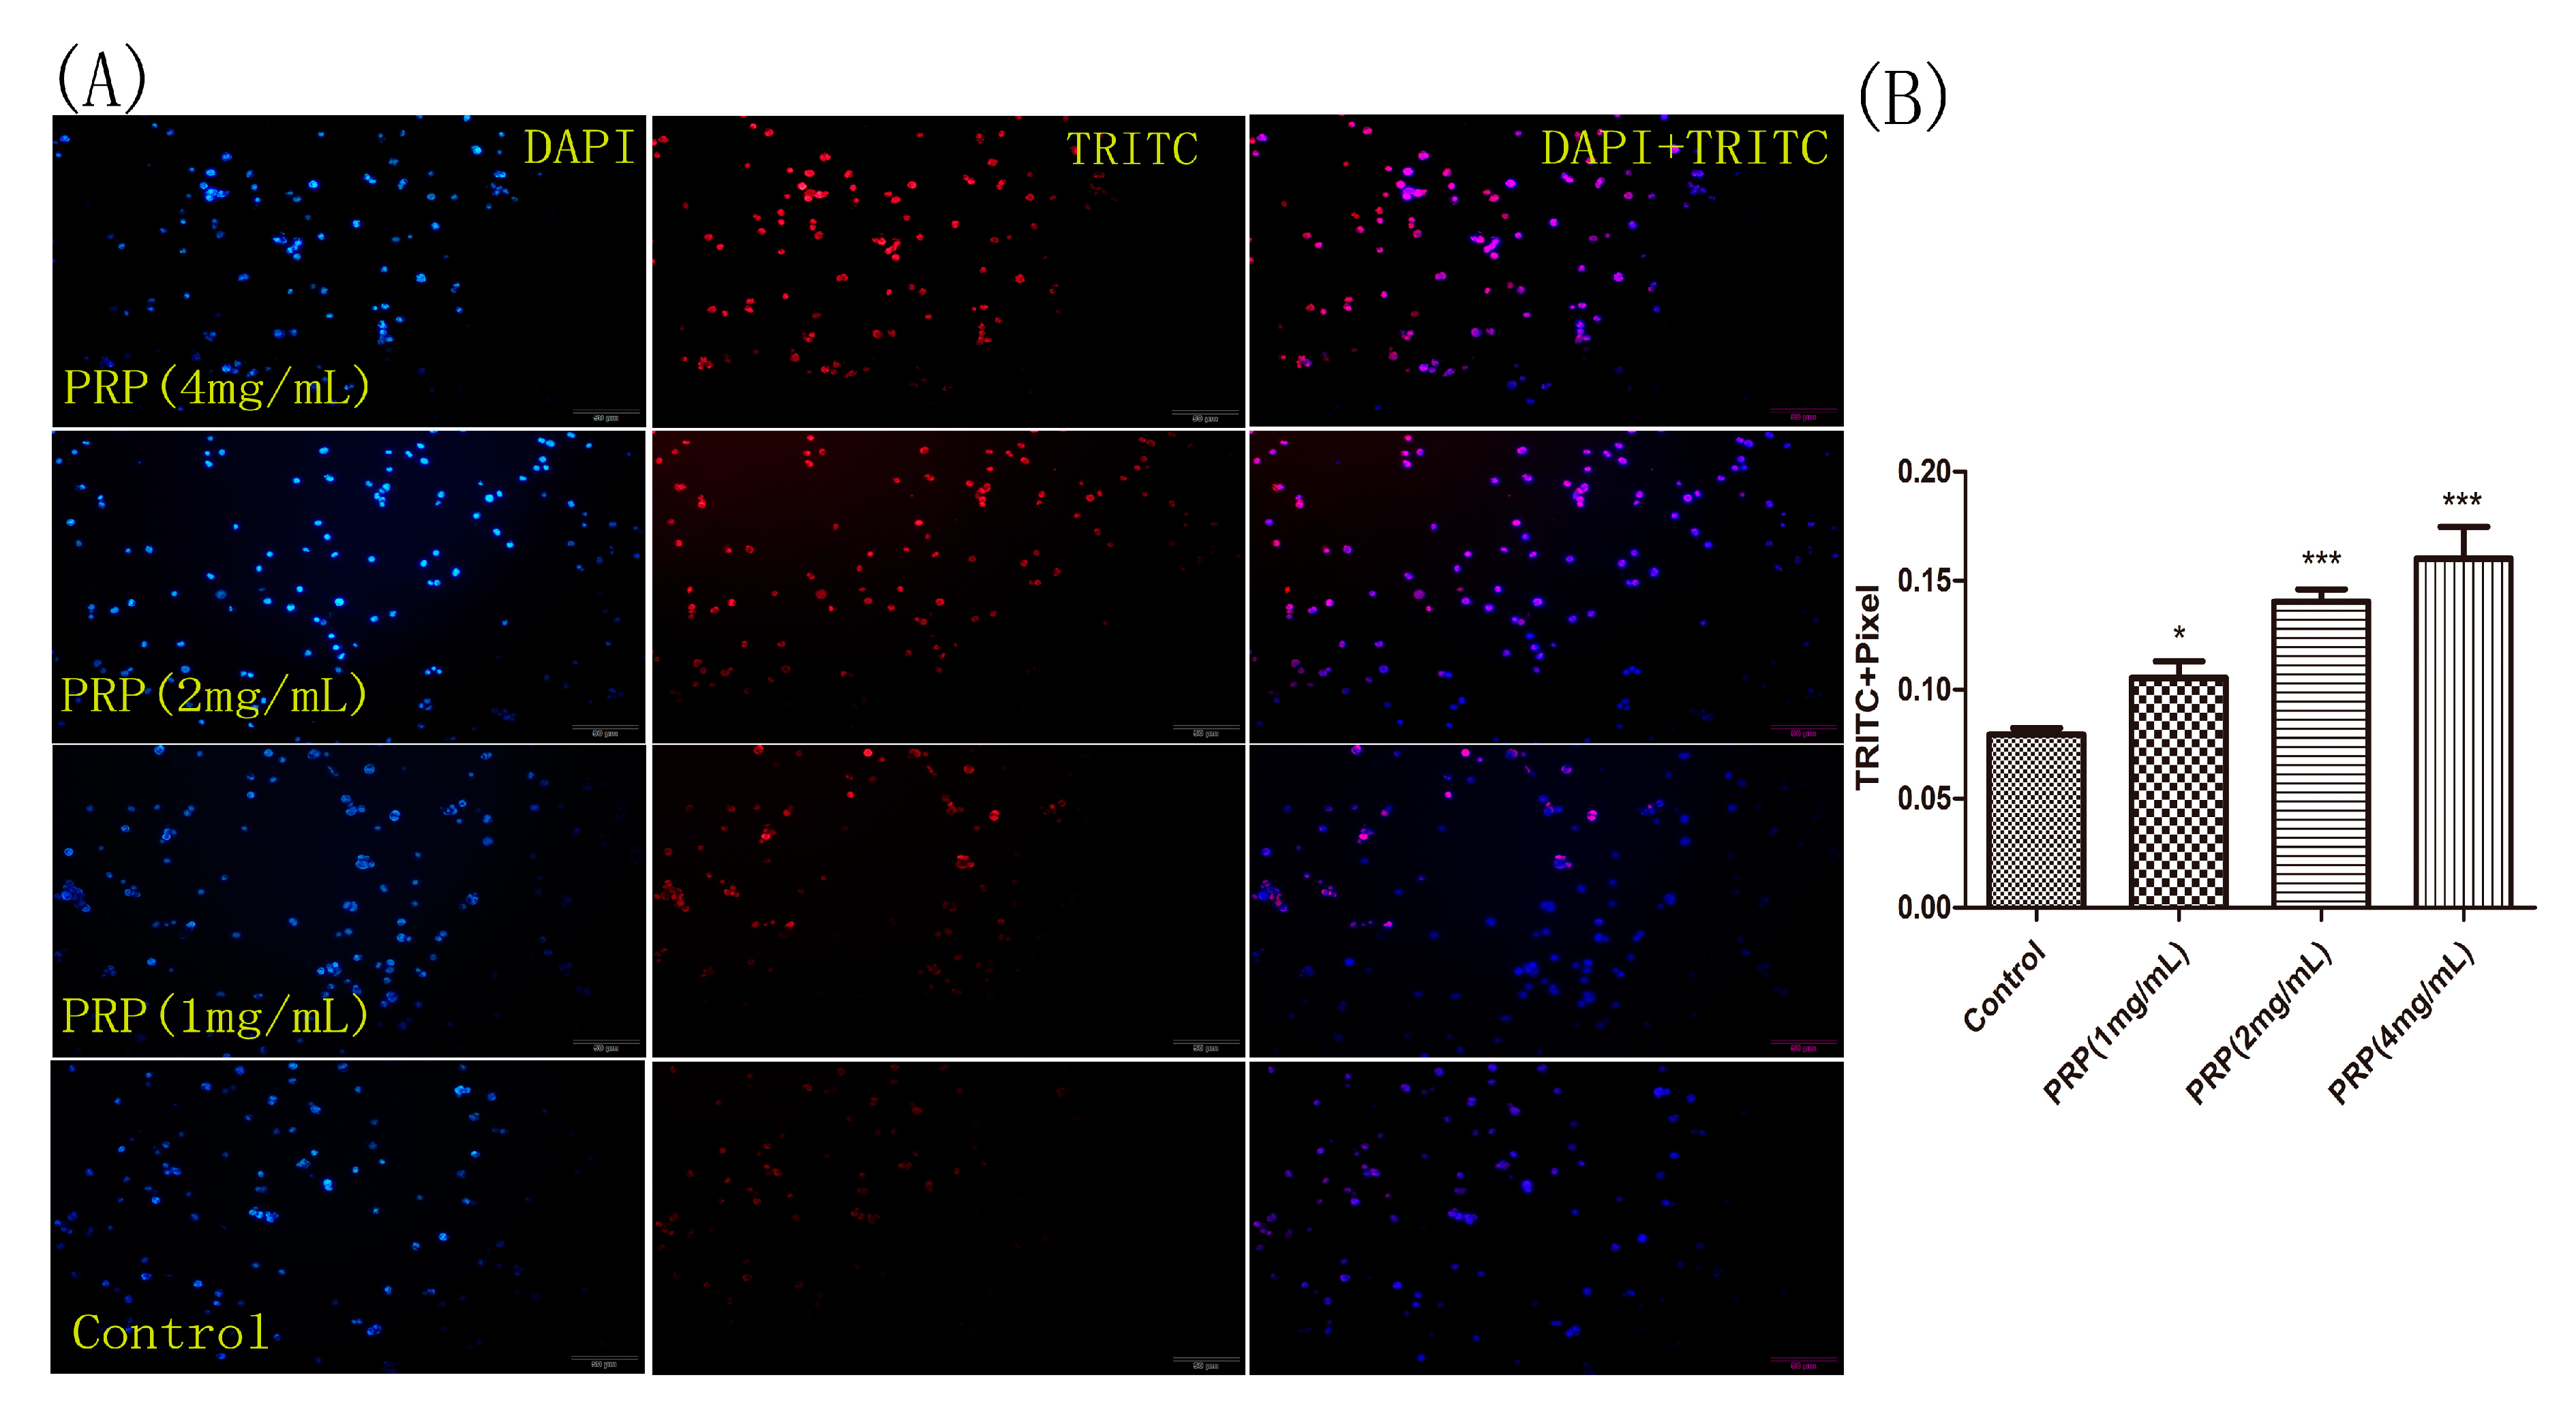
2.4.3. PRP Induces Apoptosis in H22 Cells
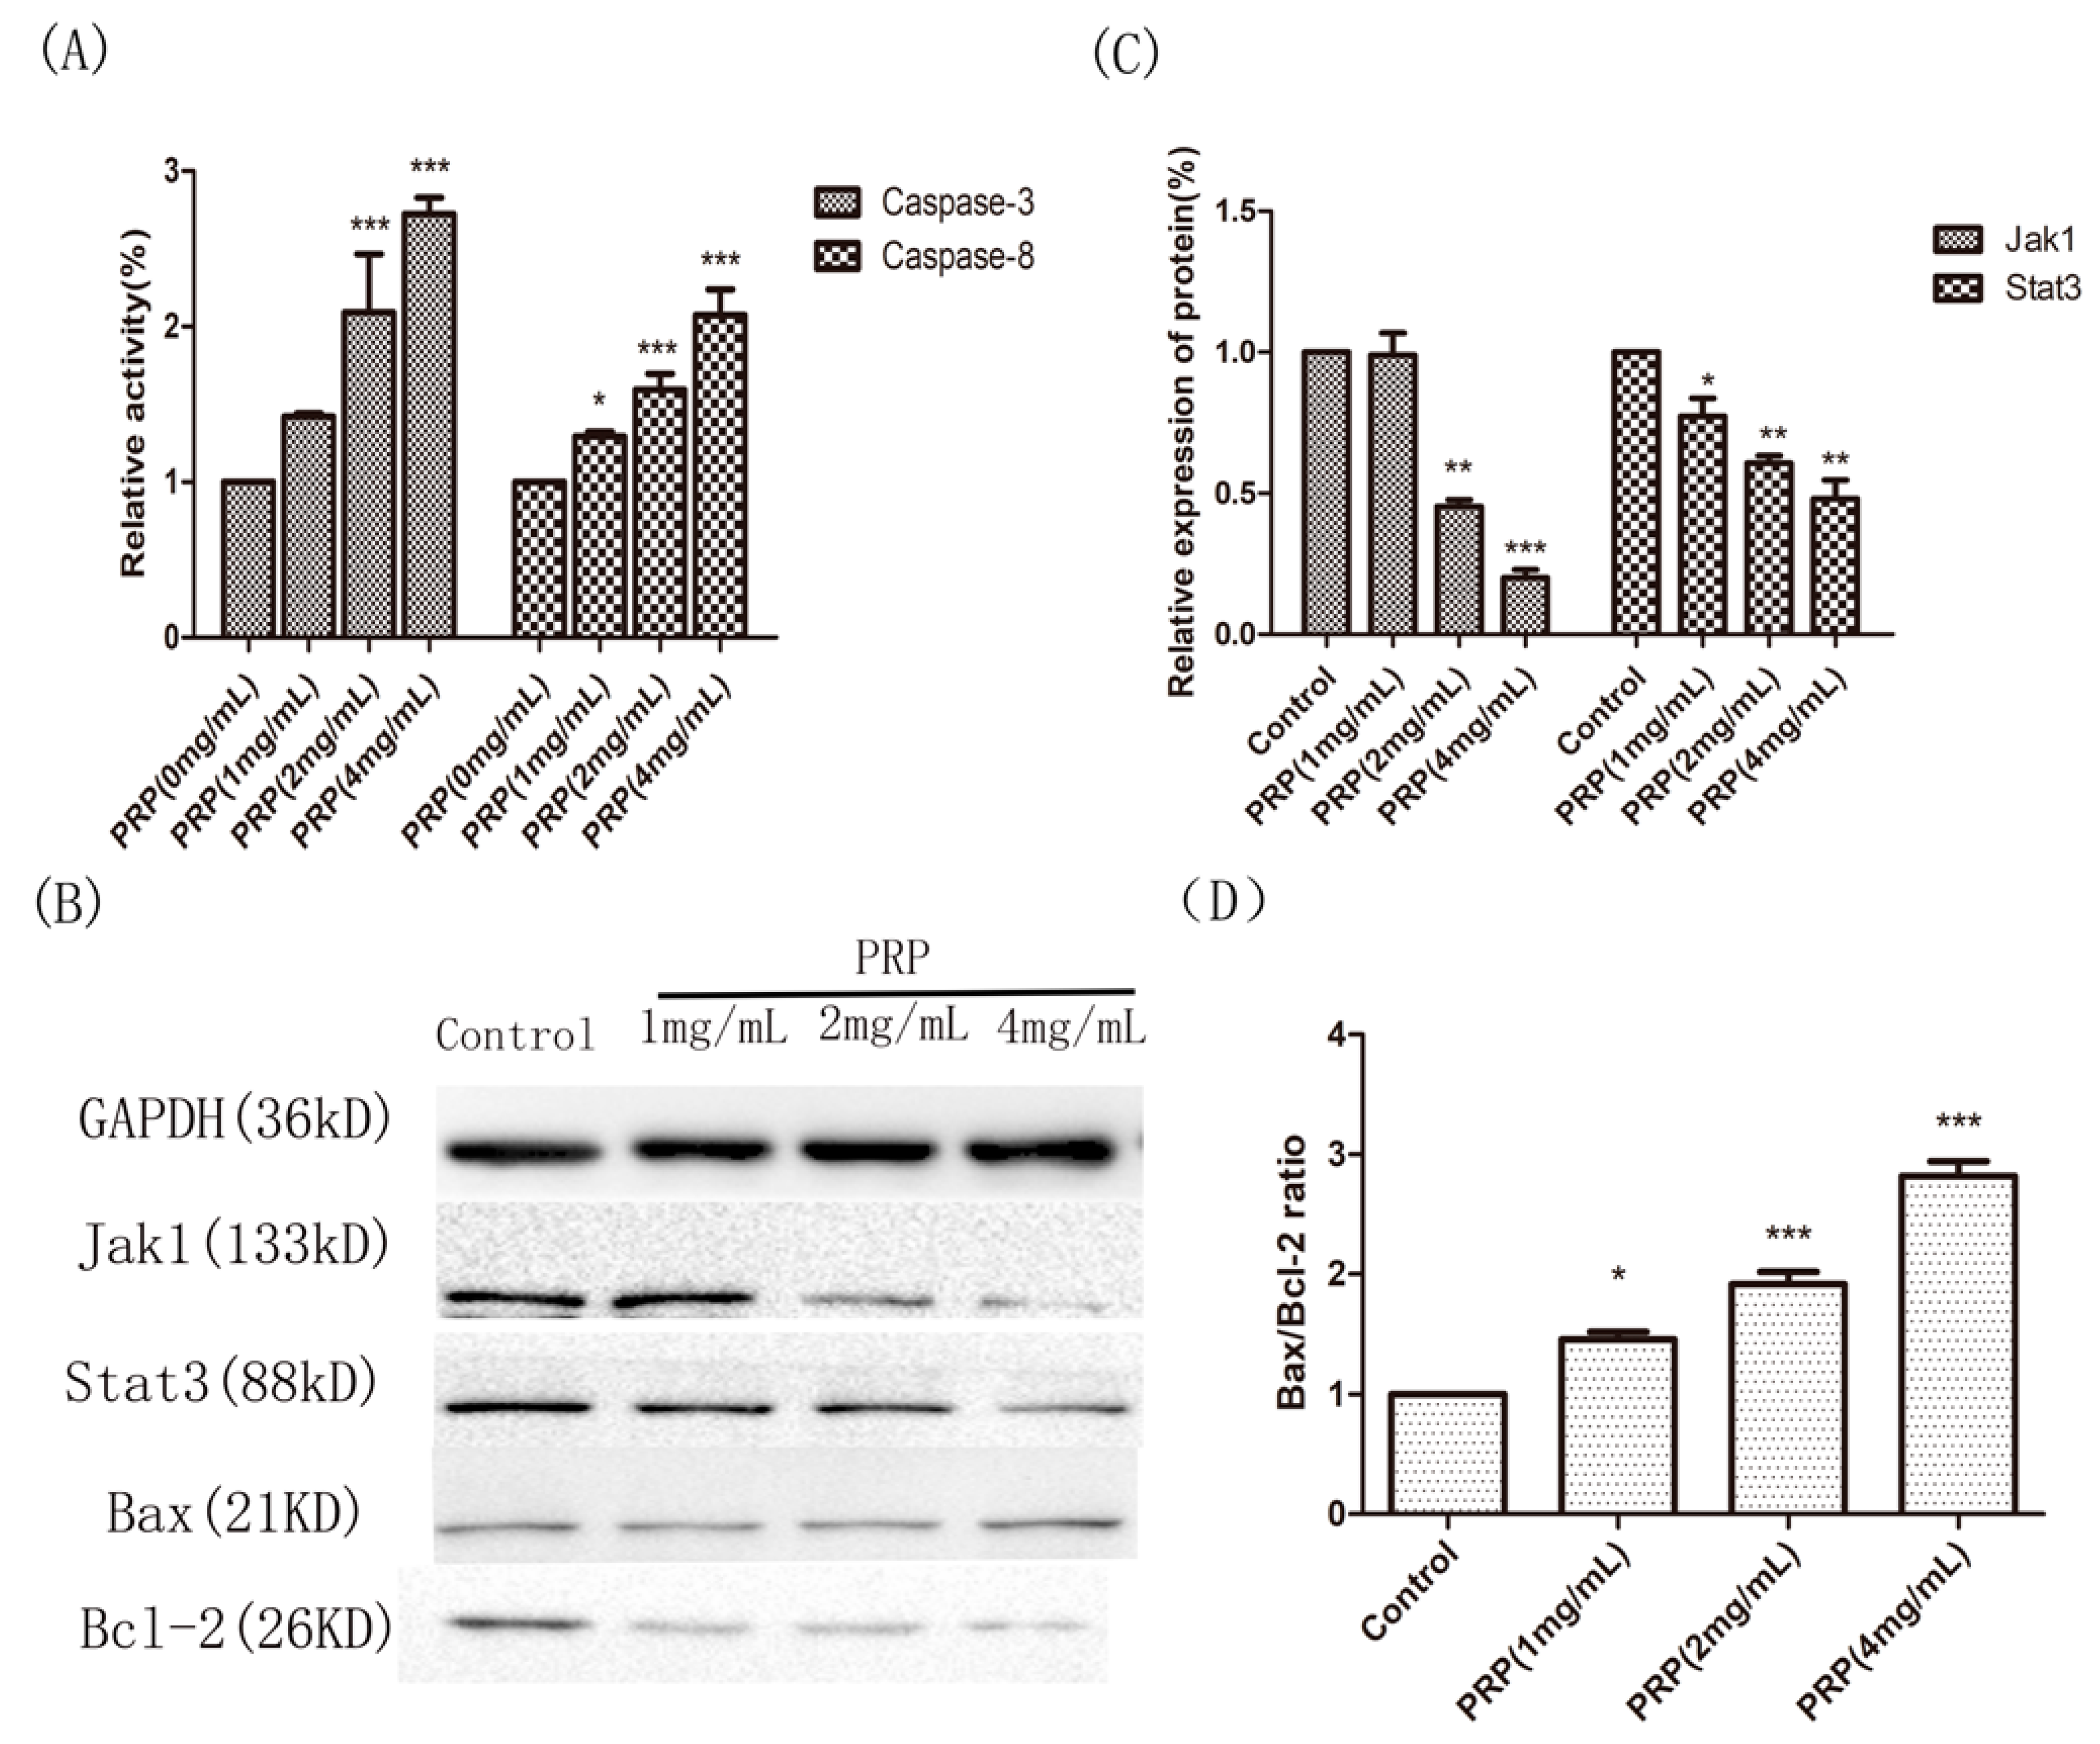
2.4.4. Analysis of PRP’s Antitumor Activity In Vitro
3. Discussion
4. Materials and Methods
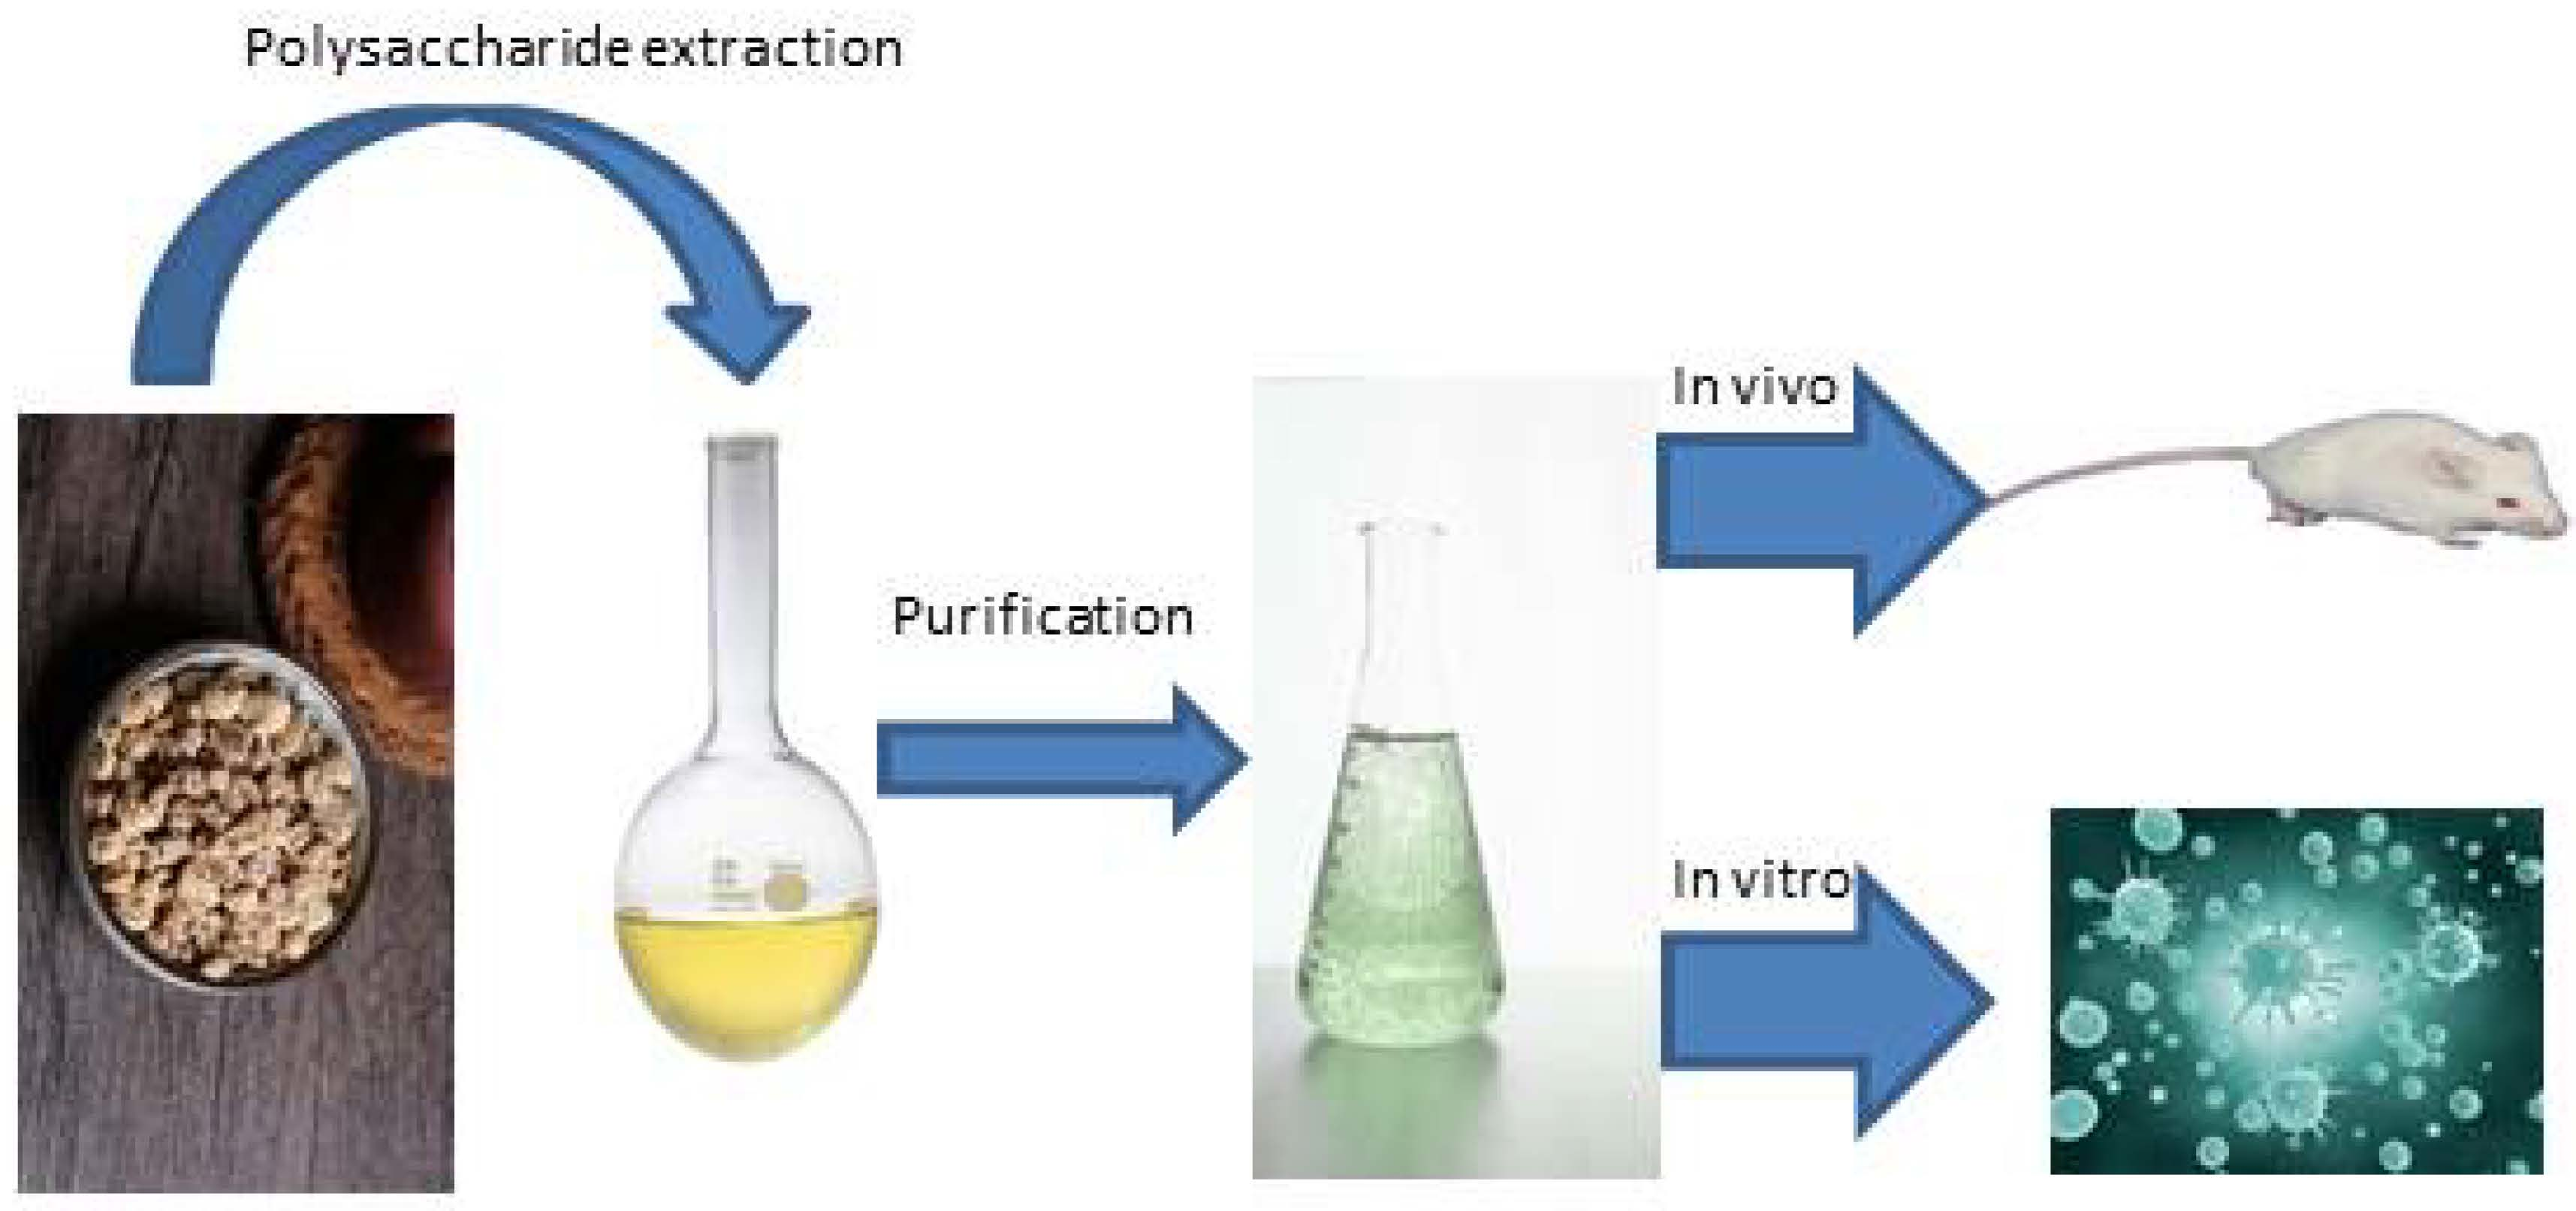
4.1. Preparation of PRP
4.2. In Vivo Study
4.2.1. Animals and Tumor Formation
4.2.2. Splenic Lymphocyte Proliferation Assay
4.2.3. Rate of Rosette-Forming Cell Test
4.2.4. Flow Cytometry Analysis of Lymphocyte Subsets
4.2.5. Quantitative PCR (qPCR) Analysis of Foxp3 mRNA Expression
4.2.6. Serum and Ascites Cytokine Analyses
4.2.7. Serum Mannose and Glucose Concentrations
4.2.8. Immunocytochemistry
4.3. In Vitro Study
4.3.1. Cell Culture and Viability Assay
4.3.2. Nuclear Staining with Hoechst 33258
4.3.3. TUNEL Assay
4.3.4. Caspase Activation Assay
4.3.5. Western Blot Analysis of Jak1, Stat3, Bax, and Bcl-2
4.4. Statistical Analysis
5. Conclusions
Author Contributions
Acknowledgments
Conflicts of Interest
Abbreviations
| PRP | Rhizoma Pleionis polysaccharides |
| TCM | Traditional Chinese medicine |
| SRBC | sheep red blood cells |
| EtRFC | Rate of E-rosette-forming cell |
| Man and Glu | Mannose and Glucose |
| TRITC | Tetramethylrhodamine |
References
- Ayantunde, A.; Parsons, S. Pattern and prognostic factors in patients with malignant ascites: A retrospective study. Ann. Oncol. 2007, 18, 945–949. [Google Scholar] [CrossRef] [PubMed]
- Stukan, M. Drainage of malignant ascites: Patient selection and perspectives. Cancer Manag. Res. 2017, 9, 115–130. [Google Scholar] [CrossRef] [PubMed]
- Jehn, C.F.; Küpferling, S.; Oskay-Özcelik, G.; Lüftner, D. A survey of treatment approaches of malignant ascites in germany and austria. Support. Care Cancer 2015, 23, 2073–2078. [Google Scholar] [CrossRef] [PubMed]
- Prieto, M.; Gómez-Lechón, M.J.; Hoyos, M.; Castell, J.V.; Carrasco, D.; Berenguer, J. Diagnosis of malignant ascites. Digest. Dis. Sci. 1988, 33, 833–838. [Google Scholar] [CrossRef] [PubMed]
- Kipps, E.; Tan, D.S.P.; Kaye, S.B. Meeting the challenge of ascites in ovarian cancer: New avenues for therapy and research. Nat. Rev. Cancer 2013, 13, 273–282. [Google Scholar] [CrossRef] [PubMed]
- Enck, R. Malignant ascites. Am. J. Hosp. Palliat. Care 2002, 19, 7–8. [Google Scholar] [CrossRef] [PubMed]
- Becker, G.; Galandi, D.; Blum, H. Malignant ascites: Systematic review and guideline for treatment. Eur. J. Cancer 2006, 42, 589–597. [Google Scholar] [CrossRef] [PubMed]
- Chung, M.; Kozuch, P. Treatment of malignant ascites. Curr. Treat. Options Oncol. 2008, 9, 215–233. [Google Scholar] [CrossRef] [PubMed]
- Lee, A.; Lau, T.N.; Yeong, K.Y. Indwelling catheters for the management of malignant ascites. Support. Care Cancer 2000, 8, 493–499. [Google Scholar] [PubMed]
- Smith, E.M.; Jayson, G.C. The current and future management of malignant ascites. Clin. Oncol. 2003, 15, 59. [Google Scholar] [CrossRef]
- Rosenberg, S. Palliation of malignant ascites. Gastroenterol. Clin. N. Am. 2006, 35, 189–199. [Google Scholar] [CrossRef] [PubMed]
- Adam, R.A.; Adam, Y.G. Malignant ascites: Past, present, and future. J. Am. Coll. Surg. 2004, 198, 999–1011. [Google Scholar] [CrossRef] [PubMed]
- Pang, C.L.K.; Zhang, X.; Wang, Z.; Ou, J.; Lu, Y.; Chen, P.; Zhao, C.; Wang, X.; Zhang, H.; Roussakow, S.V. Local modulated electro-hyperthermia in combination with traditional chinese medicine vs. Intraperitoneal chemoinfusion for the treatment of peritoneal carcinomatosis with malignant ascites: A phase II randomized trial. Mol. Clin. Oncol. 2017, 6, 723–732. [Google Scholar] [CrossRef] [PubMed][Green Version]
- Zhou, J.; Zhou, T.; Chen, M.; Jiang, M.; Wang, X.; Liu, Q.; Zhan, Z.; Zhang, X. Research progress on synergistic anti-tumor mechanisms of compounds in traditional chinese medicine. J. Tradit. Chin. Med. 2014, 34, 100–105. [Google Scholar] [CrossRef]
- Zhang, Y.; Li, Q.; Wang, J.; Cheng, F.; Huang, X.; Cheng, Y.; Wang, K. Polysaccharide from lentinus edodes combined with oxaliplatin possesses the synergy and attenuation effect in hepatocellular carcinoma. Cancer Lett. 2016, 377, 117–125. [Google Scholar] [CrossRef] [PubMed]
- Chen, Y.; Yao, F.; Ming, K.; Wang, D.; Hu, Y.; Liu, J. Polysaccharides from traditional chinese medicines: Extraction, purification, modification, and biological activity. Molecules 2016, 21, 1705. [Google Scholar] [CrossRef] [PubMed]
- Li, G.; Song, X.; Han, B.; Fang, S. Evolution of the origin of strain of Shancigu (Rhizoma Pleionis). Zhonghua Yi Shi Za Zhi 2015, 45, 137–140. [Google Scholar] [PubMed]
- Liu, Y.; Zhou, S.; Zeng, T.; Chen, Z. Inhibitory effect and mechanism of shancigu water extracts on mice 4t1cell. HuBei Agric. Sci. 2016, 1, 134–137. [Google Scholar]
- Yu, L.; Zhai, H. Effects of cremastra appendiculata extract on the apoptosis of human colon cancer ht29 cells. Chin. J. Ethnomed. Ethnopharm. 2016, 16, 17–19. [Google Scholar]
- Liu, Q.; Cheng, X.; Zhang, X.; Wang, W.; Zhao, H. Mechanism research of chinese herbal pair of pseudobulbus cremastrae seu pleiones and nidus polistis mandarini in inhibiting in-vitro invasion and metastasis of human breast cancer mda-mb-231 cells. Tradit. Chin. Drug Res. Clin. Pharmacol. 2014, 4, 389–392. [Google Scholar]
- Yan, Y.; Wan, Q.; Zhou, J. Research of progress of anti-tumor mechanism of Rhizoma Pleionis. Guangdong Med. J. 2016, 22, 3468–3469. [Google Scholar]
- Prakken, B.J.; Albani, S.; Eden, W.V. Translating immunological tolerance into therapy. Eur. J. Immunol. 2007, 37, 2360–2363. [Google Scholar] [CrossRef]
- Schrama, D.; Ritter, C.; Becker, J.C. T cell receptor repertoire usage in cancer as a surrogate marker for immune responses. Semin. Immunopathol. 2017, 39, 255–268. [Google Scholar] [CrossRef] [PubMed]
- Von Boehmer, H. Mechanisms of suppression by suppressor t cells. Nat. Immunol. 2005, 6, 338–344. [Google Scholar] [CrossRef] [PubMed]
- Prezzemolo, T.; Guggino, G.; La Manna, M.P.; Di Liberto, D.; Dieli, F.; Caccamo, N. Functional signatures of human cd4 and cd8 t cell responses to mycobacterium tuberculosis. Front. Immunol. 2014, 5, 180. [Google Scholar] [CrossRef] [PubMed]
- Hirakawa, M.; Matos, T.; Liu, H.; Koreth, J.; Kim, H.; Paul, N.; Murase, K.; Whangbo, J.; Alho, A.; Nikiforow, S.; et al. Low-dose IL-2 selectively activates subsets of CD4+ tregs and NK cells. JCI Insight 2016, 1, e89278. [Google Scholar] [CrossRef] [PubMed]
- Nakabayashi, Y.; Nakashima, A.; Yoshino, O.; Shima, T.; Shiozaki, A.; Adachi, T.; Nakabayashi, M.; Okai, T.; Kushima, M.; Saito, S. Impairment of the accumulation of decidual t cells, nk cells, and monocytes, and the poor vascular remodeling of spiral arteries, were observed in oocyte donation cases, regardless of the presence or absence of preeclampsia. J. Reprod. Immunol. 2016, 114, 65–74. [Google Scholar] [CrossRef] [PubMed]
- Villarino, A.; Kanno, Y.; O’Shea, J.J. Mechanisms and consequences of jak-stat signaling in the immune system. Nat. Immunol. 2017, 8, 374–384. [Google Scholar] [CrossRef] [PubMed]
- Banerjee, S.; Biehl, A.; Gadina, M.; Hasni, S.; Schwartz, D. Jak-stat signaling as a target for inflammatory and autoimmune diseases: Current and future prospects. Drugs 2017, 77, 521–546. [Google Scholar] [CrossRef] [PubMed]
- Fuab, L.; Zhaob, M.-D.; Chena, S.-Y.; Jiaa, X.-B.; Laia, S.-J. Investigation of genetic susceptibility to nonspecific digestive disorder between tyk2, jak1, and stat3 genes in rabbits. Livest. Sci. 2015, 181, 137–142. [Google Scholar]
- Don-Doncow, N.; Marginean, F.; Coleman, I.; Nelson, P.S.; Ehrnström, R.; Krzyzanowska, A.; Morrissey, C.; Hellsten, R.; Bjartell, A. Expression of stat3 in prostate cancer metastases. Eur. Urol. 2017, 71, 313–316. [Google Scholar] [CrossRef] [PubMed]
- Aaronson, D.S.; Horvath, C.M. The stat3 pathway. Sci. STKE 2003, 2003, cm13. [Google Scholar] [CrossRef]
- Lee, J.-K.; Won, C.; Yi, E.H.; Seok, S.-H.; Kim, M.-H.; Kim, S.-J.; Chung, M.-H.; Lee, H.G.; Ikuta, K.; Ye, S.-K. Signal transducer and activator of transcription 3 (stat3) contributes to t-cell homeostasis by regulating pro-survival bcl-2 family genes. Immunology 2013, 140, 288–300. [Google Scholar] [PubMed]
- Petit, A.; Mwale, F.; Zukor, D.J.; Catelas, I.; Antoniou, J.; Huk, O.L. Effect of cobalt and chromium ions on bcl-2, bax, caspase-3, and caspase-8 expression in human u937 macrophages. Biomaterials 2004, 25, 2013–2018. [Google Scholar] [CrossRef] [PubMed]
- Hcker, G.; Paschen, S.A. Therapeutic targets in the mitochondrial apoptotic pathway. Expert Opin. Ther. Targets 2007, 11, 515–526. [Google Scholar] [CrossRef] [PubMed]
- Gehring, S.; Rottmann, S.; Menkel, A.; Mertsching, J.; Krippner-Heidenreich, A.; Luscher, B. Inhibition of proliferation and apoptosis by the transcriptional repressor mad1. Repression of fas-induced caspase-8 activation. J. Biol. Chem. 2000, 275, 10413–10420. [Google Scholar] [CrossRef] [PubMed]
- Nakamura, K.; Bossy-Wetzel, E. Changes in endoplasmic reticulum luminal environment affect cell sensitivity to apoptosis. J. Cell Biol. 2000, 150, 731–740. [Google Scholar] [CrossRef] [PubMed]
- Anonymous. Drugs of choice for cancer chemotherapy. Med. Lett. Drugs Ther. 1997, 33, 21–28. [Google Scholar]
- Emens, L.A. Chemotherapy and tumor immunity: An unexpected collaboration. Front. Biosci. 2008, 13, 249–257. [Google Scholar] [CrossRef] [PubMed]
- Huyan, X.-H.; Lin, Y.-P.; Gao, T.; Chen, R.-Y.; Fan, Y.-M. Immunosuppressive effect of cyclophosphamide on white blood cells and lymphocyte subpopulations from peripheral blood of Balb/c mice. Int. Immunopharmacol. 2011, 11, 1293–1297. [Google Scholar] [CrossRef] [PubMed]
- Sevko, A.; Sade-Feldman, M.; Kanterman, J.; Michels, T.; Falk, C.S.; Umansky, L.; Ramacher, M.; Kato, M.; Schadendorf, D.; Baniyash, M.; et al. Cyclophosphamide promotes chronic inflammation-dependent immunosuppression and prevents antitumor response in melanoma. J. Investig. Dermatol. 2013, 133, 1610–1619. [Google Scholar] [CrossRef] [PubMed]
- Wang, Y.; Jing, Y.; Leng, F.; Wang, S.; Wang, F.; Zhuang, Y.; Liu, X.; Wang, X.; Ma, X. Establishment and application of a method for rapid determination of total sugar content based on colorimetric microplate. Sugar Tech 2017, 19, 424–431. [Google Scholar] [CrossRef]
- Liang, J.-R.; Ai, X.-X.; Gao, Y.-H.; Chen, C.-P. Maldi-tof ms analysis of the extracellular polysaccharides released by the diatom thalassiosira pseudonana. J. Appl. Phycol. 2013, 27, 477–484. [Google Scholar] [CrossRef]
- Du, N.; Tian, W.; Zheng, D.; Zhang, X.; Qin, P. Extraction, purification and elicitor activities of polysaccharides from chrysanthemum indicum. Int. J. Biol. Macromol. 2016, 82, 347–354. [Google Scholar] [CrossRef] [PubMed]
- Wei, H.; Qin, S.; Yin, X.; Chen, Y.; Hua, H.; Wang, L.; Yang, N.; Chen, Y.; Liu, X. Endostar inhibits ascites formation and prolongs survival in mouse models of malignant ascites. Oncol. Lett. 2015, 9, 2694–2700. [Google Scholar] [CrossRef] [PubMed]
- Hao, C.; Shi, Y.; Yu, J.; Wei, X.; Li, S.; Tong, Z. The therapeutic function of the chemokine rantes on the h22 hepatoma ascites model. Mol. Cell. Biochem. 2012, 367, 93–102. [Google Scholar] [CrossRef] [PubMed]
- Tang, X.; Huang, J.; Xiong, H.; Zhang, K.; Chen, C.; Wei, X.; Xu, X.; Xie, Q.; Huang, R. Anti-tumor effects of the polysaccharide isolated from tarphochlamys affinis in h22 tumor-bearing mice. Cell Physiol. Biochem. 2016, 39, 1040–1050. [Google Scholar] [CrossRef] [PubMed]
- Rabin, E.M.; Gordon, K.; Knoppers, M.H.; Luther, M.A.; Neidhardt, E.A.; Flynn, J.F.; Sardonini, C.A.; Sampo, T.M.; Concino, M.F.; Recny, M.A.; et al. Inhibition of T cell activation and adhesion functions by soluble cd2 protein. Cell. Immunol. 1993, 149, 24–38. [Google Scholar] [CrossRef] [PubMed]
- Fernández-Ruiz, M.; Silva, J.T.; López-Medrano, F.; Allende, L.M.; San Juan, R.; Cambra, F.; Justo, I.; Paz-Artal, E.; Jiménez, C.; Aguado, J.M. Post-transplant monitoring of NK cell counts as a simple approach to predict the occurrence of opportunistic infection in liver transplant recipients. Transpl. Infect. Dis. 2016, 18, 552–565. [Google Scholar] [CrossRef] [PubMed]
- Li, A.; Shuai, X.; Jia, Z.; Li, H.; Liang, X.; Su, D.; Guo, W. Ganoderma lucidum polysaccharide extract inhibits hepatocellular carcinoma growth by downregulating regulatory T cells accumulation and function by inducing microrna-125b. J. Transl. Med. 2015, 13, 100. [Google Scholar] [CrossRef] [PubMed]


| Monosaccharide Composition Analysis | Content (μg/mL) |
|---|---|
| Mannose | 6067.76 |
| Glucose | 3744.62 |
| Galactose | 60.82 |
| Arabinose | 50.50 |
| Fucose | 21.99 |
| Xylose | 8.00 |
| Rhamnose | 4.34 |
| Molecular | Weight (kDa) |
|---|---|
| Mn | 39.877 |
| Mw | 383.569 |
| Mz | 2637 |
| Mp | 151.009 |
| Mw/Mn | 9.619 |
| Structures | 180–260 nm | 185–260 nm | 190–260 nm | 195–260 nm | 200–260 nm | 205–260 nm | 210–260 nm |
|---|---|---|---|---|---|---|---|
| Helix | 16.60% | 16.30% | 16.90% | 14.70% | 12.40% | 11.60% | 11.10% |
| Antiparallel | 41.30% | 44.30% | 42.50% | 30.00% | 20.70% | 17.40% | 21.00% |
| Parallel | 14.50% | 14.10% | 13.10% | 16.50% | 19.60% | 22.00% | 19.00% |
| Beta-Turn | 21.50% | 21.70% | 20.80% | 21.40% | 22.50% | 22.10% | 23.20% |
| Rndm.Coil | 44.00% | 45.50% | 43.30% | 49.00% | 54.20% | 56.80% | 55.70% |
| Total Sum | 137.90% | 142.00% | 136.50% | 131.60% | 129.40% | 129.90% | 130.10% |
| Group (n = 8) | Abdominal (cm) | |||
|---|---|---|---|---|
| Day 1 | Day 5 | Day 10 | Day 15 | |
| Control | 5.33 ± 0.61 | 7.06 ± 0.81 | 9.33 ± 0.8 | 12.67 ± 0.98 |
| PRP (75 mg/kg) | 5.42 ± 0.58 | 6.42 ± 0.67 | 8.93 ± 0.79 | 11.17 ± 0.82 |
| PRP (150 mg/kg) | 5.30 ± 0.60 | 6.33 ± 0.52 | 8.13 ± 0.71 | 10.08 * ± 0.83 |
| PRP (300 mg/kg) | 5.41 ± 0.52 | 5.75 ± 0.41 | 7.25 ** ± 0.89 | 8.67 ** ± 1.75 |
| CTX (20 mg/kg) | 5.26 ± 0.61 | 6.41 ± 0.59 | 8.63 ± 0.67 | 10.75 ± 1.40 |
| Group (n = 8) | Weight (g) | |||
|---|---|---|---|---|
| Day 1 | Day 5 | Day 10 | Day 15 | |
| Control | 20.3 ± 1.03 | 23.7 ± 1.50 | 26.7 ± 1.96 | 30.8 ± 1.94 |
| PRP (75 mg/kg) | 20.5 ± 1.51 | 22.8 ± 1.60 | 25.5 ± 1.64 | 28.8 ± 1.75 |
| PRP (150 mg/kg) | 20.5 ± 1.51 | 22.3 ± 1.21 | 24.2 ± 1.17 | 27.3 * ± 1.97 |
| PRP (300 mg/kg) | 20.3 ± 1.36 | 21.3 ± 1.36 | 22.8 * ± 1.03 | 25.2 ** ± 1.17 |
| CTX (20 mg/kg) | 20.5 ± 1.52 | 22.3 ± 1.75 | 24.7 ± 1.21 | 29.3 ± 1.50 |
© 2018 by the authors. Licensee MDPI, Basel, Switzerland. This article is an open access article distributed under the terms and conditions of the Creative Commons Attribution (CC BY) license (http://creativecommons.org/licenses/by/4.0/).
Share and Cite
Fang, Y.; Ning, A.; Li, S.; Zhou, S.; Liu, L.; Joseph, T.P.; Zhong, M.; Jiao, J.; Zhang, W.; Shi, Y.; et al. Polysaccharides Extracted from Rhizoma Pleionis Have Antitumor Properties In Vitro and in an H22 Mouse Hepatoma Ascites Model In Vivo. Int. J. Mol. Sci. 2018, 19, 1386. https://doi.org/10.3390/ijms19051386
Fang Y, Ning A, Li S, Zhou S, Liu L, Joseph TP, Zhong M, Jiao J, Zhang W, Shi Y, et al. Polysaccharides Extracted from Rhizoma Pleionis Have Antitumor Properties In Vitro and in an H22 Mouse Hepatoma Ascites Model In Vivo. International Journal of Molecular Sciences. 2018; 19(5):1386. https://doi.org/10.3390/ijms19051386
Chicago/Turabian StyleFang, Yukun, Anhong Ning, Sha Li, Shaozheng Zhou, Lei Liu, Thomson Patrick Joseph, Mintao Zhong, Jilong Jiao, Wei Zhang, Yonghui Shi, and et al. 2018. "Polysaccharides Extracted from Rhizoma Pleionis Have Antitumor Properties In Vitro and in an H22 Mouse Hepatoma Ascites Model In Vivo" International Journal of Molecular Sciences 19, no. 5: 1386. https://doi.org/10.3390/ijms19051386
APA StyleFang, Y., Ning, A., Li, S., Zhou, S., Liu, L., Joseph, T. P., Zhong, M., Jiao, J., Zhang, W., Shi, Y., Zhang, M., & Huang, M. (2018). Polysaccharides Extracted from Rhizoma Pleionis Have Antitumor Properties In Vitro and in an H22 Mouse Hepatoma Ascites Model In Vivo. International Journal of Molecular Sciences, 19(5), 1386. https://doi.org/10.3390/ijms19051386