Effects of Interactions between ZnO Nanoparticles and Saccharides on Biological Responses


Abstract
: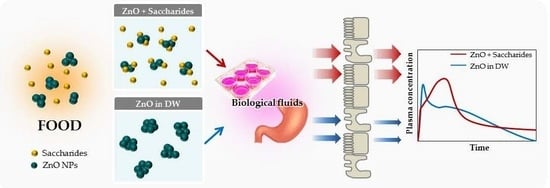
1. Introduction
2. Results
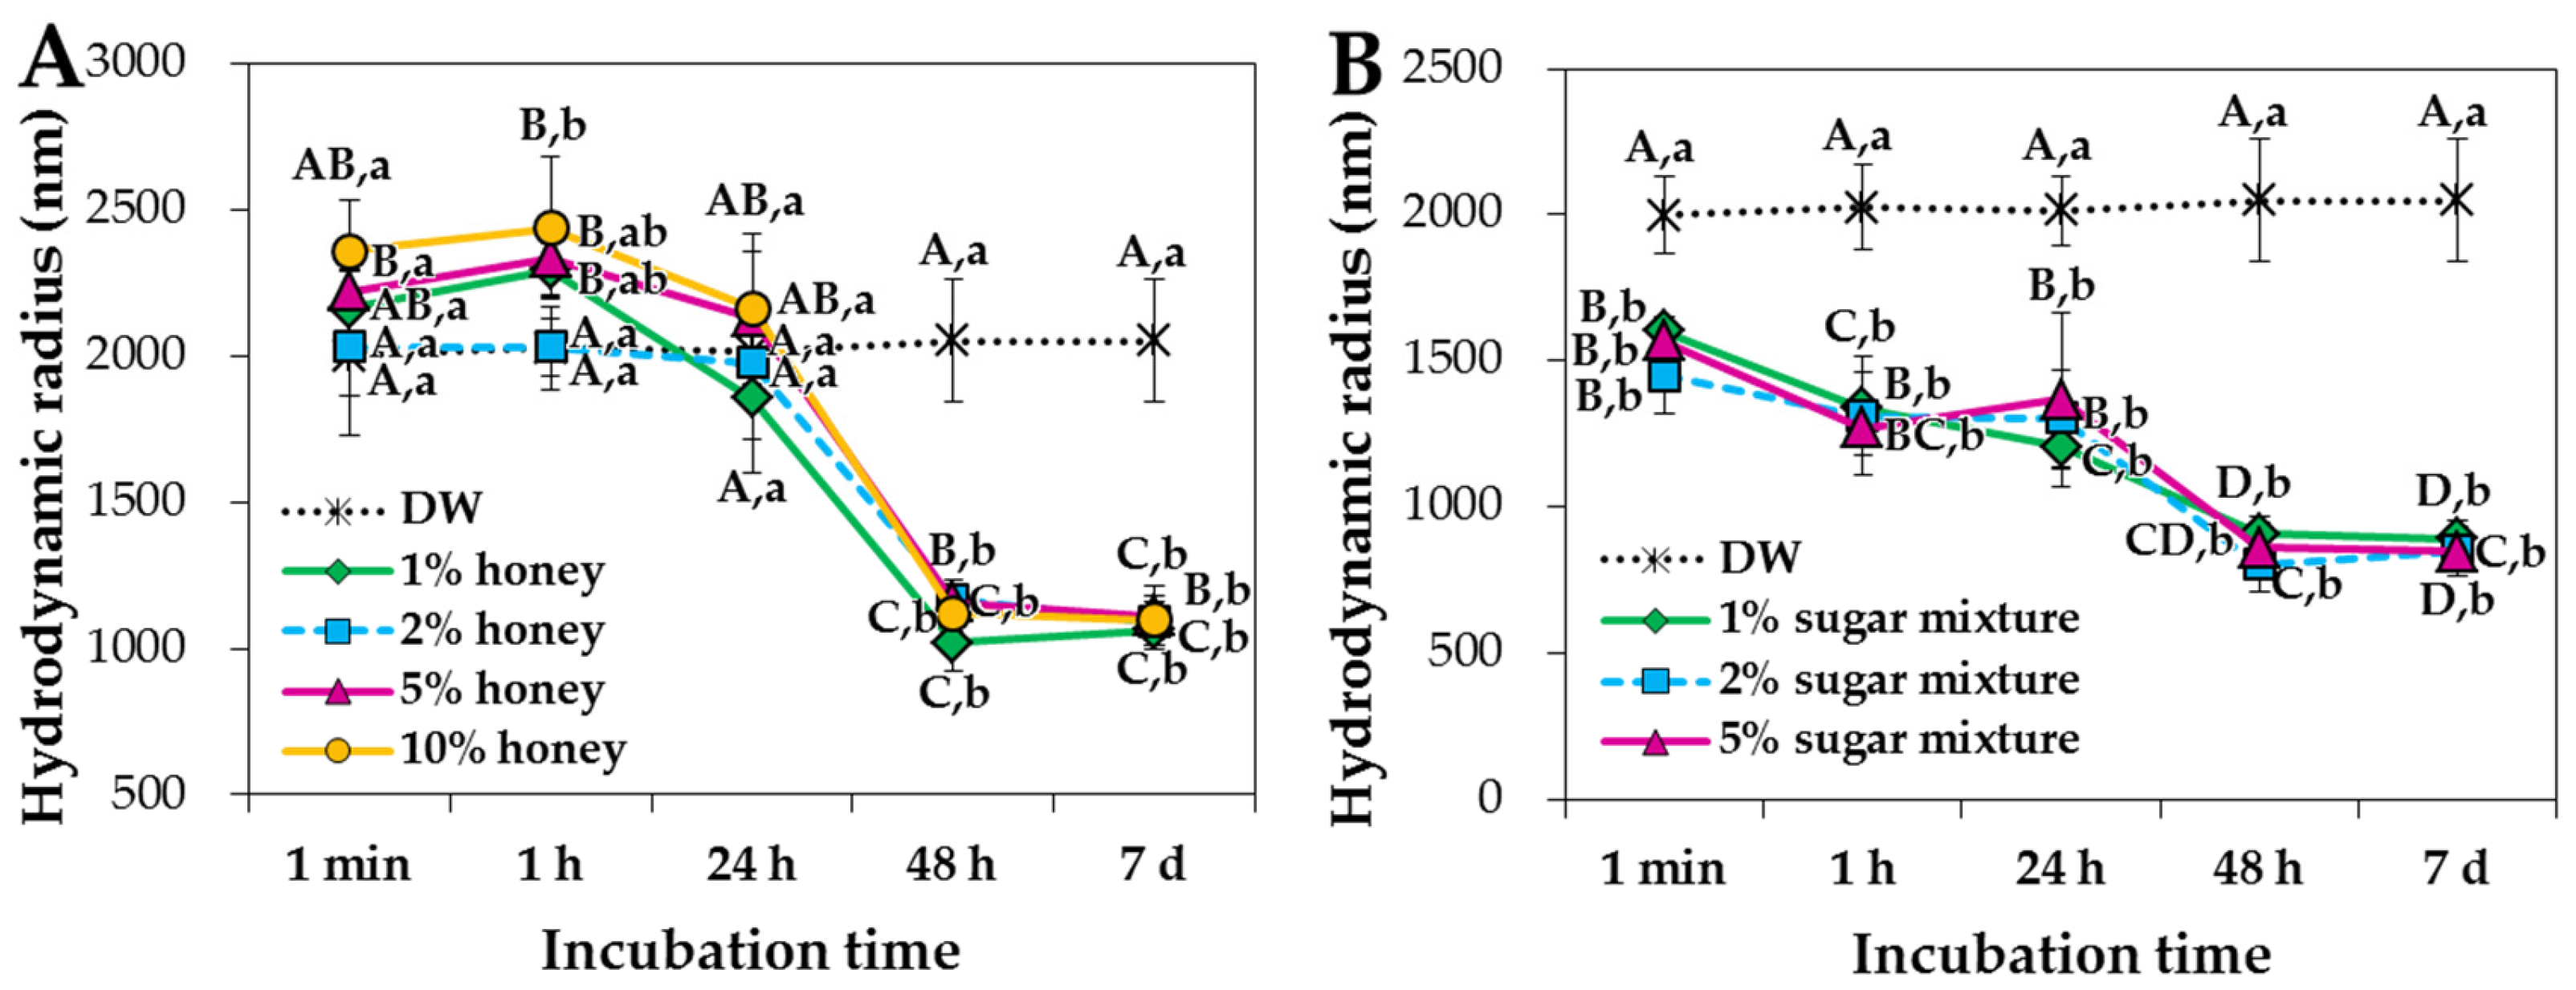
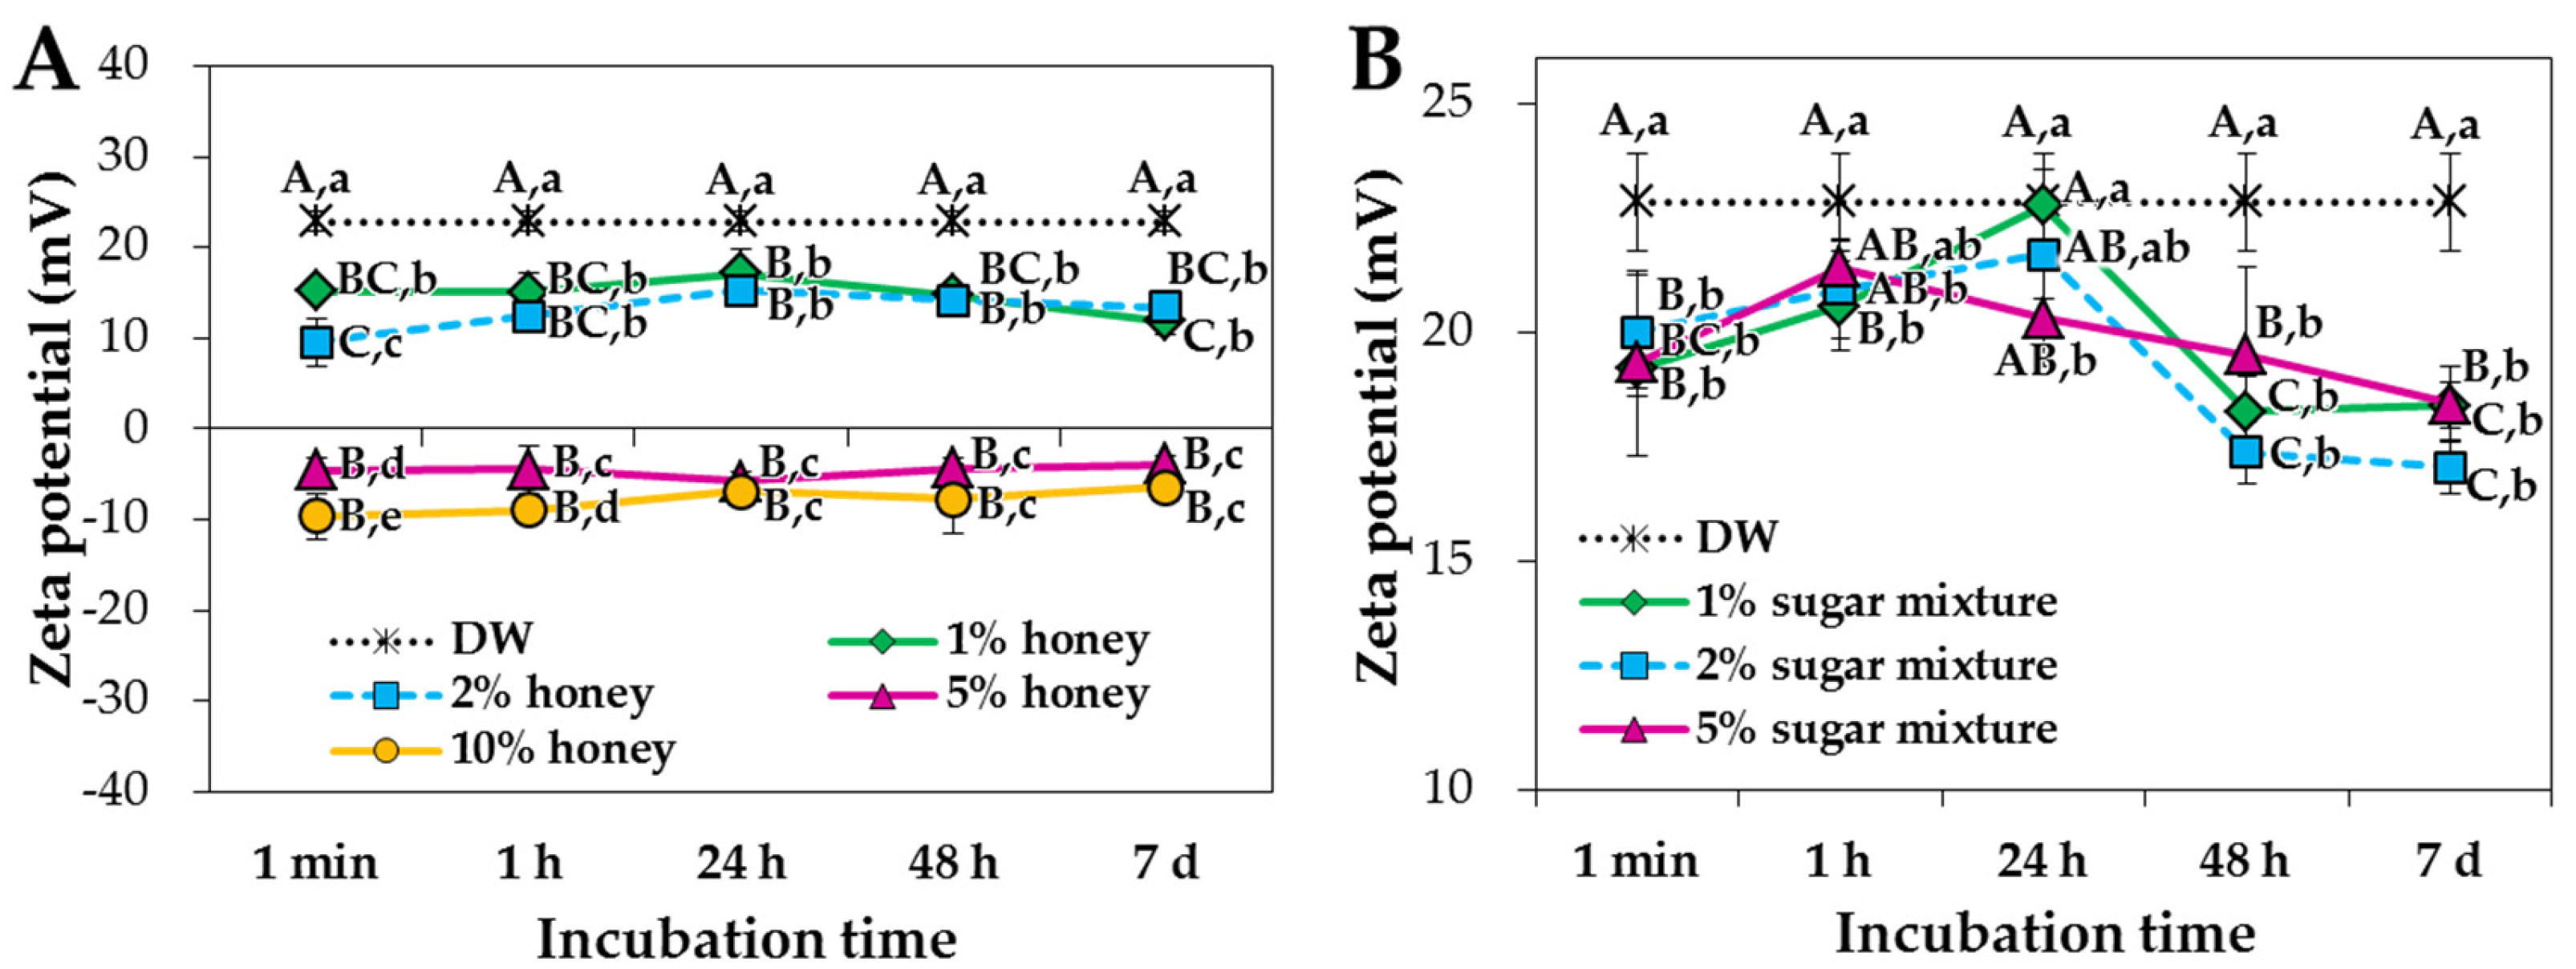
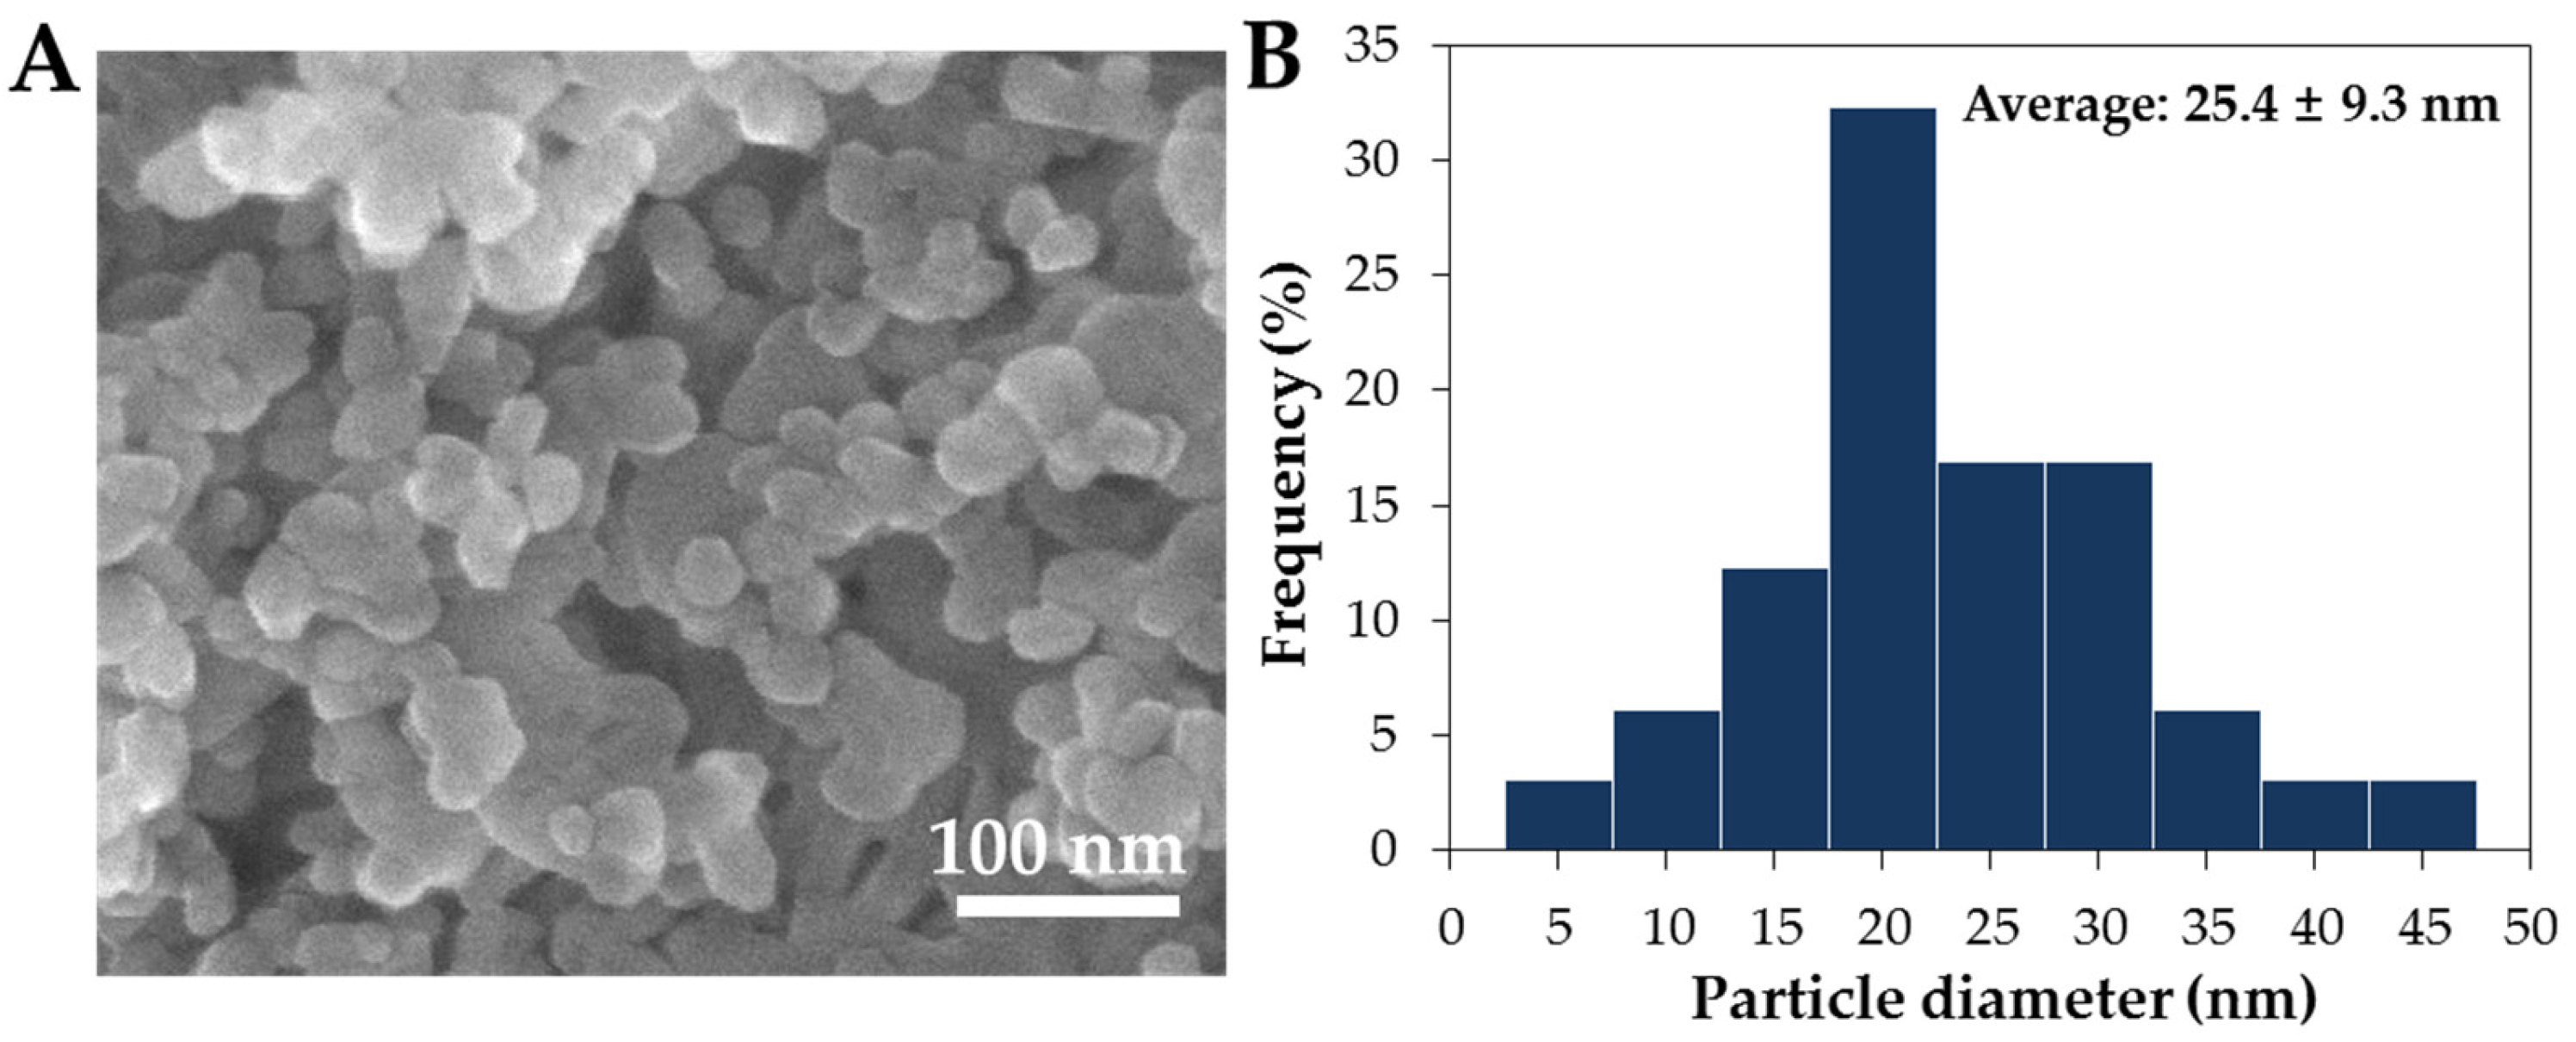
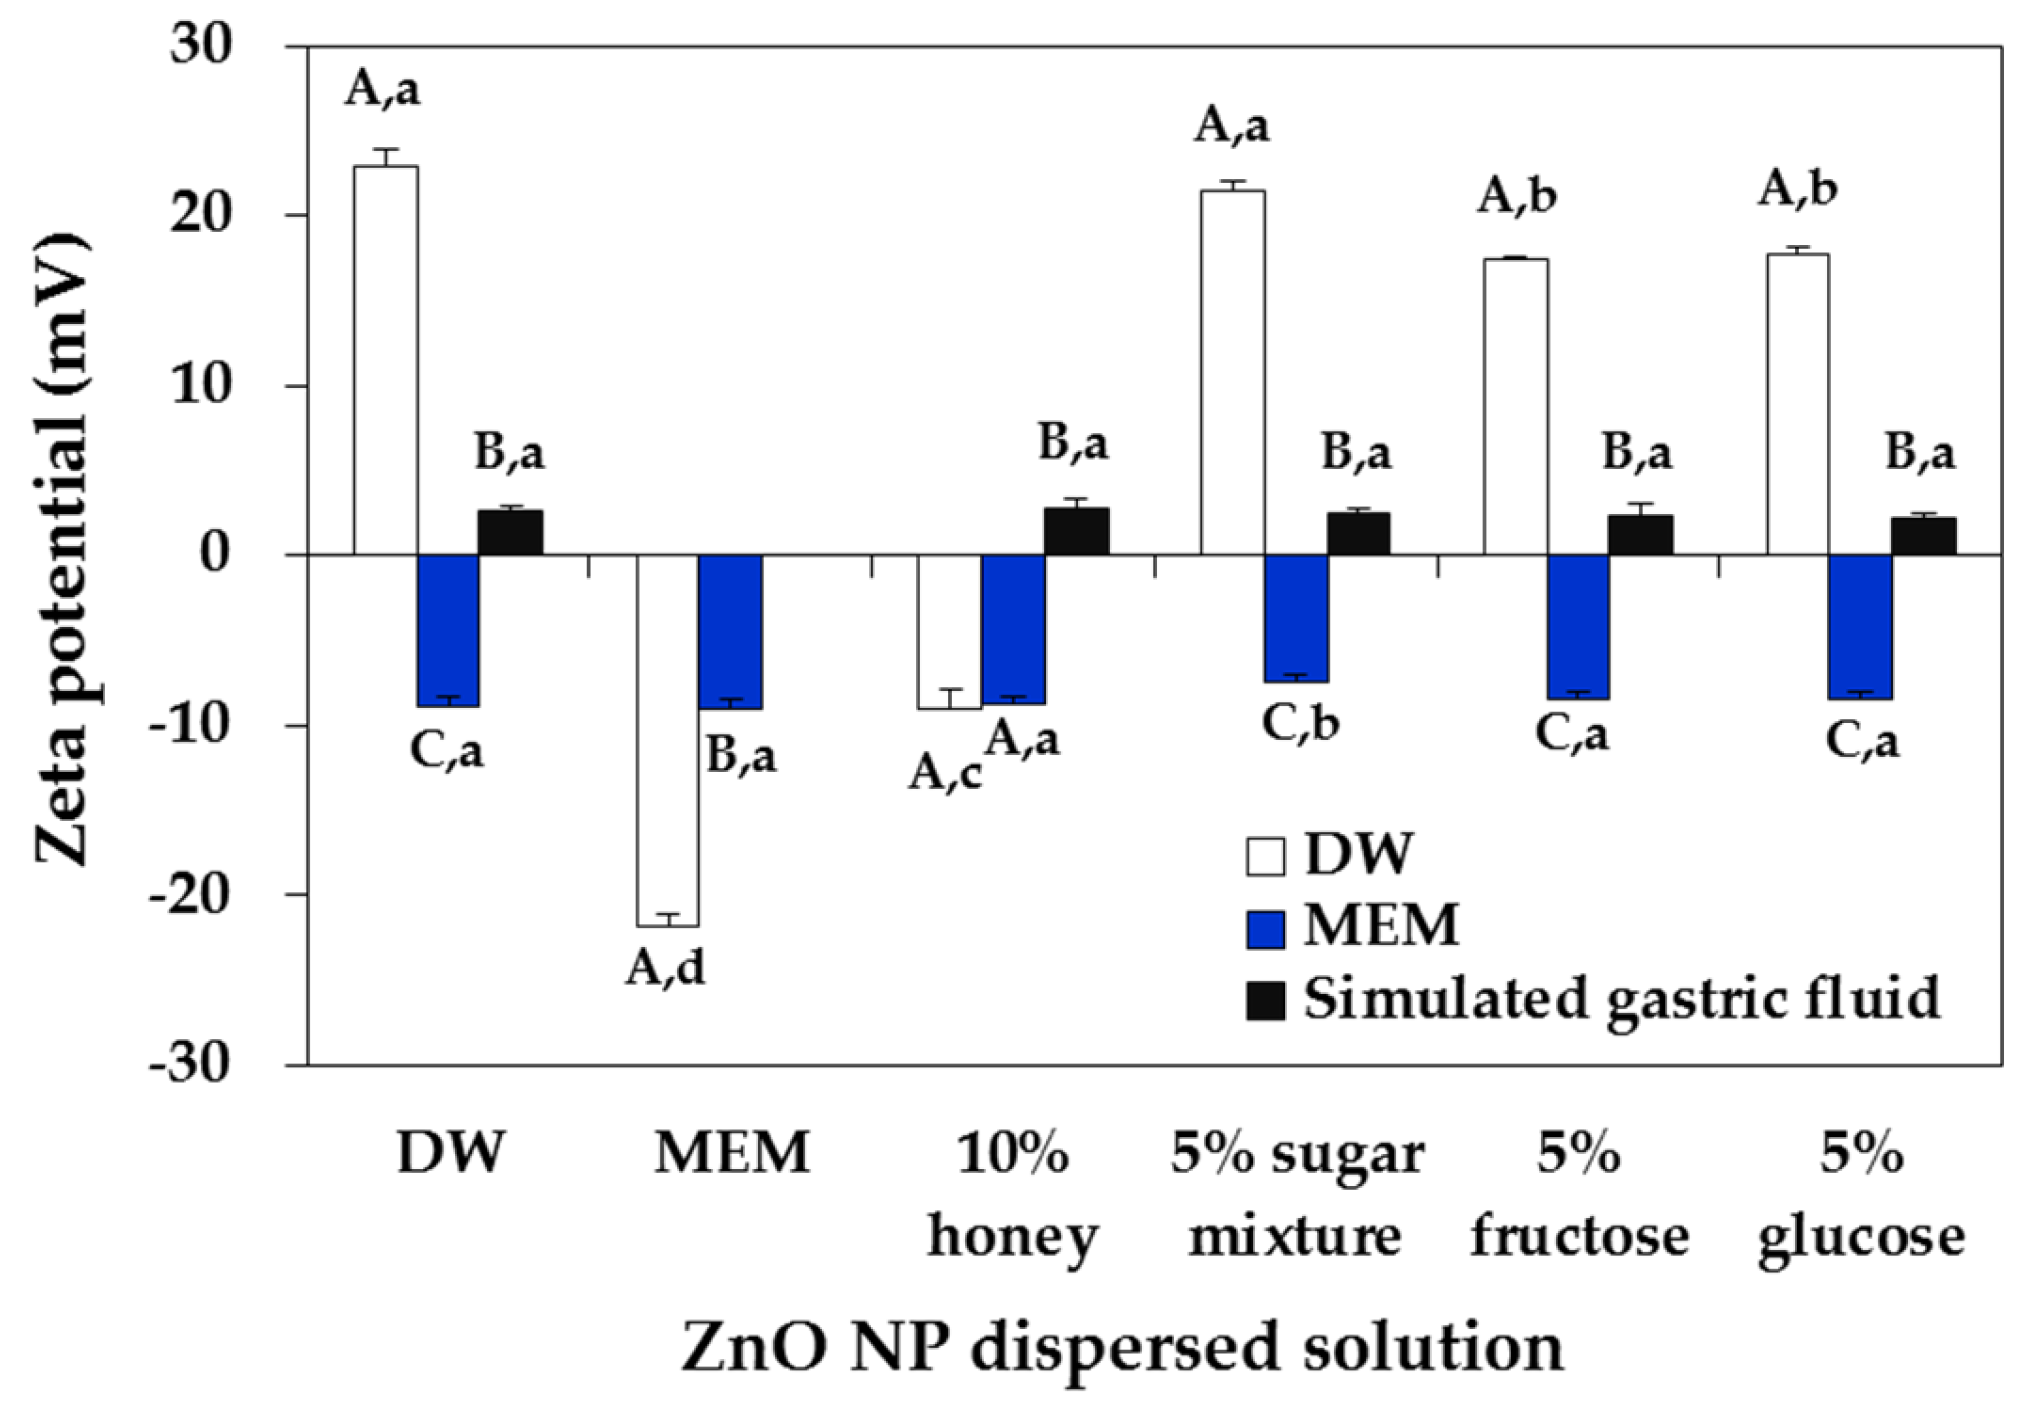
2.1. Characterization of ZnO NPs in Saccharides
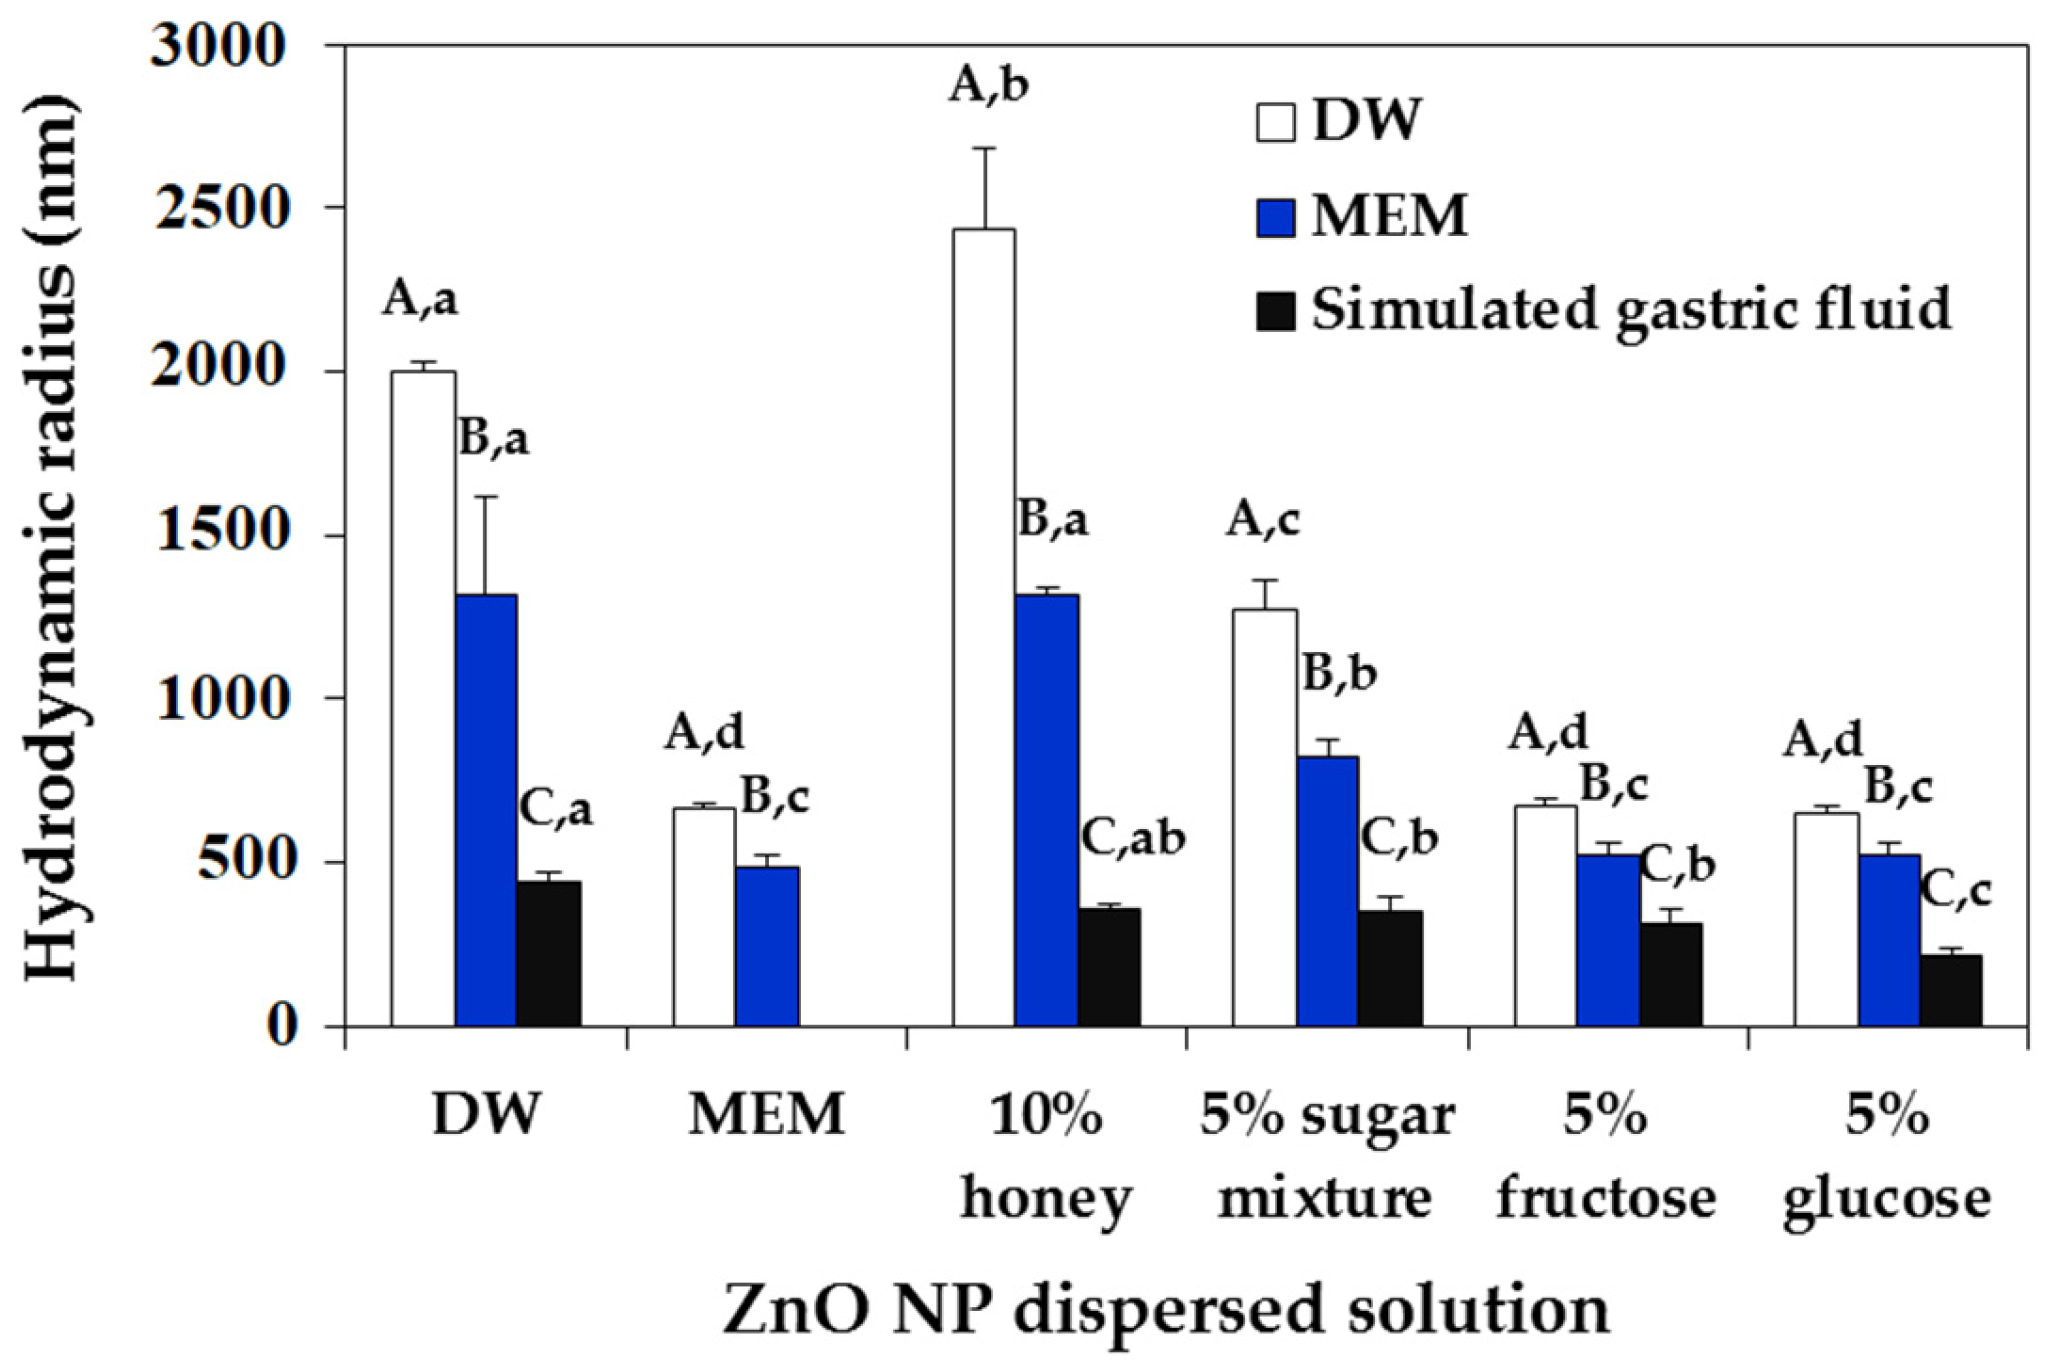
2.2. ZnO NP-Saccharide-Biomatrix Interactions
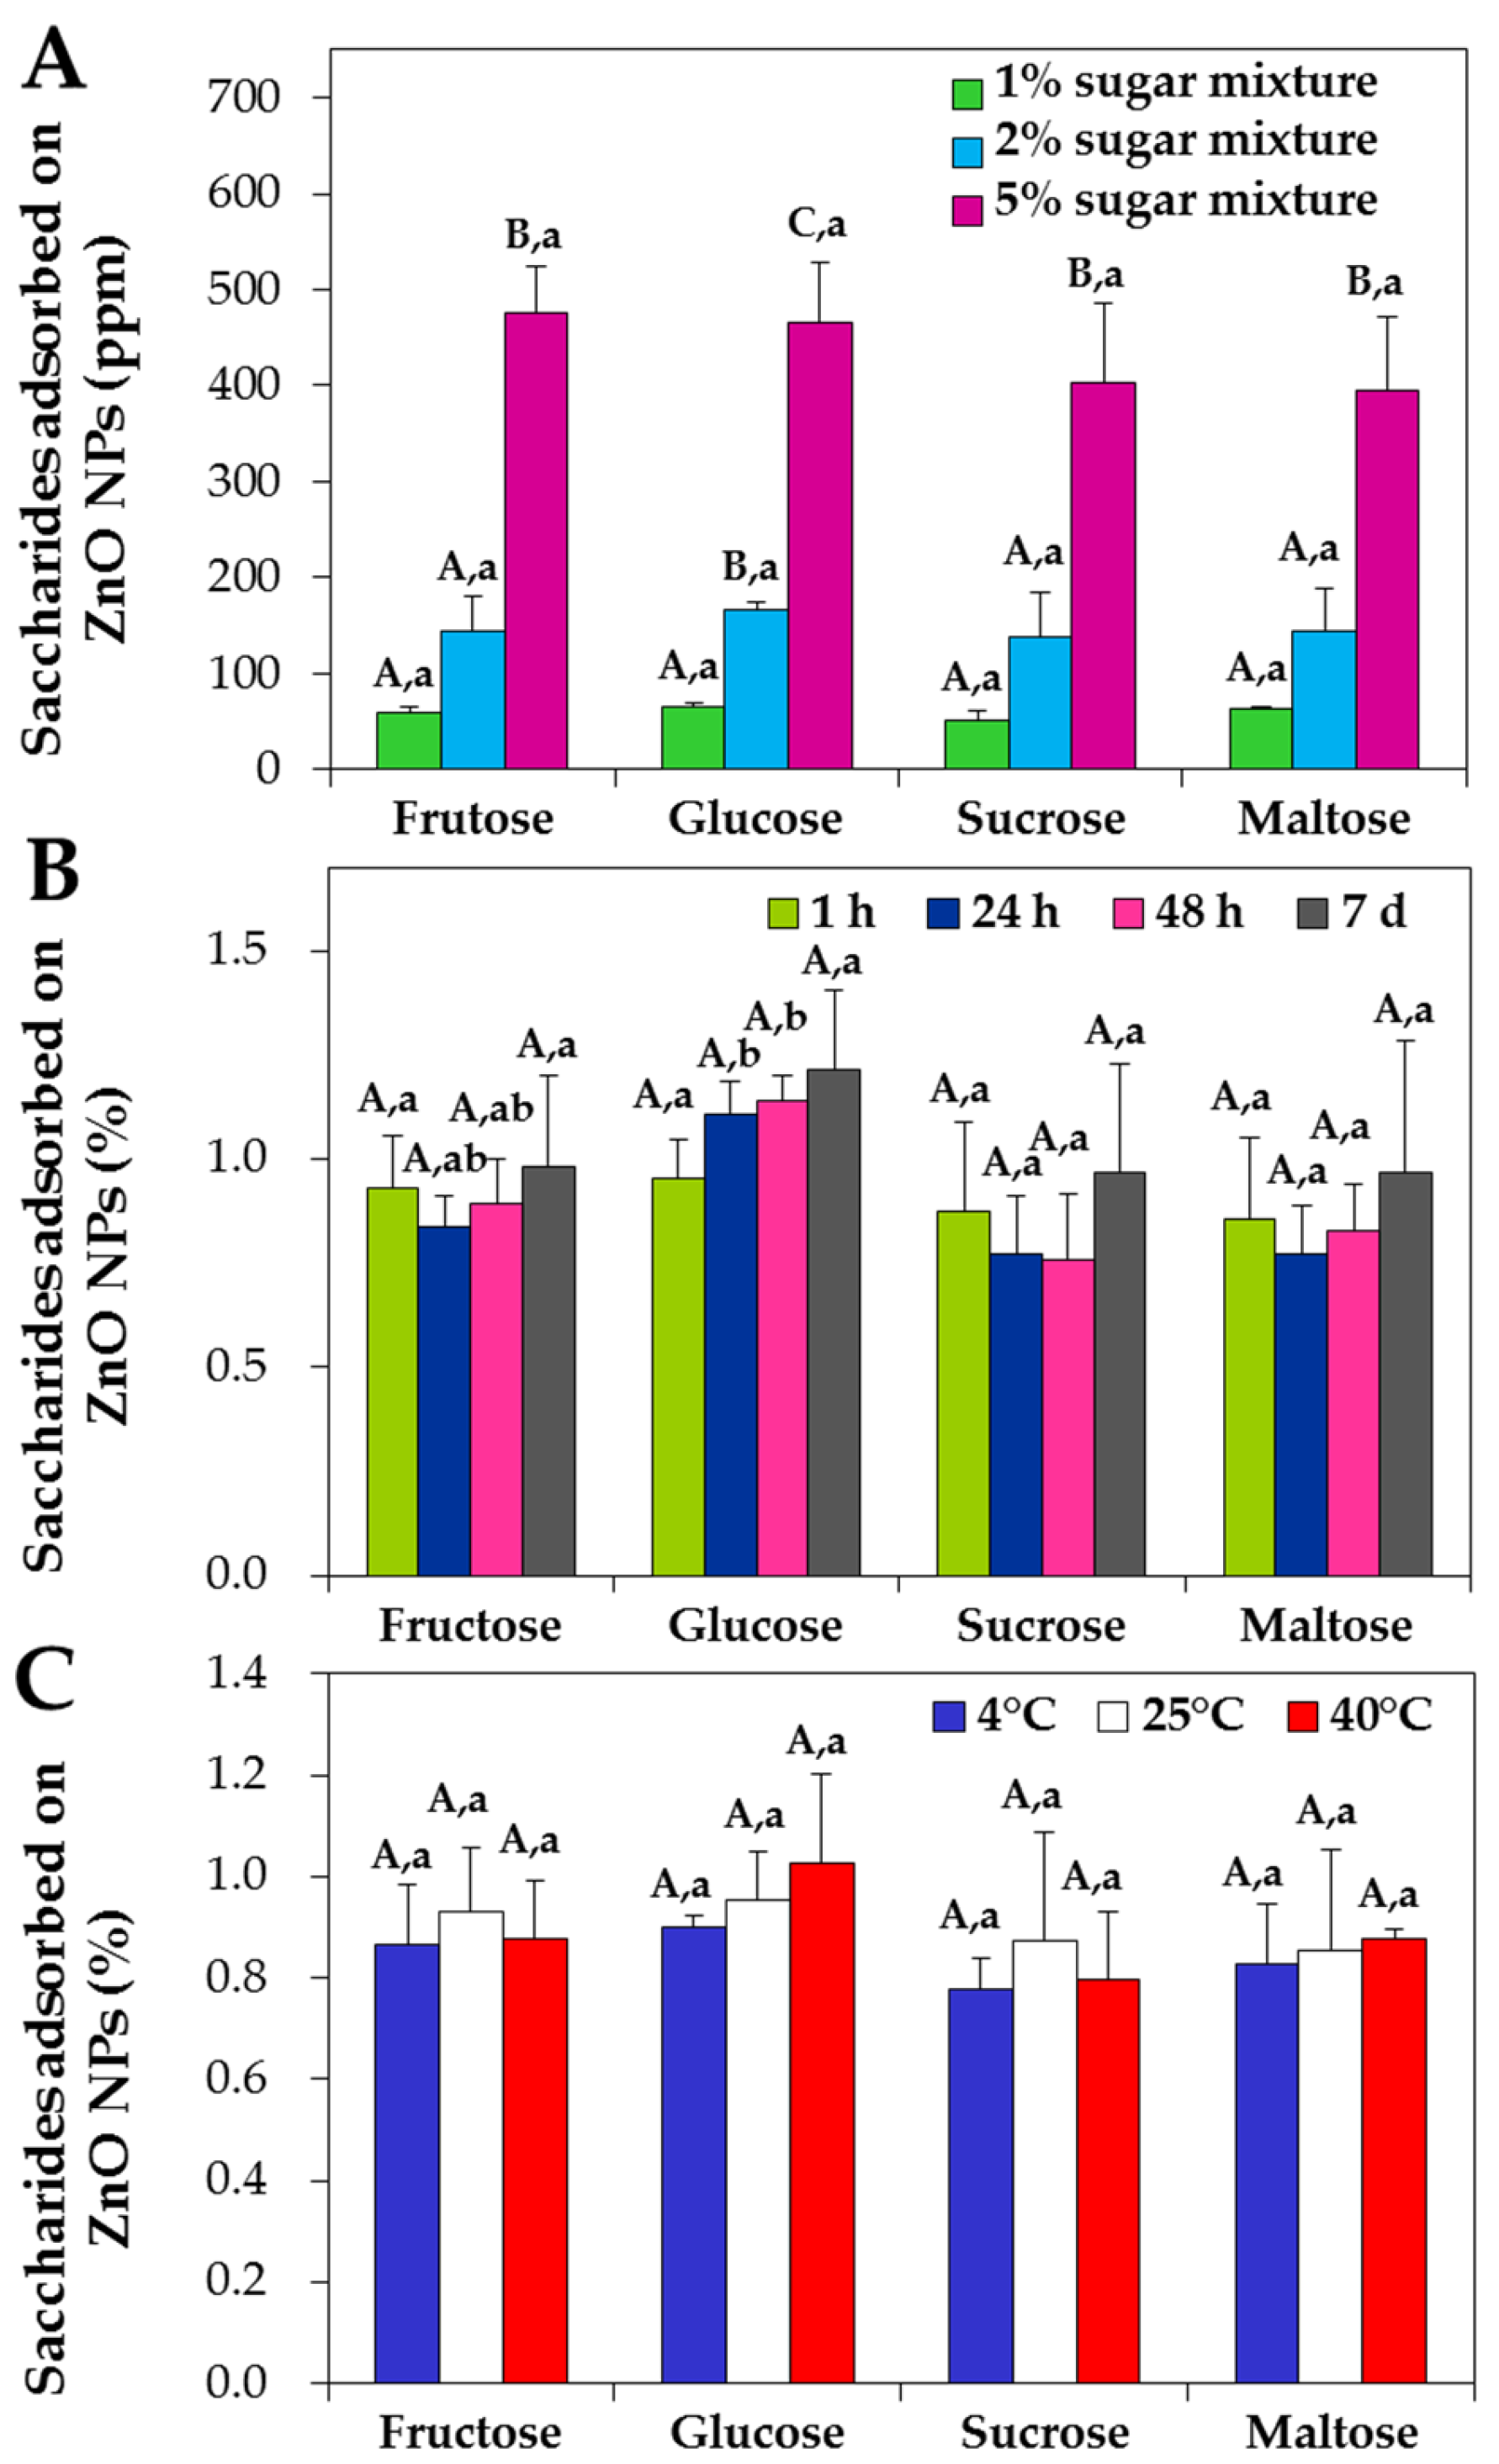
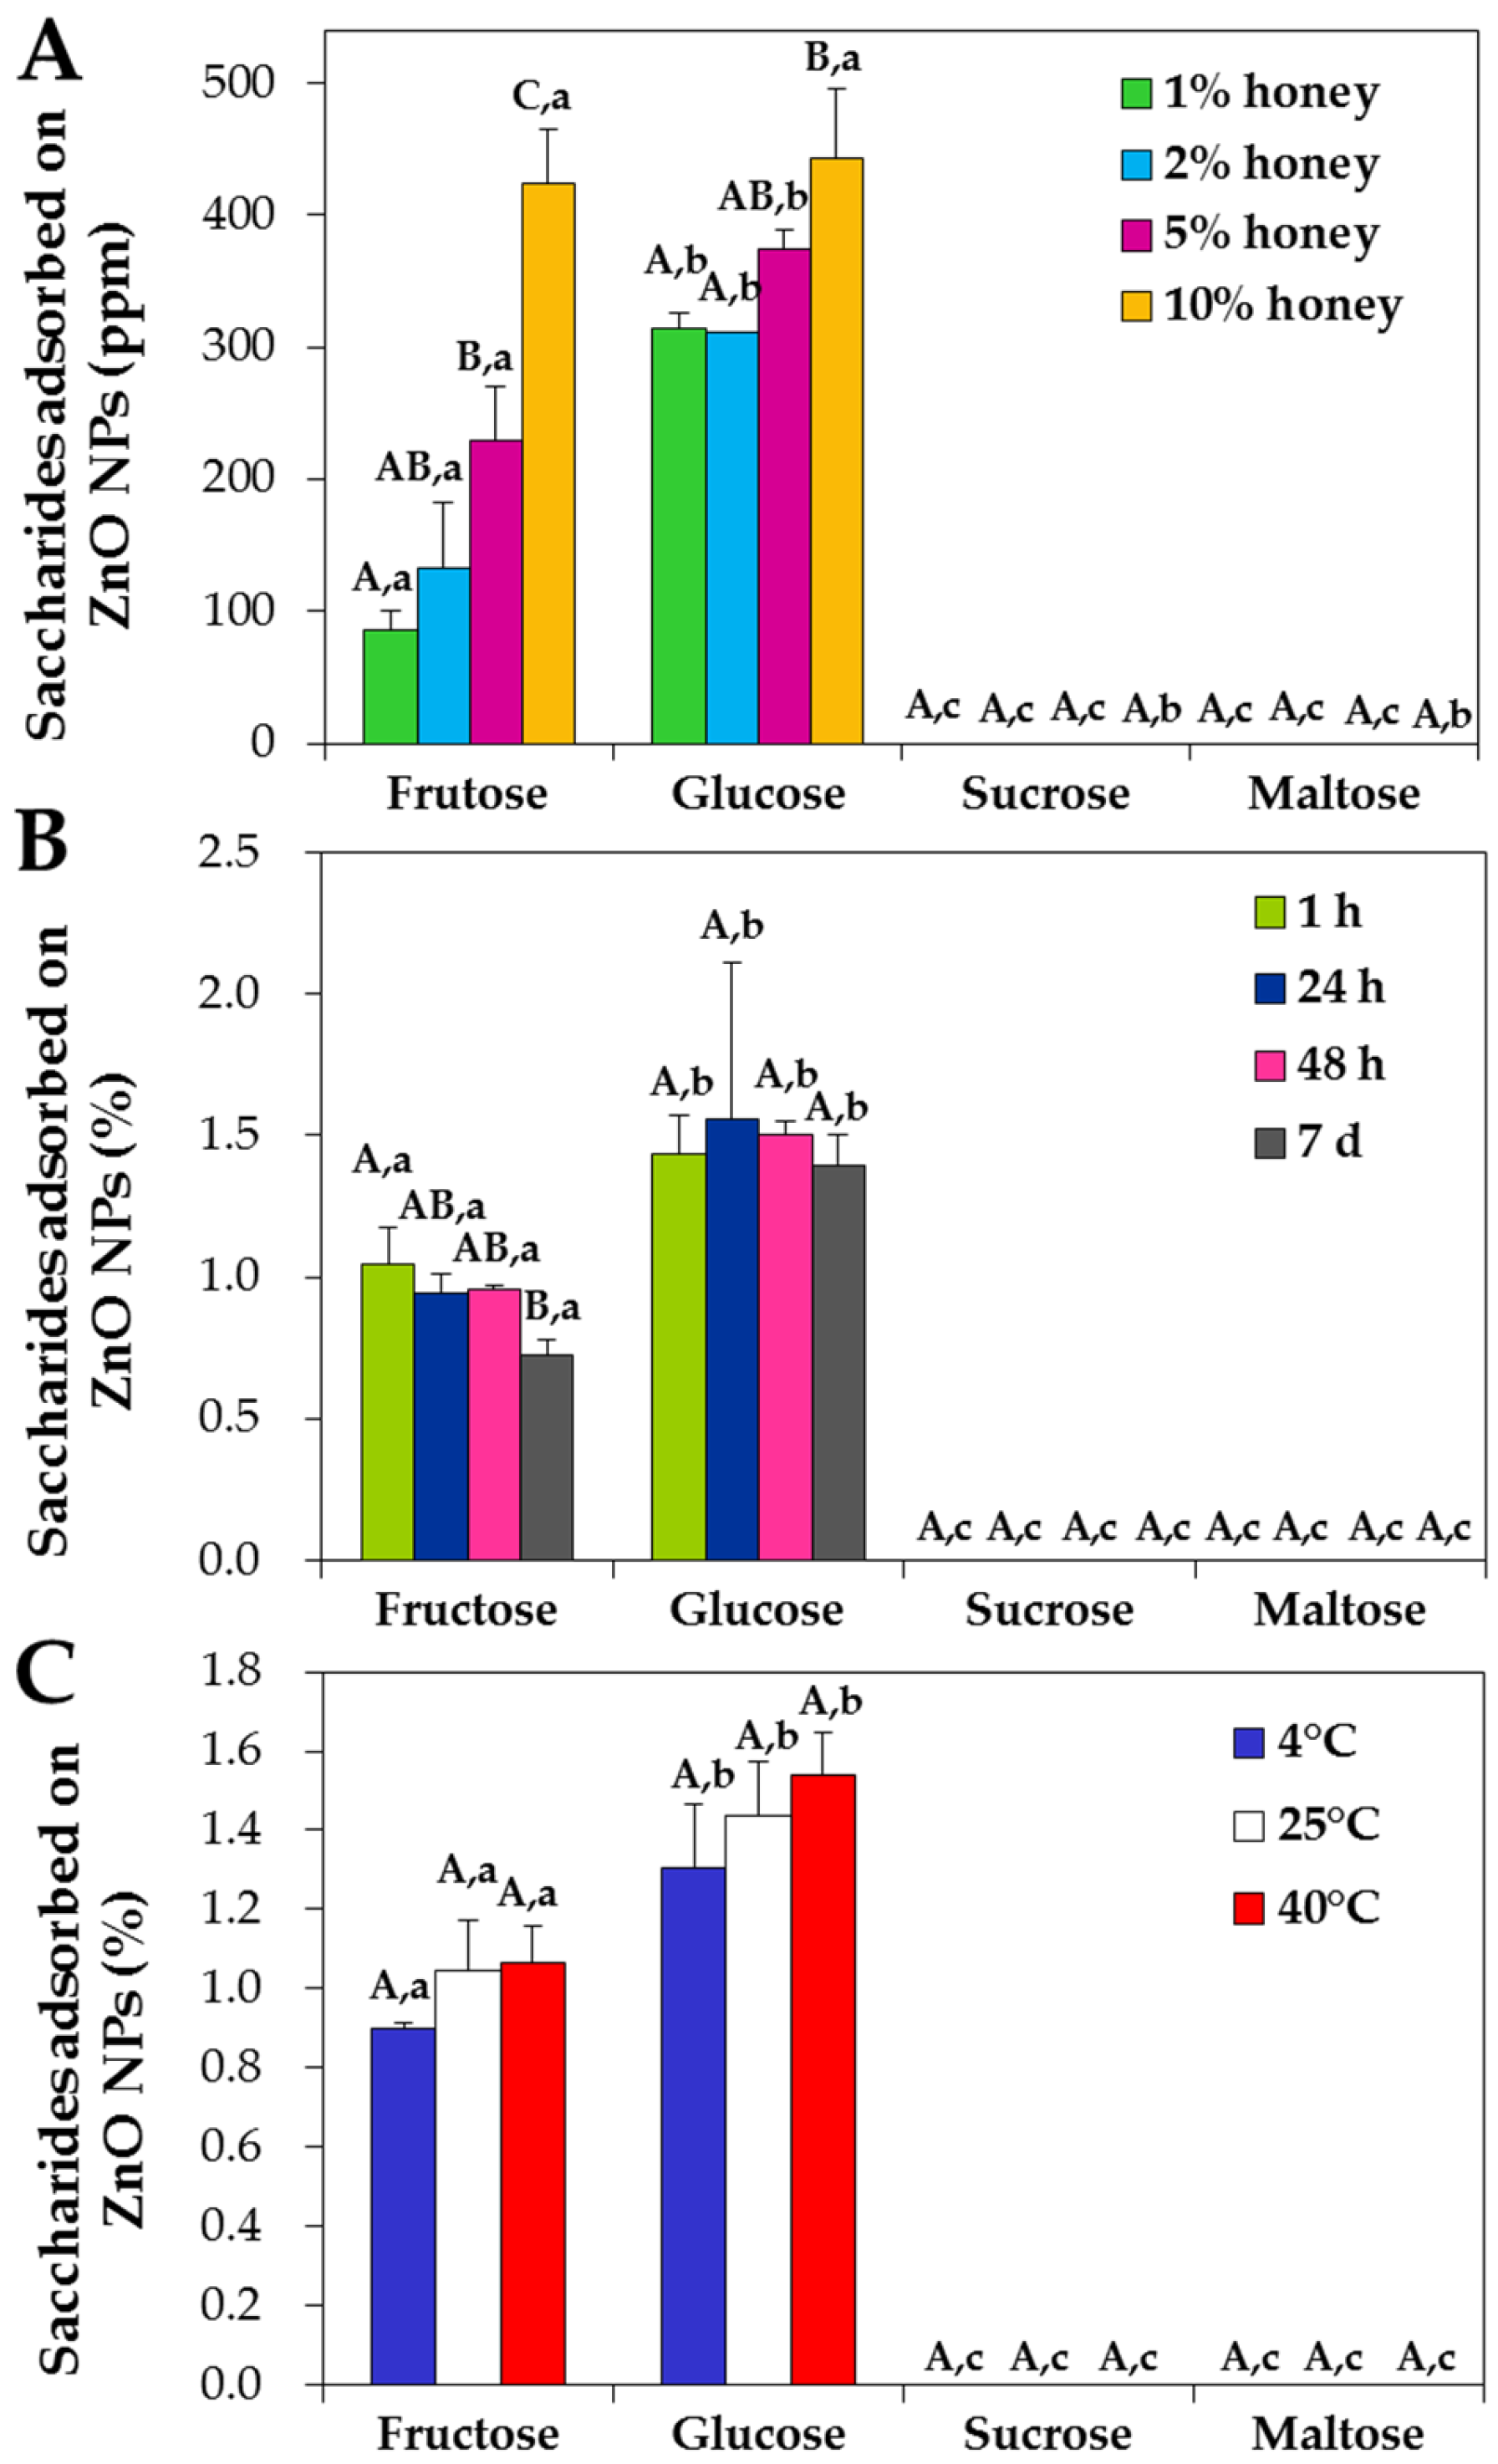
2.3. Quantitative Analysis of Interactions between ZnO NP and Saccharides
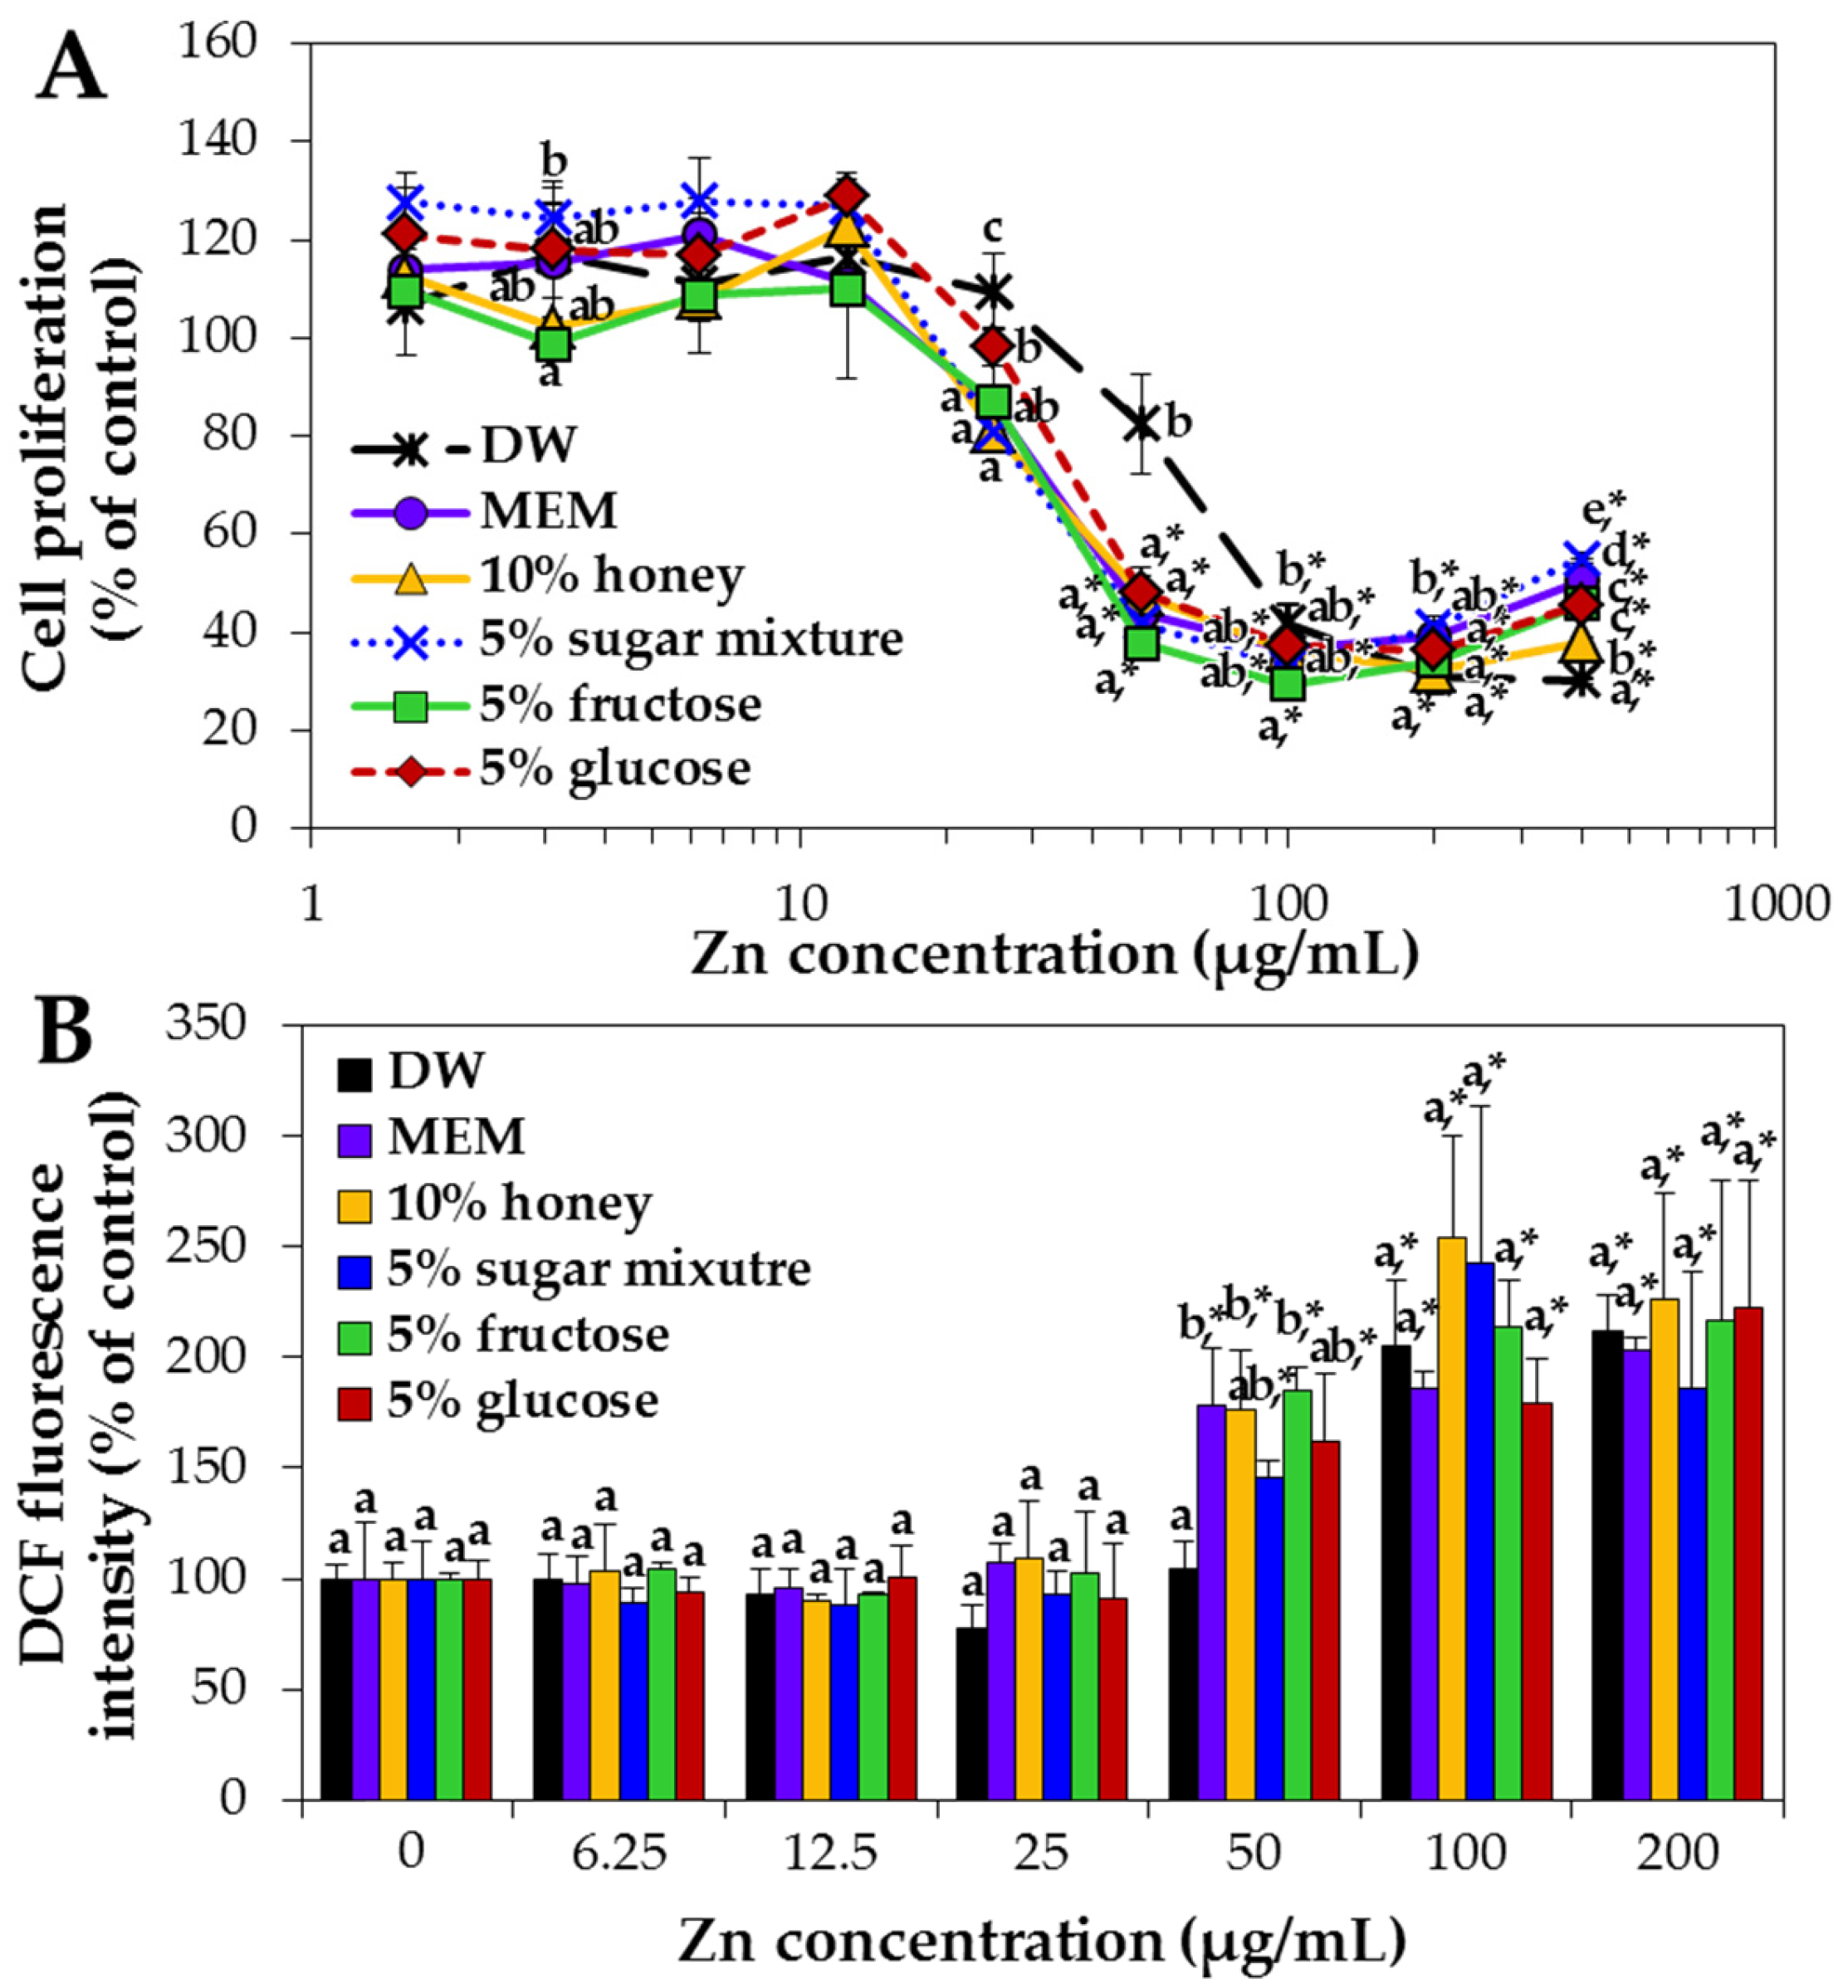
2.4. Interaction Effects on ZnO NP Cytotoxicity
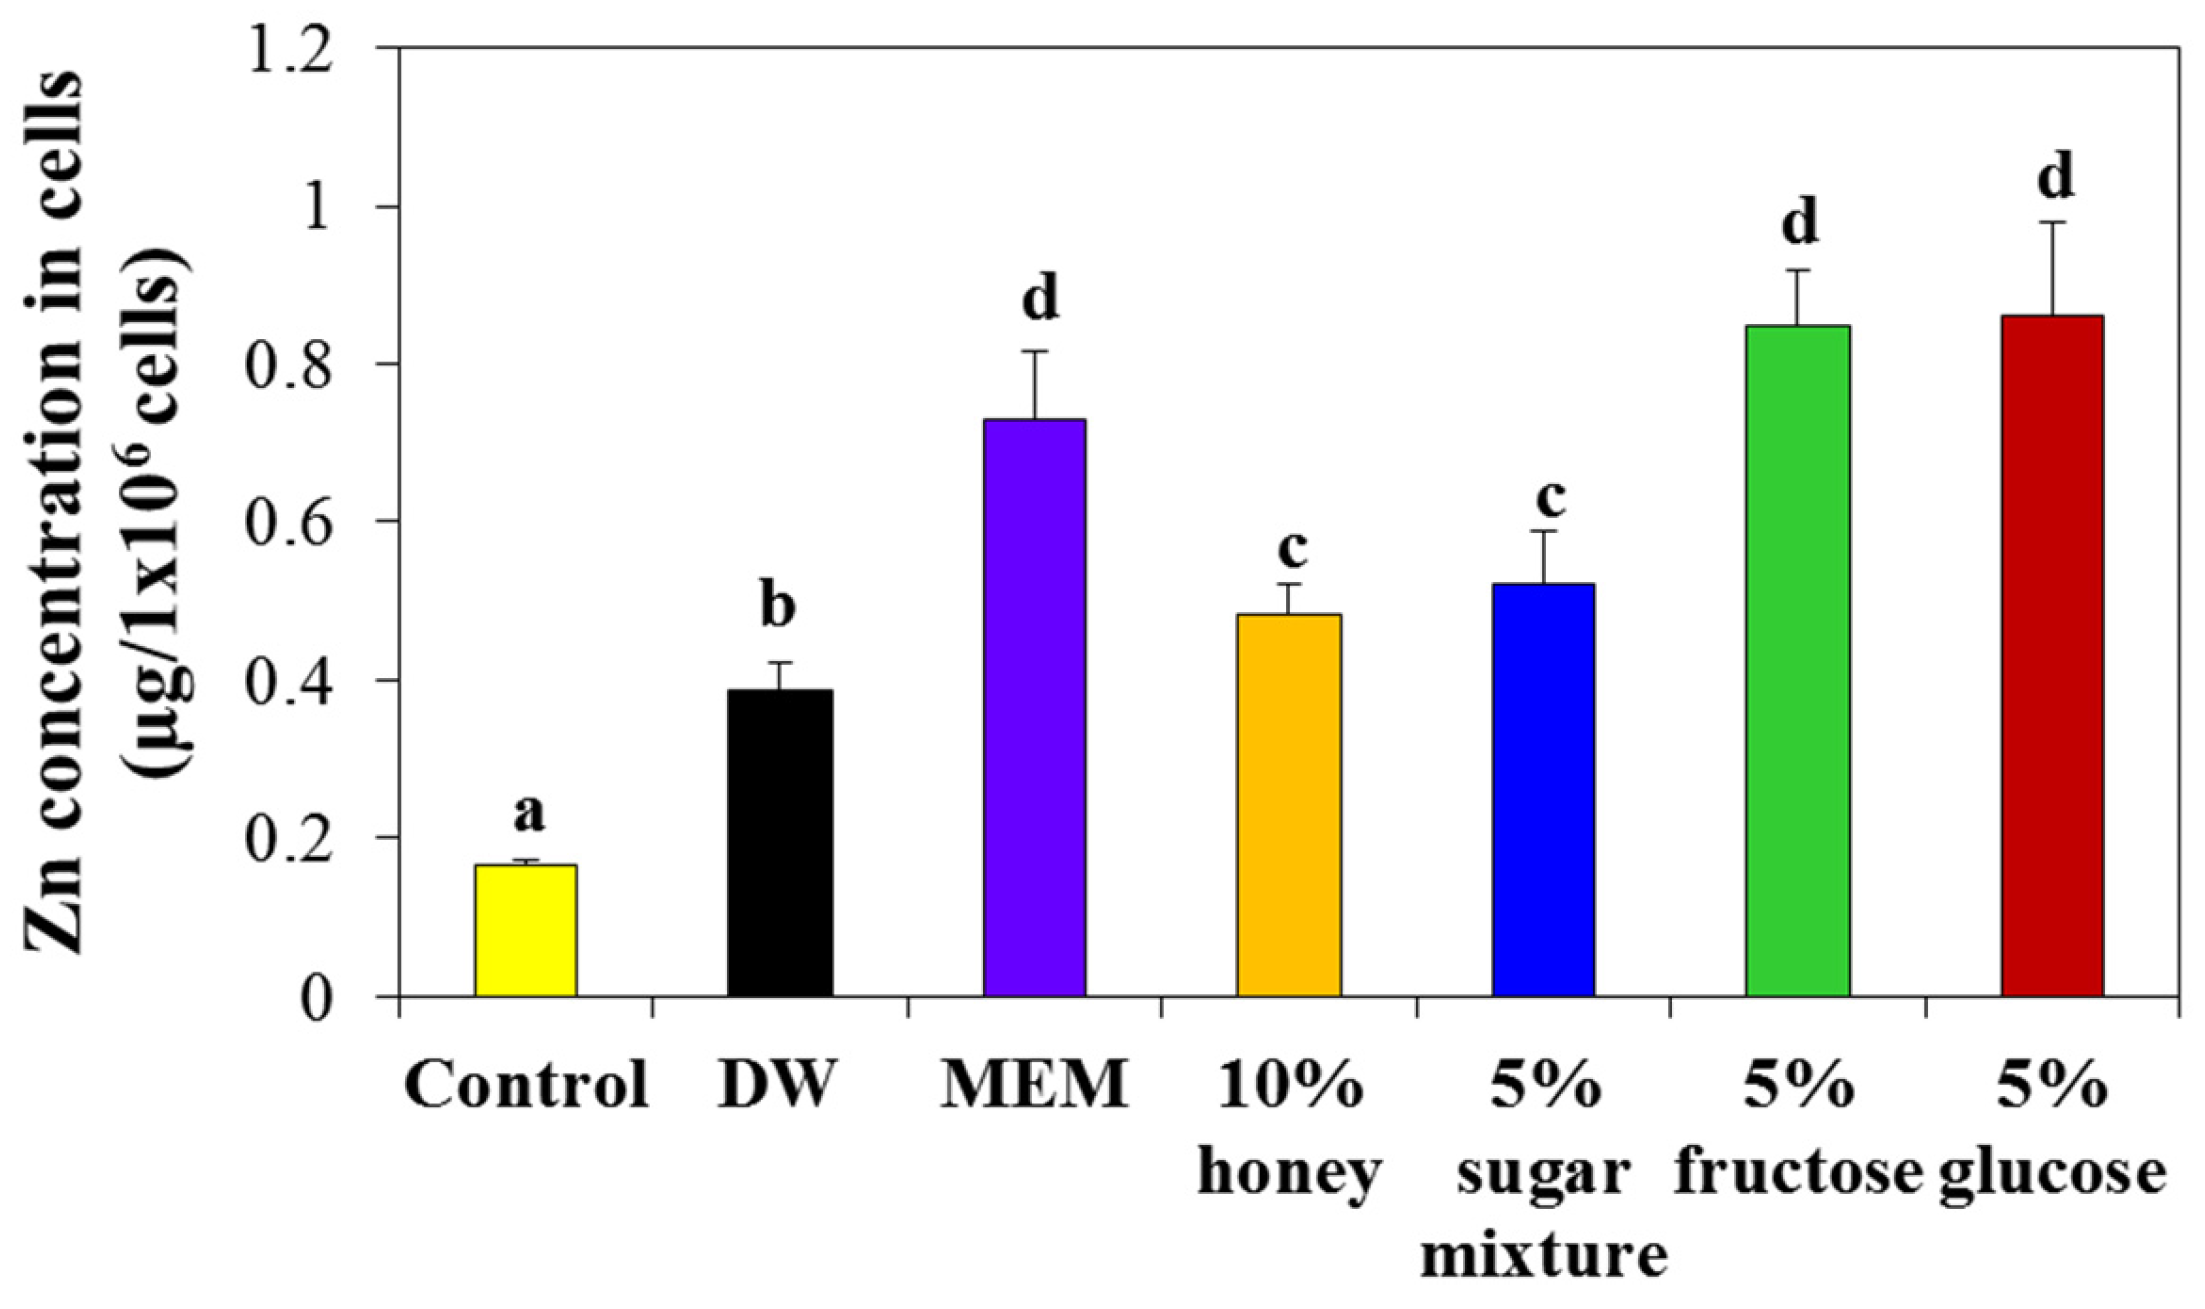
2.5. Interaction Effects on Cellular Uptake
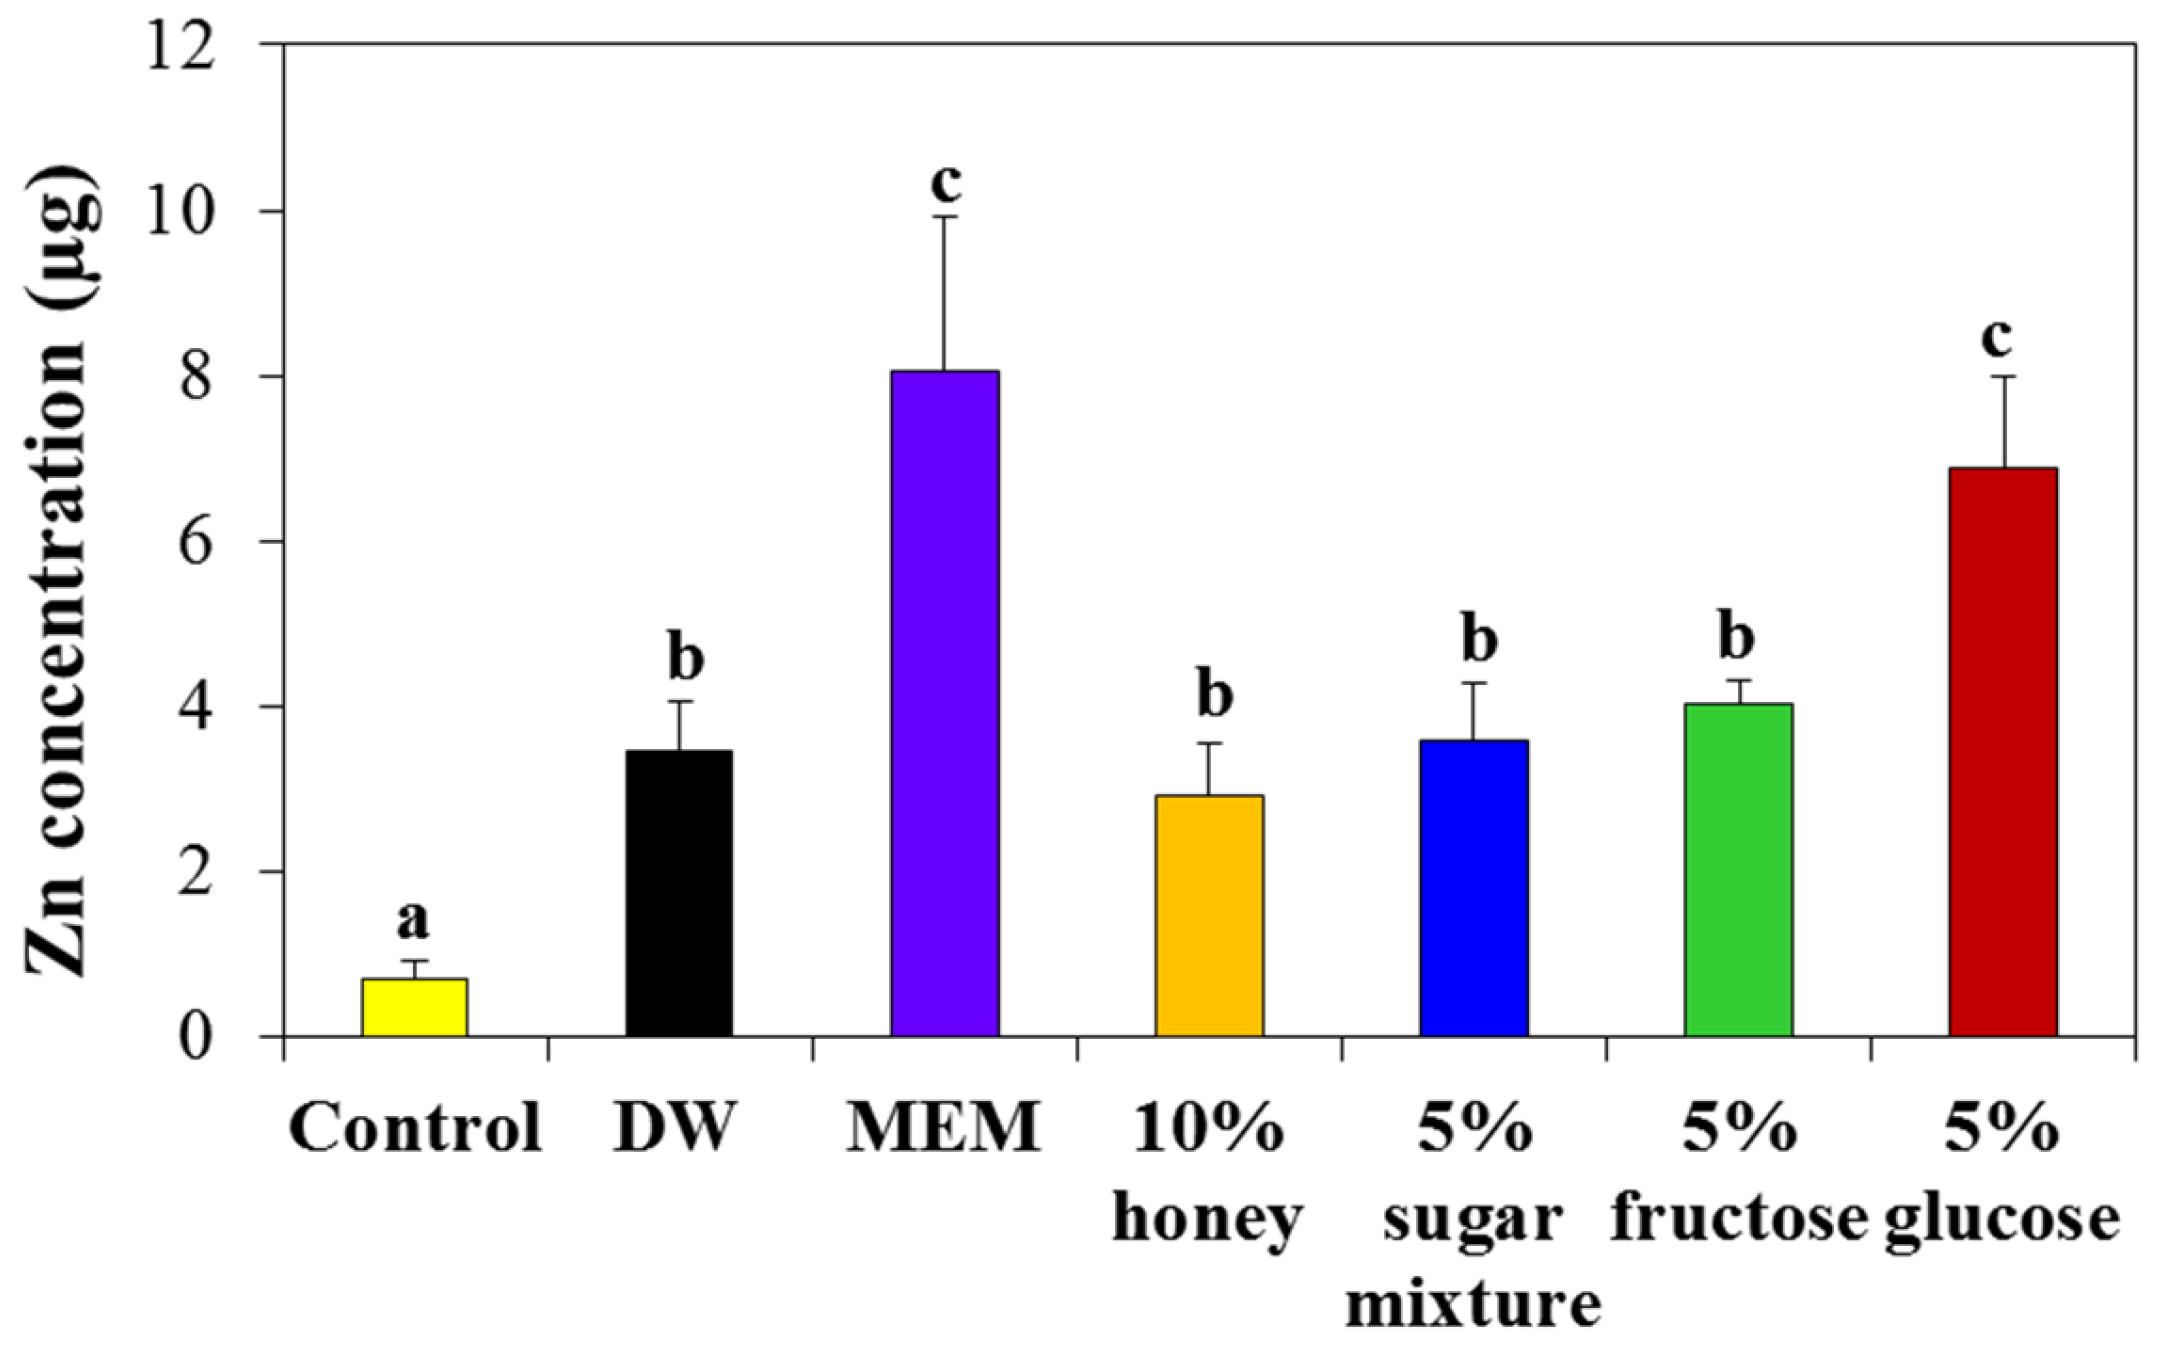
2.6. Interaction Effects on Intestinal Transport
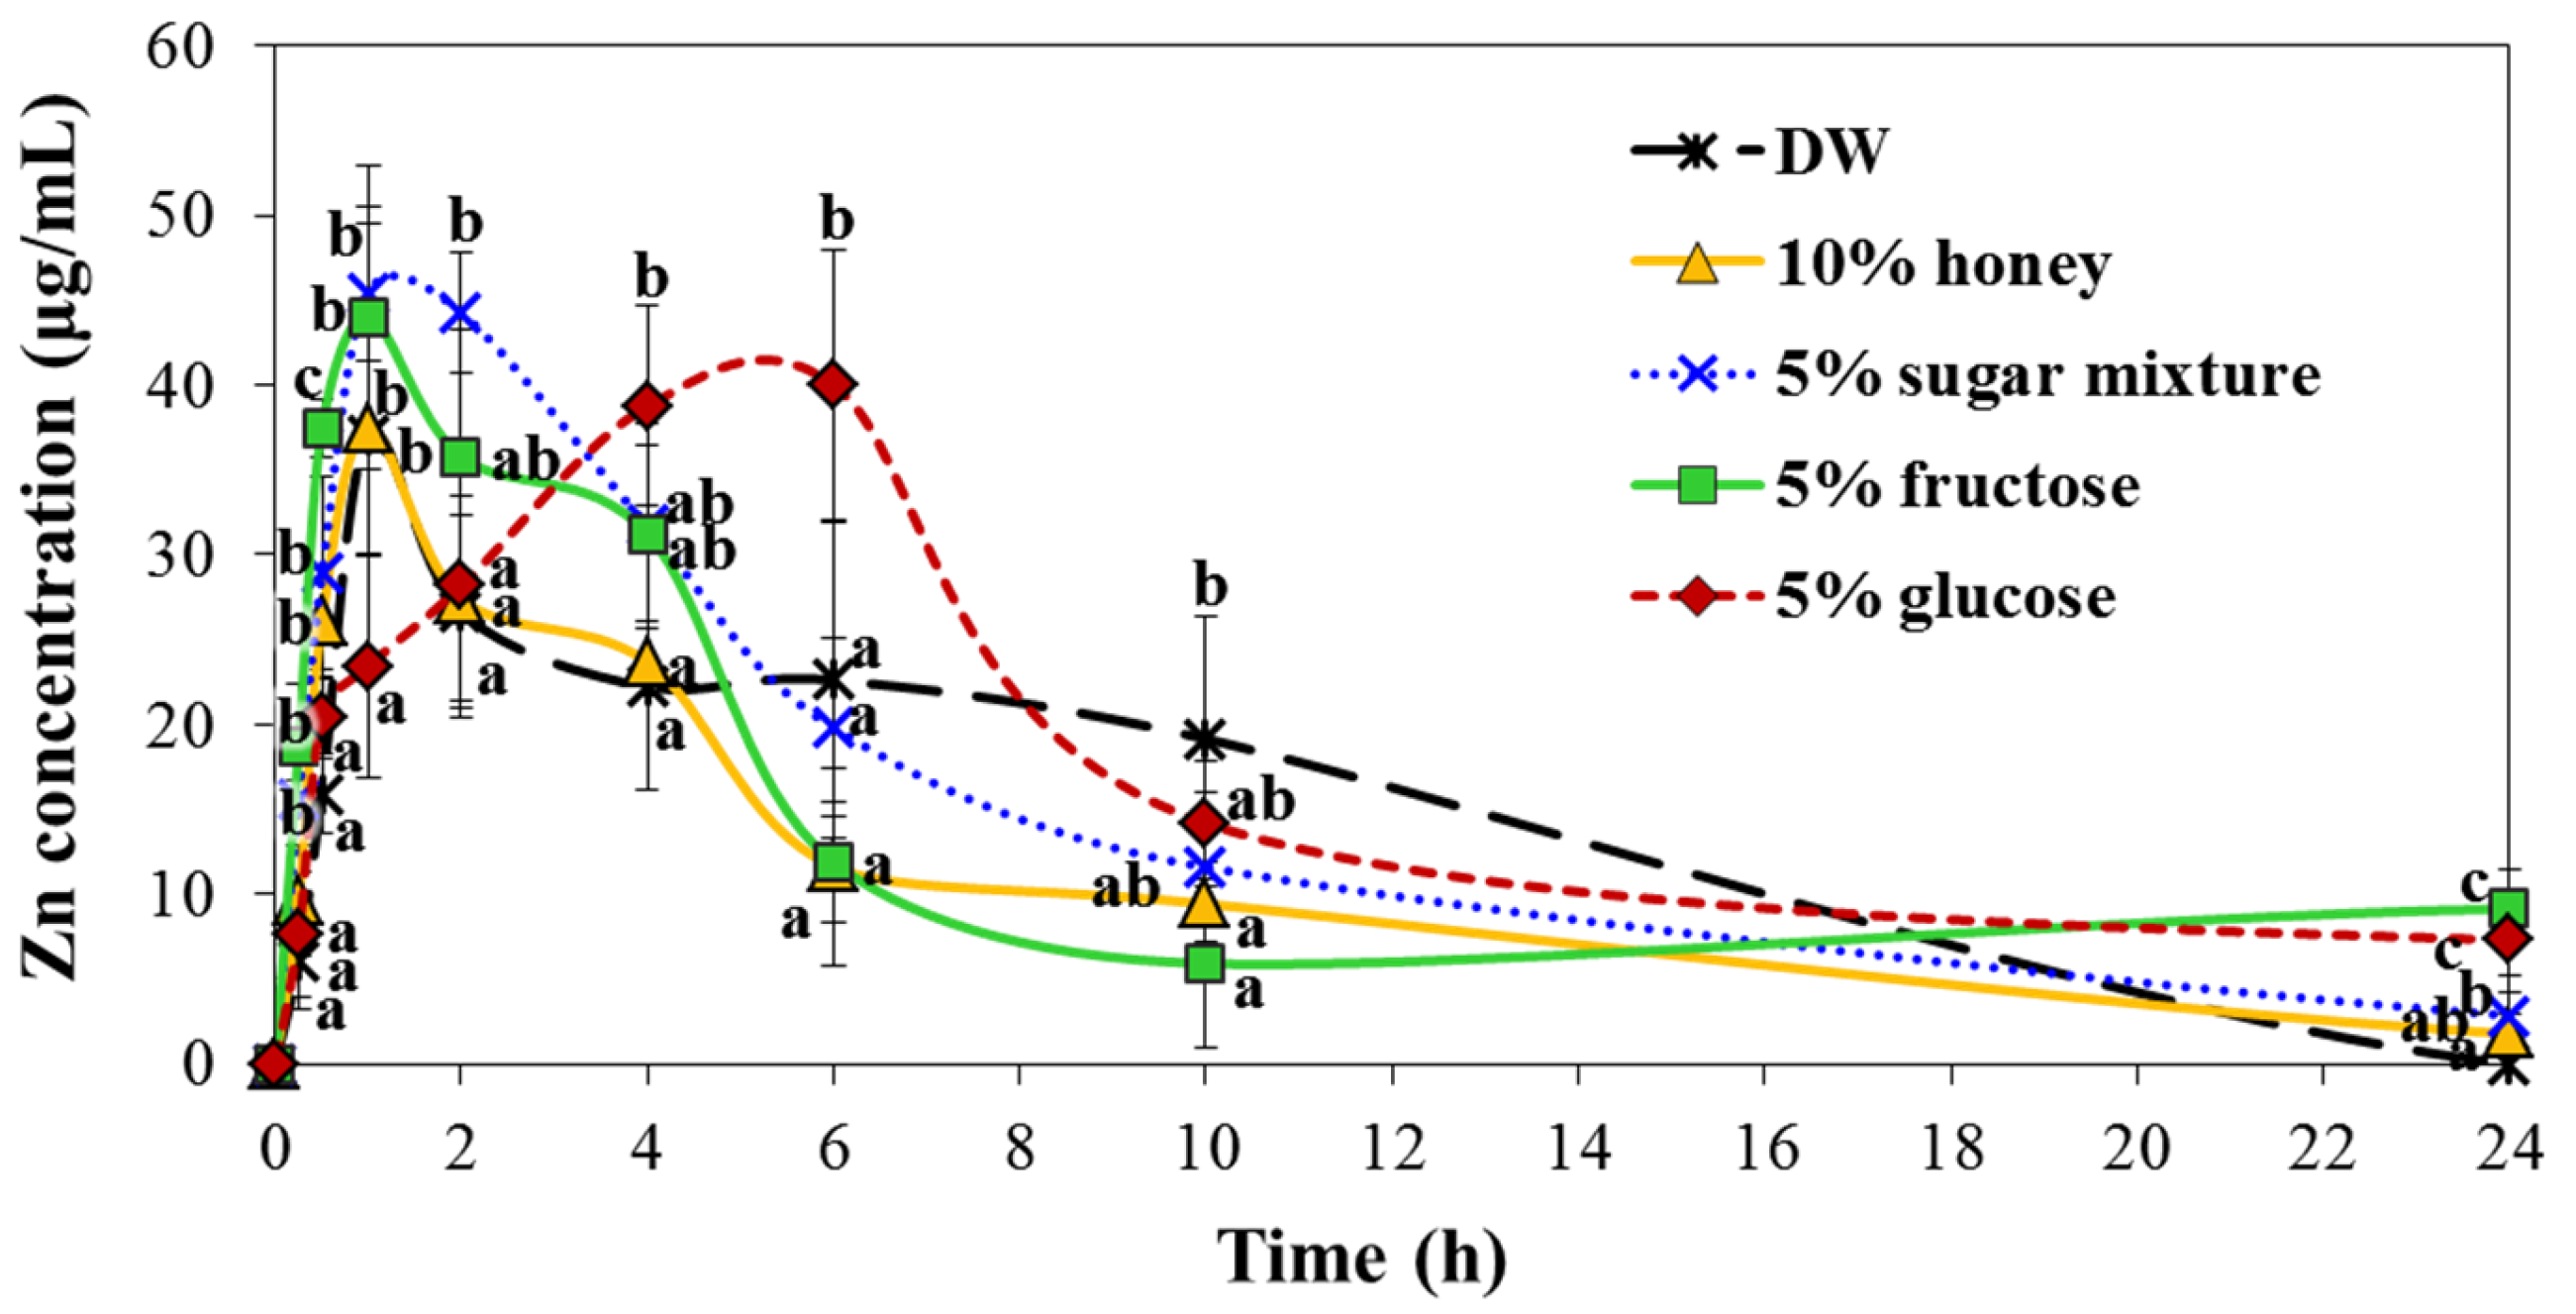
2.7. Interaction Effects on Biokinetics
3. Discussion
4. Materials and Methods
4.1. Materials and Characterization
4.2. Physicochemical Properties of ZnO NPs in Food Matrices or Biomatrices
4.3. Solubility
4.4. Quantitative Analysis on ZnO NP Interaction with Saccharides
4.5. Cytotoxicity
4.6. Cellular Uptake
4.7. 3D Cell Culture for FAE Model
4.8. Animals
4.9. Biokinetic Study
4.10. ICP-AES Analysis
4.11. Statistical Analysis
5. Conclusions
Supplementary Materials
Acknowledgments
Author Contributions
Conflicts of Interest
References
- Serpone, N.; Dondi, D.; Albini, A. Inorganic and organic UV filters: Their role and efficacy in sunscreens and suncare product. Inorg. Chim. Acta 2007, 360, 794–802. [Google Scholar] [CrossRef]
- Espitia, P.J.P.; Soares, N.F.F.; Coimbra, J.S.R.; de Andrade, N.J.; Cruz, R.S.; Medeiros, E.A.A. Zinc oxide nanoparticles: Synthesis, antimicrobial activity and food packaging applications. Food Bioprocess Technol. 2012, 5, 1447–1464. [Google Scholar] [CrossRef]
- Shi, L.E.; Li, Z.H.; Zheng, W.; Zhao, Y.F.; Jin, Y.F.; Tang, Z.X. Synthesis, antibacterial activity, antibacterial mechanism and food applications of ZnO nanoparticles: A review. Food Addit. Contam. A 2014, 31, 173–186. [Google Scholar] [CrossRef] [PubMed]
- Agren, M.S.; Chvapil, M.; Franzen, L. Enhancement of re-epithelialization with topical zinc oxide in porcine partial-thickness wounds. J. Surg. Res. 1991, 50, 101–105. [Google Scholar] [CrossRef]
- Rincker, M.J.; Hill, G.M.; Link, J.E.; Meyer, A.M.; Rowntree, J.E. Effects of dietary zinc and iron supplementation on mineral excretion, body composition, and mineral status of nursery pigs. J. Anim. Sci. 2005, 83, 2762–2774. [Google Scholar] [CrossRef] [PubMed]
- Overbeck, S.; Rink, L.; Haase, H. Modulating the immune response by oral zinc supplementation: A single approach for multiple diseases. Arch. Immunol. Ther. Exp. 2008, 56, 15–30. [Google Scholar] [CrossRef] [PubMed]
- Prasad, T.N.V.K.V.; Sudhakar, P.; Sreenivasulu, Y.; Latha, P.; Munaswamy, V.; Reddy, K.R.; Sreeprasad, T.S.; Sajanlal, P.R.; Pradeep, T. Effect of nanoscale zinc oxide particles on the germination, growth and yield of peanut. J. Plant Nutr. 2012, 35, 905–927. [Google Scholar] [CrossRef]
- Zhao, C.Y.; Tan, S.X.; Xiao, X.Y.; Qiu, X.S.; Pan, J.Q.; Tang, Z.X. Effects of dietary zinc oxide nanoparticles on growth performance and antioxidative status in broilers. Biol. Trace Elem. Res. 2014, 160, 361–367. [Google Scholar] [CrossRef] [PubMed]
- Samberg, M.E.; Oldenburg, S.J.; Monteiro-Riviere, N.A. Evaluation of silver nanoparticle toxicity in skin in vivo and keratinocytes in vitro. Environ. Health Perspect. 2010, 118, 407–413. [Google Scholar] [CrossRef] [PubMed]
- Li, M.; Zhu, L.Z.; Lin, D.H. Toxicity of ZnO nanoparticles to Escherichia coli: Mechanism and the influence of medium components. Environ. Sci. Technol. 2011, 45, 1977–1983. [Google Scholar] [CrossRef] [PubMed]
- Hong, T.K.; Tripathy, N.; Son, H.J.; Ha, K.T.; Jeong, H.S.; Hahn, Y.B. A comprehensive in vitro and in vivo study of ZnO nanoparticles toxicity. J. Mater. Chem. B 2013, 1, 2985–2992. [Google Scholar] [CrossRef]
- Paek, H.J.; Lee, Y.J.; Chung, H.E.; Yoo, N.H.; Lee, J.A.; Kim, M.K.; Lee, J.K.; Jeong, J.; Choi, S.J. Modulation of the pharmacokinetics of zinc oxide nanoparticles and their fates in vivo. Nanoscale 2013, 5, 11416–11427. [Google Scholar] [CrossRef] [PubMed]
- Jo, M.R.; Chung, H.E.; Kim, H.J.; Bae, S.H.; Go, M.R.; Yu, J.; Choi, S.J. Effects of zinc oxide nanoparticle dispersants on cytotoxicity and cellular uptake. Mol. Cell. Toxicol. 2016, 12, 281–288. [Google Scholar] [CrossRef]
- Bhogale, A.; Patel, N.; Sarpotdar, P.; Mariam, J.; Dongre, P.M.; Miotello, A.; Kothari, D.C. Systematic investigation on the interaction of bovine serum albumin with ZnO nanoparticles using fluorescence spectroscopy. Colloids Surf. B 2013, 102, 257–264. [Google Scholar] [CrossRef] [PubMed]
- Lousinian, S.; Missopolinou, D.; Panayiotou, C. Fibrinogen adsorption on zinc oxide nanoparticles: A micro-differential scanning calorimetry analysis. J. Colloid Interface Sci. 2013, 395, 294–299. [Google Scholar] [CrossRef] [PubMed]
- Simsikova, M.; Antalik, M. Interaction of cytochrome c with zinc oxide nanoparticles. Colloids Surf. B 2013, 103, 630–634. [Google Scholar] [CrossRef] [PubMed]
- Cao, Y.; Li, J.; Liu, F.; Li, X.; Jiang, Q.; Cheng, S.; Gu, Y. Consideration of interaction between nanoparticles and food components for the safety assessment of nanoparticles following oral exposure: A review. Environ. Toxicol. Pharmacol. 2016, 46, 206–210. [Google Scholar] [CrossRef] [PubMed]
- Wang, Y.; Yuan, L.; Yao, C.; Ding, L.; Li, C.; Fang, J.; Sui, K.; Liu, Y.; Wu, M. A combined toxicity study of zinc oxide nanoparticles and vitamin C in food additives. Nanoscale 2014, 6, 15333–15342. [Google Scholar] [CrossRef] [PubMed]
- Go, M.R.; Bae, S.H.; Kim, H.J.; Yu, J.; Choi, S.J. Interactions between food additive silica nanoparticles and food matrices. Front. Microbiol. 2017, 8. [Google Scholar] [CrossRef] [PubMed]
- Jo, M.R.; Yu, J.; Kim, H.J.; Song, J.H.; Kim, K.M.; Oh, J.M.; Choi, S.J. Titanium dioxide nanoparticle-biomolecule interactions influence oral absorption. Nanomaterials 2016, 6, 225. [Google Scholar] [CrossRef] [PubMed]
- Lee, J.A.; Kim, M.K.; Song, J.H.; Jo, M.R.; Yu, J.; Kim, K.M.; Kim, Y.R.; Oh, J.M.; Choi, S.J. Biokinetics of food additive silica nanoparticles and their interactions with food components. Colloids Surf. B 2017, 150, 384–392. [Google Scholar] [CrossRef] [PubMed]
- Yu, J.; Kim, H.J.; Go, M.R.; Bae, S.H.; Choi, S.J. ZnO interactions with biomatrices: Effect of particle size on ZnO-protein corona. Nanomaterials 2017, 7. [Google Scholar] [CrossRef] [PubMed]
- Chung, S.J.; Leonard, J.P.; Nettleship, I.; Lee, J.K.; Soong, Y.; Martello, D.V.; Chyu, M.K. Characterization of ZnO nanoparticle suspension in water: Effectiveness of ultrasonic dispersion. Powder Technol. 2009, 194, 75–80. [Google Scholar] [CrossRef]
- Churchman, A.H.; Wallace, R.; Milne, S.J.; Brown, A.P.; Brydson, R.; Beales, P.A. Serum albumin enhances the membrane activity of ZnO nanoparticles. Chem. Commun. 2013, 49, 4172–4174. [Google Scholar] [CrossRef] [PubMed]
- Anders, C.B.; Chess, J.J.; Wingett, D.G.; Punnoose, A. Serum proteins enhance dispersion stability and influence the cytotoxicity and dosimetry of ZnO nanoparticles in suspension and adherent cancer cell models. Nanoscale Res. Lett. 2015, 10, 448. [Google Scholar] [CrossRef] [PubMed]
- Schilling, C.H.; Sikora, M.; Tomasik, P.; Li, C.; Garcia, V. Rheology of alumina–nanoparticle suspensions: Effects of lower saccharides and sugar alcohols. J. Eur. Ceram. Soc. 2002, 22, 917–921. [Google Scholar] [CrossRef]
- Li, C.; Akinc, M. Role of bound water on the viscosity of nanometric alumina suspensions. J. Am. Ceram. Soc. 2005, 88, 1448–1454. [Google Scholar] [CrossRef]
- Falkowski, P.; Bednarek, P.; Danelska, A.; Mizerski, T.; Szafran, M. Application of monosaccharides derivatives in colloidal processing of aluminum oxide. J. Eur. Ceram. Soc. 2010, 30, 2805–2811. [Google Scholar] [CrossRef]
- Montero, M.; Molina, T.; Szafran, M.; Moreno, R.; Nieto, M.I. Alumina porous nanomaterials obtained by colloidal processing using D-fructose as dispersant and porosity promoter. Ceram. Int. 2012, 38, 2779–2784. [Google Scholar] [CrossRef]
- Buford, M.C.; Hamilton, R.F.; Holian, A. A comparison of dispersing media for various engineered carbon nanoparticles. Part. Fibre Toxicol. 2007, 4. [Google Scholar] [CrossRef] [PubMed]
- Bihari, P.; Vippola, M.; Schultes, S.; Praetner, M.; Khandoga, A.G.; Reichel, C.A.; Coester, C.; Tuomi, T.; Rehberg, M.; Krombach, F. Optimized dispersion of nanoparticles for biological in vitro and in vivo studies. Part. Fibre Toxicol. 2008, 5. [Google Scholar] [CrossRef] [PubMed]
- Tantra, R.; Tompkins, J.; Quincey, P. Characterisation of the de-agglomeration effects of bovine serum albumin on nanoparticles in aqueous suspension. Colloids Surf. B 2010, 75, 275–281. [Google Scholar] [CrossRef] [PubMed]
- Brown, D.M.; Varet, J.; Johnston, H.; Chrystie, A.; Stone, V. Silica nanoparticles and biological dispersants: Genotoxic effects on A549 lung epithelial cells. J. Nanopart. Res. 2015, 17. [Google Scholar] [CrossRef]
- Sasidharan, N.P.; Chandran, P.; Khan, S.S. Interaction of colloidal zinc oxide nanoparticles with bovine serum albumin and its adsorption isotherms and kinetics. Colloids Surf. B 2013, 102, 195–201. [Google Scholar] [CrossRef] [PubMed]
- Kim, M.K.; Lee, J.A.; Jo, M.R.; Choi, S.J. Bioavailability of silica, titanium dioxide, and zinc oxide nanoparticles in rats. J. Nanosci. Nanotechnol. 2016, 16, 6580–6586. [Google Scholar] [CrossRef] [PubMed]
- Lee, J.A.; Kim, M.K.; Kim, H.M.; Lee, J.K.; Jeong, J.; Kim, Y.R.; Oh, J.M.; Choi, S.J. The fate of calcium carbonate nanoparticles administered by oral route: Absorption and their interaction with biological matrices. Int. J. Nanomed. 2015, 10, 2237–2293. [Google Scholar]
- McClements, D.J.; Xiao, H.; Demokritou, P. Physicochemical and colloidal aspects of food matrix effects on gastrointestinal fate of ingested inorganic nanoparticles. Adv. Colloid Interface Sci. 2017, 246, 165–180. [Google Scholar] [CrossRef] [PubMed]
- Murdock, R.C.; Braydich-Stolle, L.; Schrand, A.M.; Schlager, J.J.; Hussain, S.M. Characterization of nanomaterial dispersion in solution prior to in vitro exposure using dynamic light scattering technique. Toxicol. Sci. 2008, 101, 239–253. [Google Scholar] [CrossRef] [PubMed]
- Ji, Z.; Jin, X.; George, S.; Xia, T.; Meng, H.; Wang, X.; Suarez, E.; Zhang, H.; Hoek, E.M.V.; Godwin, H.; et al. Dispersion and stability optimization of TiO2 nanoparticles in cell culture media. Environ. Sci. Technol. 2010, 44, 7309–7314. [Google Scholar] [CrossRef] [PubMed]
- Kim, J.S.; Song, K.S.; Lee, J.H.; Yu, I.J. Evaluation of biocompatible dispersants for carbon nanotube toxicity tests. Arch. Toxicol. 2011, 85, 1499–1508. [Google Scholar] [CrossRef] [PubMed]
- Wiogo, H.T.R.; Lim, M.; Bulmus, V.; Gutierrez, L.; Woodward, R.C.; Amal, R. Insight into serum protein interactions with functionalized magnetic nanoparticles in biological media. Langmuir 2012, 28, 4346–4356. [Google Scholar] [CrossRef] [PubMed]
- Yang, Z.; Miao, Y.; Li, W.; Song, G.; Xiao, M.; Liang, X.; Yang, Y. Synthesis of uniform platinum nanoparticles using glucose as dispersant. Nanosci. Nanotechnol. Lett. 2014, 6, 592–595. [Google Scholar] [CrossRef]
- Des Rieux, A.; Fievez, V.; Theate, I.; Mast, J.; Preat, V.; Schneider, Y.J. An improved in vitro model of human intestinal follicle-associated epithelium to study nanoparticle transport by M cells. Eur. J. Pharm. Sci. 2007, 30, 380–391. [Google Scholar] [CrossRef] [PubMed]


| Biokinetic Parameters | DW | 10% Honey | 5% Sugar Mixture | 5% Fructose | 5% Glucose |
|---|---|---|---|---|---|
| Cmax (mg/L) | 37.7 ± 2.2 a | 37.5 ± 6.7 a | 46.6 ± 3.4 b | 44.0 ± 6.9 a,b | 40.2 ± 1.2 a,b |
| Tmax (h) | 1.8 ± 2.0 a | 1.0 ± 0.0 a | 1.3 ± 0.5 a | 1.0 ± 0.0 a | 5.3 ± 1.0 b |
| AUC (h × mg/L) | 328.8 ± 27.1 a,b | 276.6 ± 18.4 a | 364.1 ± 26.5 b | 430.4 ± 38.9 c | 581.1 ± 20.8 d |
| T1/2 | 6.3 ± 0.5 a | 6.0 ± 0.5 a | 5.9 ± 0.9 a | 7.4 ± 0.4 b | 7.8 ± 0.3 b |
| MRT (h) | 8.5 ± 1.1 a | 8.0 ± 1.0 a | 8.3 ± 0.6 a | 15.7 ± 0.7 b | 16.6 ± 0.4 b |
| Absorption (%) | 7.6 ± 0.6 a,b | 6.4 ± 0.4 a | 8.2 ± 0.5 b | 9.6 ± 0.8 c | 13.4 ± 0.5 d |
© 2018 by the authors. Licensee MDPI, Basel, Switzerland. This article is an open access article distributed under the terms and conditions of the Creative Commons Attribution (CC BY) license (http://creativecommons.org/licenses/by/4.0/).
Share and Cite
Go, M.-R.; Yu, J.; Bae, S.-H.; Kim, H.-J.; Choi, S.-J. Effects of Interactions between ZnO Nanoparticles and Saccharides on Biological Responses. Int. J. Mol. Sci. 2018, 19, 486. https://doi.org/10.3390/ijms19020486
Go M-R, Yu J, Bae S-H, Kim H-J, Choi S-J. Effects of Interactions between ZnO Nanoparticles and Saccharides on Biological Responses. International Journal of Molecular Sciences. 2018; 19(2):486. https://doi.org/10.3390/ijms19020486
Chicago/Turabian StyleGo, Mi-Ran, Jin Yu, Song-Hwa Bae, Hyeon-Jin Kim, and Soo-Jin Choi. 2018. "Effects of Interactions between ZnO Nanoparticles and Saccharides on Biological Responses" International Journal of Molecular Sciences 19, no. 2: 486. https://doi.org/10.3390/ijms19020486
APA StyleGo, M.-R., Yu, J., Bae, S.-H., Kim, H.-J., & Choi, S.-J. (2018). Effects of Interactions between ZnO Nanoparticles and Saccharides on Biological Responses. International Journal of Molecular Sciences, 19(2), 486. https://doi.org/10.3390/ijms19020486