Article

KRAS and MAPK1 Gene Amplification in Type II Ovarian Carcinomas

1
Departments of Obstetrics and Gynecology, Shimane University School of Medicine, Enyacho 89-1, Izumo, Shimane 6938501, Japan
2
Department of Biocehmistory, Shimane University School of Medicine, Izumo, Shimane 6938501, Japan
3
Department of Organ Pathology, Shimane University School of Medicine, Izumo, Shimane 6938501, Japan
*
Author to whom correspondence should be addressed.
Int. J. Mol. Sci. 2013, 14(7), 13748-13762; https://doi.org/10.3390/ijms140713748
Submission received: 1 February 2013 / Revised: 8 June 2013 / Accepted: 21 June 2013 / Published: 2 July 2013
(This article belongs to the Special Issue Genes and Pathways in the Pathogenesis of Ovarian Cancer)

Abstract

:
In this study, we examined the clinical significance of KRAS and MAPK1 amplification and assessed whether these amplified genes were potential therapeutic targets in type II ovarian carcinoma. Using fluorescence in situ hybridization, immunohistochemistry, and retrospectively collected clinical data, KRAS and MAPK1 amplifications were identified in 9 (13.2%) and 5 (7.4%) of 68 type II ovarian carcinoma tissue samples, respectively. Interestingly, co-amplification of KRAS and MAPK1 seemed to be absent in the type II ovarian carcinomas tested, except one case. Active phospho-ERK1/2 was identified in 26 (38.2%) out of 68 type II ovarian carcinomas and did not correlate with KRAS or MAPK1 amplification. There was no significant relationship between KRAS amplification and overall or progression-free survival in patients with type II ovarian carcinoma. However, patients with MAPK1 amplification had significantly poorer progression-free survival than patients without MAPK1 amplification. Moreover, type II ovarian carcinoma cells with concomitant KRAS amplification and mutation exhibited dramatic growth reduction following treatment with the MEK inhibitor PD0325901. These findings indicate that KRAS/MAPK1 amplification is critical for the growth of a subset of type II ovarian carcinomas. Additionally, RAS/RAF/MEK/ERK pathway-targeted therapy may benefit selected patients with type II ovarian carcinoma harboring KRAS/MAPK1 amplifications.

1. Introduction

Ovarian carcinoma is the most lethal gynecological malignancy in American [1] and Japanese women. Among ovarian carcinomas, high-grade serous ovarian carcinoma mostly presents at an advanced stage and has a low overall survival rate. Standard treatment involves aggressive cytoreductive surgery followed by platinum- and taxane-based chemotherapy [2,3]. Although initial response rates to platinum-based chemotherapy exceed 75%, most tumors will eventually recur and become refractory to treatment, with a median survival of less than five years [2,4]. Although there are well-established surgical and chemotherapeutic treatments for ovarian cancer, there is significant opportunity to develop drugs targeting specific molecular pathways and to reduce rates of metastasis or relapse. Drugs of this type would be particularly useful for recurrent disease that shows chemoresistance. Thus, there is an initial, preclinical need to improve our understanding of the molecular pathways underlying ovarian carcinogenesis.
Recent morphological, immunohistochemical, and molecular genetic studies have led to the development of a new paradigm for the pathogenesis and origin of epithelial ovarian cancer based on a dualistic model of carcinogenesis that divides epithelial ovarian cancer into two broad categories, designated as types I and II. Type I tumors include low-grade serous, low-grade endometrioid, clear cell, and mucinous carcinomas; these tumors develop in a stepwise fashion from well-established precursor lesions, such as borderline tumors and endometriosis. Type I tumors are relatively genetically stable and typically display a variety of somatic mutations in KRAS, BRAF, PTEN, PIK3CA, CTNNB1, and ARID1A, but very rarely P53 [5]. Type II tumors comprise high-grade serous, high-grade endometrioid, malignant mixed mesodermal tumors (carcinosarcomas), and undifferentiated carcinomas. They are aggressive, present at advanced stages, and have a very high frequency of TP53 mutations, but rarely harbor the mutations detected in type I tumors [5].
Recent genome-wide analysis by TCGA, single nucleotide polymorphism arrays identified KRAS and MAPK1 as two of the most frequently amplified genes in high-grade serous ovarian carcinomas with the prototypic type in type II ovarian carcinomas [6]. Gene amplification represents one of the molecular genetic hallmarks of human cancer. Elucidating the molecular mechanisms of how amplified genes initiate and maintain malignant phenotypes and propel tumor progression is fundamental to understanding the molecular etiology of human cancer and its therapeutic implications. Gene amplification is an important mechanism that allows cancer cells to increase expression of driver genes, such as oncogenes, that are involved in growth regulation and genes responsible for drug resistance. Therefore, detection of gene amplification in tumors may be of diagnostic, prognostic, and/or therapeutic relevance for patient management.
Based on the above findings, we hypothesized that KRAS or MAPK1 amplification may play an important role in type II ovarian carcinoma progression and that amplification may correlate more strongly with clinical parameters. Furthermore, type II ovarian carcinomas with KRAS or MAPK1 amplification may be sensitive to a potential targeted therapeutic agent. To test this hypothesis, we undertook the current study to assess gene copy numbers of KRAS or MAPK1 and to evaluate any prognostic significance in patients with type II ovarian carcinoma. In addition, we compared phenotypes in cultured type II ovarian carcinoma cell lines with various KRAS or MAPK1 copy numbers after treatment using a selective MEK inhibitor.

2. Results

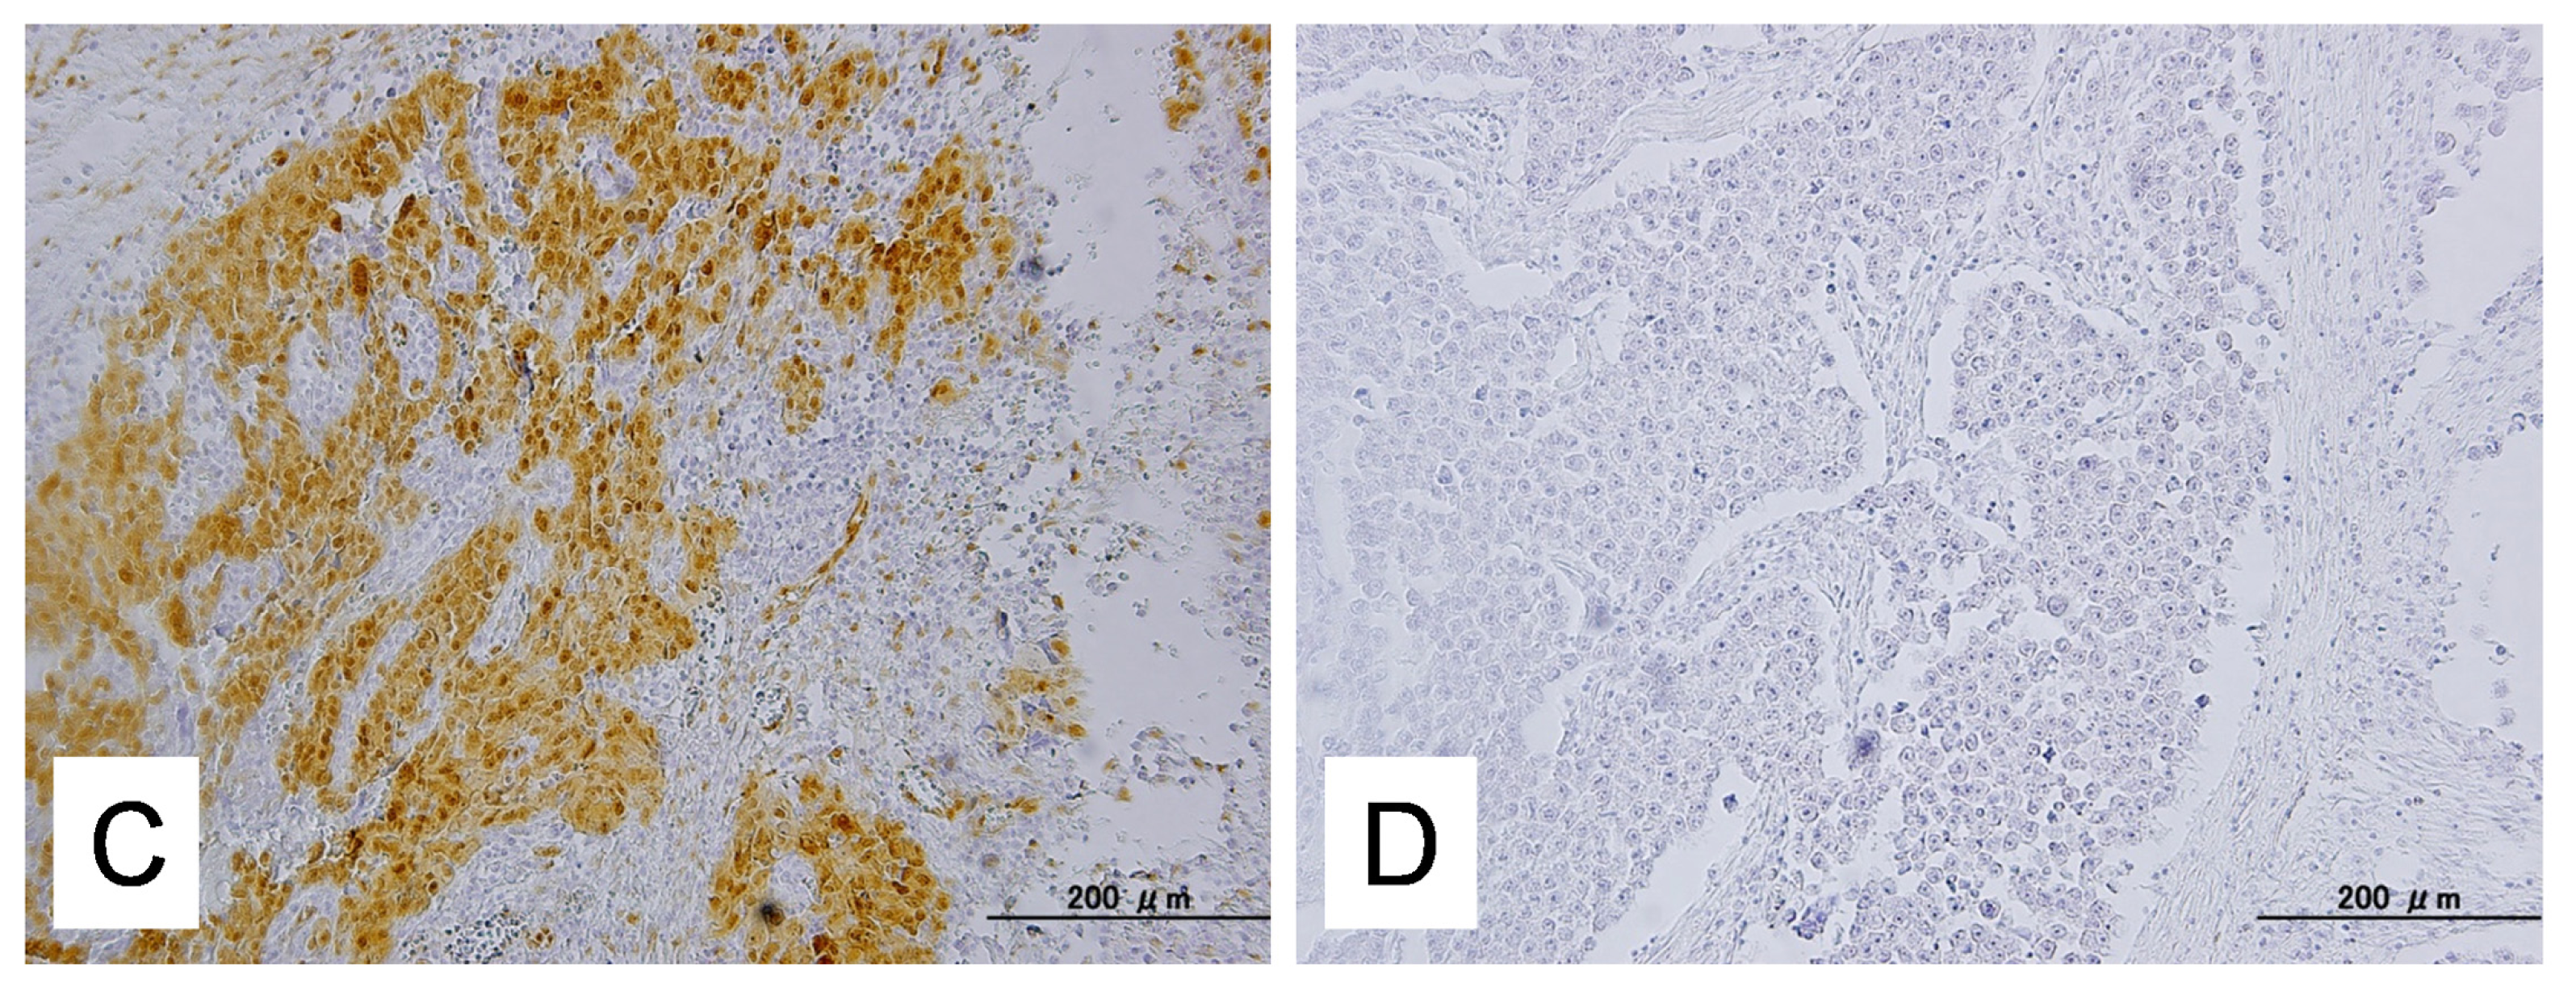
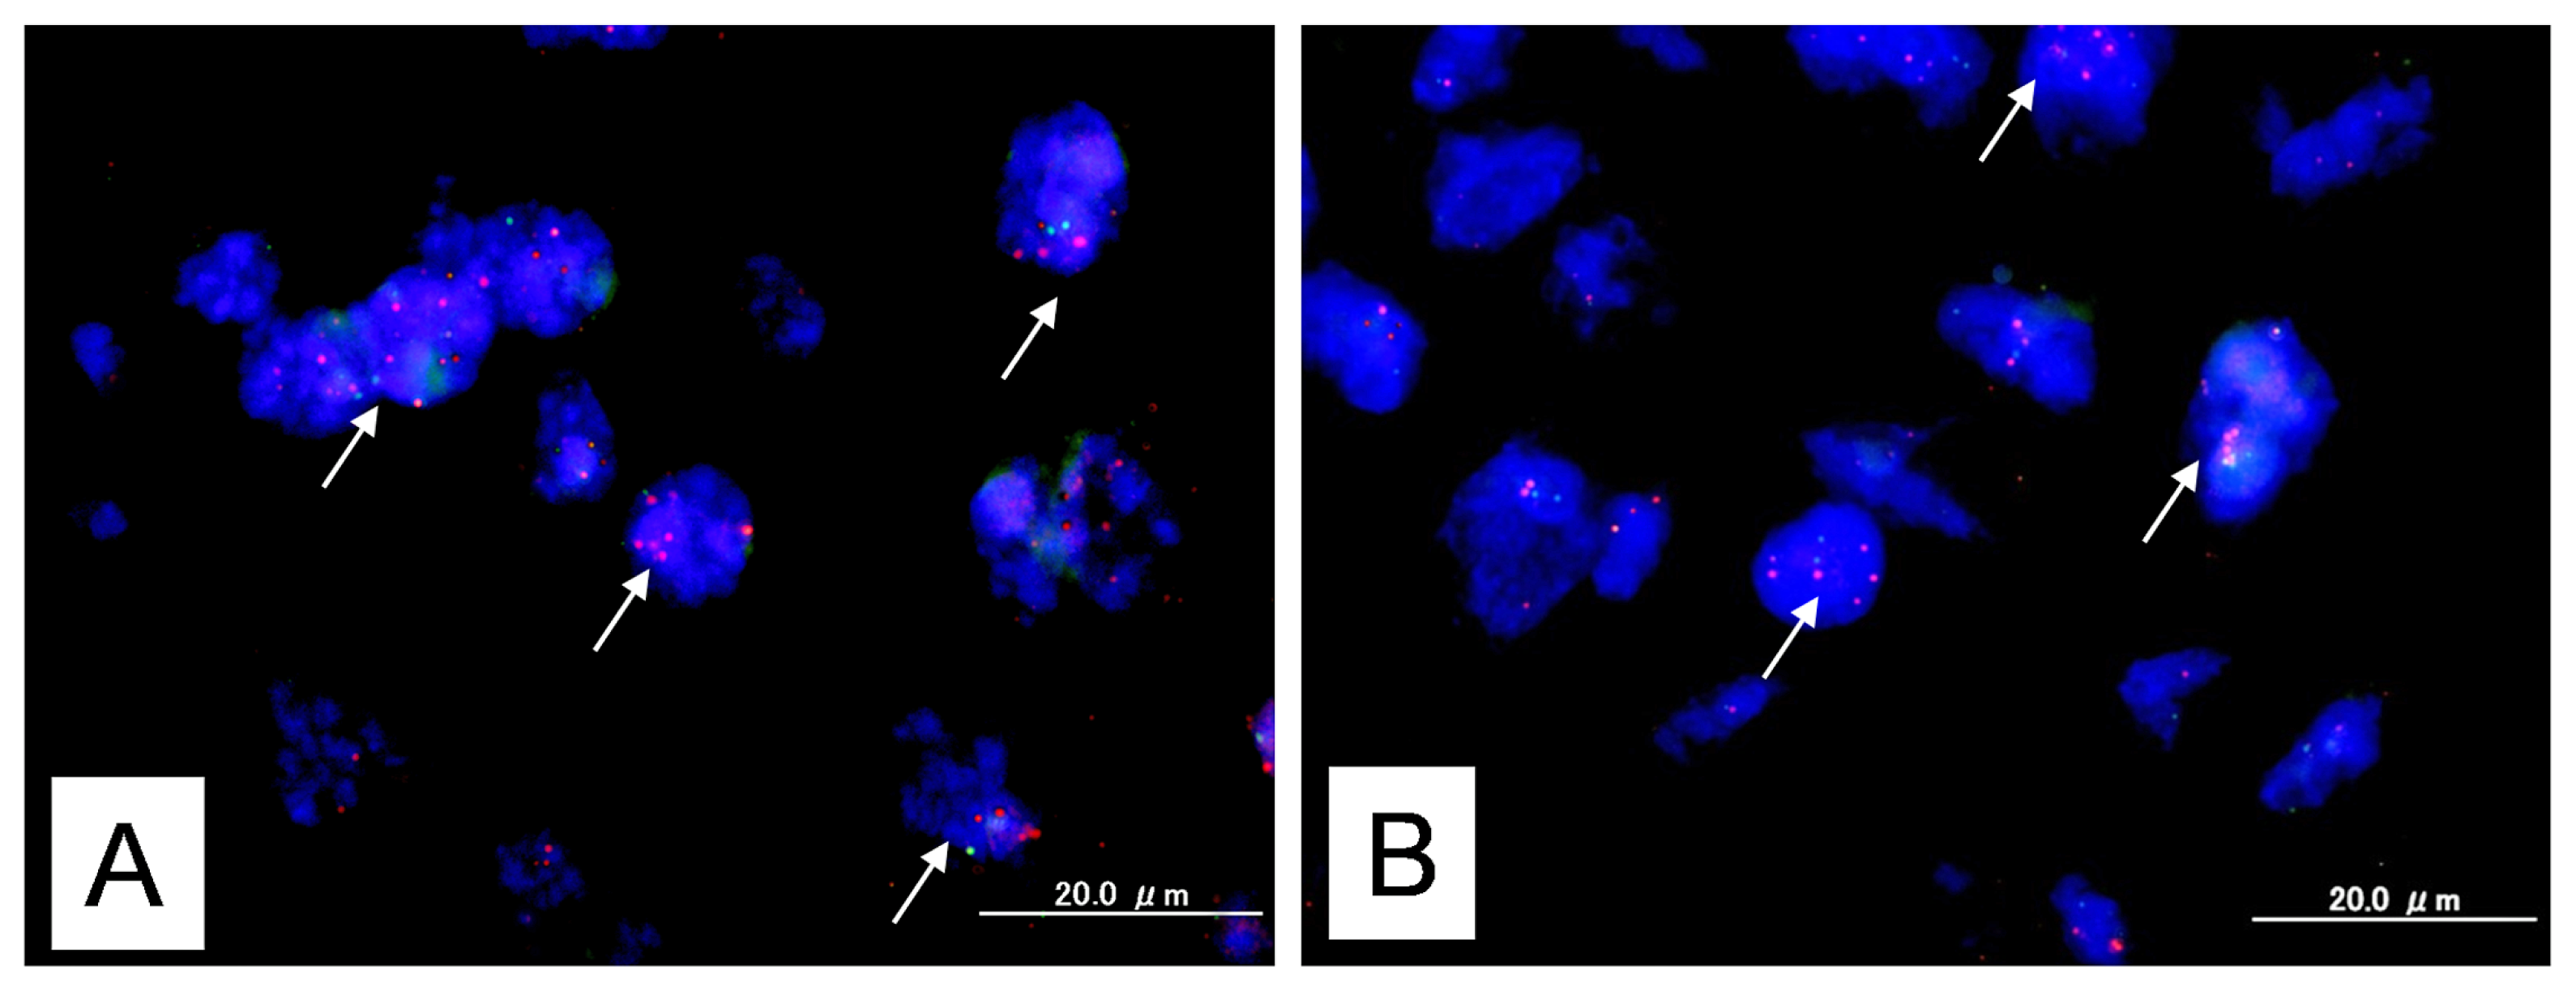
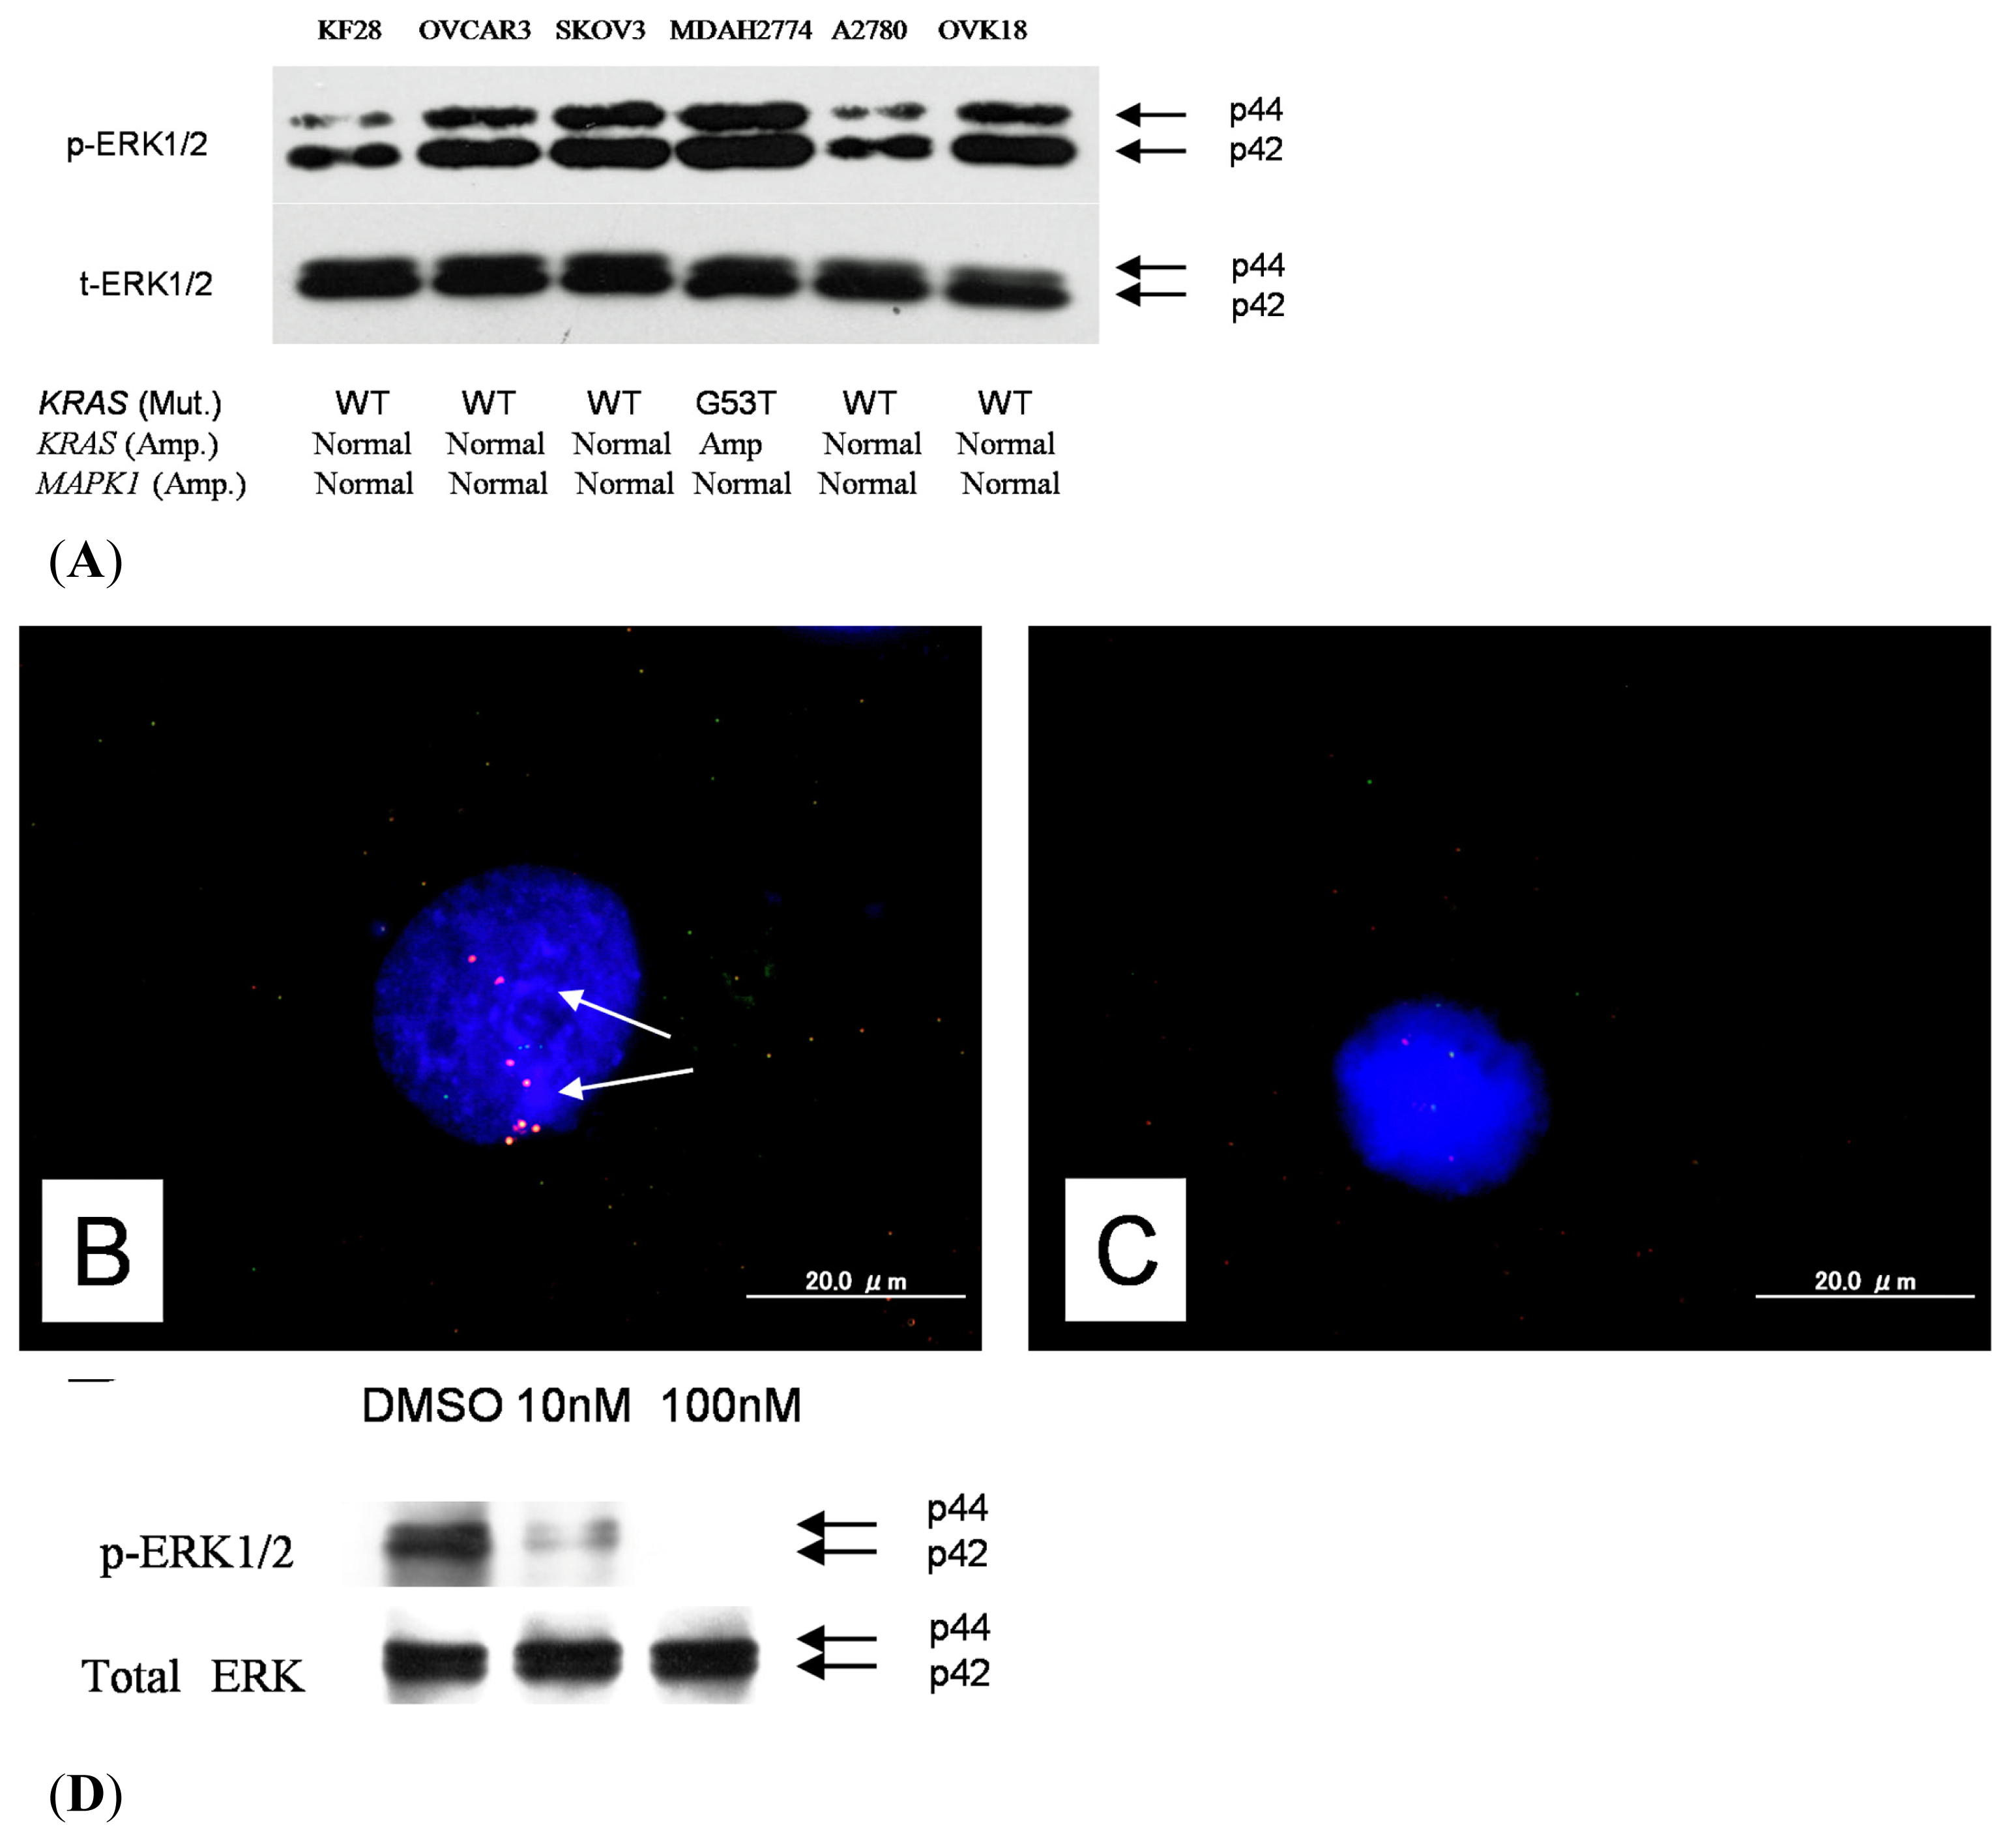
2.1. Identification of KRAS or MAPK1 Amplification and Correlation with p-ERK Immunostaining

KRAS amplification was identified in 9 (13.2%) of 68 type II ovarian carcinoma tissue samples, while MAPK1 amplification was identified in 5 (7.4%) of 68 type II ovarian carcinoma tissue samples (Figure 1). Interestingly, co-amplification of KRAS and MAPK1 almost absent in the tested type II ovarian carcinomas, except one case. The immunoreactivity of active p-ERK1/2 was detected in both the nucleus and the cytoplasm of the tumor cells (Figure 1). This is consistent with an earlier report [7,8]. Active p-ERK1/2 was identified in 26 (38.2%) of 68 high-grade serous ovarian carcinomas. Amplification of KRAS or MAPK1 did not correlate with p-ERK immunoreactivity (Table 1).

2.2. Relationship between KRAS or MAPK1 Amplification or p-ERK1/2 Expression and Clinicopathological Factors

Patients were stratified into two groups depending on the amplification status of KRAS or MAPK1. Patients were also stratified into two groups depending on the p-ERK1/2 expression. The relationships between KRAS or MAPK1 amplification or p-ERK1/2 expression and clinicopathological factors are shown in Table 2. There was no significant correlation between KRAS or MAPK1 amplification or p-ERK1/2 expression and the patient age, FIGO stage, or status of residual disease (Table 2).

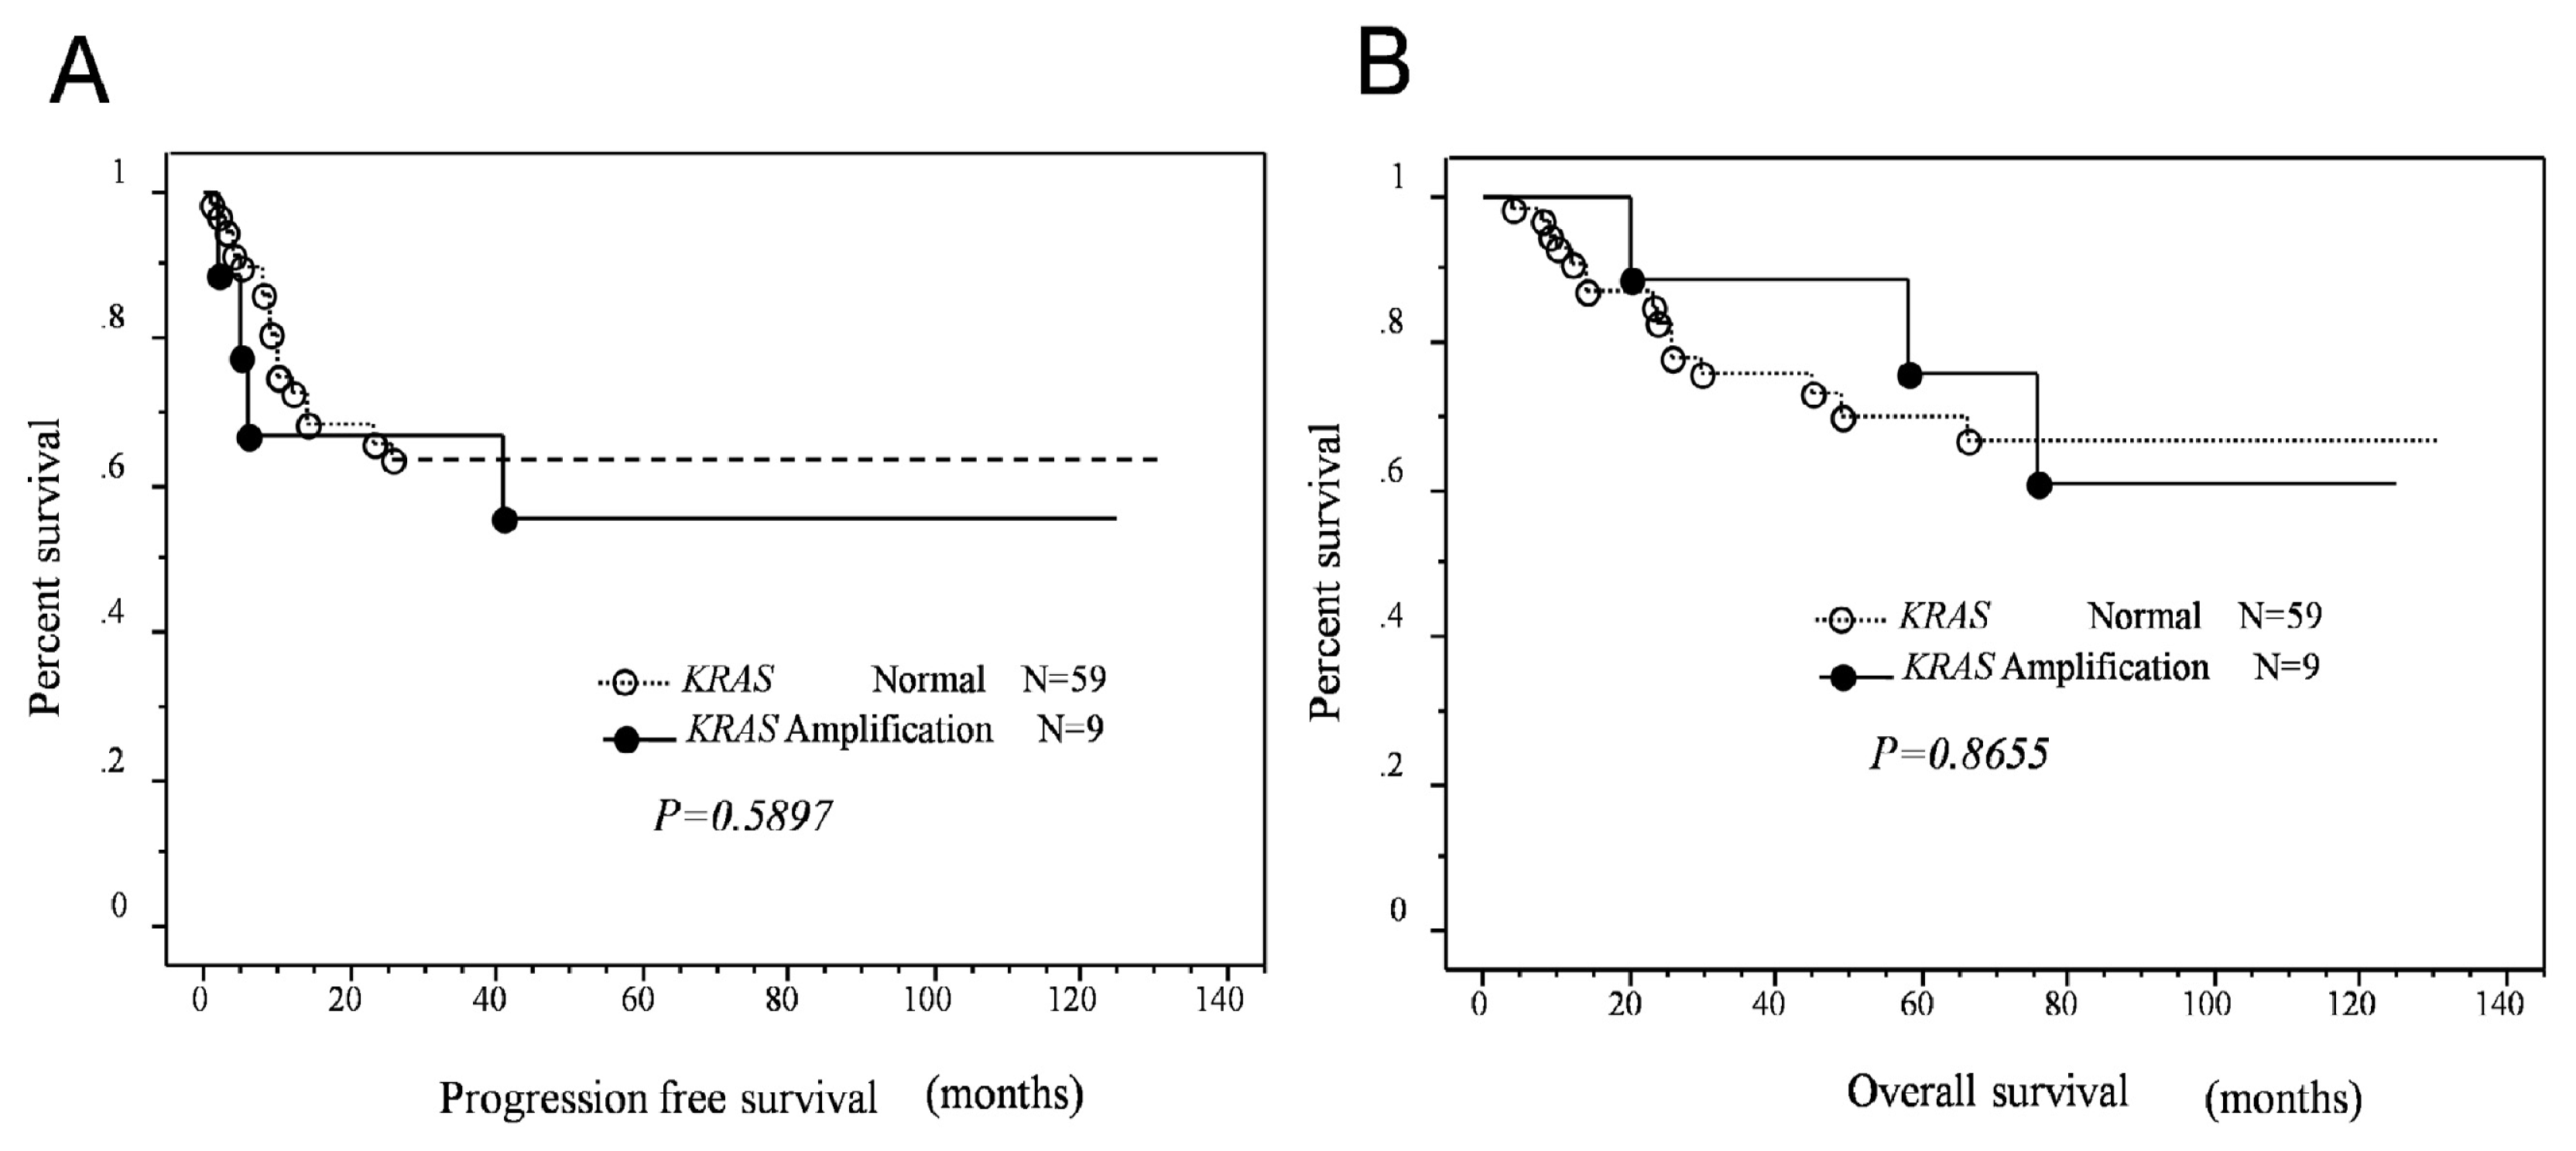
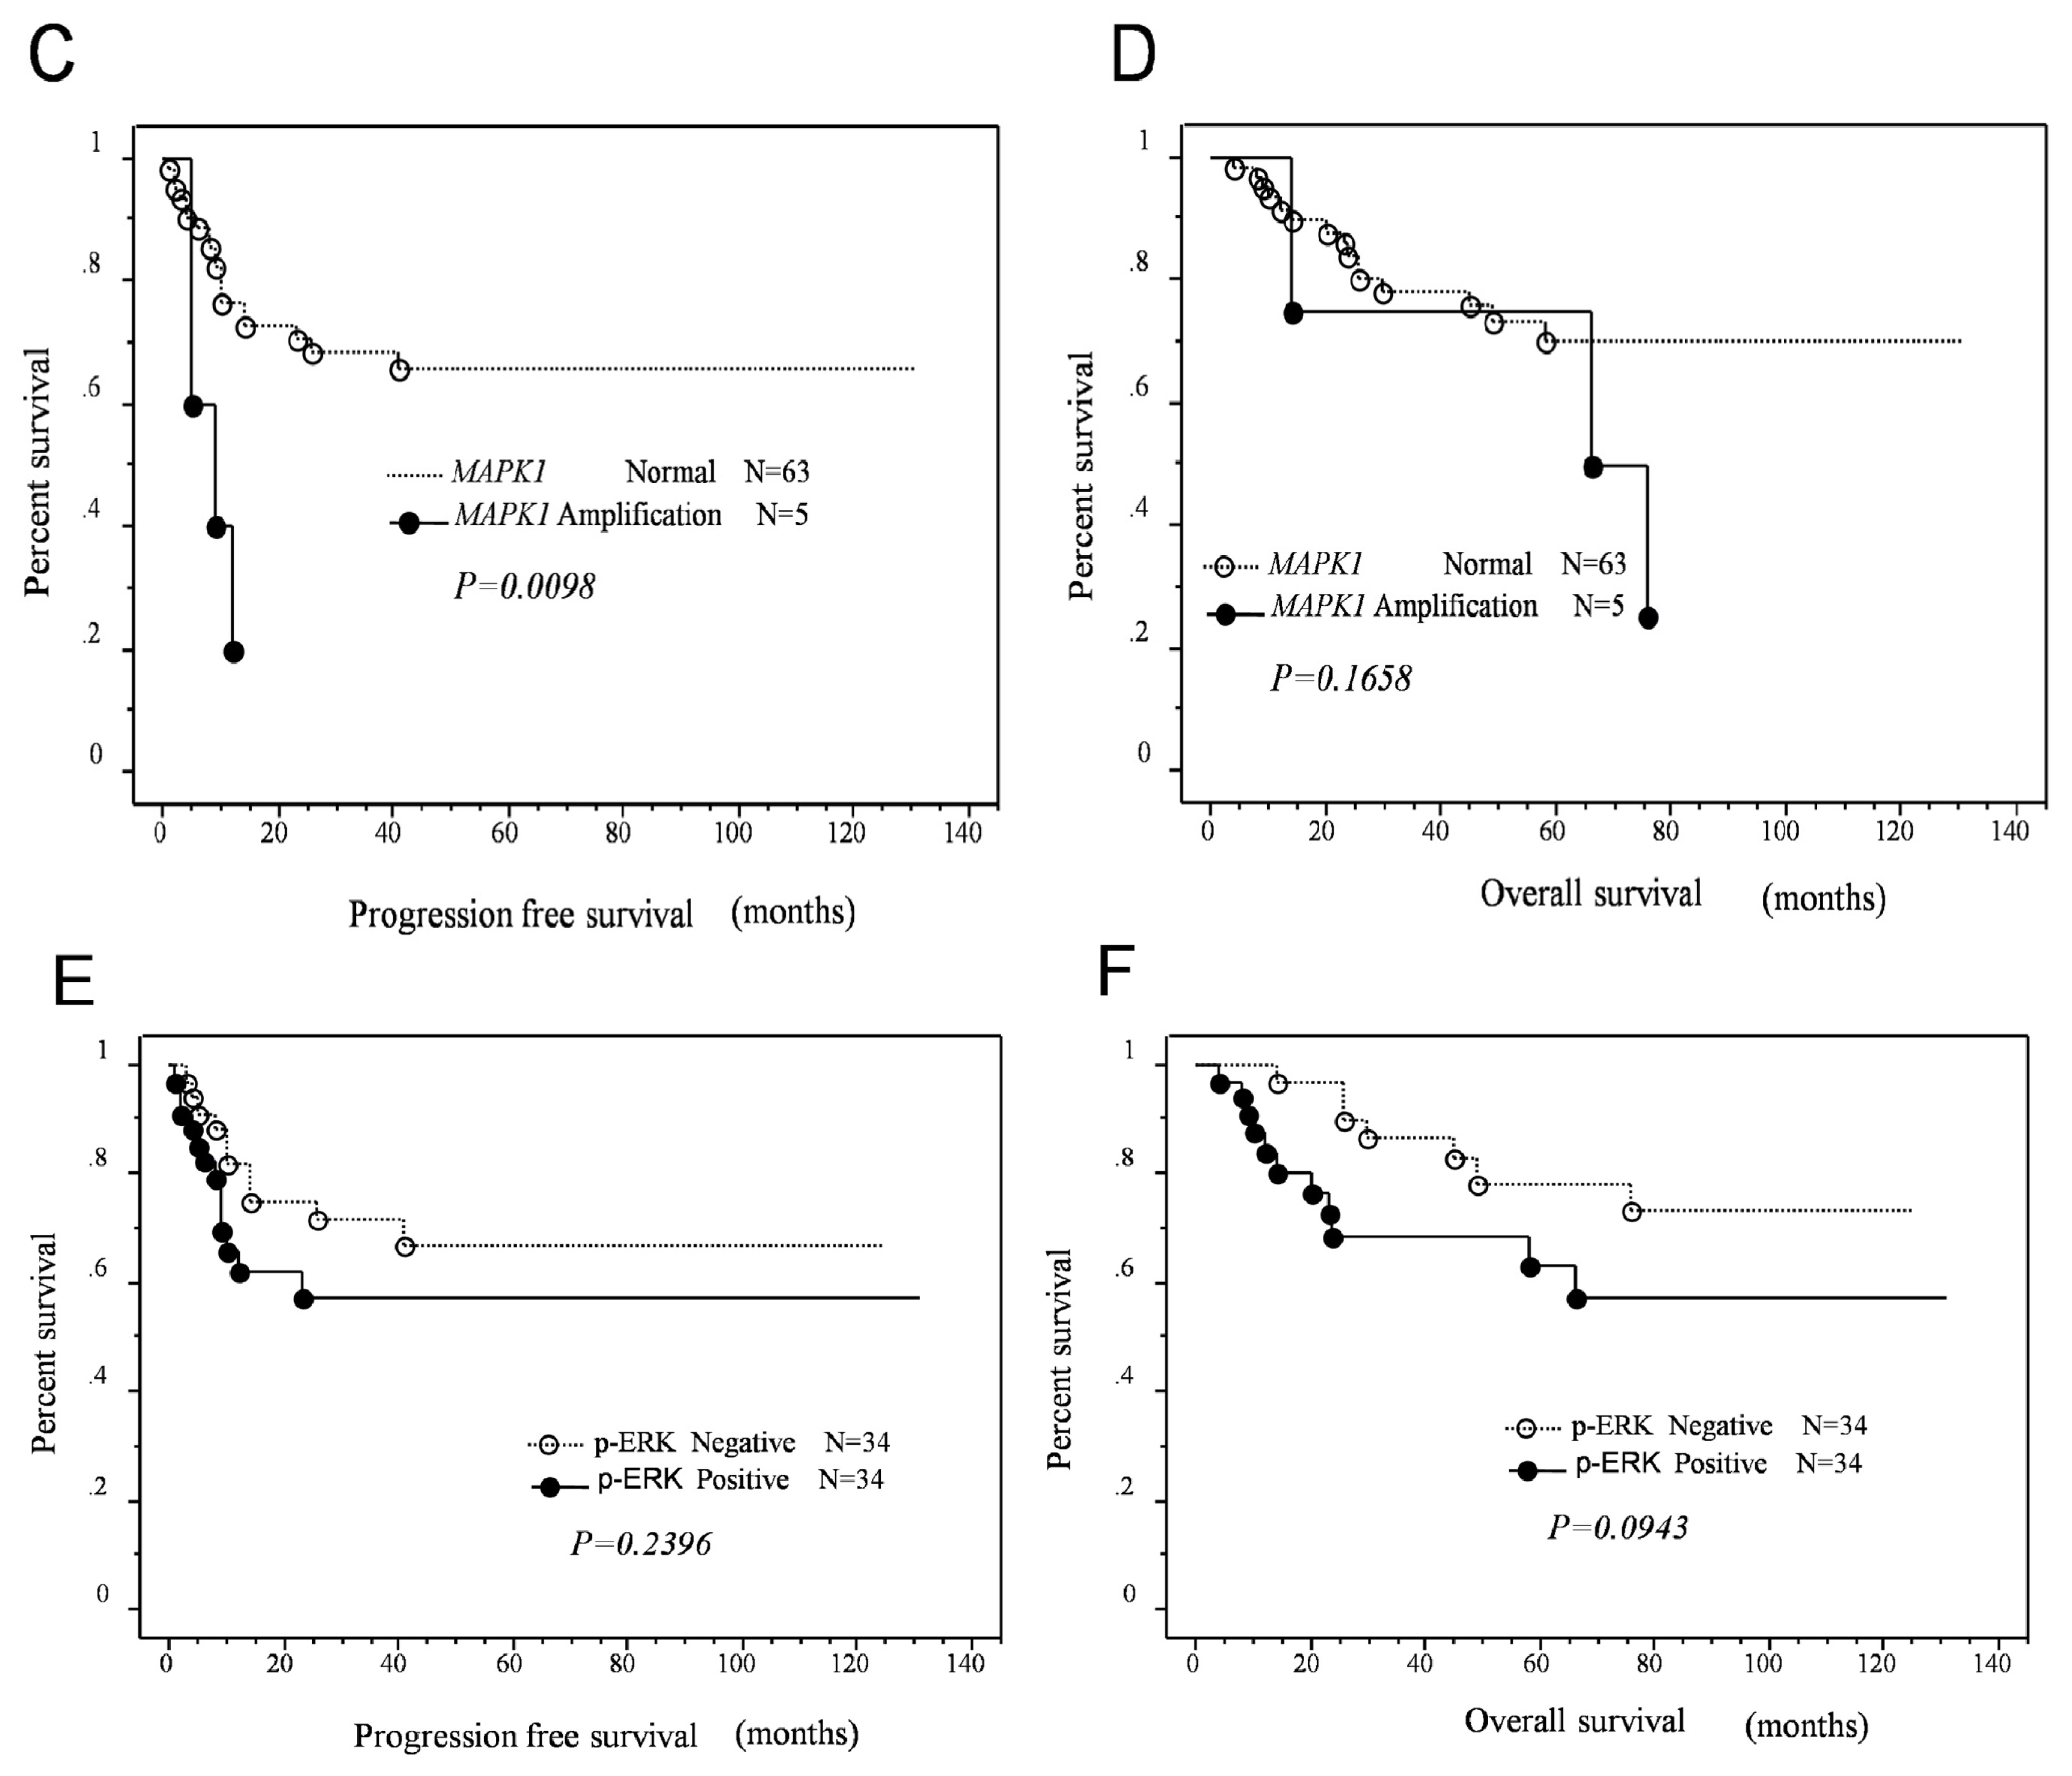
2.3. Effects of KRAS or MAPK1 Amplification and p-ERK1/2 Status on the Prognosis of Type II Ovarian Carcinomas

Next, we examined the prognostic effects of KRAS or MAPK1 amplification and p-ERK1/2 expression. Kaplan-Meier estimates of progression-free and overall survival are plotted in Figure 2. There was no significant relationship between KRAS amplification and overall or progression-free survival in patients with type II ovarian carcinoma (p = 0.2460, p = 0.9339, respectively; Figure 2). Patients with MAPK1 amplification tended to have a poor overall survival; however, the difference was not statistically significant. In contrast, patients with MAPK1 amplifications had significantly poorer progression-free survival than patients without MAPK1 amplification.
Univariate analysis demonstrated that FIGO stage III–IV (p = 0.002; log-rank test), patient age (>60 years; p = 0.049; log-rank test), residual tumor ≥1 cm (p < 0.0001; log-rank test), and MAPK1 amplification (p = 0.0098; log-rank test) correlated with shorter progression-free survival. When data were stratified for multivariate analysis, MAPK1 amplification, patient age, and residual tumor ≥1 cm remained significantly associated with shorter progression-free survival (p = 0.029, p = 0.044, p = 0.003, respectively; Table 3). Patients with positive p-ERK expression in type II ovarian carcinomas tended to have a poor progression-free/overall survival; however, the difference was not statistically significant (p = 0.127, p = 0.087, respectively; Figure 2).

2.4. Identification of KRAS Mutations

Out of the 68 samples examined, 51 were available for mutation analysis. Somatic mutations in KRAS were identified in 3 (5.8%) of 51 type II ovarian carcinomas. All KRAS mutations were located at codon 12. No cases with concomitant KRAS or MAPK1 amplification and KRAS mutation were identified. We previously reported the KRAS mutation profiles of type II ovarian carcinoma cell lines [8]; these data were used for subsequent in vitro analysis.

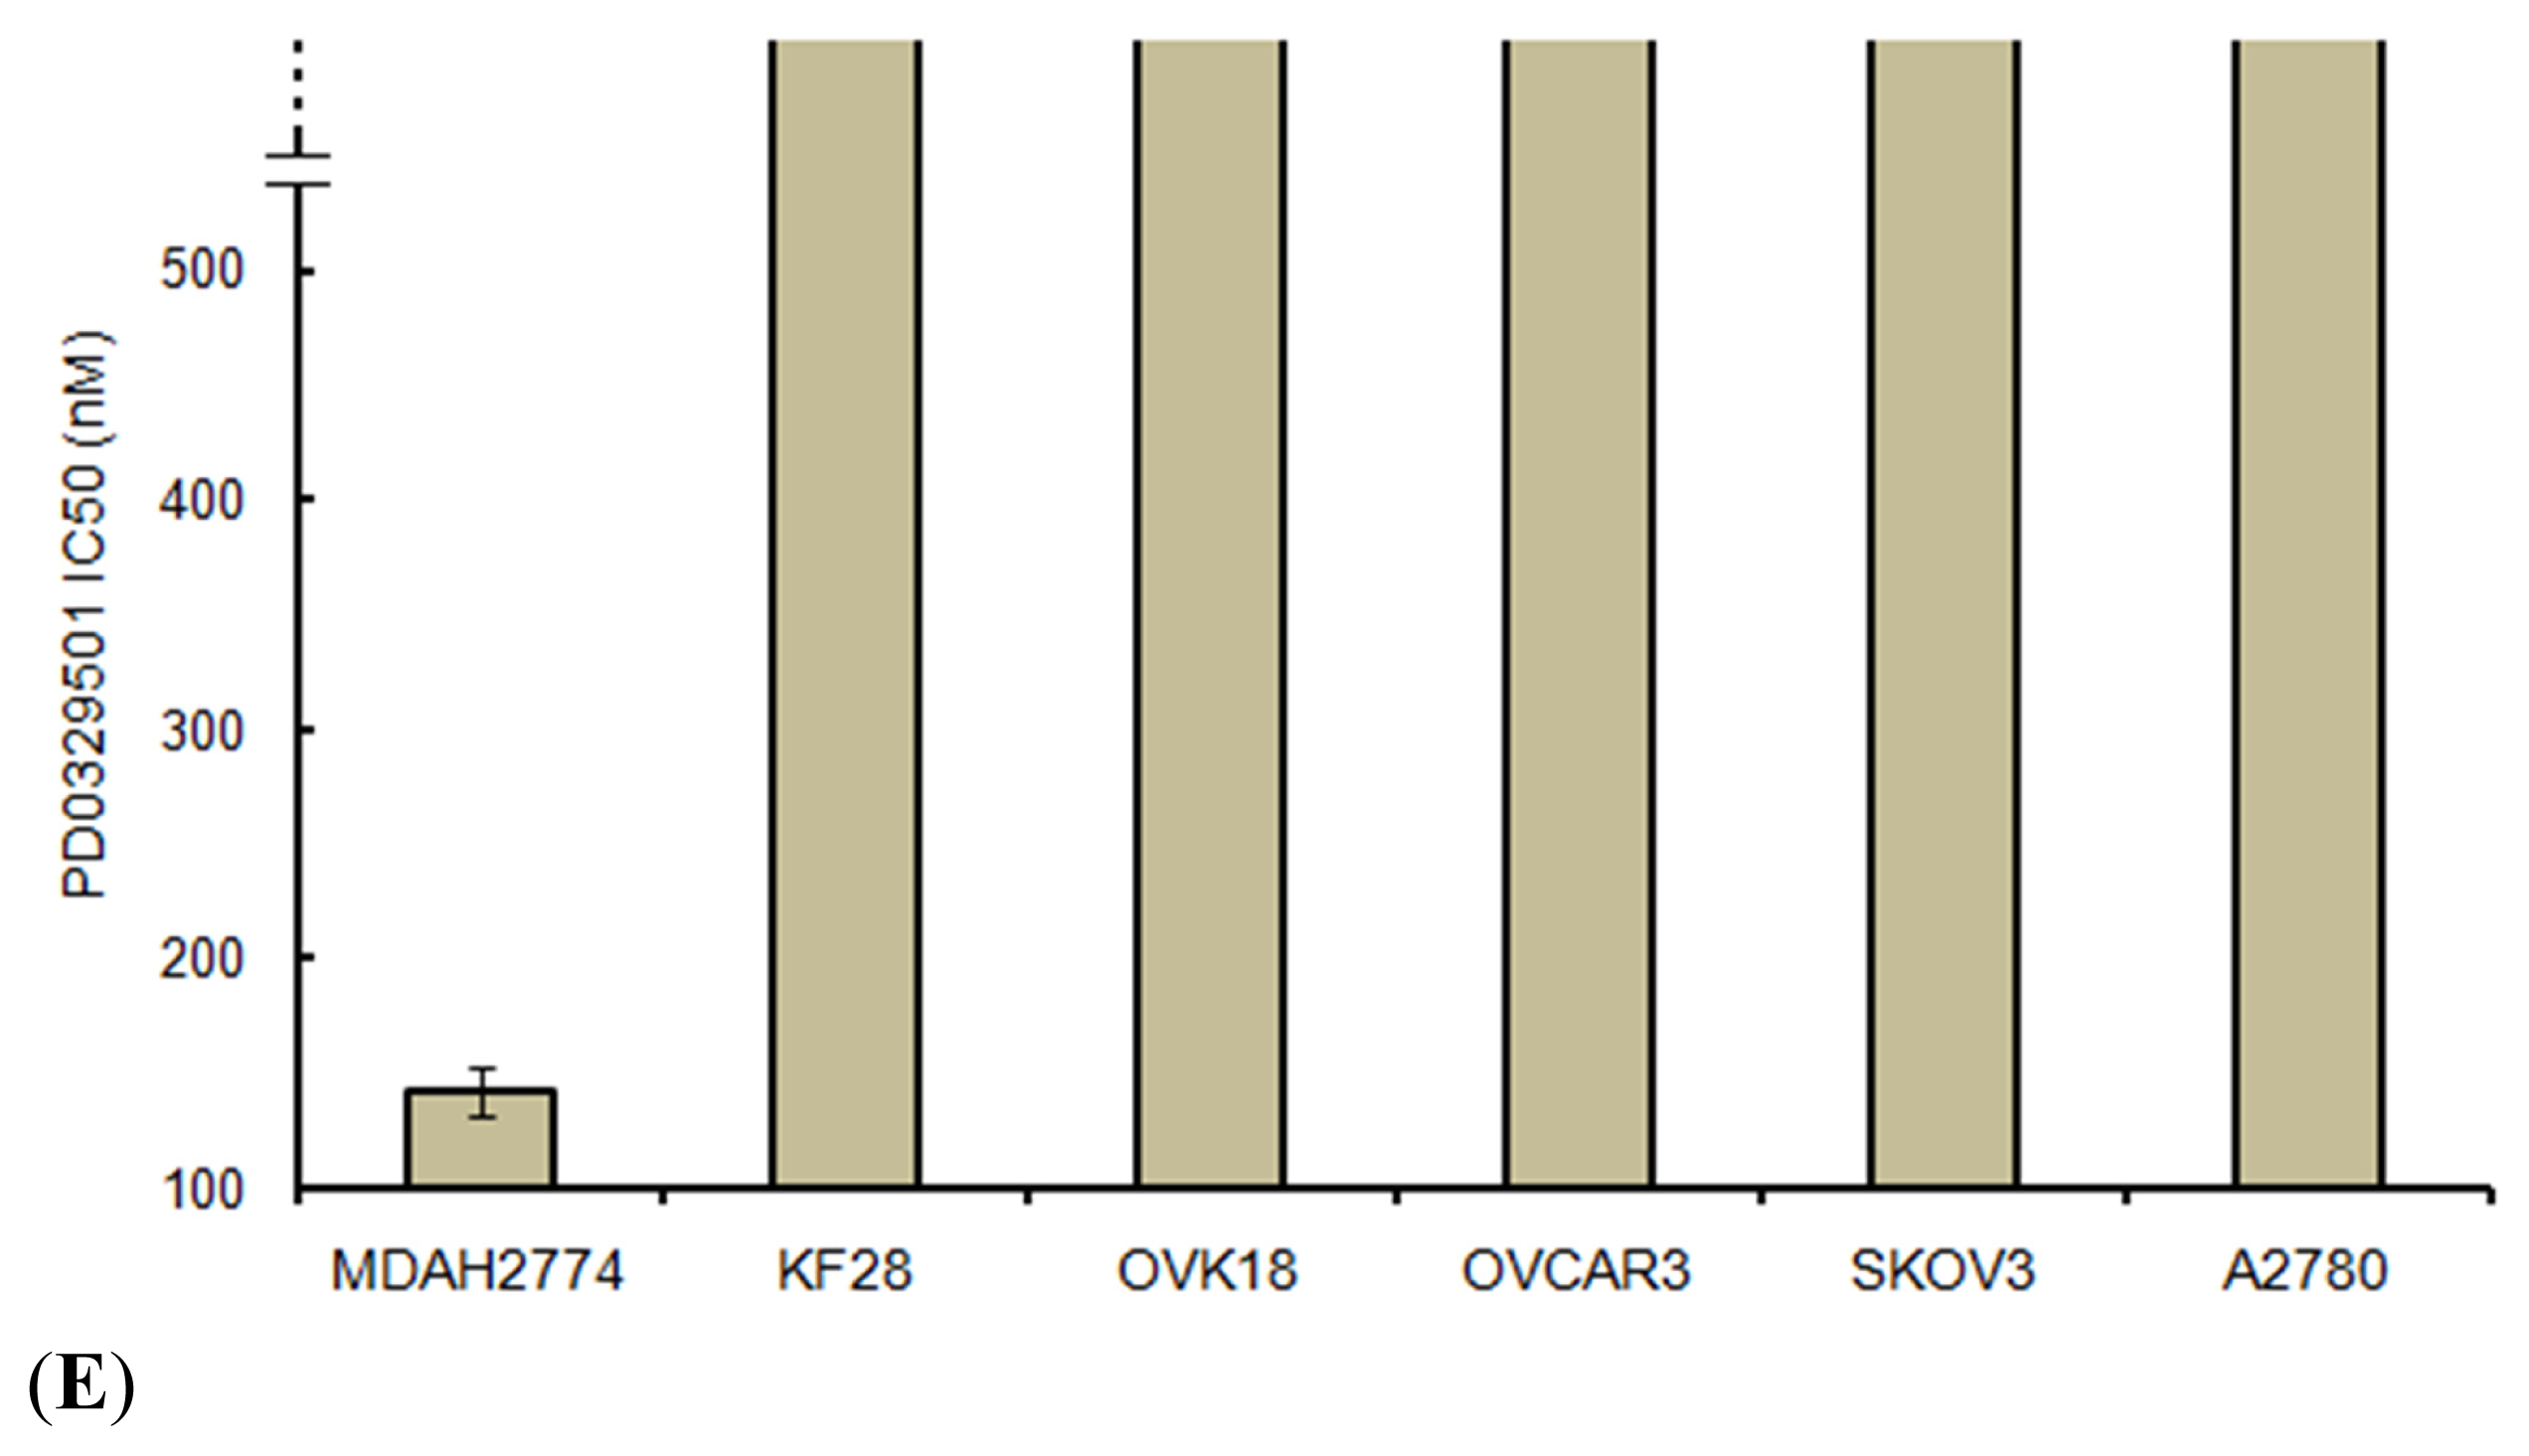
2.5. Effects of ERK1/2 Inactivation on High-Grade Serous Ovarian Carcinoma in Vitro

A panel of type II ovarian carcinoma cell lines was analyzed for KRAS or MAPK1 amplification; as shown in Figure 3, 1 type II ovarian carcinoma cell line harbored KRAS amplification. Interestingly, the MDAH2774 cell line had both KRAS amplification and KRAS mutations. Amplification status was correlated with growth inhibition induced by the selective MEK inhibitor PD0325901, which prevented activation of the downstream target, ERK1/2. Western blot analysis showed a dose-dependent effect on the expression of p-ERK1/2 in MDAH2774 cells, and p-ERK1/2 was not detectable 1 h after treating the cells with PD0325901 at a concentration of 10 nM (Figure 3). As shown in Figure 3, MDAH2774 cells harboring either KRAS amplification or KRAS mutations showed a markedly lower IC50 for PD0325901.
PD0325901 had no significant effects on the growth of normal cells, including OSE cells (data not shown). It is likely that KRAS/MAPK1 amplification or KRAS mutations are not the only determinant for the activation of ERK1/2. Therefore, we analyzed p-ERK1/2 expression in each of the cell lines listed in Figure 3. Only 1 cell line, MDAH2774, strongly expressed p-ERK1/2. SKOV3 and OVCAR3 showed moderate expression of ERK1/2. The other cell lines (KF28, A2780, and OVCA18) showed weak expression of ERK1/2. These results suggested that activation of ERK1/2 may not depend on KRAS/MAPK1 amplification or KRAS mutations in type II ovarian carcinoma cell lines.

3. Discussion

Type II ovarian carcinomas are the most common and fatal form of ovarian cancer [9]. While most tumors are highly sensitive to cytoreductive surgery and platinum-and taxane-based chemotherapy, the majority of patients experience recurrence of treatment-resistant tumors. Therefore, a new potential molecular targeted therapy for type II ovarian carcinomas needs to be developed. We reported earlier that KRAS or BRAF mutations were quite common in low-grade serous ovarian carcinomas with prototypic histology of type I ovarian carcinoma but rare in high-grade serous ovarian carcinomas [8,10]. Our present results showing low frequencies of KRAS mutations in type II ovarian carcinoma are consistent with our earlier reports [8,10].
Based on our combined FISH and immunohistochemical analysis, we found that p-ERK was not consistently expressed in all KRAS or MAPK1 gene amplification tumors. Why does this discrepancy happen? This may be due to expression of the mitogen-activated protein kinase (MAPK) phosphatase (MKP)-1 in type II ovarian carcinomas. MKP-1 is overexpressed in several types of cancers [11,12]. MKP-1 is the prototypic member of a family of dual-specificity phosphatases that dephosphorylate tyrosine and threonine residues on target proteins. This phosphatase is best known for its specificity toward p44/42 MAPK [13]. Further examination is needed to clarify the relationship KRAS/MAPK1 amplification and MKP-1 expression. Furthermore, many tumors exhibited positive p-ERK signals in the absence of KRAS or MAPK1 amplification. Therefore, gene amplification is probably just one of multiple mechanisms for p-ERK expression. Additionally, the low frequency of KRAS mutation or BRAF mutations in type II ovarian carcinomas in the current and previous studies suggest that p-ERK expression may be affected by the other receptor tyrosine kinase regulation mechanisms (i.e., EGFR, Her2, etc.) [8,14,15]. This is in consistent with a recent report showing that this pathway is frequently activated independent of the status of KRAS and BRAF in endometrioid-type endometrial cancer [11]. The RAS–RAF–MEK–ERK pathway may be affected by multiple pathways in type II ovarian carcinogenesis and endometrial carcinogenesis. For example, alternative pathways for ERK activation, such as crosstalk with the PI3K pathway, exist in high-grade serous ovarian carcinomas. Indeed, enhanced PI3K signaling due to amplification occurs in 10%–18% of high-grade serous ovarian carcinomas, which is the dominant histology of type II ovarian carcinoma [6,10,16].
Biomarkers that can predict clinical prognosis, including treatment response and overall survival, can have a substantial clinical impact on the management of patients with ovarian carcinoma [17]. To further explore the clinical relevance of KRAS or MAPK1 alterations in type II ovarian carcinomas, we identified a correlation between KRAS or MAPK1 amplification or p-ERK protein expression and length of progression-free/overall survival in patients with type II ovarian carcinomas. Interestingly, a strong correlation between poor progression-free prognosis and MAPK1 amplification was identified in patients who received taxane- and platinum-based chemotherapy. In contrast to MAPK1 amplification, KRAS amplification did not affect patient survival. However, p-ERK protein overexpression was associated with an insignificant trend toward poor progression-free/overall survival. The mechanism underlying the association between MAPK1 amplification and shorter progression-free survival is not known; however, because mortality of patients with type II ovarian carcinomas is directly related to recurrence of disease after chemotherapy, it is conceivable that MAPK1 amplification may confer resistance to chemotherapy and/or enhance cell proliferation in recurrent chemoresistant tumors. Current study has several limitations. First, differences in histological heterogeneity in type II ovarian carcinoma, including high-grade serous, high-grade endometriod, and carcinosarcoma used to assess amplification KRAS/MAPK1 may produce significant variability among results. Second, the sample sizes of this study are relatively small. Larger sample studies are required to definitively establish the percentage of KRAS/MAPK1 amplification on type II ovarian carcinomas.
In the current study, type II ovarian carcinomas with both KRAS mutations and KRAS amplification were highly sensitive to growth inhibition by the selective MEK inhibitor, PD0325901. This observation suggested that type II ovarian carcinoma with concomitant amplification and mutation of KRAS was more highly dependent on the activation of the RAS/RAF/MEK/ERK pathway for cell proliferation and survival than those without such amplification or mutation. Thus, inactivation of ERK1/2 resulted in marked growth inhibition in ovarian carcinomas with amplification/mutations in KRAS in comparison with only a slight effect on wild-type tumors. The above observations lend strong support to the view of ‘oncogene addiction’ [18] by which the activating amplifications in the kinase pathway confer susceptibility of the tumors to an inhibitor [8,19,20]. Recently, Wagner et al. reported that concomitant KRAS amplification and mutation enhances the aggressiveness of non-small cell lung carcinoma [21]. In contrast, in the current study no cases with concomitant KRAS or MAPK1 amplification and KRAS mutation were identified. This discrepancy may be due to differences in organ-specific oncogenic pathways and mechanisms of carcinogenesis. The potential for organ-specific differences in KRAS amplification and KRAS mutations in malignant tissues is the subject of ongoing investigation. Although our in vitro results showed that concomitant KRAS amplification and mutation was more highly dependent on the activation of the RAS/RAF/MEK/ERK pathway for cell proliferation than those without such amplification or mutation. Considering the above findings, concomitant KRAS amplification/mutation and function in neoplastic tissues may be dependent on cellular context. In order to fully understand the role of the complex concomitant amplification and mutation of KRAS in type II ovarian carcinoma physiology, larger studies including functional analyses are required.

4. Experimental Section

4.1. Tissue Samples

Formalin-fixed, paraffin-embedded tissue samples from 68 type II ovarian carcinomas, including 43 high-grade serous, 16 high-grade endometrioid, and 5 carcinosarcoma tumors, were used in this study. Samples were obtained from the Department of Obstetrics and Gynecology at the Shimane University Hospital. Diagnosis was based on conventional morphological examination of sections stained with hematoxylin and eosin (H & E), and tumors were classified according to the WHO classification. Tumor staging was performed according to the International Federation of Gynecology and Obstetrics (FIGO) classification. All patients were primarily treated with cytoreductive surgery and adjuvant platinum and taxane chemotherapy (CBDCA AUC5 with paclitaxel 175 mg/m2 or docetaxel 70 mg/m2). All patients received 6–12 courses of this combination regimen. The acquisition of tumor tissues was approved by the Shimane University Institutional Review Board. Paraffin tissue blocks were organized into tissue microarrays, each made by removing tumor cores measuring 3 mm in diameter from the block. Selection of the area to core was made by a gynecologic oncologist (K.N.) and pathology technician (K.I.) and was based on review of the H & E slides.

4.2. Fluorescence in Situ Hybridization

BAC clones (CTD2174F1 and CTD-2536C1) containing the genomic sequences of the 12p12.1 chromosome at the KRAS locus were purchased from Bacpac Resources (Children’s Hospital, Oakland, CA, USA) and Invitrogen (Carlsbad, CA, USA). Bac clones located at Chr12q23.3 (RP11-482D24) were used as reference probes. BAC clones (RP11-647D11 and RP11-1109D18) containing the genomic sequences of the 22q11.21–22q11.22 chromosome at the MAPK1 locus were purchased from Bacpac Resources and Invitrogen. Bac clones located at Chr22q13.32-13.33 (RP11-29C18) were used as reference probes.
CTD2174F1, CTD-2536C1, RP11-647D11, and RP11-1109D18 were labeled by nick translation with biotin-dUTP; RP11-482D24 and RP11-29C18 were labeled similarly with digoxigenin-dUTP. To detect biotin-labeled and digoxigenin-labeled signals, slides were first incubated with FITC-avidin (Vector Laboratories, Burlingame, CA, USA) and anti-digoxigenin mouse antibodies (Roche Molecular Biochemicals, Mannheim, Germany). Slides were subsequently incubated with biotinylated anti-avidin antibodies (Vector Laboratories, Burlingame, CA, USA) and tetramethylrhodamine B isothiocyanate (TRITC)-conjugated rabbit anti-mouse antibodies (Sigma, St. Louis, MO, USA). The final incubation was with FITC-avidin and TRITC-conjugated goat anti-rabbit antibodies (Sigma, St. Louis, MO, USA). Slides were counterstained with 4′,6′-diamidino-2-phenylindole (DAPI, Sigma, St. Louis, MO, USA).
Fluorescence in situ hybridization (FISH) signals were evaluated with an Olympus fluorescence microscope BX41 (Tokyo, Japan) by two individuals who were blinded to the treatment history of each patient. Separate narrow band pass filters were used for detection of TRITC, FITC, and DAPI signals. Using a 60× objective lens, approximately 100 tumor cells were examined for each specimen, and the number of fluorescent signals within tumor cells from KRAS or MAPK1 gene BAC probes and chromosome 12q23.3 or 22q13.32-13.33 reference BAC probe was recorded. Amplification of KRAS or MAPK1 was defined as a ratio of KRAS or MAPK1 BAC probe signals to chromosome 12 or chromosome 22 centromeric reference BAC probe signals of 2:1 or more.

4.3. Mutational Analysis of KRAS

Genomic DNA was purified from all cell lines and formalin-fixed, paraffin-embedded tissues using a Qiaquick polymerase chain reaction (PCR) purification kit (Qiagen, Valencia, CA, USA). PCR was then carried out followed by nucleotide sequencing using the iCycler (Bio-Rad, Hercules, CA, USA). Exon 1 of KRAS was sequenced, as these mutational hot spots together harbor nearly all published mutations [22,23]. The primers for PCR and sequencing were manufactured by GeneLink (Hawthorne, NY, USA), and their sequences were described in an earlier report [9]. The sequences were analyzed using the Lasergene program, DNASTAR (Madison, WI, USA).

4.4. Immunohistochemistry

Expression of active phosphorylated ERK1/2 (p-ERK1/2) was assessed by immunohistochemistry and western blot analysis. The antibody used in this study was a rabbit polyclonal antibody that reacted with phosphorylated but not unphosphorylated ERK1/2 (Cell Signaling Technology, Danvers, MA, USA). Immunohistochemistry was carried out on tissue microarrays at a dilution of 1:1000 followed by detection with the En Vision+ System using the peroxidase method (DAKO, Carpinteria, CA, USA). The percentage of positive cells was estimated by randomly counting ~500 tumor cells from 3 different high-power fields (40×) within one specimen. A positive reaction was defined as a discrete localization of the brown chromagen in the nucleus or cytoplasm. Cases in which more than 5% of the tumor cells showed detectable immunoreactivity were scored as positive.

4.5. Western Blot Analysis

Cell lysates were prepared by dissolving cell pellets in Laemmli sample buffer (Bio-Rad) supplemented with 5% β-mercaptoethanol (Sigma). Western blot analysis was performed on type II ovarian carcinoma cell lines, including OVCAR3, SKOV3, A2780, MDAH2774, KF28, and OVK18. Similar amounts of total protein from each lysate were loaded and separated on 10% Tris-Glycine-SDS polyacrylamide gels (Novex, San Diego, CA, USA) and electroblotted to Millipore Immobilon-P polyvinylidene difluoride membranes. The membranes were probed with p-ERK1/2 antibodies (pTEpY, 1:1000; Santa Cruz Biotechnology, CA, USA) followed by peroxidase-conjugated anti-mouse immunoglobulin (1:10,000). The same membrane was probed with an antibody that reacted with total ERK1/2 (1:5000; Santa Cruz Biotechnology, CA, USA) as a loading control. Western blots were developed by chemiluminescence (Pierce, Rockford, IL, USA).

4.6. Cell Growth Assays

For cell growth assays, cells were plated at the same density (5 × 10³ cells per well) in 96-well plates. A methyl thiazoyl tetrazorium (MTT) cell growth assay was performed [24] 96 h after treating the cells with PD0325901 (Selleck Chemicals, Houston, TX, USA) at 1–200 nM or with dimethyl sulfoxide (DMSO) as a control. The IC50 was determined on the basis of dose-response curves by a cytotoxicity assay. The data were expressed as the mean ± SD of triplicates.

4.7. Statistical Methods for Clinical Correlations

Overall survival was calculated from date of diagnosis to date of death or last follow-up. Progression-free survival was defined as the time from the first day of surgery or chemotherapy until the first of either death from any cause or disease progression (based on an increase in the CA 125 levels and/or on the findings of imaging studies). Survival data were plotted as Kaplan-Meier curves, and statistical significance was determined by the Log-rank test. Multivariate prognostic analysis was performed using a Cox proportional hazards model. Data were censored when patients were lost to follow-up. The chi-square test or Fischer’s exact test was used for comparisons of categorical data.

5. Conclusions

In summary, we demonstrated that phenotypic changes in type II ovarian carcinomas in response to ERK1/2 inactivation depended on the amplification status of KRAS/MAPK1 or the mutation status of KRAS. The findings in this study provide new insights into the biological roles of the RAS/RAF/MEK/ERK signaling pathway in type II ovarian carcinomas. In addition, our observations have important therapeutic implications in the treatment of type II ovarian carcinoma in patients harboring KRAS or MAPK1 amplifications. Ovarian carcinomas with KRAS or MAPK1 amplifications are clinically most frequent in type II carcinomas that exhibit aggressive behavior [5,6]. Therefore, detection of KRAS and MAPK1 amplifications in type II ovarian carcinomas may identify patients who will benefit from therapy with the selective MEK inhibitor PD0325901.

Acknowledgement

This study was supported by grants from the Ministry of Education, Culture, Sports, Science, and Technology in Japan.

Conflicts of Interest

The authors declare no conflict of interest.

References

  1. Wingo, P.A.; Tong, T.; Bolden, S. Cancer statistics 1995. CA Cancer J. Clin 1995, 45, 8–30. [Google Scholar]
  2. Hoskins, W.J.; McGuire, W.P.; Brady, M.F.; Homesley, H.D.; Creasman, W.T.; Berman, M.; Ball, H.; Berek, J.S. The effect of diameter of largest residual disease on survival after primary cytoreductive surgery in patients with suboptimal residual epithelial ovarian carcinoma. Am. J. Obstet. Gynecol 1994, 170, 974–979, , discussion 979–980.. [Google Scholar]
  3. Ozols, R.F.; Bundy, B.N.; Greer, B.E.; Fowler, J.M.; Clarke-Pearson, D.; Burger, R.A.; Mannel, R.S.; DeGeest, K.; Hartenbach, E.M.; Baergen, R. Phase III trial of carboplatin and paclitaxel compared with cisplatin and paclitaxel in patients with optimally resected stage III ovarian cancer: A Gynecologic Oncology Group study. J. Clin. Oncol 2003, 21, 3194–3200. [Google Scholar]
  4. McGuire, W.P.; Hoskins, W.J.; Brady, M.F.; Kucera, P.R.; Partridge, E.E.; Look, K.Y.; Clarke-Pearson, D.L.; Davidson, M. Cyclophosphamide and cisplatin compared with paclitaxel and cisplatin in patients with stage III and stage IV ovarian cancer. N. Engl. J. Med 1996, 334, 1–6. [Google Scholar]
  5. Kurman, R.J.; Shih, le-M. Molecular pathogenesis and extraovarian origin of epithelial ovarian cancer—Shifting the paradigm. Hum. Pathol. 2011, 42, 918–931. [Google Scholar]
  6. Cancer Genome Atlas Research Network. Integrated genomic analyses of ovarian carcinoma. Nature 2011, 474, 609–615.[Green Version]
  7. Mizumoto, Y.; Kyo, S.; Mori, N.; Sakaguchi, J.; Ohno, S.; Maida, Y.; Hashimoto, M.; Takakura, M.; Inoue, M. Activation of ERK1/2 occurs independently of KRAS or BRAF status in endometrial cancer and is associated with favorable prognosis. Cancer Sci 2007, 98, 652–658. [Google Scholar]
  8. Nakayama, N.; Nakayama, K.; Yeasmin, S.; Ishibashi, M.; Katagiri, A.; Iida, K.; Fukumoto, M.; Miyazaki, K. KRAS or BRAF mutation status is a useful predictor of sensitivity to MEK inhibition in ovarian cancer. Br. J. Cancer 2008, 99, 2020–2028. [Google Scholar]
  9. Cho, K.R.; Shih, le-M. Ovarian cancer. Annu. Rev. Pathol. 2009, 4, 287–313. [Google Scholar]
  10. Nakayama, K.; Nakayama, N.; Kurman, R.J.; Cope, L.; Pohl, G.; Samuels, Y.; Velculescu, V.E.; Wang, T.L.; Shih, le-M. Sequence mutations and amplification of PIK3CA and AKT2 genes in purified ovarian serous neoplasms. Cancer Biol. Ther. 2006, 5, 779–785. [Google Scholar]
  11. Small, G.W.; Shi, Y.Y.; Higgins, L.S.; Orlowski, R.Z. Mitogen-activated protein kinase phosphatase-1 is a mediator of breast cancer chemoresistance. Cancer Res 2007, 67, 4459–4466. [Google Scholar]
  12. Vicent, S.; Garayoa, M.; López-Picazo, J.M.; Lozano, M.D.; Toledo, G.; Thunnissen, F.B.; Manzano, R.G.; Montuenga, L.M. Mitogen-activated protein kinase phosphatase-1 is overexpressed in non-small cell lung cancer and is an independent predictor of outcome in patients. Clin. Cancer Res 2004, 10, 3639–3649. [Google Scholar]
  13. Kelly, K.; Chu, Y. The Regulation of MAP Kinase Pathways by MAP Kinase Phosphatases. In Signaling Networks and Cell Cycle Control; Gutkind, J.S., Ed.; Humana Press: Totowa, NJ, USA, 2000; pp. 165–182. [Google Scholar]
  14. Tanaka, Y.; Terai, Y.; Tanabe, A.; Sasaki, H.; Sekijima, T.; Fujiwara, S.; Yamashita, Y.; Kanemura, M.; Ueda, M.; Sugita, M.; et al. Prognostic effect of epidermal growth factor receptor gene mutations and the aberrant phosphorylation of Akt and ERK in ovarian cancer. Cancer Biol. Ther 2011, 11, 50–57. [Google Scholar]
  15. Lanitis, E.; Dangaj, D.; Hagemann, I.S.; Song, D.G.; Best, A.; Sandaltzopoulos, R.; Coukos, G.; Powell, D.J., Jr. Primary human ovarian epithelial cancer cells broadly express HER2 at immunologically-detectable levels. PLoS One 2012, 7, e49829. [Google Scholar]
  16. Nakayama, K.; Nakayama, N.; Jinawath, N.; Salani, R.; Kurman, R.J.; Shih, le-M.; Wang, T.L. Amplicon profiles in ovarian serous carcinomas. Int. J. Cancer 2007, 120, 2613–2617. [Google Scholar]
  17. Scott, M.; Hall, P.A. Prognostic and predictive factors. Methods Mol. Med 2004, 97, 1–11. [Google Scholar]
  18. Weinstein, I.B.; Joe, A. Oncogene addiction. Cancer Res 2008, 68, 3077–3080. [Google Scholar]
  19. Nakayama, N.; Nakayama, K.; Shamima, Y.; Ishikawa, M.; Katagiri, A.; Iida, K.; Miyazaki, K. Gene amplification CCNE1 is related to poor survival and potential therapeutic target in ovarian cancer. Cancer 2010, 116, 2621–2634. [Google Scholar]
  20. Iida, K.; Nakayama, K.; Rahman, M.T.; Rahman, M.; Ishikawa, M.; Katagiri, A.; Yeasmin, S.; Otsuki, Y.; Kobayashi, H.; Nakayama, S.; et al. EGFR gene amplification is related to adverse clinical outcomes in cervical squamous cell carcinoma; making the EGFR pathway a novel therapeutic target. Br. J. Cancer 2011, 105, 420–427. [Google Scholar]
  21. Wagner, P.L.; Stiedl, A.C.; Wilbertz, T.; Petersen, K.; Scheble, V.; Menon, R.; Reischl, M.; Mikut, R.; Rubin, M.A.; Fend, F.; et al. Frequency and clinicopathologic correlates of KRAS amplification in non-small cell lung carcinoma. Lung Cancer 2011, 74, 118–123. [Google Scholar]
  22. Davies, H.; Bignell, G.R.; Cox, C.; Stephens, P.; Edkins, S.; Clegg, S.; Teague, J.; Woffendin, H.; Garnett, M.J.; Bottomley, W.; et al. Mutations of the BRAF gene in human cancer. Nature 2002, 417, 949–954. [Google Scholar]
  23. Singer, G.; Oldt, R., 3rd; Cohen, Y.; Wang, B.G.; Sidransky, D.; Kurman, R.J.; Shih, le-M. Mutations in BRAF and KRAS characterize the development of low-grade ovarian serous carcinoma. J. Natl. Cancer Inst. 2003, 95, 484–486. [Google Scholar]
  24. Nakayama, K.; Miyazaki, K.; Kanzaki, A.; Fukumoto, M.; Takebayashi, Y. Expression and cisplatin sensitivity of copper-transporting P-type adenosine triphosphatase (ATP7B) in human solid carcinoma cell lines. Oncol. Rep 2001, 8, 1285–1287. [Google Scholar]
Figure 1. Dual-color fluorescence in situ hybridization (FISH) validates amplification of the KRAS or MAPK1 gene in type II ovarian carcinoma. (A) FISH analysis of KRAS showed a homogeneously stained region in a tumor with gene amplification. White arrows indicated amplification of KRAS gene; (B) FISH analysis of MAPK1 showed a homogeneously stained region in a tumor with gene amplification. White arrows indicated amplification of MAPK1 gene; (C) Intense immunoreactivity toward p-ERK was present in both the nuclei and cytoplasm of carcinoma cells; (D) This sample shows negative case of staining for p-ERK.
Ijms 14 13748f1aIjms 14 13748f1b
Figure 2. Relationship between KRAS/MAPK1 amplification or p-ERK expression status and progression-free/overall survival in patients who received primary cytoreductive surgery followed by standard platinum/taxane chemotherapy. (A,B) Kaplan-Meier survival analysis showed that KRAS amplification (solid line, n = 9) was not associated with a shorter progression-free/overall survival than absence of KRAS amplification (dashed line, n = 59; p = 0.5897, p = 0.8655, respectively, Log-rank test); (C) Kaplan-Meier survival analysis showed that MAPK1 amplification (solid line, n = 5) was associated with a shorter progression-free survival than absence of MAPK1 amplification (dashed line, n = 63; p = 0.0098, Log-rank test); (D) MAPK1 amplification (solid line, n = 5) tended to be correlated with a shorter overall survival than absence of MAPK1 amplification, but was not statistically significant (dashed line, n = 63; p = 0.1658, Log-rank test); (E,F) Positive p-ERK expression tended to be correlated with a shorter progression-free/overall survival than absence of MAPK1 amplification, but was not statistically significant (dashed line, n = 63; p = 0.2396, p = 0.0943, respectively, Log-rank test).
Ijms 14 13748f2aIjms 14 13748f2b
Figure 3. Western blot analysis. (A) Western blot analysis showed a higher level of p-ERK protein expression in MDAH2774 cells than in other cell lines; (B) Dual-color fluorescence in situ hybridization (FISH) validated amplification of the KRAS gene in ovarian cancer cell line (MDAH2774) White arrows indicate amplification of KRAS gene; (C) OVCAR3 cells contained signals for both KRAS and reference probes with an approximate 1:1 ratio; (D) Western blot analysis showed a significant reduction in p-ERK protein in PD0328901-treated cells compared with control DMSO-treated cells; (E) IC50 values for the selective MEK1/2 inhibitor PD0325901 for 6 type II ovarian carcinoma cell lines. MDAH2774 cells with KRAS amplification were more sensitive to growth inhibition by the selective MEK1/2 inhibitor PD0325901 than cells without KRAS amplification. The mean and SD were obtained from 3 experiments.
Ijms 14 13748f3aIjms 14 13748f3b
Table 1. Association between KRAS/MAPK1 amplification and p-ERK expression.
p-ERK negativep-ERK positive
KRAS/MAPK1 normal2926
KRAS/MAPK1 amplification58
p = 0.5387
Table 2. Association between KRAS or MAPK1 gene amplification or p-ERK expression and clinicopathological factors in patients with type II ovarian carcinomas.
FactorsPatientsKRAS FISHp-valueMAPK1 FISHp-valuep-ERK imunostainingp-value

(n)NormalAmplificationNormalAmplificationNegativePositive
FIGO stage

I, II312650.51923010.232714170.4651
III, IV373343342017

Age (years)

<60322660.20582840.125215170.627
≥60363333511917

Residual tumor

<1 cm393270.18353810.079319200.8063
≥1 cm292722541514
Table 3. Univariate and multivariate analysis of progression-free prognostic factors in patients with type II ovarian carcinomas.
FactorsPatientsUnivariateMultivariate

hazard ratio95% CIp-valuehazard ratio95% CIp-value
FIGO stage

I, II317.12.1–24.10.00151.30.3–5.80.7511
III, IV37

Age (years)

<60322.51.0–6.00.04992.81.0–7.70.0438
≥6036

Residual tumor

<1 cm3914.24.1–48.2<0.000110.22.2–46.70.0028
≥1 cm29

MAPK1 FISH

Amplification54.41.4–1.30.00984.21.2–15.00.0285
Normal63

