Genetic Variation in Safflower (Carthamus tinctorious L.) for Seed Quality-Related Traits and Inter-Simple Sequence Repeat (ISSR) Markers


Abstract
:1. Introduction
2. Results and Discussion
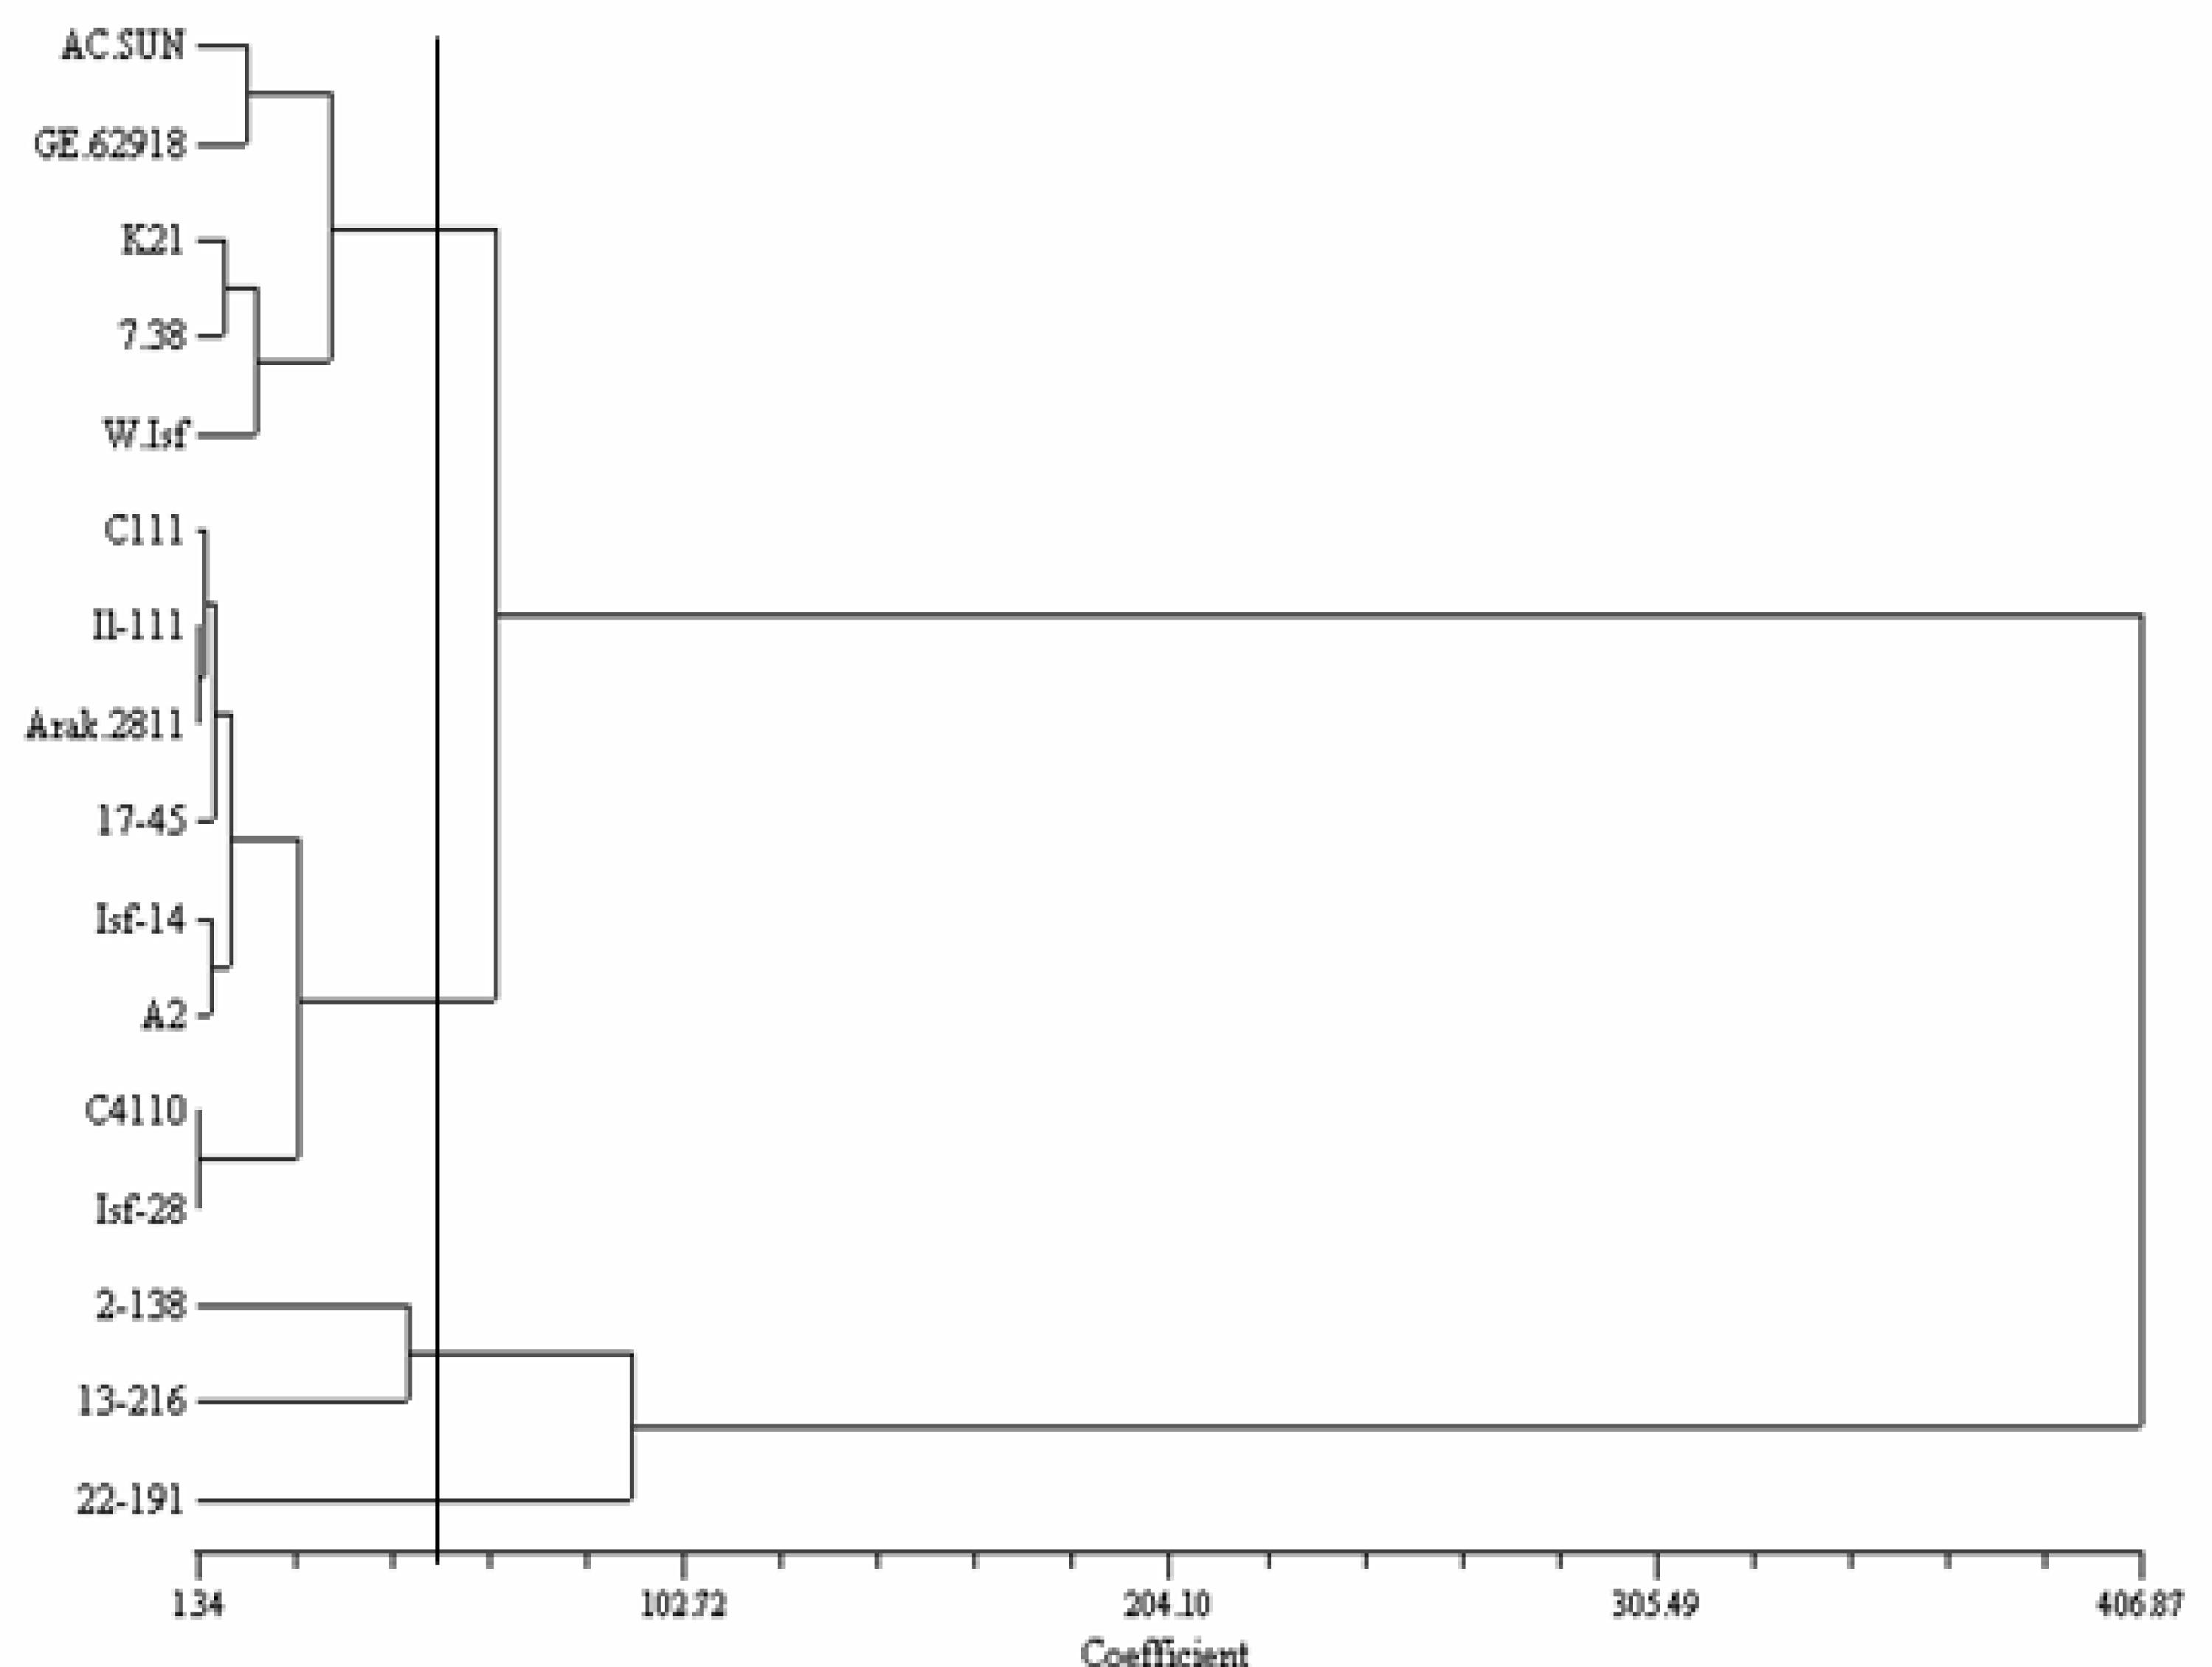
2.1. Seed Quality-Related Traits
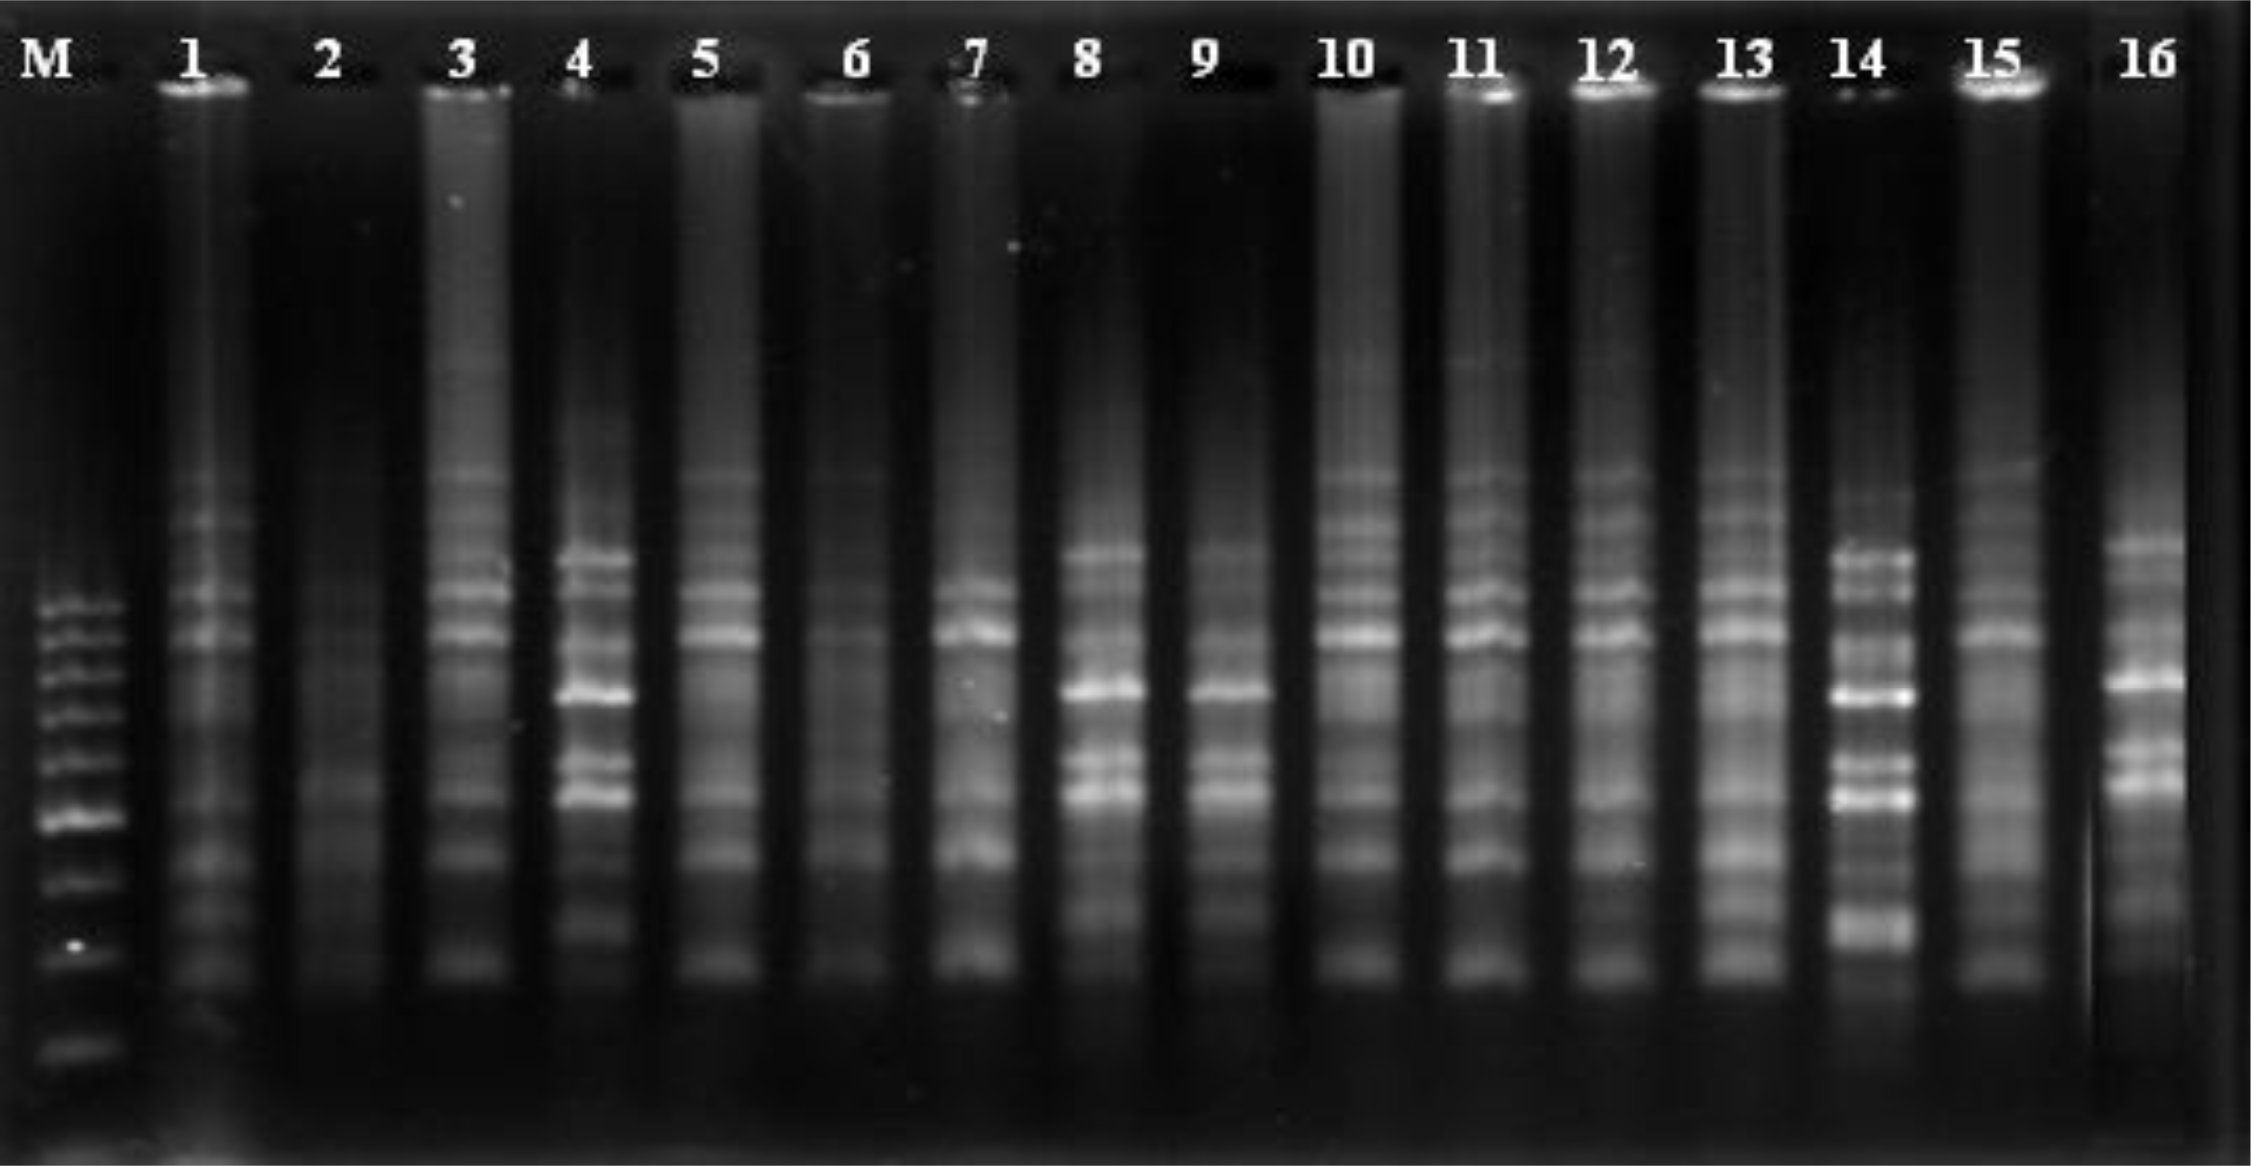
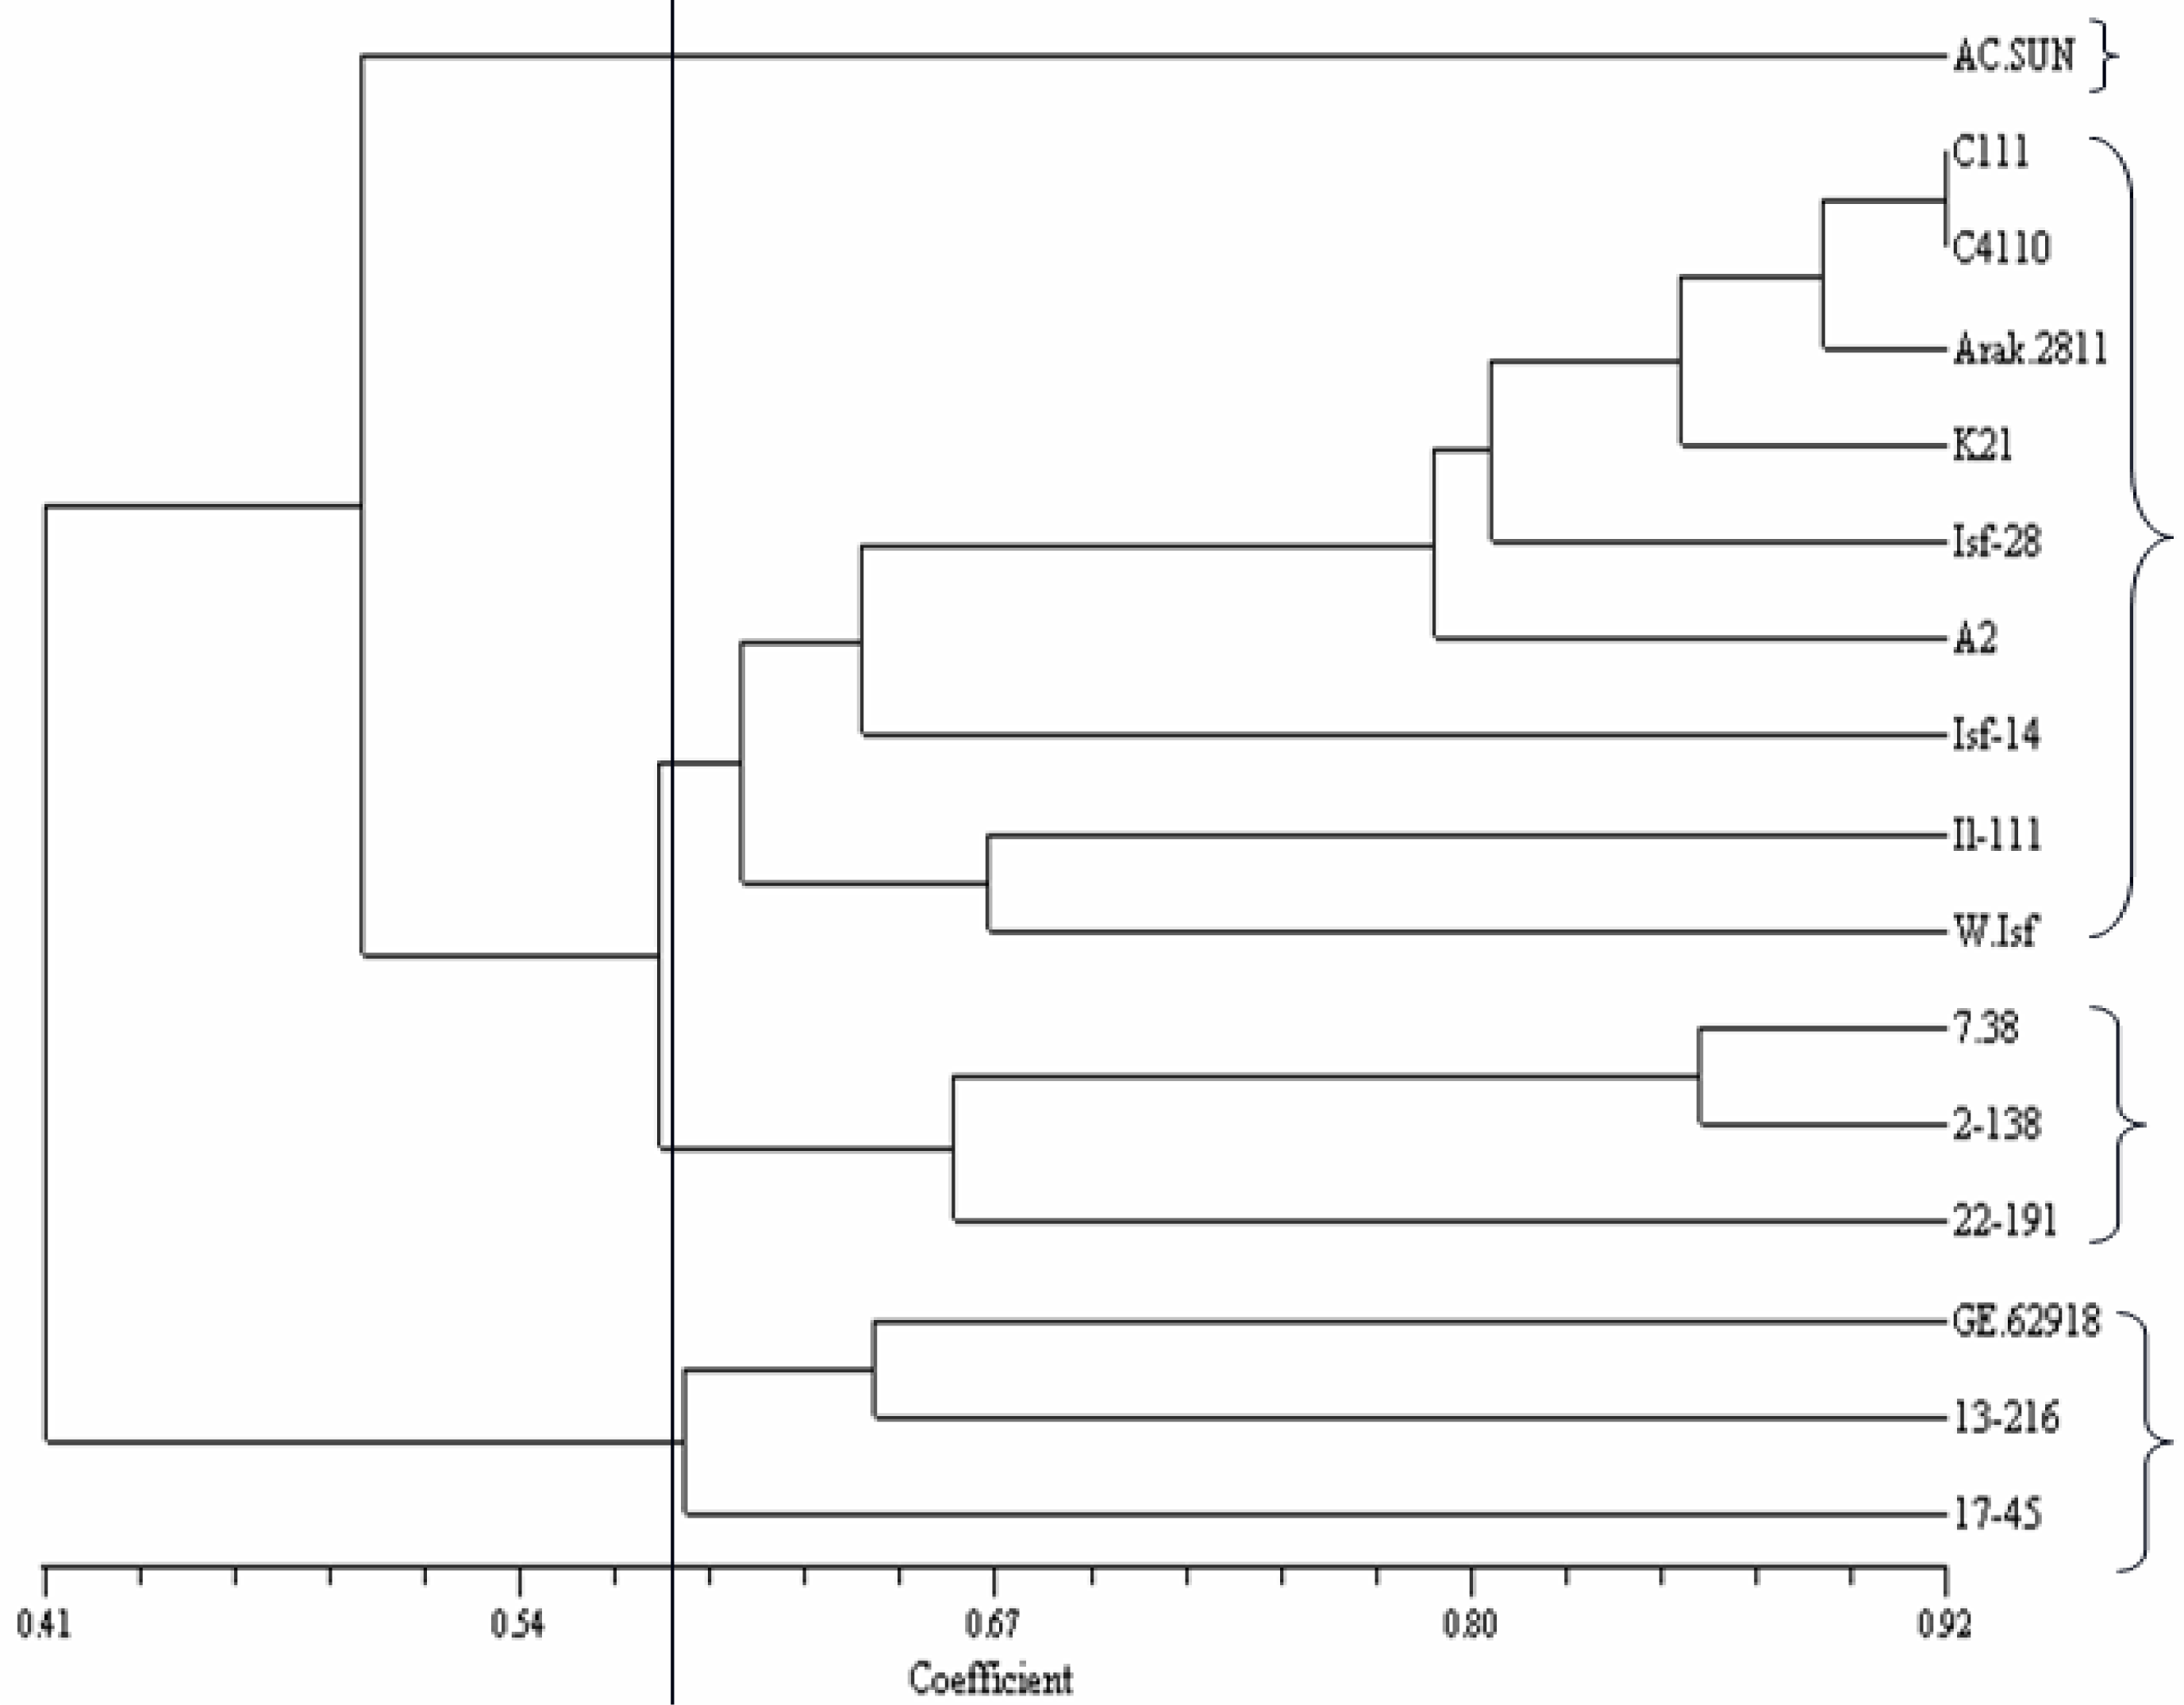
2.2. ISSR Analysis
3. Materials and Methods
3.1. Plant Materials and Growth Conditions
3.2. Oil Extraction
3.3. Fatty Acid Composition
3.4. Seed Protein, Fiber and Ash Contents
3.5. ISSR Analysis
3.6. Statistical Analysis
4. Conclusions
Acknowledgments
References
- Ashri, A. Evaluation of the germplasm collection of safflower (Carthamus tinctorius L.) V. Distribution and regional divergence for morphological characters. Euphytica 1975, 24, 651–659. [Google Scholar]
- Knowles, PF. Centers of plant diversity and conservation of crop germplasm: Safflower. Econ. Bot 1969, 23, 324–329. [Google Scholar]
- Chapman, MA; Hvala, J; Strever, J; Burke, JM. Population genetic analysis of safflower (Carthamus tinctorius; Asteraceae) reveals a Near Eastern origin and five centers of diversity. Am. J. Bot 2010, 97, 831–840. [Google Scholar]
- Knowles, PF; Ashri, A. Safflower Carthamus Tinctorius (Compositae). In Evolution of Crop Plants, 2nd ed; Smartt, J, Simmonds, NW, Harlow, K, Eds.; Longman: Harlow, UK, 1995; pp. 47–50. [Google Scholar]
- Weiss, EA. Oil Seed Crops, 2nd ed; Blackwell Science Ltd: Oxford, UK, 2000; p. 364. [Google Scholar]
- Gecgel, U; Demirci, M; Esendal, E. Seed yield, oil content and fatty acids composition of safflower (Carthamus tinctorius L.) varieties sown in spring and winter. Int. J. Nat. Eng. Sci 2007, 1, 11–15. [Google Scholar]
- Singh, RJ. Genetic Resources, Chromosome Engineering and Crop Improvement; CRC Press Inc: Boca Raton, FA, USA, 2007; p. 320. [Google Scholar]
- Camas, N; Cirak, C; Esendal, E. Seed yield, oil content and fatty acid composition of safflower (Carthamus tinctorius L.) grown in northern Turkey conditions. J. Fac. Agric., OMU 2007, 22, 98–104. [Google Scholar]
- Dajue, L; Mundel, HH. Safflower (Carthamus tinctorius L.); IPGRI: Rome, Italy, 1996; p. 83. [Google Scholar]
- Hamdan, YAS; Perez-Vich, B; Fernandez-Martinez, JM; Velasco, L. Inheritance of very high linoleic acid content and its relationship with nuclear male sterility in safflower. Plant Breed 2008, 127, 507–509. [Google Scholar]
- Khan, MA; von Witzke-Ehbrecht, S; Maass, BL; Becher, HC. Relationships among different geographical groups, agro-morphology, fatty acid composition and RAPD marker diversity in safflower (Carthamus tinctorius). Genet. Resour. Crop Evol 2008, 56, 19–30. [Google Scholar]
- Basha, SD; Francis, G; Makkar, HSP; Becker, K; Sujatha, M. A comparative study of biochemical traits and molecular markers for assessment of genetic relationships between Jatropha curcas L. germplasm from different countries. Plant Sci 2009, 176, 812–823. [Google Scholar]
- Li, P; Yangdong, W; Chen, Y; Zhang, SH. Genetic diversity and association of ISSR markers with the eleostearic content in tung tree (Vernicia fordii). Afr. J. Biotechnol 2009, 8, 4782–4788. [Google Scholar]
- Godwin, ID; Aitken, EAB; Smith, W. Application of inter simple sequence repeat (ISSR) markers to plant genetics. Electrophoresis 1997, 18, 1524–1528. [Google Scholar]
- Blair, MW; Panaud, O; Mccouch, SR. Inter-simple sequence repeat (ISSR) amplification for analysis of microsatellite motif frequency and fingerprinting in rice (Oryza sativa L.). Theor. Appl. Genet 1999, 98, 780–792. [Google Scholar]
- Jin, Z; Li, J. ISSR analysis on genetic diversity of endangered relic shrub Sinocalycanthus chinensis. Chin J. Appl. Ecol 2007, 18, 247–253. [Google Scholar]
- Pivoriene, O; Pasakinskiene, I; Brazauskas, G; Lideikyte, L; Jensen, LB; Lubberstedt, T. Inter-simple sequence repeat (ISSR) loci mapping in the genome of perennial ryegrass. Biologia 2008, 54, 17–21. [Google Scholar]
- Paterson, AH; Tanksley, SD; Sorrells, ME. DNA markers in plant improvement. Adv. Agron 1991, 46, 39–90. [Google Scholar]
- Dwiedi, S; Upadhyaya, HD; Hegde, MD. Development of core collection in safflower (Carthamus tinctorius L.) germplasm. Genet. Resour. Crop Evol 2005, 52, 821–830. [Google Scholar]
- Jaradat, AA; Shahid, M. Patterns of phenotypic variation in a germplasm collection of Carthamus tinctorius L. from the Middle East. Genet. Resour. Crop Evol 2006, 2, 129–140. [Google Scholar]
- Pascual-Villalobos, MJ; Alburquerque, N. Genetic variation of a safflower germplasm collection grown as a winter crop in southern Spain. Euphytica 1996, 92, 327–332. [Google Scholar]
- Rojas, R; Ruso, J; Osorio, J; Haro, A; Fernandez-Martinez, JM. Variability in protein and hull content of the seed of a world collection of safflower. Sesame Safflower Newsl 1993, 8, 122–126. [Google Scholar]
- Han, Y; Li, D. Evaluation of safflower (Carthamus tinctorious L.) germplasm-analysis in fatty acid composition of seeds of domestic and exotic safflower varieties. Bot. Res 1992, 6, 28–35. [Google Scholar]
- Chapman, MA; Hvala, J; Strever, J; Marvienko, M; Kozik, A; Michelmore, RW; Tang, S; Knapp, SJ; Burke, JM. Development, polymorphism, and cross-taxon utility of EST-SSR markers from safflower (Carthamus tinctorius L.). Theor. Appl. Genet 2009, 120, 85–91. [Google Scholar]
- Seghal, D; Raina, N. Genotyping safflower (Carthamus tinctorius L.) cultivars by DNA fingerprints. Euphytica 2005, 146, 67–76. [Google Scholar]
- Ash, GJ; Raman, R; Crump, NS. An investigation of genetic variation in Carthamus lanatus in New South Wales, Australia, using intersimple sequence repeats (ISSR) analysis. Weed Res 2003, 43, 208–213. [Google Scholar]
- Yang, YX; Wu, W; Zheng, YL; Chen, L; Liu, RJ; Huang, CY. Genetic diversity and relationships among safflower (Carthamus tinctorius L.) analyzed by inter-simple-sequence repeats (ISSRS). Genet. Resour. Crop Evol 2007, 54, 1043–1051. [Google Scholar]
- Sabzalian, MR; Mirlohi, A; Saeidi, G; Rabbani, MT. Genetic variation among populations of wild safflower, Carthamus oxyacanthus analyzed by agro-morphological traits and ISSR markers. Genet. Resour. Crop Evol 2009, 56, 1057–1064. [Google Scholar]
- Mahasi, MJ; Wachira, FN; Pathak, RS; Riungu, TC. Genetic polymorphism in exotic safflower (Carthamus tinctorius L.) using RAPD markers. J. Plant Breed. Crop Sci 2009, 1, 8–12. [Google Scholar]
- Amini, F; Saeidi, G; Arzani, A. Study of genetic diversity in safflower genotypes using agro-morphological traits and RAPD markers. Euphytica 2008, 163, 21–30. [Google Scholar]
- Naresh, V; Yamini, KN; Rajendrakumar, P; Kumar, VD. EST-SSR marker-based assay for the genetic purity assessment of safflower hybrids. Euphytica 2009, 170, 347–353. [Google Scholar]
- Fernandez-Martinez, JM; Rio, M; Haro, A. Survey of safflower (Carthamus tinctorius L.) germplasm for variants in fatty acid composition and other seed characters. Euphytica 1993, 69, 115–122. [Google Scholar]
- Cosge, B; Gurbuz, B; Kiralan, M. Oil content and fatty acid composition of some safflower (Carthamus tinctorius L.) varieties sown in spring and winter. Int. J. Nat. Eng. Sci 2007, 1, 11–15. [Google Scholar]
- Johnson, RC; Bergman, JW; Flynn, CR. Oil and meal characteristics of core and non-core safflower accessions from the USDA collection. Genet. Resour. Crop Evol 1999, 46, 611–618. [Google Scholar]
- Mantel, N. The detection of disease clustering and a generalized regression approach. Cancer Res 1967, 27, 209–220. [Google Scholar]
- American Oil Chemists’ Society (AOCS). Official Methods and Recommended Practices of the American Oil Chemists’ Society, 4th ed.; Method Ce 1–62; AOCS: Champaign, IL, USA, 1993. [Google Scholar]
- Murray, MG; Thampson, WF. Rapid isolation of high molecular weight plant DNA. Nucl. Acid Res 1998, 8, 4321–4325. [Google Scholar]
- Rohlf, M. NTSYSPC Numerical Taxonomy and Multivariate Analysis System, Version 202; Department of Ecology and Evaluation: State University of New York, NY, USA, 1998. [Google Scholar]
- Excoffer, L; Smouse, PE; Quattro, JM. Analysis of molecular variance inferred from metric distances among DNA haplotypes: Application to human mitochondrial DNA restriction sites. Genetics 1992, 131, 479–491. [Google Scholar]
- SAS Institute. SAS/STAT User’ Guide; Institute, Inc.: Cary, NC, USA, 1999. [Google Scholar]


| Source of variation | Mean Squares | ||||||||
|---|---|---|---|---|---|---|---|---|---|
| df | C16:0† | C18:0 | C18:1 | C18:2 | Oil (%) | Protein (%) | Ash (%) | Fiber (%) | |
| Replication | 2 | 0.89 * | 0.25 ** | 34.41 | 89.91 | 1.06 | 3.06 * | 0.001 | 0.47 |
| Genotype | 15 | 5.09 ** | 1.31 ** | 155.7 ** | 196.6 ** | 31.69 ** | 38.07 ** | 1.40 ** | 22.16 ** |
| Residual | 30 | 0.23 | 0.03 | 45.62 | 90.09 | 0.75 | 0.707 | 0.14 | 2.00 |
| Genotype | C16:0 † | C18:0 | C18:1 | C18:2 | Oil (%) | Protein (%) | Ash (%) | Fiber (%) |
|---|---|---|---|---|---|---|---|---|
| AC-Sunset | 7.90 | 1.52 | 19.50 | 71.56 | 29.36 | 22.80 | 2.70 | 39.83 |
| GE62918 | 7.29 | 2.94 | 18.20 | 70.56 | 25.54 | 20.10 | 1.80 | 41.10 |
| C111 | 9.61 | 2.60 | 15.95 | 72.61 | 27.37 | 18.50 | 2.51 | 41.40 |
| C4110 | 10.37 | 2.03 | 15.42 | 72.11 | 27.65 | 23.70 | 2.80 | 39.70 |
| ISF14 | 11.07 | 1.50 | 14.1 | 73.96 | 29.72 | 25.46 | 1.80 | 35.00 |
| A2 | 8.20 | 2.57 | 13.78 | 75.54 | 26.50 | 23.30 | 2.71 | 39.00 |
| K21 | 8.83 | 2.90 | 20.86 | 67.80 | 30.62 | 25.60 | 2.50 | 42.36 |
| ISF28 | 10.52 | 2.30 | 15.5 | 71.58 | 31.06 | 20.30 | 3.10 | 37.40 |
| IL.111 | 9.08 | 1.81 | 15.64 | 73.45 | 25.08 | 18.01 | 1.93 | 38.83 |
| Wht-ISF | 8.43 | 2.80 | 22.79 | 65.71 | 20.95 | 19.10 | 1.75 | 35.30 |
| Arak-2811 | 7.70 | 2.04 | 14.97 | 75.43 | 27.30 | 18.40 | 2.4 | 37.3 |
| Mex.7-38 | 7.96 | 2.93 | 35.28 | 53.83 | 26.81 | 21.30 | 2.64 | 38.50 |
| Mex.2-138 | 9.47 | 1.56 | 26.59 | 62.37 | 33.50 | 22.40 | 2.30 | 39.03 |
| Mex.22-191 | 7.30 | 1.86 | 35.26 | 55.82 | 32.65 | 17.55 | 1.03 | 34.80 |
| Mex.13-216 | 6.49 | 1.43 | 29.42 | 62.66 | 31.50 | 13.50 | 0.92 | 35.02 |
| Mex.17-45 | 8.30 | 2.40 | 18.77 | 70.83 | 31 | 14.30 | 1.00 | 33.01 |
| LSD0.01 | 1.08 | 0.41 | 15.16 | 21.3 | 1.95 | 1.88 | 0.85 | 3.17 |
| Genotypic variance | 1.62 | 0.42 | 36.68 | 35.5 | 10.31 | 12.45 | 0.42 | 6.72 |
| Phenotypic variance | 1.69 | 0.43 | 51.88 | 65.5 | 10.56 | 12.68 | 0.46 | 7.38 |
| Genotypic CV (%) | 14.5 | 24.5 | 29.15 | 8.71 | 11.24 | 17.36 | 30.33 | 6.82 |
| Phenotypic CV (%) | 14.8 | 24.9 | 34.69 | 11.8 | 11.35 | 17.26 | 31.75 | 7.13 |
| † C16:0 | C18:0 | C18:1 | C18:2 | Oil (%) | Protein (%) | Ash (%) | Fiber (%) | |
|---|---|---|---|---|---|---|---|---|
| C16:0 | 1 | |||||||
| C18:0 | −0.17 | 1 | ||||||
| C18:1 | −0.51 * | −0.02 | 1 | |||||
| C18:2 | 0.39 | −0.05 | −0.98 ** | 1 | ||||
| Oil | 0.05 | −0.50 * | 0.29 | −0.26 | 1 | |||
| Protein | 0.54 * | 0.09 | −0.27 | 0.19 | −0.03 | 1 | ||
| Ash | 0.48 * | 0.23 | −0.39 | 0.31 | −0.16 | 0.66 ** | 1 | |
| Fiber | 0.13 | 0.34 | −0.25 | 0.21 | −0.17 | 0.54 ** | 0.67 ** | 1 |
| Primer | Sequences | Total Number of Fragments | Number of Polymorphic Fragments | Polymor-Phism (%) |
|---|---|---|---|---|
| 1 | 3′-C(AG)8-5′ | 16 | 14 | 87 |
| 2 | 3′-(CCT)7H*V*H*-5′ | 9 | 7 | 77 |
| 3 | 3′-YC(AG)8-5′ | 11 | 9 | 81 |
| 4 | 3′-C(CA)8-5′ | 10 | 7 | 70 |
| 5 | 3′-GY(CA)8-5′ | 12 | 11 | 91 |
| 6 | 3′-CY(GA)8-5′ | 13 | 11 | 84 |
| 7 | 3′-GY(GA)8-5′ | 9 | 7 | 78 |
| 8 | 3′-YR-(CCT)5-5′ | 11 | 9 | 81 |
| 9 | 3′-(CCT)5H*V*H-5′ | 8 | 5 | 62 |
| 10 | 3′-GR(TC)8-5′ | 12 | 11 | 91 |
| 11 | 3′-(CCT)7B*D*B*-5′ | 8 | 5 | 62 |
| 12 | 3′-(CA)7D*B*D*-5′ | 9 | 5 | 55 |
| 13 | 3′-GY(CA)8-5′ | 11 | 10 | 90 |
| 14 | 3′-(CCT)5D*B*D*-5′ | 9 | 3 | 33 |
| 15 | 3′-C(GA)8-5′ | 5 | 3 | 60 |
| 16 | 3′-TY(GA)8-5′ | 14 | 12 | 85 |
| 17 | 3′-Y(AG)8-5′ | 12 | 3 | 25 |
| 18 | 3′-G(TC)8-5′ | 8 | 6 | 75 |
| 19 | 3′-GY(AG)8-5′ | 9 | 7 | 77 |
| 20 | 3′-TR(GT)8-5′ | 8 | 4 | 50 |
| Total | 204 | 149 | 73 | |
| Average | 10.2 | 7.45 |
| Principal Coordinate | Eigenvalue | Explained Variance (%) | Cumulative Variance (%) |
|---|---|---|---|
| 1 | 9.57 | 59.82 | 59.82 |
| 2 | 1.51 | 9.48 | 69.30 |
| 3 | 1.01 | 6.25 | 75.56 |
| Entry | Genotype | Origin |
|---|---|---|
| 1 | C111 | Selected line from Kouse landrace |
| 2 | C4110 | Selected line from Kouse landrace |
| 3 | ISF14 | Selected line from Isfahan landrace |
| 4 | A2 | Selected line from Azarbayjan landrace |
| 5 | K21 | Selected line from Kordestan landrace |
| 6 | ISF28 | Selected line from Isfahan landrace |
| 7 | IL.111 | Selected line from Auromyeh landrace |
| 8 | Wht-ISF | Selected line from Isfahan landrace |
| 9 | Arak-2811 | Selected line from Markazy landrace |
| 10 | AC-Sunset | Canada |
| 11 | GE62918 | Germany |
| 12 | Mex.7-38 | Mexico |
| 13 | Mex.2-138 | Mexico |
| 14 | Mex.22-191 | Mexico |
| 15 | Mex.13-216 | Mexico |
| 16 | Mex.17-45 | Mexico |
© 2011 by the authors; licensee MDPI, Basel, Switzerland. This article is an open-access article distributed under the terms and conditions of the Creative Commons Attribution license (http://creativecommons.org/licenses/by/3.0/).
Share and Cite
Golkar, P.; Arzani, A.; Rezaei, A.M. Genetic Variation in Safflower (Carthamus tinctorious L.) for Seed Quality-Related Traits and Inter-Simple Sequence Repeat (ISSR) Markers. Int. J. Mol. Sci. 2011, 12, 2664-2677. https://doi.org/10.3390/ijms12042664
Golkar P, Arzani A, Rezaei AM. Genetic Variation in Safflower (Carthamus tinctorious L.) for Seed Quality-Related Traits and Inter-Simple Sequence Repeat (ISSR) Markers. International Journal of Molecular Sciences. 2011; 12(4):2664-2677. https://doi.org/10.3390/ijms12042664
Chicago/Turabian StyleGolkar, Pooran, Ahmad Arzani, and Abdolmajid M. Rezaei. 2011. "Genetic Variation in Safflower (Carthamus tinctorious L.) for Seed Quality-Related Traits and Inter-Simple Sequence Repeat (ISSR) Markers" International Journal of Molecular Sciences 12, no. 4: 2664-2677. https://doi.org/10.3390/ijms12042664
APA StyleGolkar, P., Arzani, A., & Rezaei, A. M. (2011). Genetic Variation in Safflower (Carthamus tinctorious L.) for Seed Quality-Related Traits and Inter-Simple Sequence Repeat (ISSR) Markers. International Journal of Molecular Sciences, 12(4), 2664-2677. https://doi.org/10.3390/ijms12042664