Article

Effects of TiO2 Nanoparticle Doping on the Micro-Arc Oxidation Coating Structure and Corrosion Resistance of 6061 Aluminum Alloy

1
College of Mechanical and Electrical Engineering, Guangdong University of Science and Technology, Dongguan 523000, China
2
School of Mechanical and Electrical Engineering, Jiangxi University of Science and Technology, Ganzhou 341000, China
3
School of Materials Science and Engineering, Hunan University of Science and Technology, Xiangtan 411201, China
*
Authors to whom correspondence should be addressed.
Molecules 2026, 31(3), 468; https://doi.org/10.3390/molecules31030468
Submission received: 20 December 2025 / Revised: 21 January 2026 / Accepted: 26 January 2026 / Published: 29 January 2026

Abstract

To elucidate the effects of TiO2 nanoparticles on the microstructure and corrosion resistance of micro-arc oxidation (MAO) coatings formed on 6061 aluminum alloy, MAO coatings were prepared in a silicate-based electrolyte with varying TiO2 nanoparticle concentrations. The coating structure and properties were evaluated using a coating thickness gauge, surface profilometer, scanning electron microscopy (SEM), energy-dispersive X-ray spectroscopy (EDS), X-ray diffraction (XRD), X-ray photoelectron spectroscopy (XPS), and an electrochemical workstation. The results show that, with increasing TiO2 content, both coating thickness and surface roughness gradually increase, while the surface porosity first decreases and then increases. An appropriate amount of TiO2 effectively lowers the surface porosity and enhances coating compactness. The T1 condition exhibited the least precipitation of corrosion products during immersion tests and thus the best corrosion resistance. Compared to the untreated 6061 aluminum alloy substrate, the optimized coating demonstrated a reduction in corrosion current density (Jcorr) by more than one order of magnitude, reaching 1.127 × 10⁻⁶ A·cm−2, while its polarization resistance (Rp) increased by over one order of magnitude, attaining 3.558 × 10⁴ Ω·cm2. Furthermore, relative to the TiO2-free T0 coating, the Jcorr of the optimized coating was further reduced by approximately 2.5 times, with its Rp enhanced by about 2.3 times. XRD analysis indicated that the MAO coatings primarily consist of α-Al2O3 and γ- Al2O3. This study provides theoretical and experimental support for the application of TiO2 nanoparticles in MAO processes.

1. Introduction

Aluminum alloys, owing to their low density, excellent mechanical properties, favorable electrical and thermal conductivities, and outstanding formability, serve as core structural materials in automotive lightweighting, aerospace components, and electronic packaging [1,2,3,4]. However, their relatively low hardness, as well as inferior wear and corrosion resistance, limit their use in certain critical applications [5,6,7]. Toa overcome these limitations, various surface modification techniques have been developed, including mechanical treatment, laser surface processing, physical vapor deposition, chemical vapor deposition, anodizing, and micro-arc oxidation (MAO) [8,9,10,11,12,13]. MAO is widely employed to improve the performance and extend the service life of aluminum alloys due to its environmentally friendly, economical, and facile operation with low cost and minimal pollution. The core of MAO lies in forming a ceramic oxide layer firmly bonded to the substrate surface [14,15], thereby enhancing surface properties. Nevertheless, defects such as pores and microcracks generated during MAO can significantly reduce corrosion resistance and hinder further application [16,17].
Incorporating functional nanoparticles during MAO can increase coating density via pore-sealing effects, thereby improving performance [18,19]. For example, Zhang et al. [20] added MoS2 nanoparticles to a silicate electrolyte to fabricate wear-resistant and lubricious Al2O3/MoS2 nanocomposite coatings and found that MoS2 optimized the ceramic microstructure and improved wear resistance. Yu et al. [21] prepared black MAO ceramic coatings containing TiO2 nanoparticles on 6063 aluminum alloy, demonstrating that TiO2 increased coating thickness, reduced porosity, raised surface roughness, and markedly enhanced mechanical properties. Huang et al. [22] treated LY12 aluminum alloy in an electrolyte containing ZnO particles and found that ZnO suppressed coating damage and dissolution in high-salinity environments, significantly improving corrosion resistance.
Despite demonstrated potential, systematic process studies on the growth behavior and corrosion resistance of MAO coatings formed on 6061 aluminum alloy in silicate electrolytes with TiO2 nanoparticle addition remain limited. Moreover, prior analyses of coating microstructure often emphasize qualitative surface morphology, with relatively few reports quantitatively evaluating pore size and porosity.
Therefore, this study investigates the preparation of MAO coatings by doping TiO2 nanoparticles at varying concentrations in a silicate-based electrolyte, aiming to systematically explore the effect of doping levels on the structural and functional properties of the coatings. In this study, TiO2 nanoparticles were selected as the additive due to their superior multifunctional performance compared to traditional ceramic particles such as Al2O3 and SiO2 [23,24]. TiO2 nanoparticles not only act as a physical barrier, enhancing the compactness of the coating, but also, when doped at an appropriate concentration, contribute to increasing the oxidation voltage and intensifying the arc discharge effect. This promotes the formation of hard phases such as α-Al2O3 while suppressing the formation of large pores caused by excessive discharge. The selected TiO2 doping concentrations were determined based on preliminary feasibility tests and commonly reported effective doping ranges in the literature to ensure scientific rigor and comparability in the experimental design. In terms of performance expectations, the literature indicates that undoped MAO coatings on 6063 aluminum alloy typically exhibit relatively weak corrosion resistance in a 3.5% NaCl solution, with a corrosion current density of 3.44 × 10⁻⁶ A·cm−2 [25]. Building on this, the present work introduces TiO2 nanoparticles into the MAO process and employs image statistical methods to systematically quantify the surface pore size distribution of the coatings. By establishing correlations between pore size distribution, porosity, and electrochemical corrosion performance, this study aims to elucidate the regulatory mechanisms through which microstructure influences corrosion resistance. The findings are expected to provide both experimental evidence and theoretical insights for the development of high-performance MAO protective coatings.

2. Results

2.1. Evolution of Anodic Voltage

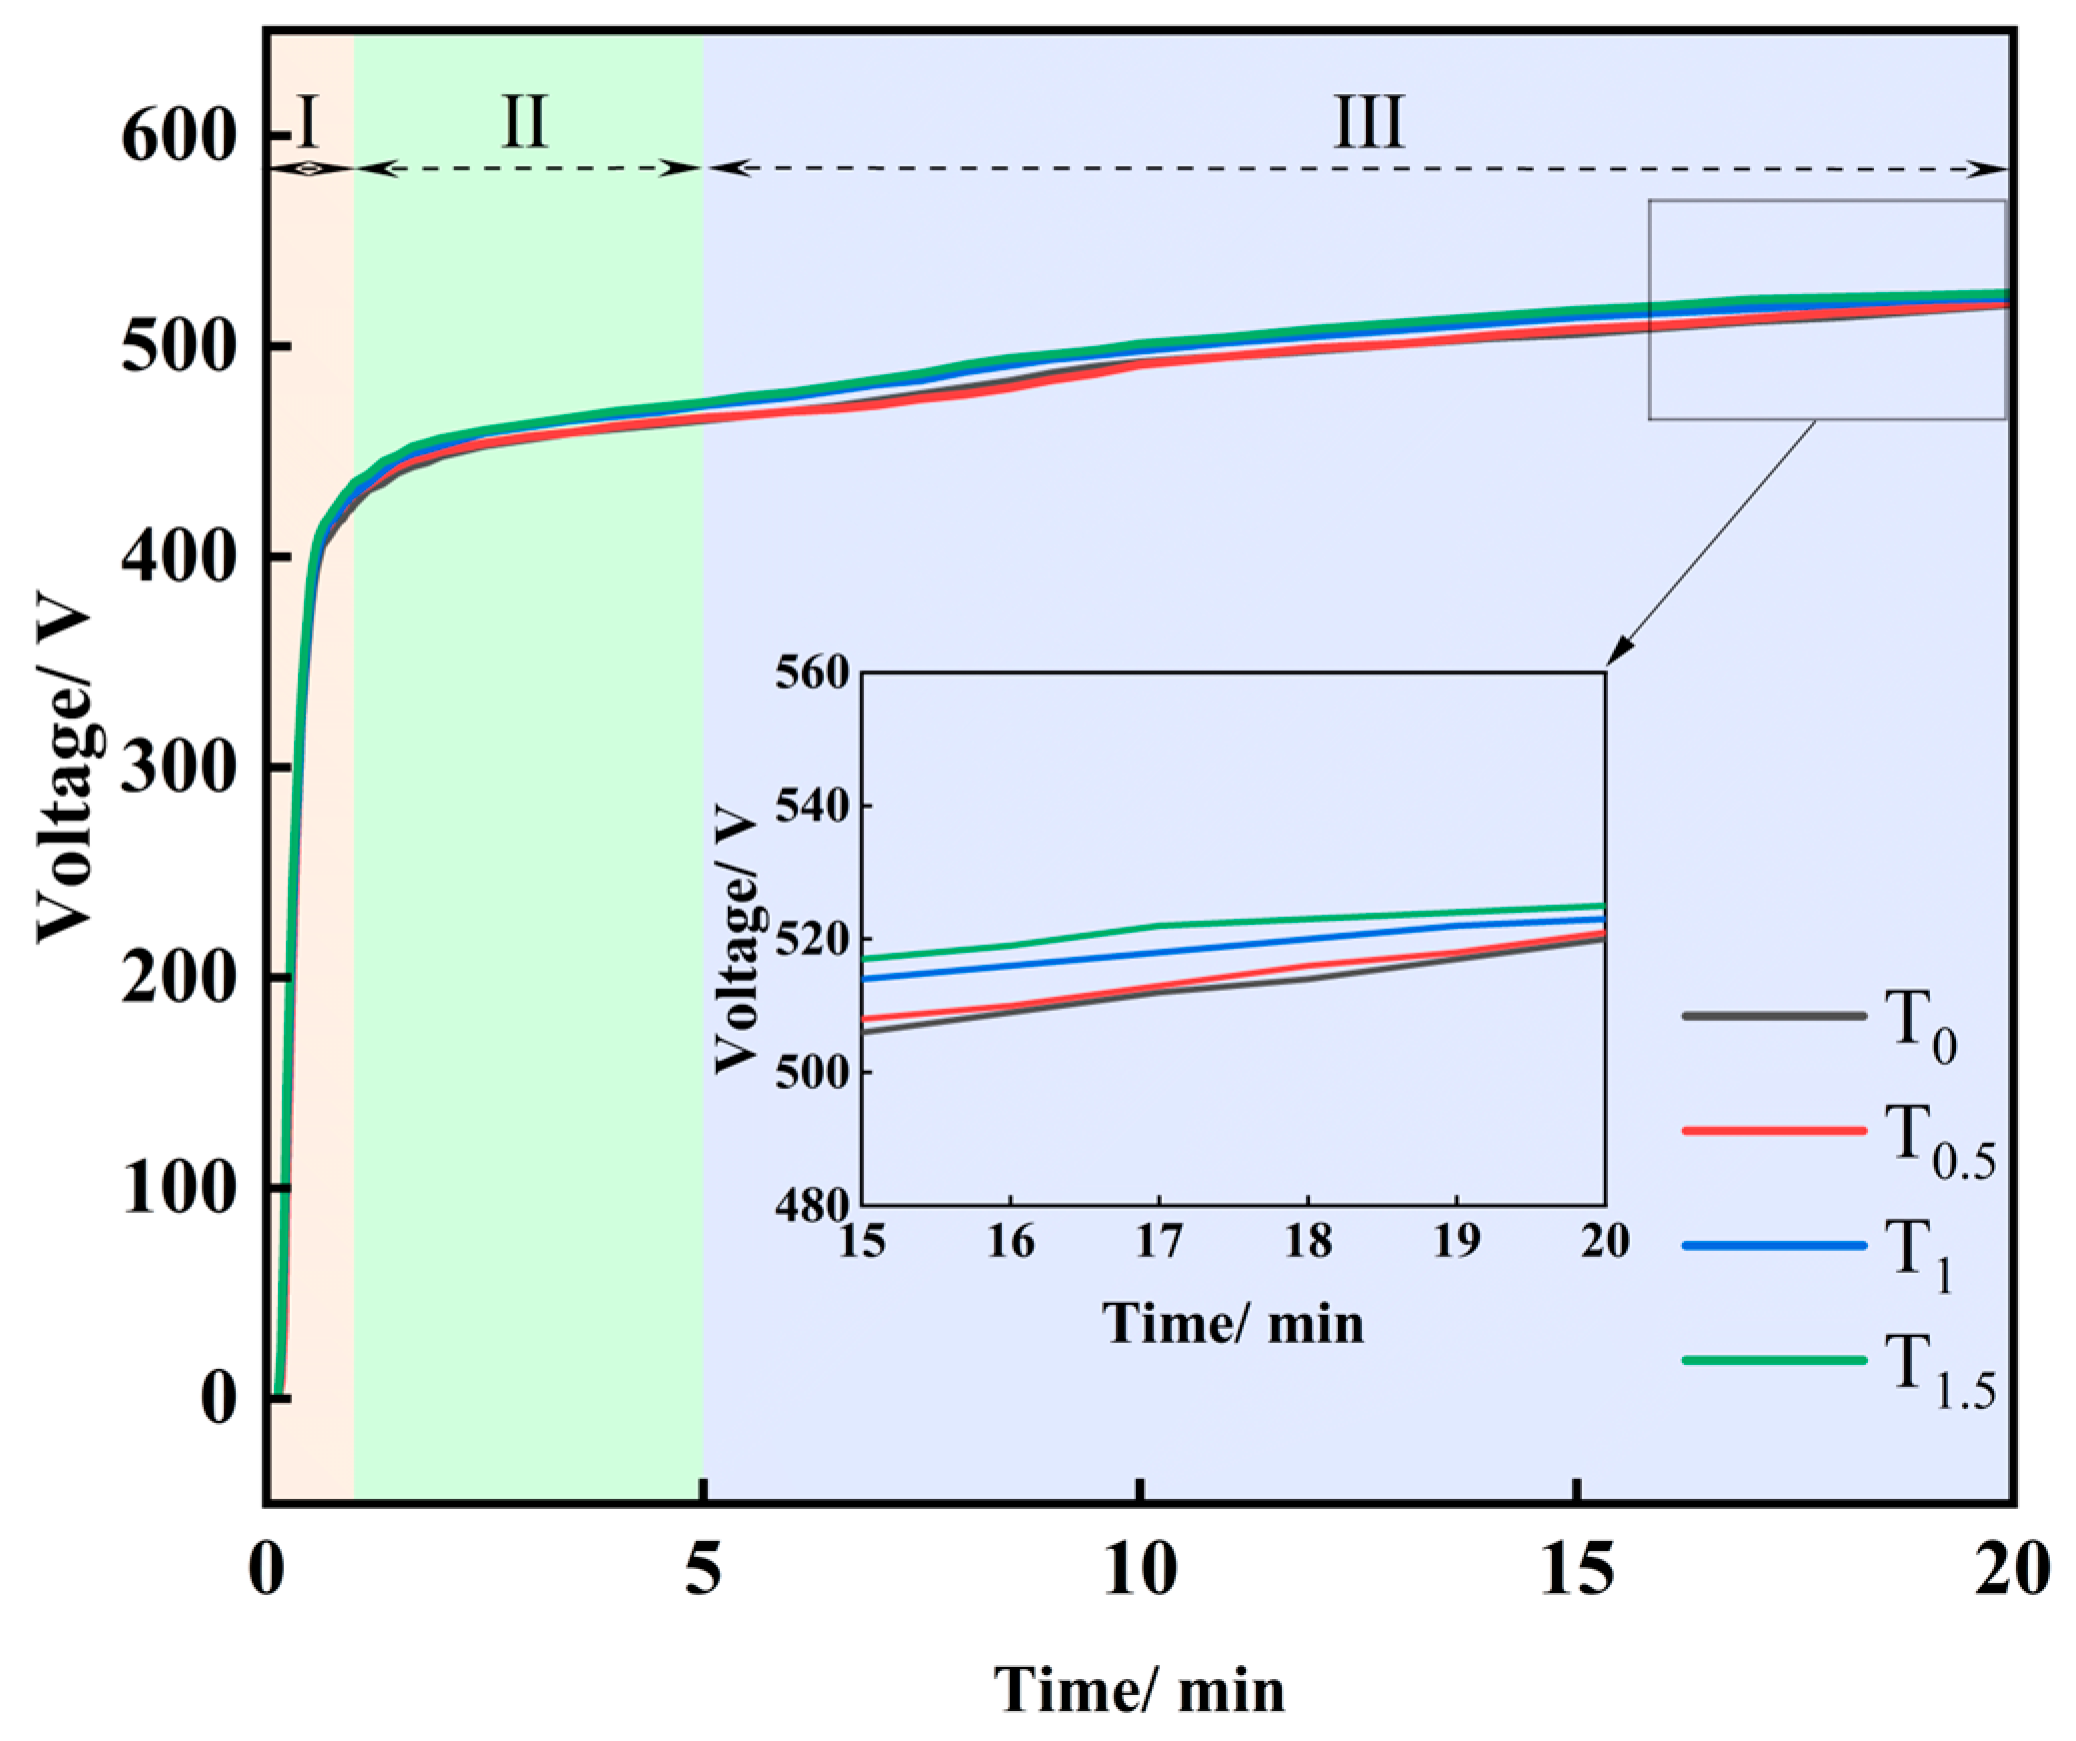
Figure 1 presents the anodic voltage versus time during MAO for different TiO2 loadings. All curves exhibit similar trends: the voltage rises with time, and a higher TiO2 concentration yields a higher final voltage. Three stages can be distinguished: anodizing, spark discharge, and micro-arc discharge. In the anodizing stage (first ~1 min), the voltage rapidly increases to ~400 V at ~400 V·min−1. In the spark discharge stage (1–5 min), the growth rate drops markedly to ~3% of that in the first stage. In the micro-arc stage (5–20 min), the voltage approaches a quasi-steady level with small fluctuations. As an electrical insulator, TiO2 decreases the electrolyte conductivity; increasing TiO2 loading raises the solution resistance and hinders ion transport. To maintain the set current, a higher voltage is required, leading to an increased final voltage.

2.2. Effects of TiO2 on Coating Thickness and Surface Roughness

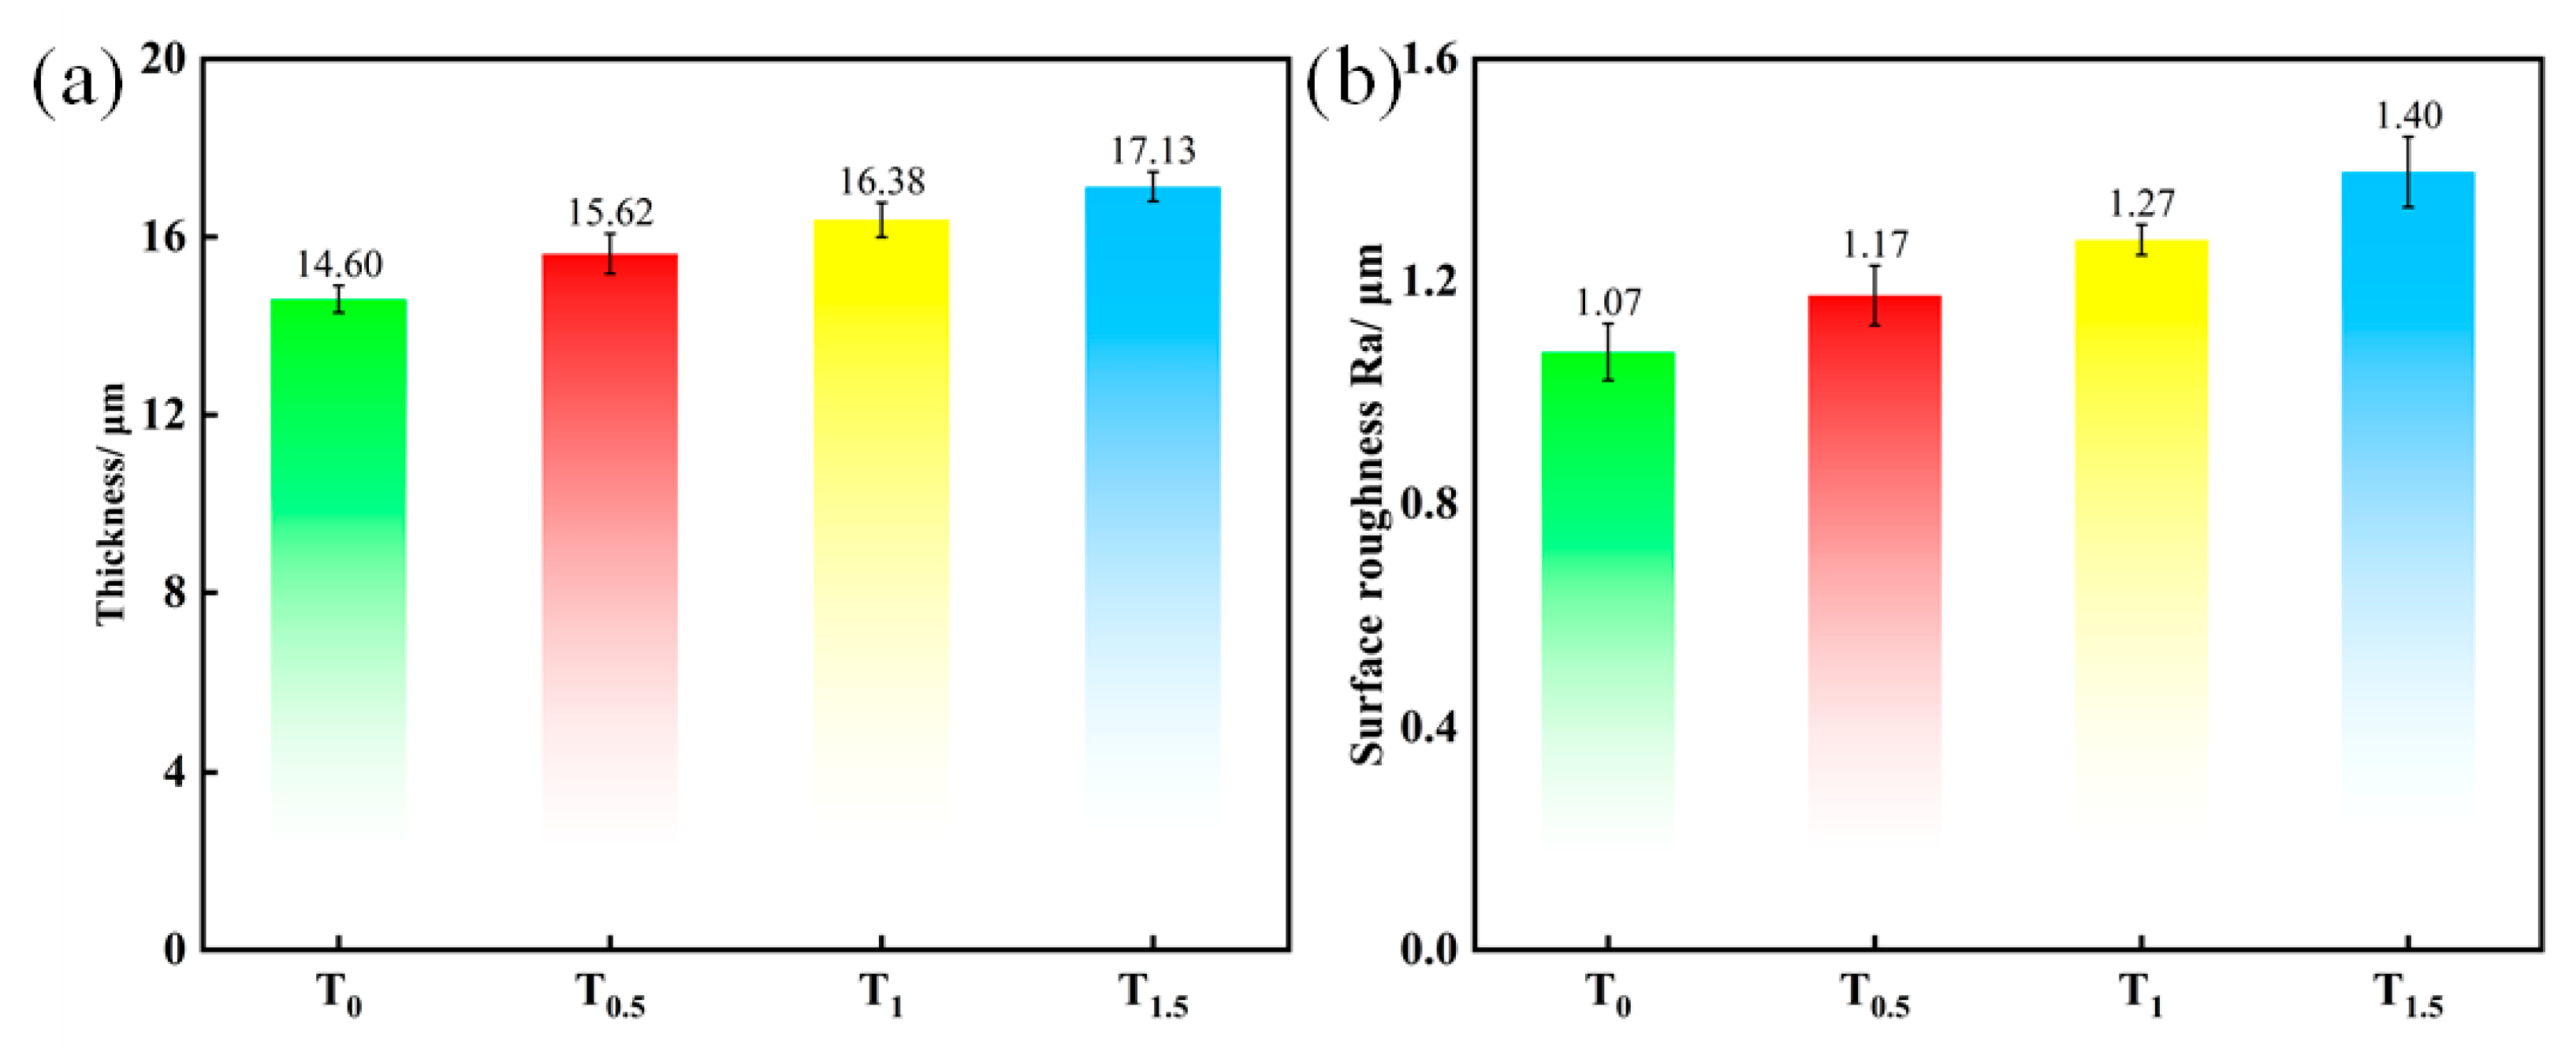
Figure 2 shows that coating thickness increases monotonically with TiO2 concentration, indicating a positive correlation. The minimum and maximum thicknesses are 14.60 μm (T0) and 17.13 μm (T1.5), respectively (Figure 2a). This thickening is attributed to (i) the high surface activity of TiO2 nanoparticles, which form charged colloids by ion adsorption and migrate under the electric field to the growing surface to participate in and promote MAO reactions, and (ii) the insulating nature of TiO2, which raises the electrolyte resistance and local field strength, thereby increasing discharge frequency, generating more molten oxide, and depositing it onto the surface to further build thickness [26].
Surface roughness also increases with TiO2 loading (Figure 2b), from 1.07 μm (T0) to 1.40 μm (T1.5). Under the high-temperature/high-pressure micro-arc discharges, TiO2 nanoparticles can agglomerate and deposit on the coating surface; some agglomerates are embedded into the molten oxide layer, producing local protrusions, degrading surface flatness, and increasing roughness [27].

2.3. Effects of TiO2 on Surface Micro-Morphology

2.3.1. Surface Morphology

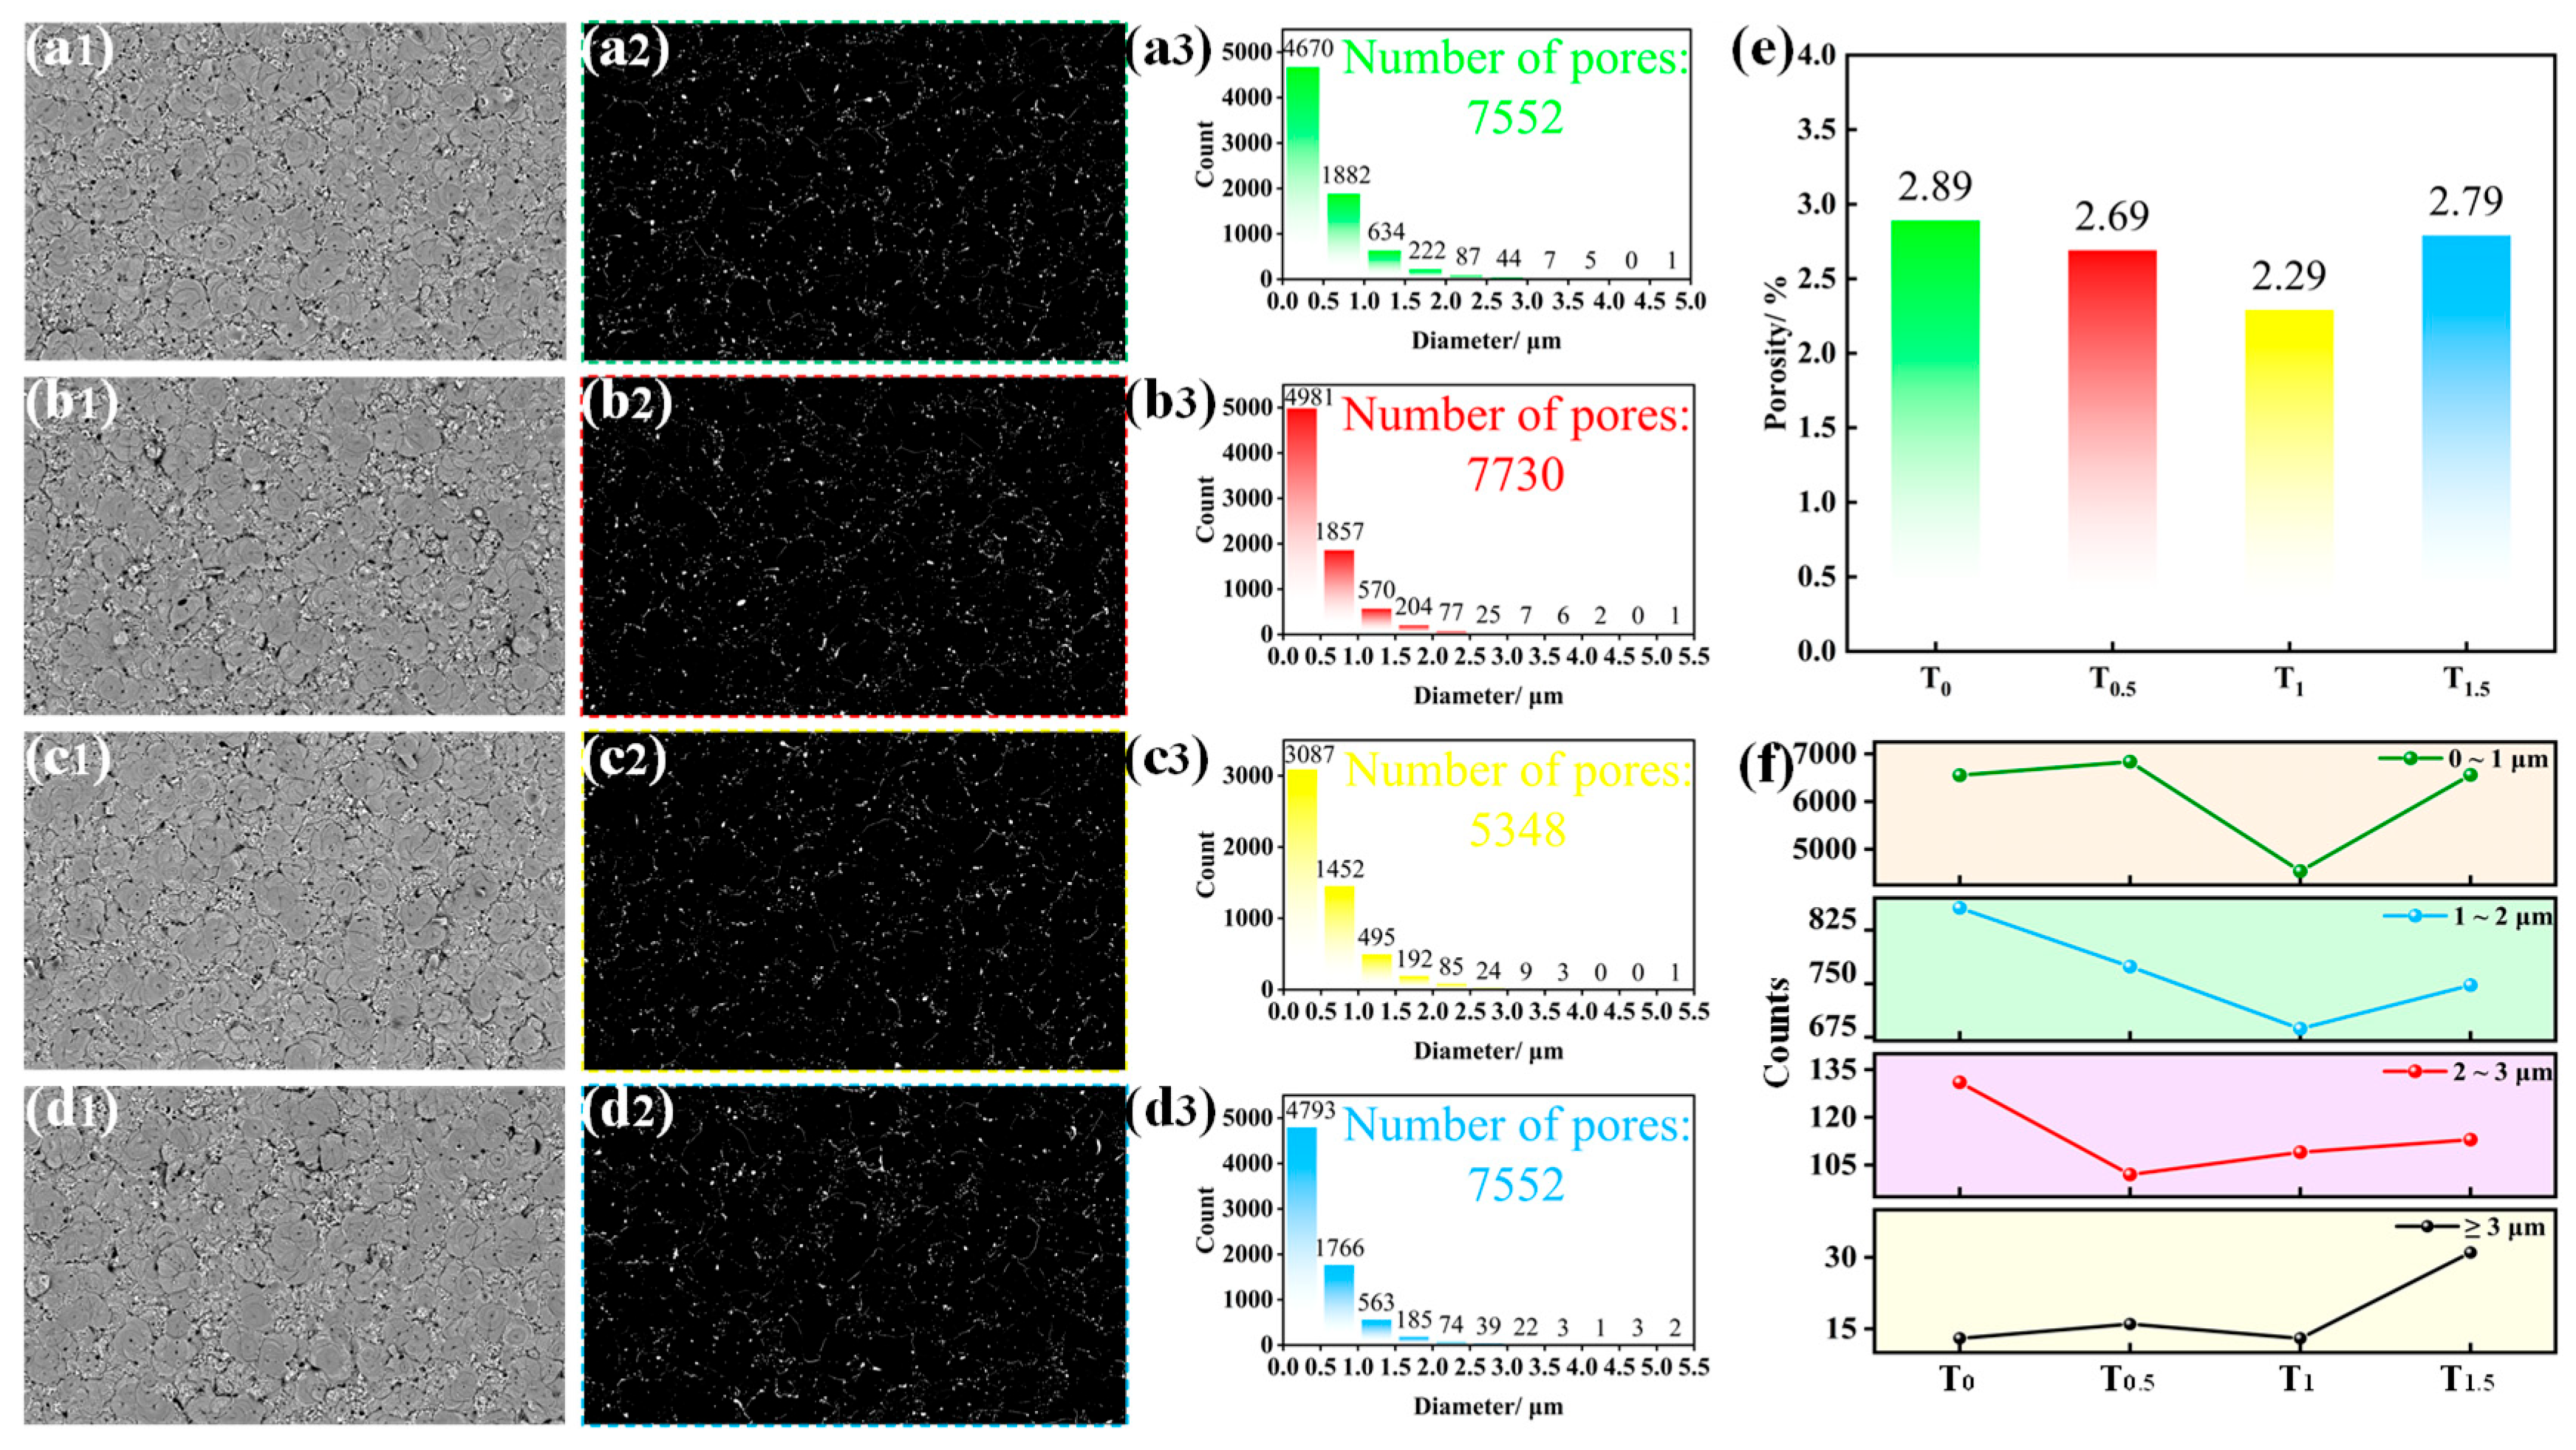
Figure 3 presents the SEM surface morphologies and corresponding porosity data of micro-arc oxidation (MAO) coatings prepared with different amounts of doped TiO2 nanoparticles. As shown in Figure 3(x1) (where x = a, b, c, d), all MAO coatings exhibit uneven surfaces characterized by numerous crater-like pores. These pores are surrounded by pancake-like sintered regions, and the surfaces farther from the pores appear relatively rough, accompanied by a small number of micro-cracks. This characteristic morphology results from the following process: during the plasma arc discharge, numerous micropores known as “discharge channels” form. The high-temperature environment within these channels facilitates the rapid MAO reaction between aluminum and oxygen, producing Al2O3. Concurrently, the gas pressure and discharge pressure generated by the reaction increase sharply, ejecting molten Al2O3 from the discharge channels. This ejected molten Al2O3 is rapidly quenched and solidified upon contact with the surrounding electrolyte, eventually accumulating to form the “volcanic crater-like” protrusions.
To investigate the surface morphology of the coatings in greater detail, the surface porosity and pore size distribution were calculated and statistically analyzed. Figure 3(x2) (x = a, b, c, d) show the porosity measurement maps, Figure 4(x3) (x = a, b, c, d) illustrate the pore size distributions, and Figure 3e summarizes the surface porosity of the various MAO coatings. As observed in Figure 3(x3), the pore diameters predominantly fall within the range of 0–3 μm, with only a minority exceeding 3 μm. Furthermore, the number of pores decreases as their size increases. Figure 3e reveals that the surface porosity initially decreases and then increases with higher amounts of doped TiO2 nanoparticles. Specifically, the maximum and minimum porosity values are 2.98% (T0) and 2.29% (T1), respectively. The minimum porosity for the T1 coating is likely attributable to the partial filling of micropores and micro-cracks by an appropriate quantity of nanoparticles. Figure 3f compares the distribution of pores across different size ranges for each coating. The T1 coating demonstrates the lowest number of pores within the 0–1 μm, 1–2 μm, and >3 μm ranges, while also showing a relatively low count within the 2–3 μm range.
The addition of TiO2 nanoparticles to the electrolyte led to a reduction in the pore size of the MAO coatings. This reduction was particularly pronounced for the T1 coating, where TiO2 nanoparticles effectively filled some of the micropores and micro-cracks. However, with a further increase in TiO2 nanoparticle doping, the pore size gradually increased. This trend is likely due to the agglomeration and stacking of excessive TiO2 particles, resulting in prominent surface protrusions. This phenomenon can be explained as follows: with an appropriate amount of doped TiO2 nanoparticles, the localized high temperatures generated during the MAO process instantly melt a portion of the nanoparticles. Upon contact with the electrolyte, the molten TiO2 rapidly cools and solidifies, adhering to the gaps in the oxide coating. These solidified particles act as heterogeneous nucleation sites for the molten oxide, thereby reducing the size of the micropores in the surface’s porous layer. Furthermore, the size effect of the nanoparticles causes the electric field in the electrolyte to concentrate around them, making discharge channels more prone to form in the vicinity of the particles and resulting in higher discharge intensity. As the concentration of doped TiO2 nanoparticles increases, these intense and dispersed discharges generate a greater number of molten oxide regions. However, excessive TiO2 nanoparticles tend to agglomerate and stack upon embedding into the molten oxide, hindering its fluidity. This impediment prevents the molten material from adequately filling the pores, ultimately affecting the coating’s microstructure.

2.3.2. EDS Analysis

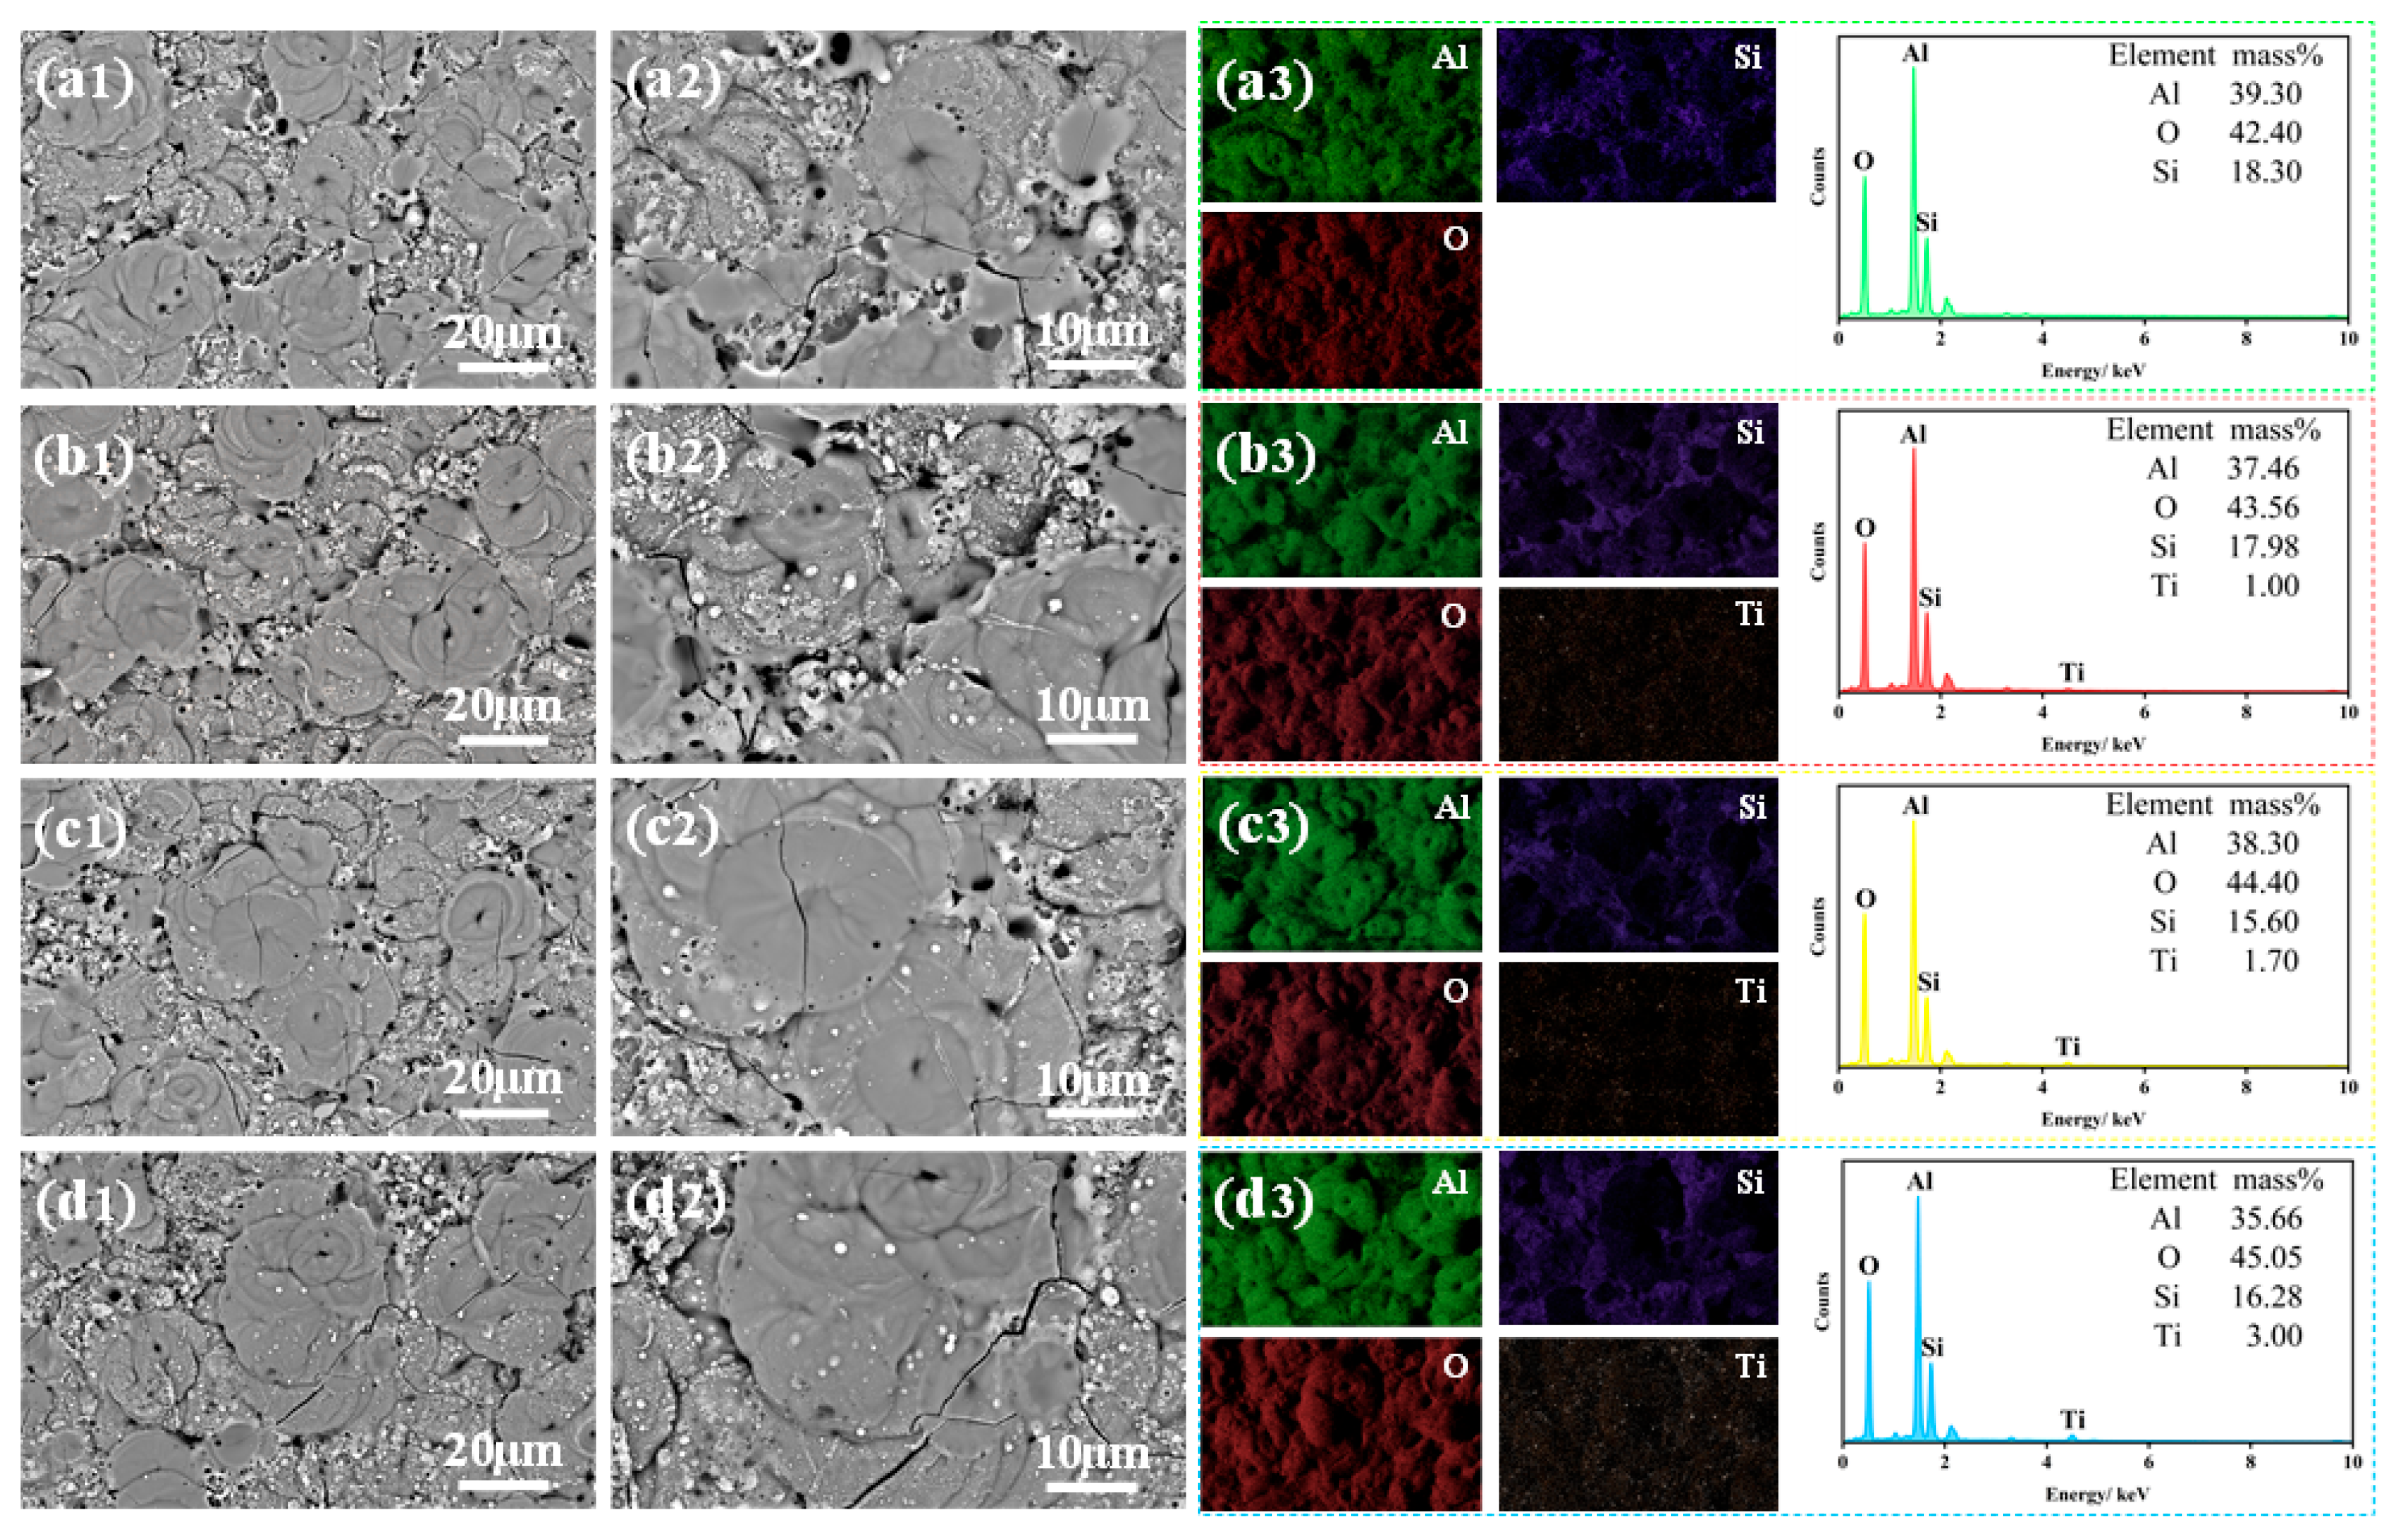
Figure 4 shows the effect of TiO2 nanoparticle doping amount on the surface morphology and corresponding elemental distribution of the MAO coatings. The EDS mapping in Figure 4 reveals that after doping with TiO2 nanoparticles, the Ti element is uniformly distributed on the coating surface without significant agglomeration. This observation indicates that the amount of doped TiO2 nanoparticles has little influence on the uniformity of Ti element distribution. This phenomenon may be attributed to the random contact of TiO2 nanoparticles with the coating surface facilitated by the water-cooled circulation system. Concurrently, the electric arcs generated during the MAO process continuously move across the entire coating surface. This movement allows TiO2 nanoparticles to enter the plasma micro-arc zones through the discharge channels. Within these high-temperature zones, the nanoparticles undergo sintering and combine with the Al2O3 formed on the MAO surface to generate the ceramic layer.
Figure 4 also presents the contents of Al, O, Si, and Ti elements in the coatings with different TiO2 nanoparticle doping amounts. It can be observed that the Ti content in the coating gradually increases with a higher amount of doped TiO2 nanoparticles. In contrast, the influence of TiO2 nanoparticle doping on the Al, O, and Si element contents is relatively minor. The O content shows a slight overall increasing trend, while the Al and Si contents exhibit a slight decreasing trend. This phenomenon may be explained as follows: under the anodic current, the aluminum alloy substrate, acting as the anode, is oxidized to generate Al3+ ions. These ions migrate away from the substrate surface driven by the electric field force. As the doping amount of TiO2 nanoparticles increases, more TiO2 incorporates into the coating, leading to a gradual rise in Ti content. Simultaneously, the TiO2 nanoparticles may inhibit the contact between molten Al2O3 and Na2SiO3 in the electrolyte, thereby suppressing the incorporation of silicate species ( SiO 3 2 ) into the coating and resulting in a decrease in Si content.

2.4. Effect of TiO2 on Coating Cross-Sectional Morphology

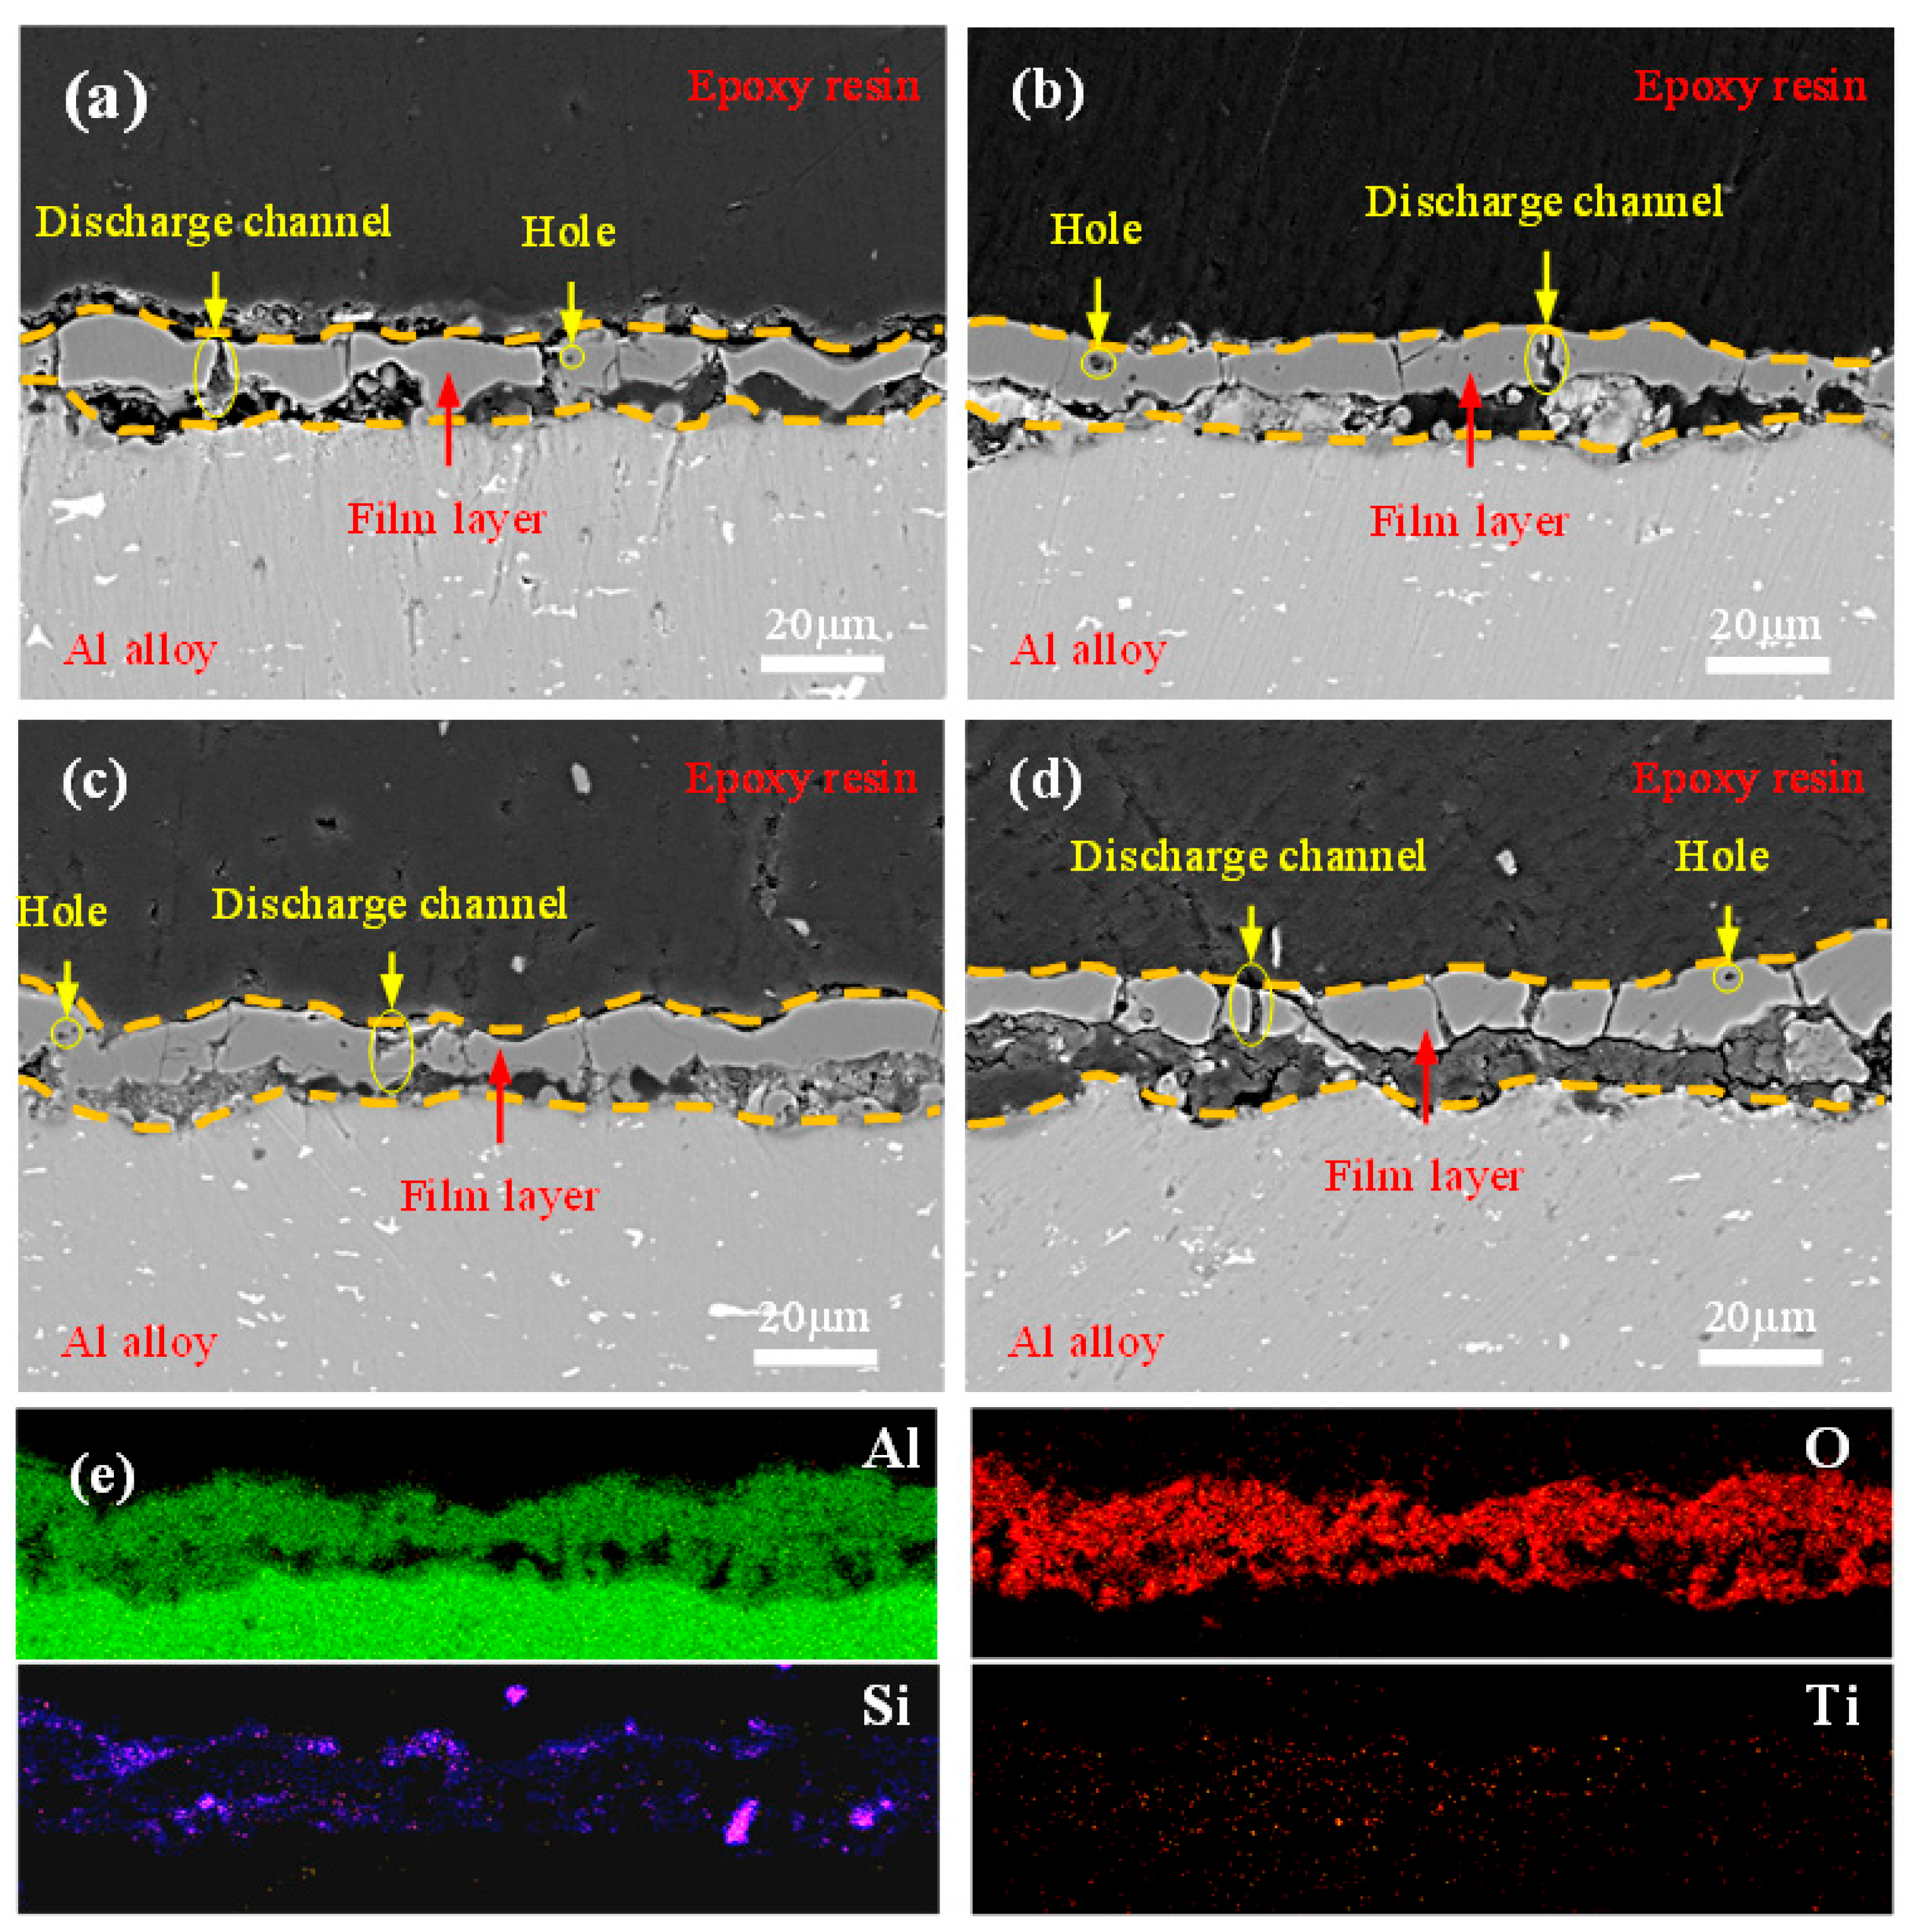
Figure 5 presents cross-sectional SEM morphologies of MAO coatings prepared with different amounts of doped TiO2 nanoparticles, along with EDS elemental mapping of the T1 coating cross-section. As shown in Figure 5, pores formed by arc discharges are present within all coatings. However, all coatings exhibit a tight bond with the substrate, demonstrating a typical metallurgical bonding interface. The coating thickness gradually increases with a higher amount of doped TiO2 nanoparticles, which is consistent with the results from Figure 2a. Specifically, the T0 coating contains numerous discharge channels. Although the coating is continuous, it is not sufficiently dense, as visible in Figure 5a. With an increased doping amount (T0.5), the coating thickness grows further. While some fine pores appear within the coating, its continuity and density are significantly improved, as seen in Figure 5b. The continuity and density of the T1 coating are further enhanced, with only a few discharge channels remaining within its structure, as shown in Figure 5c. However, for the T1.5 coating, despite a further increase in thickness, the discharge channels become noticeably larger, and the internal pores also increase in size, as evident in Figure 5d. Among all samples, the T1 coating exhibits the most optimized internal structure. This structural evolution can be explained as follows: doping the electrolyte with an appropriate amount of TiO2 nanoparticles increases its electrical resistance, leading to a higher electric field intensity. This, in turn, promotes more uniform and intensive arc discharges. The enhanced discharges facilitate the generation of a greater volume of molten material, which deposits on the coating surface, thereby filling and repairing defects such as micropores and microcracks, ultimately improving coating quality. Conversely, when the doping amount exceeds a critical value, excessive nanoparticles tend to agglomerate during their incorporation into the molten oxide. This agglomeration hinders the fluidity of the molten material, making it difficult to fill the pores effectively.
To investigate the distribution of TiO2 nanoparticles within the coating, cross-sectional EDS analysis was performed on the T1 coating, with results presented in Figure 5e. The analysis indicates that Al, O, Si, and Ti elements are uniformly distributed across the coating cross-section, which is attributed to the dense microstructure of the coating. This uniform elemental distribution provides robust structural support for the formation of discharge channels.

2.5. Effect of TiO2 on Phase Composition of the Coatings

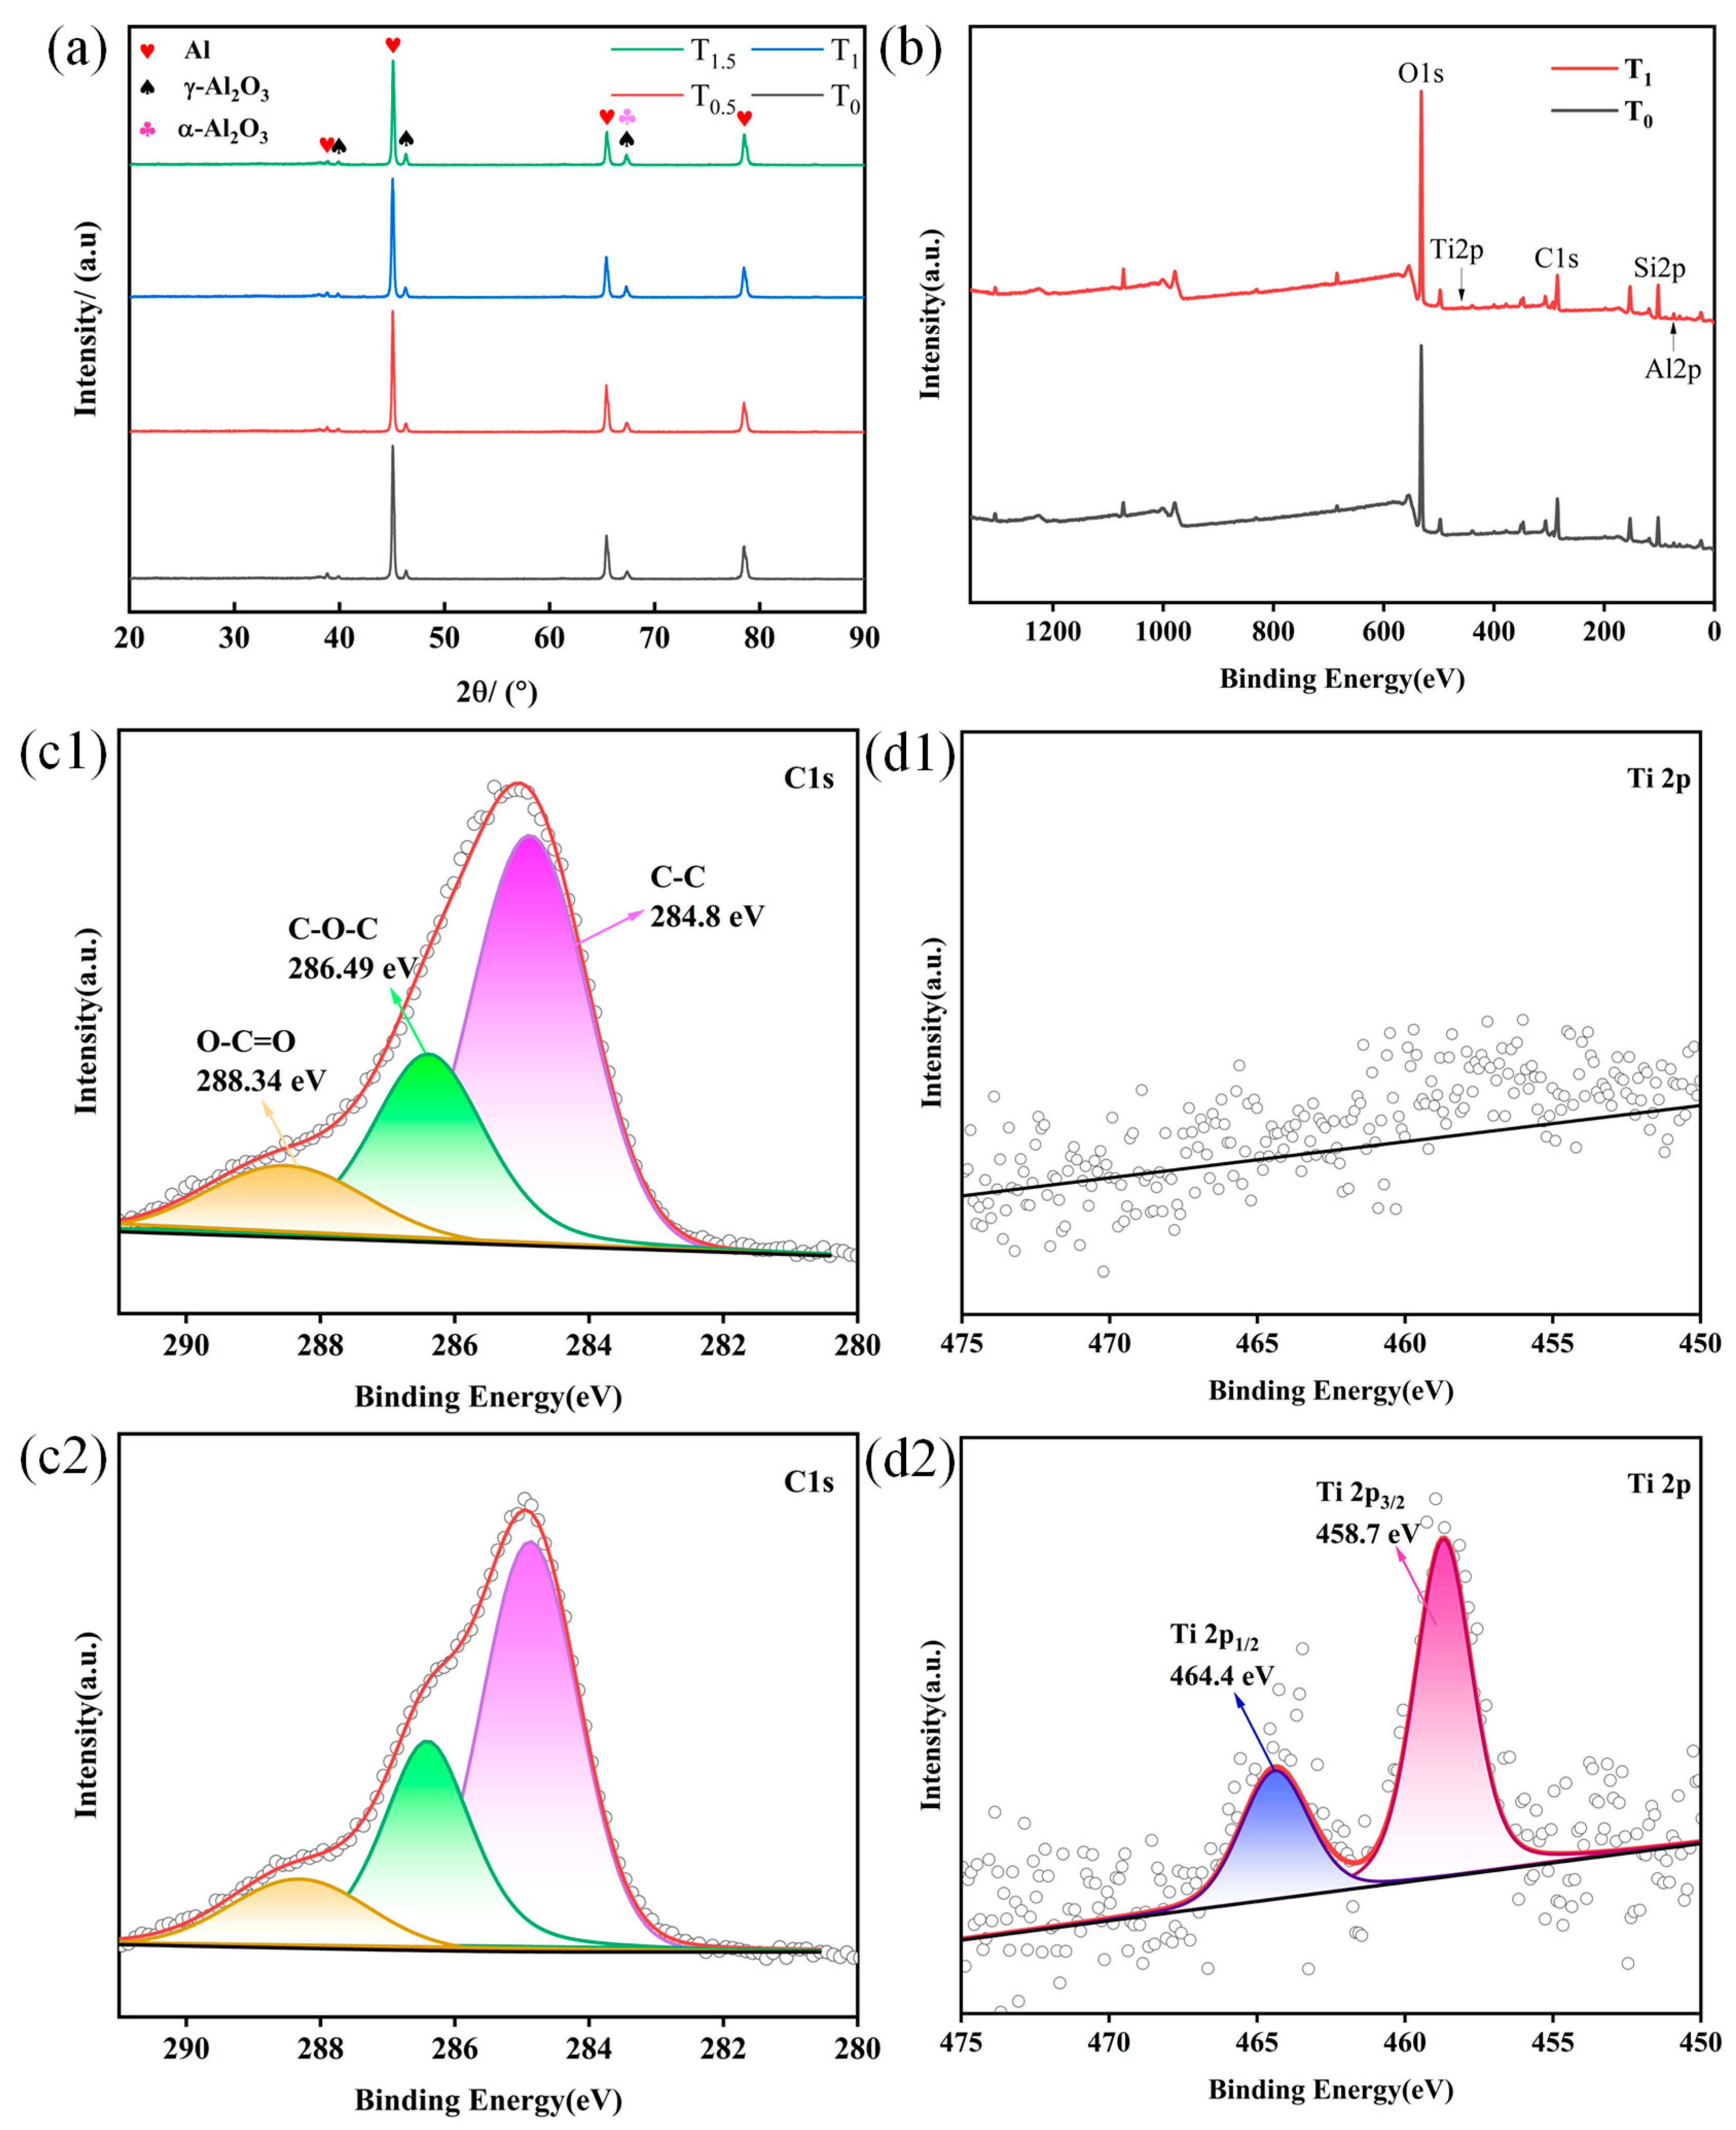
Figure 6 presents the XRD patterns of MAO coatings prepared with different amounts of doped TiO2 nanoparticles, along with the XPS survey spectra and high-resolution C 1 s and Ti 2p spectra for the T0 and T1 coatings. As shown in Figure 6a, the MAO coatings are primarily composed of α-Al2O3 and γ-Al2O3 phases, regardless of the TiO2 nanoparticle concentration. With increasing TiO2 doping, the intensity of the diffraction peaks corresponding to the aluminum substrate gradually decreases. In contrast, the intensities of the peaks for the α- Al2O3 and γ- Al2O3 phases show an opposite trend relative to the Al substrate peak. Overall, the variation in the intensity of these characteristic peaks with increasing doping amount is relatively minor. No distinct TiO2 phase was detected in the XRD patterns. The highly uniform dispersion of the as-fabricated TiO2 nanoparticles (5–10 nm) within the composite coating contributes to the absence of distinct TiO2 crystalline phase peaks in the XRD patterns under the present experimental conditions. This can be attributed to two interrelated factors. First, the crystallite size approaches the lower detection limit of conventional XRD for nanocrystalline phases. Second, the low concentration and highly dispersed state of the nanoparticles within the coating further attenuate the cumulative intensity of the characteristic diffraction signals.
To verify the presence of Ti, XPS analysis was performed. The XPS survey spectra in Figure 6b confirm the presence of Al, O, Si, and Ti elements, which is consistent with the EDS results (Figure 4). The detected C element is attributed to atmospheric contamination. The high-resolution C 1 s spectra for both T0 and T1 coatings Figure 6(c1,c2) can be deconvoluted into three peaks at binding energies of 284.8 eV, 286.49 eV, and 288.34 eV. These are assigned to C-C, C-O-C, and O-C=O bonds, respectively [28]. Figure 6(d1,d2) show the high-resolution Ti 2p XPS spectra for the T0 and T1 coatings, respectively. The spectrum for the T1 coating, which contains doped TiO2, displays two characteristic peaks at binding energies of 458.7 eV and 464.4 eV. These correspond to the Ti 2p3/2 and Ti 2p1/2 orbitals, respectively, with a spin–orbit splitting energy of 5.7 eV [29]. The presence of these Ti signals suggests the successful incorporation of TiO2 nanoparticles into the MAO coating.

2.6. Effect of TiO2 on the Corrosion Resistance of the Coatings

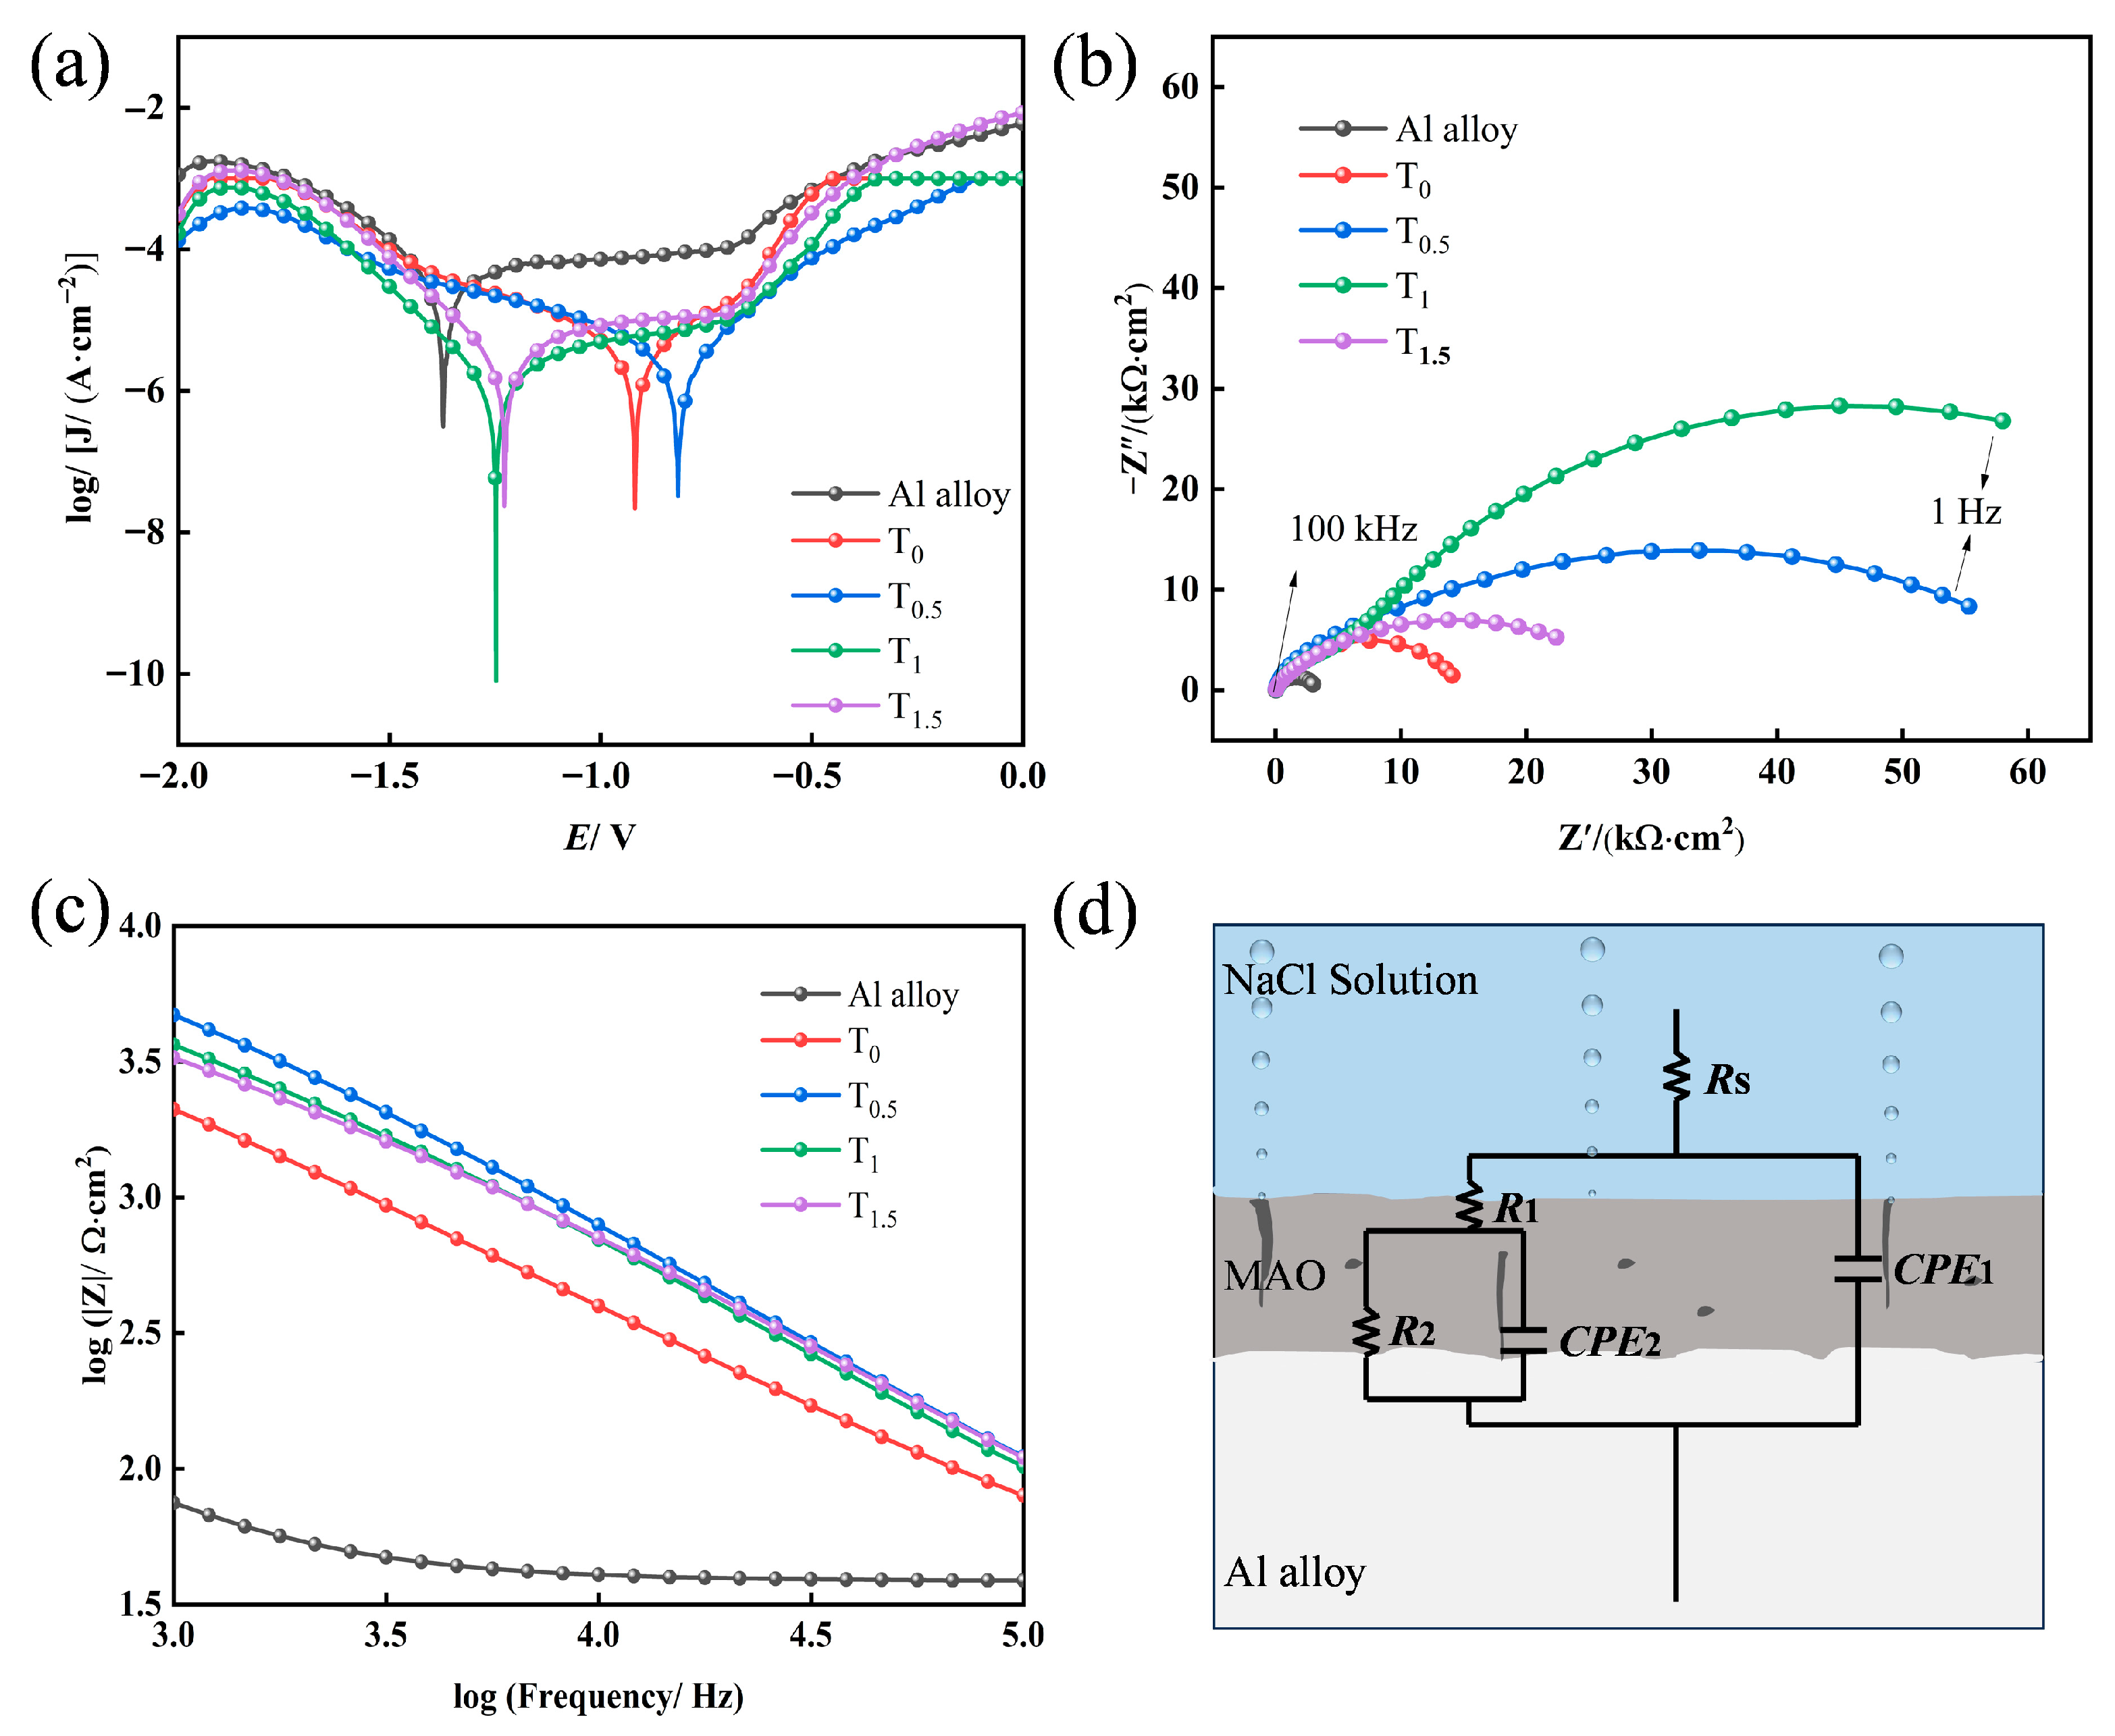
Figure 7 shows the potentiodynamic polarization curves and electrochemical impedance spectroscopy (EIS) with the corresponding equivalent circuit model for MAO coatings prepared with different amounts of doped TiO2 nanoparticles, tested in a 3.5 wt% NaCl solution. The electrochemical parameters derived from fitting the polarization curves are listed in Table 1. In MAO coatings, Ecorr may fluctuate due to surface conditions (e.g., porosity, phase composition). However, a significant decrease in Jcorr coupled with a substantial increase in Rp indicates a substantial improvement in corrosion resistance. Tafel extrapolation analysis yielded corrosion current densities (Jcorr) of 2.911 × 10⁻⁶, 1.835 × 10⁻⁶, 1.127 × 10⁻⁶, and 2.744 × 10⁻⁶ A·cm−2 for the T0, T0.5, T1, and T1.5 coatings, respectively. In comparison, the bare substrate exhibited a significantly higher Jcorr of 2.446 × 10⁻⁵ A·cm−2. These results suggest that the MAO treatment significantly enhances corrosion resistance. Notably, the T1 coating demonstrated the best performance, with its polarization resistance (Rp) showing an approximately 130% increase compared to the T0 coating, indicating that an optimal doping amount further enhances corrosion resistance.
To gain deeper insight into the effect of TiO2 nanoparticle doping on corrosion behavior, EIS analysis was conducted. The Nyquist plots for the different coatings are presented in Figure 7b, The local high-frequency Bode plots for the different coatings are presented in Figure 7c, and the fitted equivalent circuit model is shown in Figure 7d. The corresponding fitting parameters are summarized in Table 2. The equivalent circuit consists of: Rs (the resistance of the 3.5% NaCl solution), CPE1(Y1, n1) and R1 (the constant phase element and resistance associated with the porous outer layer of the MAO coating), and CPE2(Y2, n2) and R2 (the constant phase element and charge transfer resistance associated with the dense inner layer/substrate interface). The corrosion resistance of the samples in the solution can be qualitatively assessed by the diameter of the capacitive loop in the Nyquist plot. A larger loop radius corresponds to a lower corrosion rate and a stronger barrier capability against corrosive media. As seen in Figure 7b, the diameter of the capacitive loop initially increases and then decreases with higher TiO2 nanoparticle doping, with the T1 coating exhibiting the largest radius. This suggests that the T1 coating possesses the best corrosion resistance among the series. As can be seen from Figure 7c, although the impedance modulus (log∣Z∣) of T0.5 is slightly higher than that of T1 in the high-frequency region, the arc radius of T1 in the low-frequency Nyquist plot exceeds that of T0.5. Given that low-frequency impedance primarily reflects charge transfer resistance, which is directly related to the long-term barrier capability of the coating against the penetration of corrosive media, the superiority of T1 in the low-frequency range indicates its enhanced long-term protective performance. This allows for more effective inhibition of corrosion reactions. The corrosion resistance of the coatings is fundamentally governed by the protective quality of the dense inner layer, which is reflected by the resistance R2. A higher R2 value indicates a greater ability of the coating to resist the penetration of corrosive electrolytes. As listed in Table 2, the T1 sample exhibits the highest R2 value, signifying that it presents the greatest resistance to the ingress of corrosive ions, thereby offering superior corrosion protection. This conclusion is consistent with the results obtained from the polarization curve analysis.
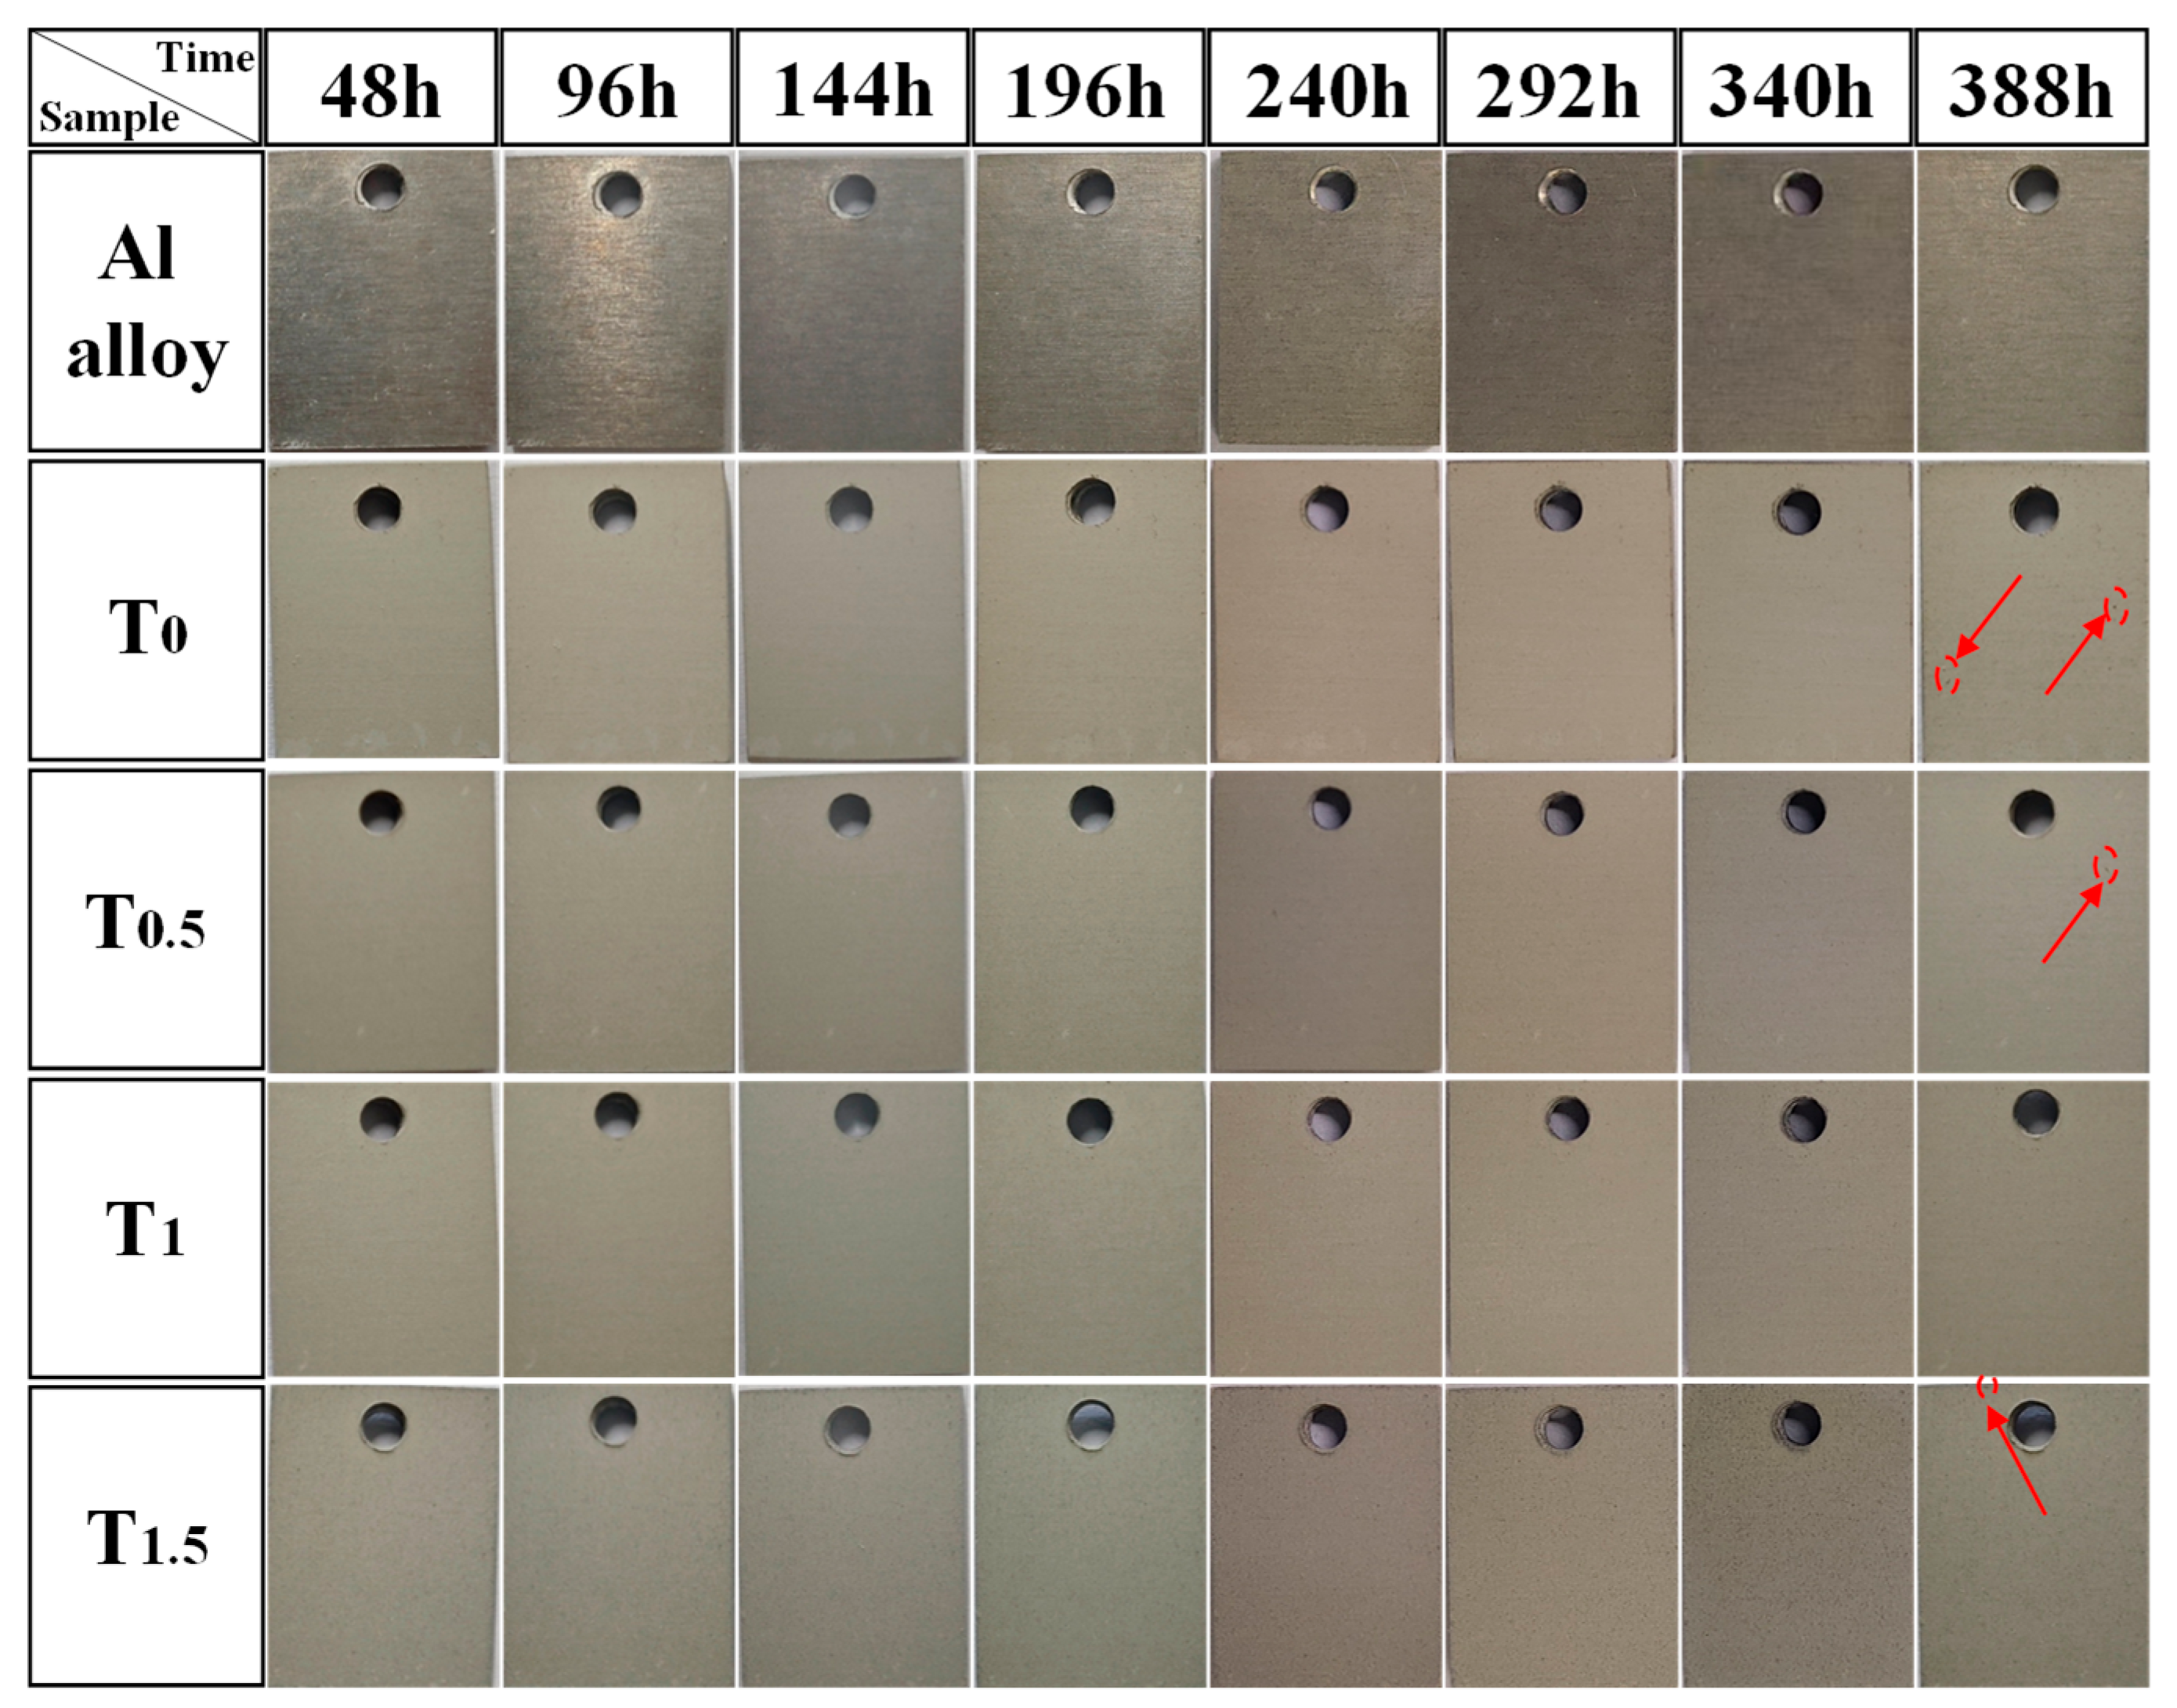
To further investigate the corrosion resistance of the MAO coatings, immersion tests were conducted by exposing different samples to a 3.5 wt% NaCl solution. The macroscopic surface morphologies of the samples after immersion are shown in Figure 8. As observed in Figure 8, after 144 h of immersion, the metallic luster of the bare 6061 aluminum alloy completely disappeared, and its surface exhibited dull, slight corrosion marks. The T0, T0.5, and T1.5 samples showed minor pitting corrosion after 388 h. Throughout the entire immersion test, no obvious corrosion pits were observed on the T1 coating. These results indicate that the T1 coating possesses the best corrosion resistance among all tested samples. This superior performance is attributed to the low porosity and high density of the T1 coating, which together effectively enhance its barrier properties against corrosive media.
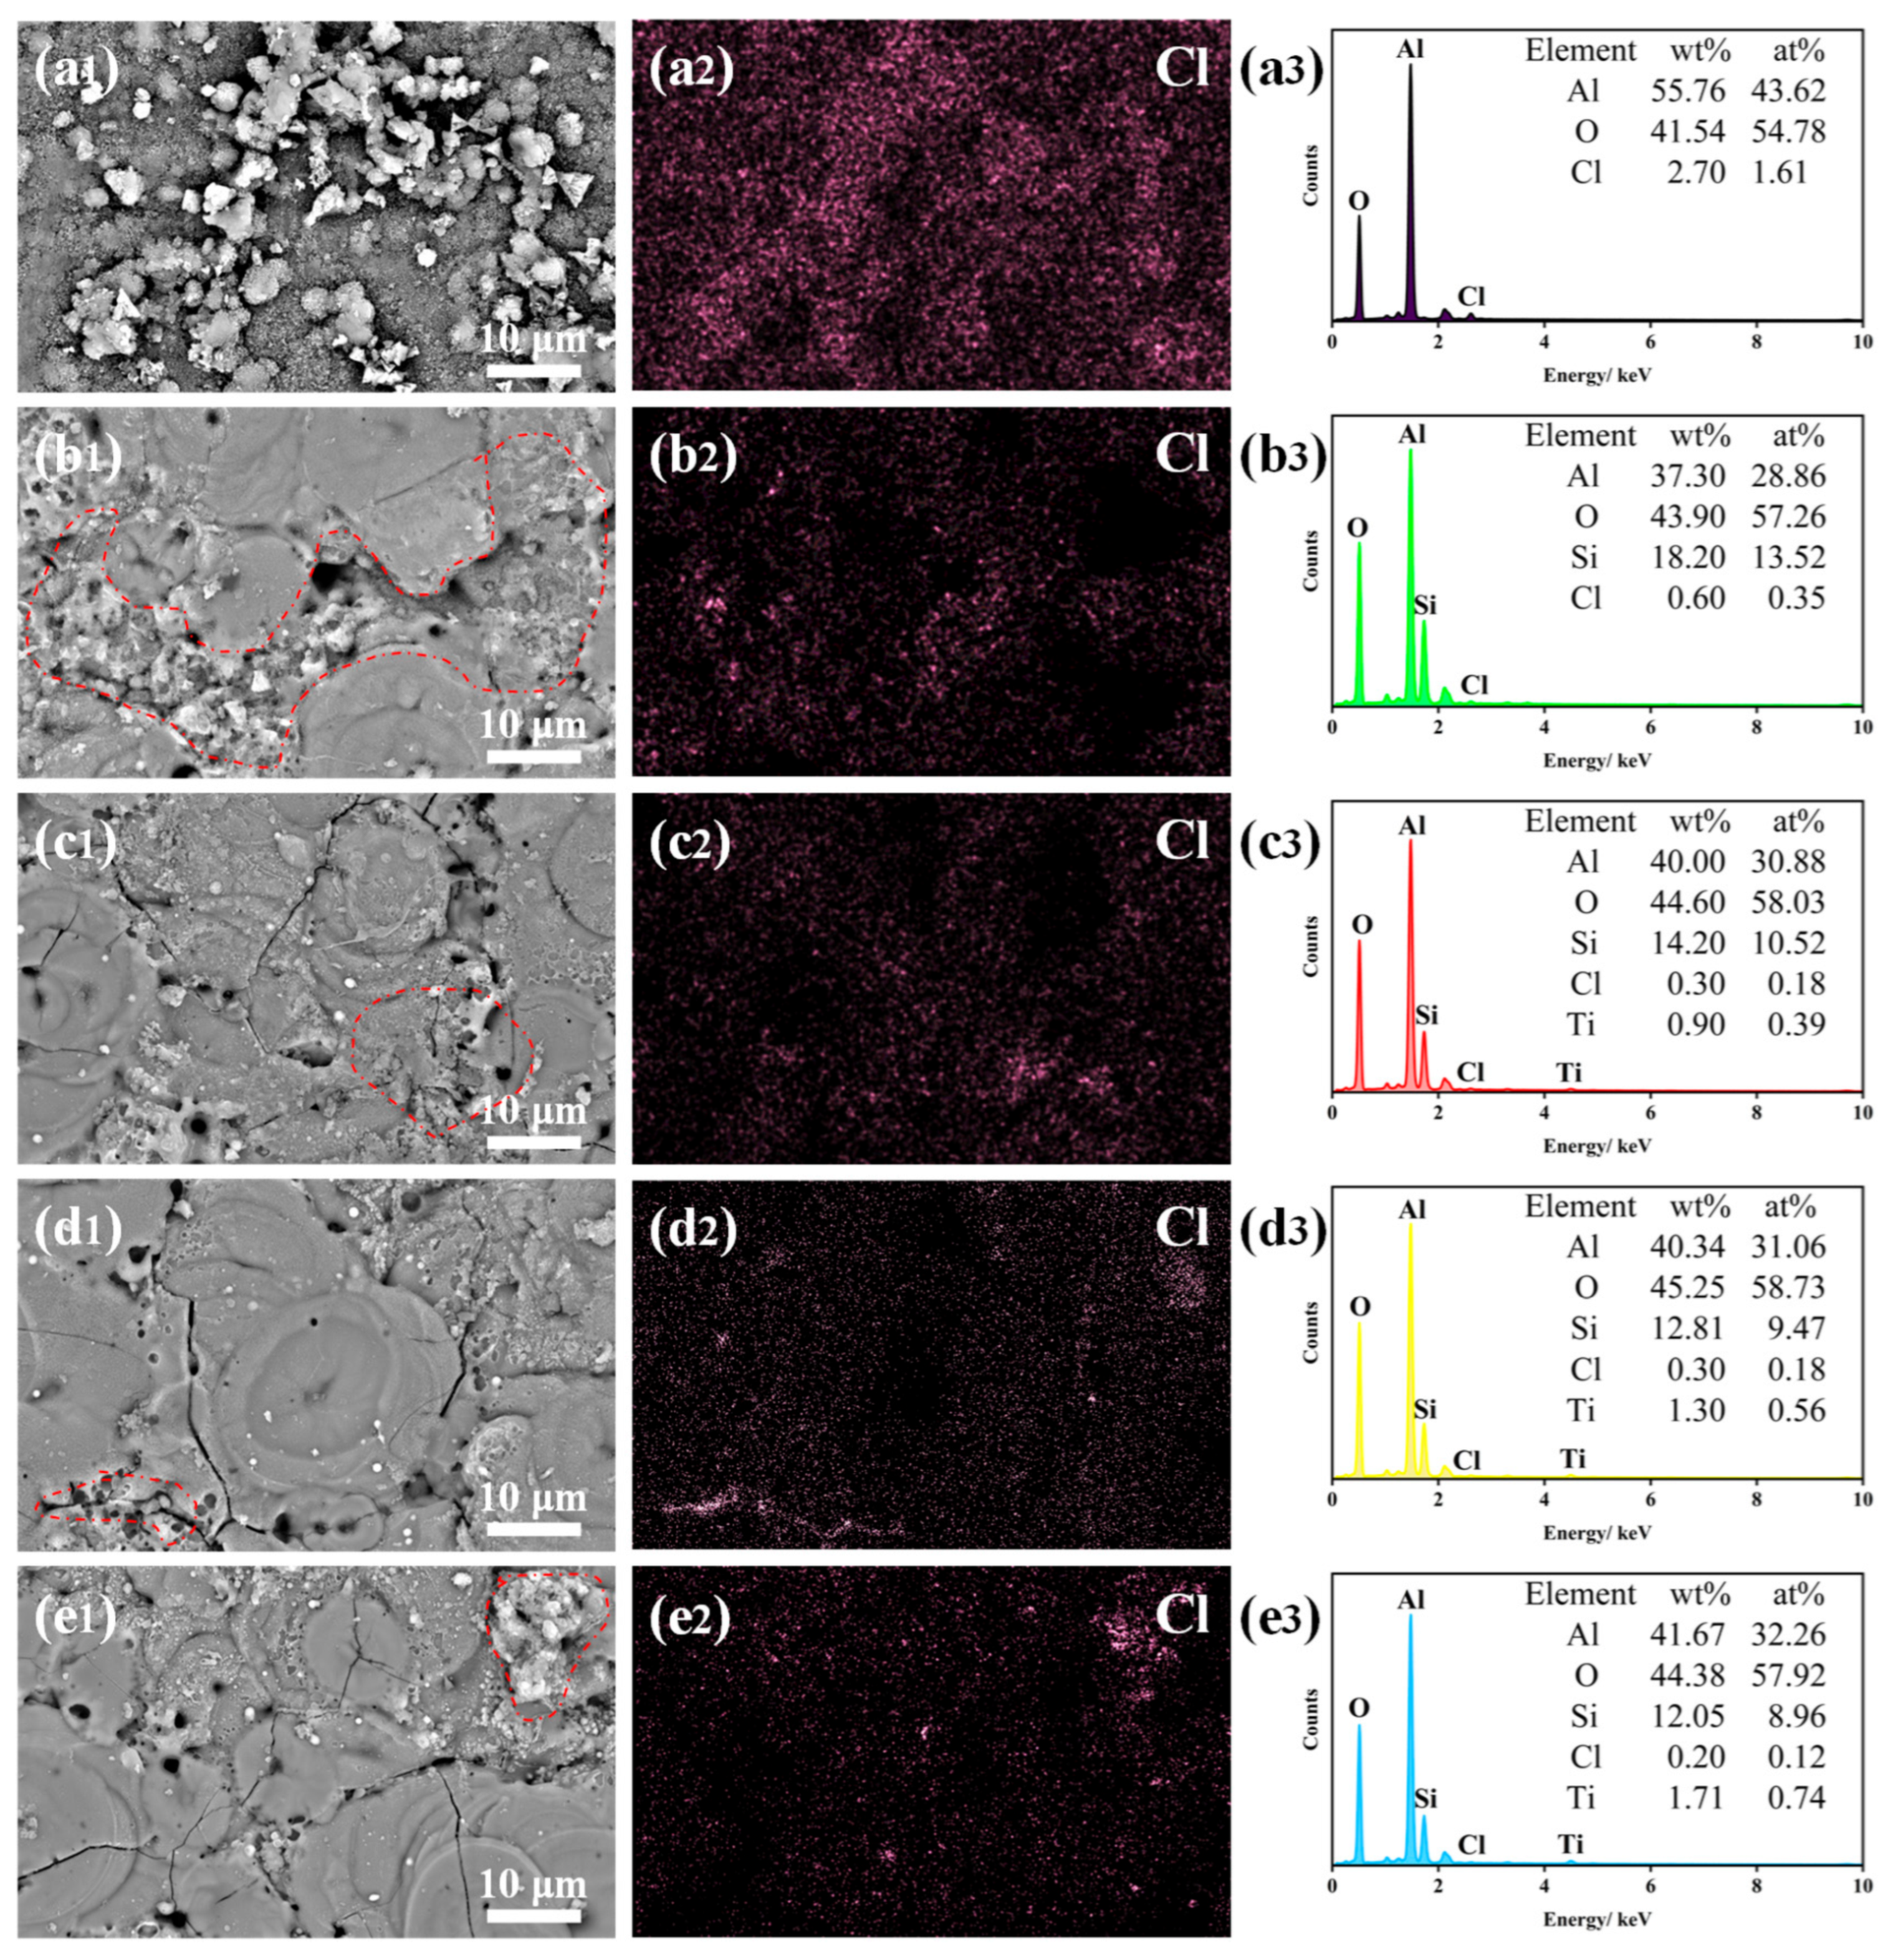
Further observation of the microscopic morphologies Figure 9(x1), where x = a, b, c, d, e reveals that, after the same immersion duration, the amount of corrosion products precipitated on the coating surfaces shows a trend of initial decrease followed by stabilization. EDS analysis of the immersed coatings Figure 9(x2,x3), x = a, b, c, d, e indicates the presence of Cl element, most likely in the form of Cl ions. As the doping amount of TiO2 nanoparticles increases, the detected Ti content rises, while the Cl content decreases. This suggests that the enrichment of TiO2 nanoparticles and the subsequent formation of corrosion-related products may provide short-term protective effects, thereby enhancing the coating’s resistance to corrosive media. Among the samples, the T1 coating exhibits the least amount of precipitated corrosion products on its surface, allowing it to be identified as possessing the optimal corrosion resistance. This finding is consistent with the conclusions drawn from the earlier potentiodynamic polarization tests.
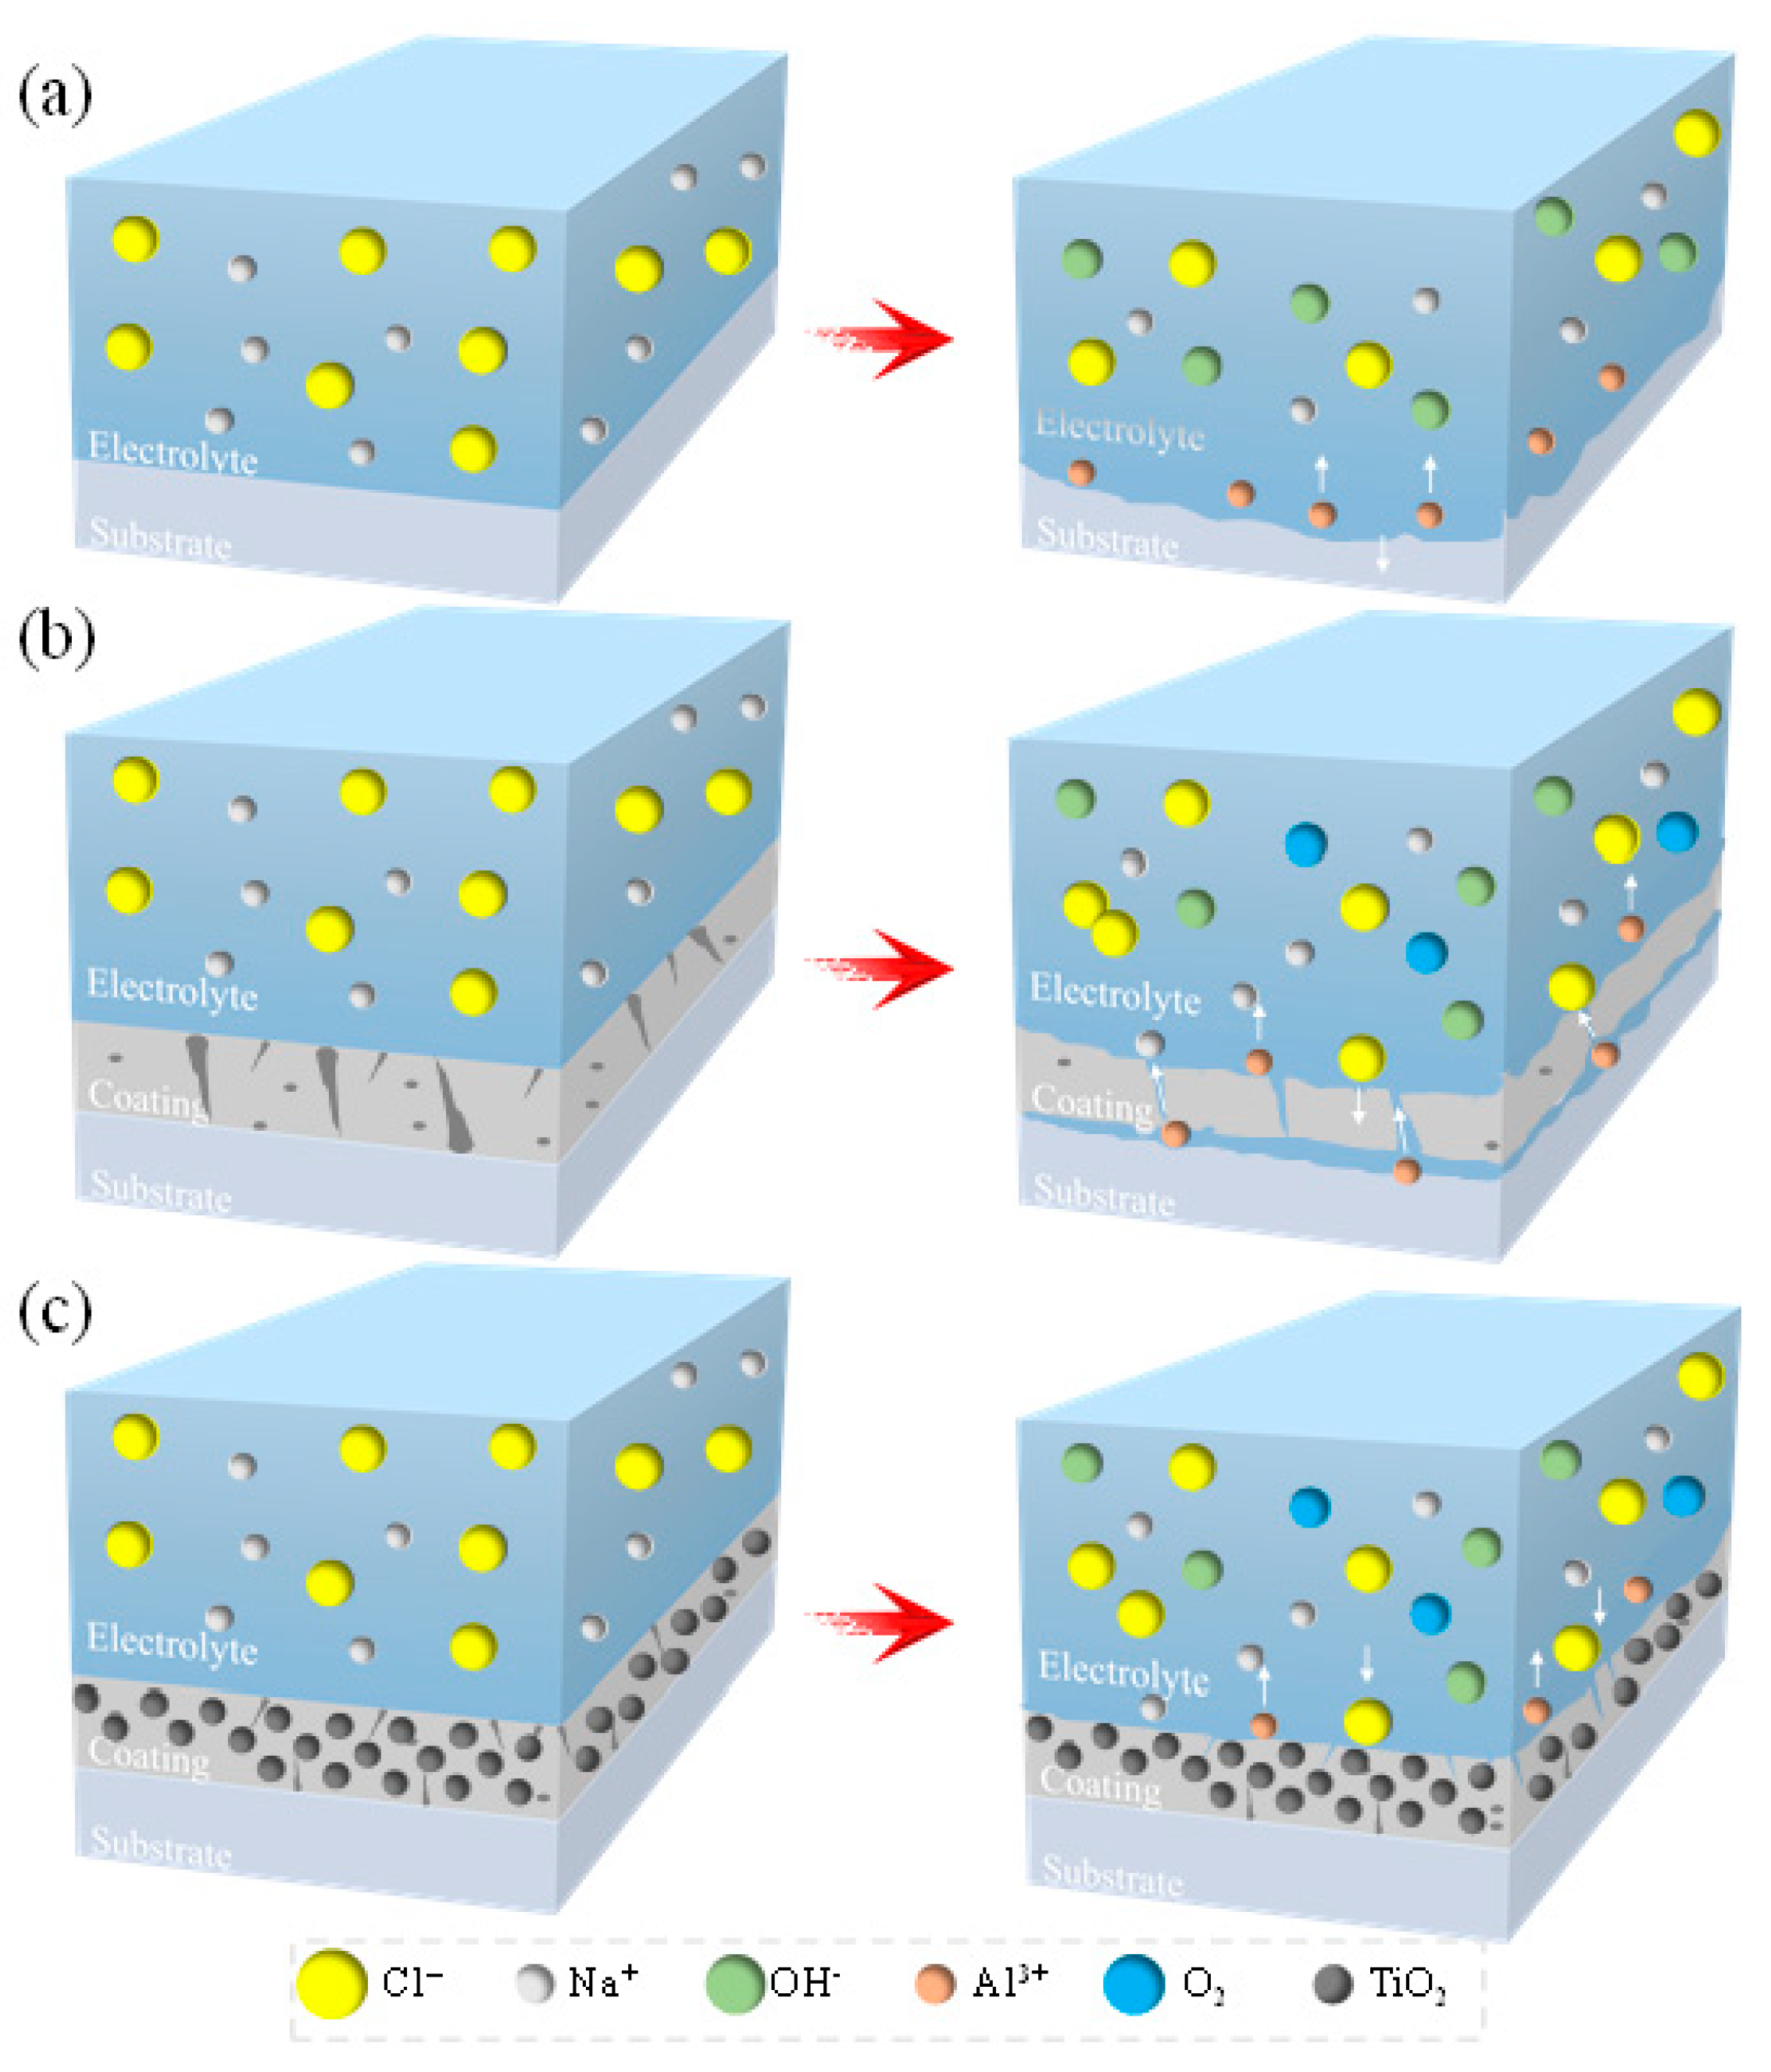
Figure 10 schematically illustrates the corrosion protection mechanisms of the bare substrate, the unmodified MAO coating, and the TiO2 nanoparticle-modified MAO coatings. When exposed to a NaCl solution, corrosive ions must penetrate the coating through defects such as micropores and micro-cracks to reach and attack the substrate. As depicted in Figure 10a, the unprotected substrate surface is in direct contact with the NaCl solution, allowing corrosive ions to react rapidly with the substrate and leading to swift corrosion. Figure 10b represents the case of an MAO-coated sample. The corrosive medium from the NaCl solution must first infiltrate through surface discharge channels and micro-cracks in the MAO coating before reaching the substrate. Over extended immersion, corrosion products gradually accumulate on the coating surface.
The incorporation of an optimal amount of TiO2 nanoparticles into the electrolyte modifies this process in two key ways. First, it increases the electrical resistance of the electrolyte system, leading to a higher electric field intensity. This promotes more uniform and intensive arc discharges, which in turn facilitates the generation and deposition of a greater volume of molten material. This material effectively fills and repairs defects like micropores and cracks within the coating, thereby improving its overall quality and density. Second, the TiO2 nanoparticles dispersed within the MAO coating alter the penetration pathways for corrosive media, enhancing the coating’s barrier effect. Corrosive agents are forced to navigate more tortuous paths to permeate the coating. Consequently, as shown in Figure 10c, the coating doped with an optimal amount of TiO2 nanoparticles can more effectively hinder the penetration of corrosive ions, significantly boosting its corrosion resistance. However, with a further increase in TiO2 nanoparticle doping (e.g., in the T1.5 coating), the number of discharge channels increases, and the coating’s compactness decreases. This results not only in a greater number of penetration pathways for corrosive ions but also in larger pore sizes, which collectively exert a significant detrimental effect on the coating’s corrosion resistance.
It should be noted that the discussion concerning the influence of TiO2 nanoparticles on discharge behavior and coating growth kinetics during micro-arc oxidation in this study is primarily based on a correlative analysis of macroscopic coating properties (e.g., thickness, roughness), microstructure (characterized by SEM and XRD), and electrical signal waveforms (voltage-time curves). While the results strongly suggest that the nanoparticles affect discharge intensity, distribution, and coating composition—likely through mechanisms such as altering electrolyte conductivity, participating in reactions within discharge channels, and becoming physically embedded—the precise physicochemical processes involved remain inferred from these indirect observations. Specifically, how nanoparticles modulate plasma characteristics within individual discharge channels or alter the dielectric breakdown threshold cannot yet be directly resolved due to the current experimental limitations in performing in situ observation of single discharge events at micro- to nanosecond timescales. This represents an acknowledged constraint in the present work and indicates a direction for future investigation.
It should be noted that, in addition to further elucidating the aforementioned microscopic mechanisms, the long-term electrochemical stability of the coatings and the evolution of their impedance over time are also critical indicators for assessing their potential in engineering applications. This will constitute another important focus for our future research.

3. Materials and Methods

3.1. Materials

The substrate was extruded 6061 aluminum alloy; its chemical composition is listed in Table 3. Samples with dimensions of 20 mm × 15 mm × 3 mm were cut by wire electrical discharge machining. Prior to MAO, the surfaces were ground sequentially with 400–1200 grit SiC papers and then polished to remove the native oxide and ensure smoothness. The specimens were ultrasonically cleaned in deionized water for 5 min and dried for later use.

3.2. Electrolyte and Nanoparticles

The electrolyte for MAO comprised 16 g·L−1 Na2SiO3·9H2O, 3 g·L−1 NaOH, 2 g·L−1 KF, and 3 g·L−1 C3H8O3 (all reagents from Macklin). To investigate the influence of TiO2 nanoparticles (from Macklin (Shanghai, China), with a purity of ≥99.8%, an average particle size of approximately 5–10 nm, an anatase crystal structure, and amphiphilic surface properties) on the MAO coatings, TiO2 was added at 0, 0.5, 1.0, and 1.5 g·L−1, designated as T0, T0.5, T1, and T1.5, respectively. For electrolyte preparation, TiO nanoparticles were first dispersed into 1 L of electrolyte by ultrasonication for 30 min to ensure uniform dispersion, then transferred to the MAO tank under continuous stirring to maintain homogeneity.

3.3. MAO Setup

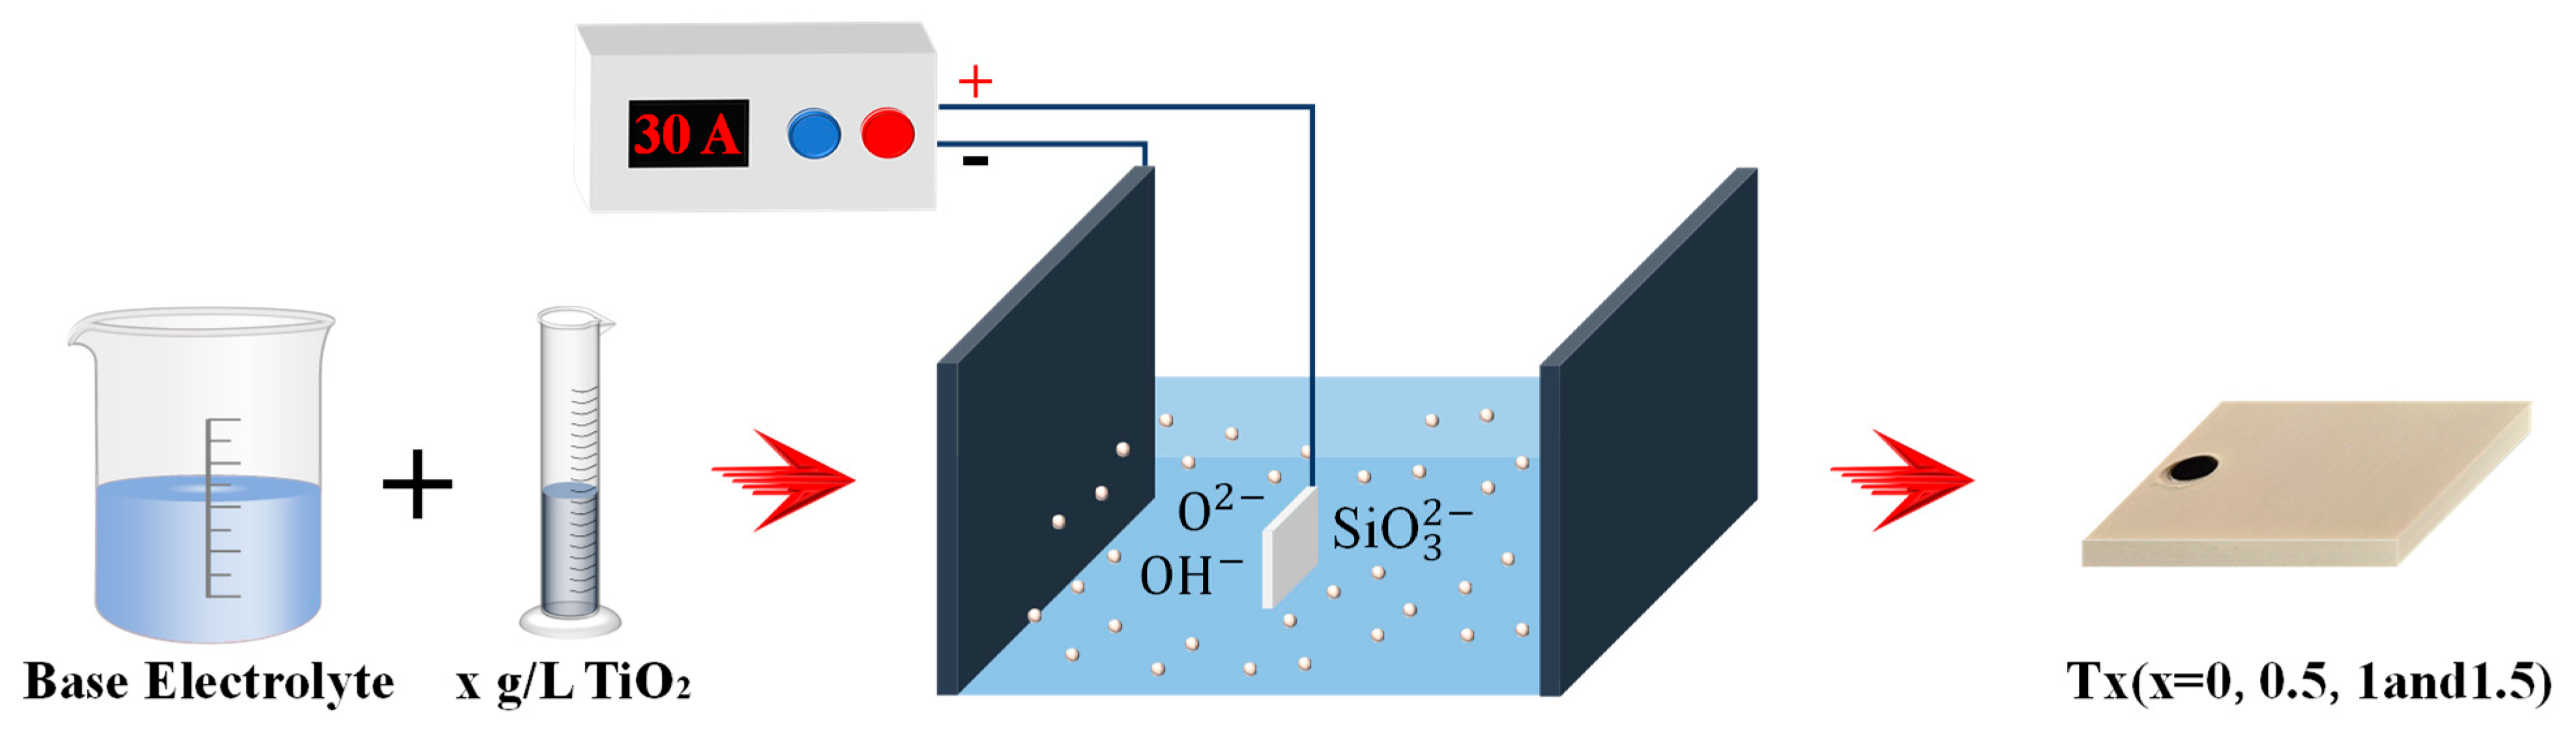
Figure 11 shows a schematic of the MAO setup, which consisted of a 720 V/30 A power supply, a U-shaped stainless-steel cathode, an electrolytic tank, and a water-cooling circulation system. During processing, the 6061 alloy specimen served as the anode and the U-shaped stain-less-steel plate as the cathode. The electrolyte temperature was controlled at 20 ± 2 °C. The MAO parameters were oxidation time 20 min, duty cycle 30%, frequency 1000 Hz, and current density 6 A·dm−2.

3.4. Structural Characterization of the Coatings

A Minitest 2500 eddy-current thickness gauge (ElektroPhysik, Cologne, Germany) was used to measure coating thickness at 25 random points on both sides of each sample; outliers were removed and the average was reported. Surface roughness was measured with a JITAI820 profilometer (Beijing JITAI Inspection Equipment Co., Ltd., Beijing, China) at five random points on each side, and the average value was taken. SEM (Phenom XL G2, Funano Scientific Instruments (Shanghai) Co., Ltd., Shanghai, China) was employed to examine surface and cross-sectional morphologies, and EDS was used to determine surface elemental compositions. Three different regions of each sample were randomly selected for SEM imaging, with each image covering an area of approximately 0.11 mm2. Image analysis was performed using ImageJ software (version 1.54m): the original SEM images were first converted to 16-bit grayscale, followed by binarization segmentation using the ‘Auto Threshold’ function to distinguish pores from the substrate. The threshold processing method was kept consistent across all samples to ensure comparability of the analytical results. XRD (DX-2700B) (Dandong Hao Yuan Instrument Co., Ltd., Dandong, China) was used to identify phases with a scan speed of 10°·min−1 over 2θ = 20–90°. XPS (Thermo Scientific K-Alpha) (Thermo Fisher Scientific Inc., Waltham, MA, USA) was used to analyze chemical states; binding energies were calibrated to the adventitious C 1 s peak at 284.8 eV.

3.5. Corrosion Characterization

Electrochemical tests were conducted on a CHI660E workstation (Shanghai Chenhua Instrument Co., Ltd., Shanghai, China) using a standard three-electrode cell with the sample as working electrode, a saturated calomel electrode as reference, and a platinum counter electrode in 3.5 wt% NaCl solution.
Prior to electrochemical testing, all specimens were immersed in a 3.5 wt% NaCl solution for 30 min to attain a stable open-circuit potential. The polarization curves were measured at a scan rate of 5 mV/s over a potential range from −2 V to 0 V. During the preparation of the working electrode, only a 0.785 cm2 coated surface was exposed as the test area to ensure a consistent exposed area for each measurement. The electrochemical impedance spectroscopy (EIS) measurements were conducted under the following parameters: a frequency range of 105 Hz to 10−2 Hz, with 12 points collected per decade, and an excitation voltage amplitude of 10 mV. To ensure statistical validity, at least three parallel samples were prepared for each treatment condition, and each sample underwent complete EIS and potentiodynamic polarization curve testing. The spectra and data points presented in the manuscript represent typical results from no fewer than three independent tests.
The test data were analyzed using ZView2 software (version 2.1c), and the EIS data were fitted based on an equivalent circuit model. The goodness of fit was evaluated through the chi-square value (χ2) and the fitting error of each circuit element. In this study, the χ2 values for the fitting results were typically below 10−3, and the fitting errors for the parameters of each component were generally less than 10%, indicating good fitting quality and that the model effectively describes the interfacial processes.
The long-term immersion experiments in this study were conducted at room temperature, with the solution temperature consistently maintained at 25 ± 1 °C. Throughout the immersion period, the 3.5 wt% NaCl solution was renewed every 48 h. Prior to each renewal, the solution pH was measured and confirmed to remain stable within the range of 6.5 ± 0.3. No active pH adjustment was performed, in order to simulate a natural corrosion environment. For each experimental condition, three parallel samples were prepared.

4. Conclusions

This study systematically investigated the effects of doping with TiO2 nanoparticles (samples T0, T0.5, T1, and T1.5) on the microstructure, composition, and properties of micro-arc oxidation (MAO) coatings on 6061 aluminum alloy. The main conclusions are as follows:
  • TiO2 nanoparticles were uniformly distributed within the MAO coating. The primary phase composition consisted of α-Al2O3 and γ-Al2O3. While doping had minimal influence on the phase composition, it significantly altered the coating’s microstructure, leading to increased surface roughness and thickness with higher doping levels.
  • Appropriate TiO2 doping reduced the coating porosity and improved its density, thereby enhancing corrosion resistance. However, for the sample with the highest addition amount studied (T1.5), a decrease in coating densification was observed compared to the optimally doped T1 sample, resulting in diminished corrosion performance.
  • Within the experimental scope, the T1 coating exhibited the optimal corrosion resistance. This study provides insights for optimizing MAO processes and designing protective coatings for 6061 aluminum alloys in chloride-containing environments. It demonstrates that controlling the doping amount of TiO2 nanoparticles is a critical factor for improving the corrosion resistance of MAO coatings.

Author Contributions

Conceptualization, Z.H.; methodology, S.Y. (Shaodian Yang); investigation, Z.H.; data curation, Z.H., S.Y. (Shaodian Yang), X.L. and S.Y. (Shengxiang Yang); writing—original draft preparation, Z.H. and X.L.; writing—review and editing, B.J. and T.Z.; supervision, B.J. and T.Z.; funding acquisition, B.J. All authors have read and agreed to the published version of the manuscript.

Funding

This research was funded by the Natural Science Project of Guangdong University of Science and Technology (No. GKY-2024KYZDK-1), Quality Engineering Project of Guangdong University of Science and Technology (No. GKZLGC2024438), Teaching and Learning Project-based Team of Guangdong University of Science and Technology (No. GKJXXZ2024014), Guangdong Province’s Innovative and Distinctive Project (No. 2025KTSCX200), Guangdong Province Key Construction Discipline Research Capability Enhancement Project (No. 2024ZDJS069).

Data Availability Statement

The data are contained within the article.

Conflicts of Interest

The authors declare no conflict of interest.

References

  1. Nie, Z.H.; Lu, H.L.; Yang, F.; Xu, G. Preparation and property enhancement of SiC particle-reinforced aluminum matrix composites based on micro-arc oxidation. J. Alloys Compd. 2025, 1010, 177388. [Google Scholar] [CrossRef] [Scilit]
  2. Qin, L.Y.; Fu, Z.Y.; Liu, L.; Han, X.; Ma, J.; Li, B.; Zhu, X. Influence of micro-arc oxidation on the microstructure and dielectric properties of anodic aluminum oxide. Sci. Rep. 2024, 14, 23673. [Google Scholar] [CrossRef] [Scilit]
  3. Mohannad, M.S.; Bosta, A.; Ma, K.J. Influence of hydroxide-silicate composition and electrolyte temperature on microstructure and infrared emissivity of MAO coatings on Al 6061. Mater. Chem. Phys. 2025, 384, 131491. [Google Scholar]
  4. Chen, C.J.; Shao, J.Q.; Lu, Y.K.; Tian, C.; Zhang, M.; Zhang, W. Influence of plasma electrolytic oxidation parameters on laser welding of aluminum alloy and glass. J. Mater. Eng. Perform. 2025, 34, 23321–23340. [Google Scholar] [CrossRef] [Scilit]
  5. Wang, X.Y.; Yu, F.Y.; Wang, W.Q. Effects of halloysite nanotube integration on the soft sparking micro-arc oxidation process and coating properties of aluminum alloys. Surf. Coat. Technol. 2025, 511, 132301. [Google Scholar] [CrossRef] [Scilit]
  6. Liu, Z.H.; Lu, H.L.; Zhao, Z.Y.; Zhu, Z.; Li, S. Influence of ultrasonic power modulation on the optimisation of aluminium alloy micro-arc oxidation coating properties. Appl. Surf. Sci. 2025, 679, 161067. [Google Scholar] [CrossRef] [Scilit]
  7. Zhu, M.Y.; Song, Y.W.; Dong, K.H.; Shan, D.; Han, E.-H. Effect of initial oxide film on the formation and performance of plasma electrolytic oxidation coating on 7075 aluminum alloy. Acta Metall. Sin. (Engl. Lett.) 2022, 35, 1559–1571. [Google Scholar] [CrossRef] [Scilit]
  8. Morello, D.; Leone, C.; Lamanna, G.; Silvio, G. A two-step full laser surface treatment to improve the adhesive bonding of aluminium-aluminium joints. Int. J. Adhes. Adhes. 2025, 142, 104089. [Google Scholar] [CrossRef] [Scilit]
  9. Fan, X.L.; Chen, F.; Zhang, G.W.; Zhan, L.; Zhou, X.; Zhou, X.; Ding, J.C.; Li, J.; Zheng, J. Modifying the aluminum current collector/active material layer interface through physical vapor deposition technology to achieve a high-performance sulfur cathode. Electrochim. Acta 2025, 533, 146562. [Google Scholar] [CrossRef] [Scilit]
  10. Yang, F.; Lu, H.L.; Fan, Z.S.; Nie, Z.; Zhang, L.; Cui, X. Study on the secondary cathodic deposition modification and properties of anodic oxidation coating on 6061 aluminum alloy. Langmuir ACS J. Surf. Colloids 2025, 41, 14618–14632. [Google Scholar] [CrossRef] [Scilit]
  11. Valizade, N.; Jarjoura, G.; Kipouros, J.G.; Plucknett, K.; Shakerin, S.; Mohammadi, M. Microstructure, hardness, and tribological properties of AA2014 powder metallurgy alloys: A sizing mechanical surface treatment study. Eng. Fail. Anal. 2025, 174, 109550. [Google Scholar] [CrossRef] [Scilit]
  12. Tan, R.D.; Li, H.F.; Liu, J.W.; Wu, Z.; Wang, Q.; Ramachandran, C.S. Low-temperature fabrication of carbon nanotube–aluminum composite powders via rotary chemical vapor deposition: Process optimization and growth mechanisms. Materials 2025, 18, 1654. [Google Scholar] [CrossRef] [Scilit]
  13. Yang, X.; Huang, Z.; Liao, X.X.; Lei, H.; Hao, D.; Zhang, T.; Jiang, B. The effect of oxidation time on the organization and corrosion performance of 6061 aluminum alloy micro-arc oxidation coatings. Coatings 2025, 15, 117. [Google Scholar] [CrossRef] [Scilit]
  14. Liu, X.D.; Wang, C.X.; Lei, J.L.; Song, P.; Huang, T.; Zhang, X.; Yang, T.; Ji, V. Micro-arc oxidation of aluminum alloys: Mechanism, defects, and corrosion resistance. Adv. Eng. Mater. 2025, 27, 2402748. [Google Scholar] [CrossRef] [Scilit]
  15. Zhu, Z.Q.; Lu, H.L.; Shen, T.J.; Wang, Z.; Xu, G.; Liu, Z.; Yang, H. Performance study of scanning micro-arc oxidation ceramic coatings on aluminum alloys based on different electrolyte flow rates. Surf. Coat. Technol. 2025, 496, 131686. [Google Scholar] [CrossRef] [Scilit]
  16. Meng, X.Z.; Zhu, L.Y.; Li, Y.Y.; Hu, P.; Cai, G.; Liu, J.; Zhang, Q.; Dong, Z.; Zhang, X. The influence of ultrasonic vibration on micro-arc oxidation behaviour of manganese aluminium bronze. J. Mater. Res. Technol. 2024, 33, 758–772. [Google Scholar] [CrossRef] [Scilit]
  17. Pecherskaya, E.A.; Konovalov, S.V.; Golubkov, P.E.; Mitrokhin, M.; Gurin, S. Study of optical characteristics of microdischarges in the micro-arc oxidation process. Vacuum 2024, 229, 113558. [Google Scholar] [CrossRef] [Scilit]
  18. Yang, H.P.; Yang, B.; Wang, P.; Li, C.; Yang, S.; Wang, X.; Luo, X.; Zheng, Y. Effect of Pr(NO3)3 doping on the characteristics of TC4 micro-arc oxidation coatings. Mater. Sci. Technol. 2024, 40, 517–527. [Google Scholar] [CrossRef] [Scilit]
  19. Chen, X.W.; Song, H.; Pu, H.; Zheng, R.; Zhang, M.; Zhang, D. Study of wear and corrosion resistance of ATO nanoparticle–doped micro-arc oxide film layers. Int. J. Appl. Ceram. Technol. 2023, 21, 1078–1093. [Google Scholar] [CrossRef] [Scilit]
  20. Zhang, M.; Ma, X.N.; Zhang, S.Y.; Hou, L.; Kim, K.H. One-step fabrication of wear resistant and friction-reducing Al2O3/MoS2 nanocomposite coatings on 2A50 aluminum alloy by plasma electrolytic oxidation with MoS2 nanoparticle additive. Surf. Coat. Technol. 2025, 497, 131796. [Google Scholar] [CrossRef] [Scilit]
  21. Yu, D.L.; Jiang, B.; Qi, X.; Wang, C.; Song, R. Study on the microstructure and comprehensive properties of black MAO/TiO2 coatings prepared on 6063 aluminum alloy. Mater. Today Commun. 2025, 42, 111317. [Google Scholar] [CrossRef] [Scilit]
  22. Huang, Q.; Wu, Z.Z.; Wu, H.; Ji, S.; Ma, Z.; Wu, Z.; Chen, P.; Zhu, J.; Fu, R.K.; Lin, H.; et al. Corrosion behavior of ZnO-reinforced coating on aluminum alloy prepared by plasma electrolytic oxidation. Surf. Coat. Technol. 2019, 374, 1015–1023. [Google Scholar] [CrossRef] [Scilit]
  23. Wang, P.; Wei, X.W.; Cao, W.J.; Tang, Y.T.; Wang, Y.; Gong, Z.Y.; Hu, J.; Pu, J.; Zu, X.T. Effect of TiO2 nanoparticles on the characteristics of MAO coatings. Int. J. Electrochem. Sci. 2020, 14, 9311–9325. [Google Scholar] [CrossRef] [Scilit]
  24. Tang, S.; Chen, X.W.; Zhang, D.F.; Xie, W.; Ran, Q.; Luo, B.; Luo, H.; Yang, J. Effects of nano-SiO2 particle addition on the structure and properties of micro-arc oxidation ceramic coatings on 7075 aluminum alloy. Anti-Corros. Methods Mater. 2024, 71, 482–490. [Google Scholar] [CrossRef] [Scilit]
  25. Qi, X.; Gao, H.; He, Y.F.; Su, X.; Jiang, B.; Song, R. A self-sealing and lubricating MAO/TiO2/PTFE composite coating fabricated by microarc oxidation on a 6063 aluminum alloy for wear and corrosion resistance. J. Alloys Compd. 2025, 1017, 179163. [Google Scholar] [CrossRef] [Scilit]
  26. Ma, P.; Fang, Y.Y.; Zhang, D.; Cheng, H.-B.; Fu, N.; Zhou, X.; Fang, S.; Lin, Y. Surface functionalization of TiO2 nanoparticles influences the conductivity of ionic liquid-based composite electrolytes. ACS Appl. Nano Mater. 2019, 3, 342–350. [Google Scholar] [CrossRef] [Scilit]
  27. Maj, L.; Muhaffel, F.; Jarzebska, A.; Trelka, A.; Kulczyk, M.; Cimenoglu, H.; Bieda, M. Microstructure characterization of titania-based micro-arc oxidation coatings with nanoparticles. Mater. Proc. 2023, 14, 14. [Google Scholar]
  28. Lian, H.M.; Du, H.Y.; Gao, Z.Q.; Huang, H.; Wei, Y.; Hou, L.; Wang, Q.; Wei, H.; Liu, X.; Zhou, Y. Enhancing conductivity and corrosion resistance of micro-arc oxidation coatings by incorporating ATO nanoparticles. Ceram. Int. 2025, 51, 34505–34518. [Google Scholar] [CrossRef] [Scilit]
  29. Reginaldo, T.K.; Danielle, D.D.; Rodrigo, F.; Alves, A.P.R. XPS Characterization of TiO2 Nanotubes Growth on the Surface of the Ti15Zr15Mo Alloy for Biomedical Applications. J. Funct. Biomater. 2023, 14, 353. [Google Scholar]
Figure 1. Anode voltage of MAO.
Molecules 31 00468 g001
Figure 2. Coating thickness and surface roughness under different TiO2 nanoparticle doping contents: (a) thickness; (b) surface roughness.
Molecules 31 00468 g002
Figure 3. SEM surface morphologies and corresponding porosity data of MAO coatings: (x1; x = a, b, c, d) SEM surface morphologies of T0, T0.5, T1, and T1.5 coatings; (x2; x = a, b, c, d) Porosity measurement maps for T0, T0.5, T1, and T1.5 coatings; (x3; x = a, b, c, d) Pore size distribution maps for T0, T0.5, T1, and T1.5 coatings; (e) porosity values; (f) comparison of pore size distributions across different coatings.
Molecules 31 00468 g003
Figure 4. Scanning electron microscopy images and corresponding elemental distribution maps of the coatings: (a1a3) T0; (b1b3) T0.5; (c1c3) T1; (d1d3) T1.5.
Molecules 31 00468 g004
Figure 5. Cross-sectional SEM morphologies of MAO coatings and EDS elemental distribution of the T1 coating cross-section: (a) T0; (b) T0.5; (c) T1; (d) T1.5; (e) elemental distribution maps (Al, O, Si, Ti) for the T1 coating.
Molecules 31 00468 g005
Figure 6. (a) XRD patterns of the MAO coatings; (b) XPS survey spectra of the T0 and T1 coatings; (c1,c2) high-resolution C 1 s spectra of the T0 and T1 coatings; (d1,d2) high-resolution Ti 2p spectra of the T0 and T1 coatings.
Molecules 31 00468 g006
Figure 7. Electrochemical measurements of MAO coatings in 3.5 wt% NaCl solution: (a) potentiodynamic polarization curves; (b) Nyquist plots; (c) equivalent circuit model for EIS data fitting; (d) Fitted equivalent circuit model.
Molecules 31 00468 g007
Figure 8. Macroscopic surface morphologies of the samples after immersion.
Molecules 31 00468 g008
Figure 9. SEM images, corresponding Cl element distribution maps, and EDS spectra of the coatings after immersion test: (a1a3) bare aluminum alloy; (b1b3) T0; (c1c3) T0.5; (d1d3) T1; (e1e3) T1.5.
Molecules 31 00468 g009
Figure 10. Schematic of corrosion resistance mechanisms: (a) Bare substrate; (b) MAO coating; (c) MAO coating modified with TiO2 nanoparticles.
Molecules 31 00468 g010
Figure 11. A schematic of the MAO setup.
Molecules 31 00468 g011
Table 1. Electrochemical parameters obtained from fitting the polarization curves.
Ecorr/VJcorr/(A·cm−2)Rp/(Ω·cm2)
Al alloy−1.3742.446 × 10−51.964 × 10³
T0−0.9192.911 × 10−61.538 × 10⁴
T0.5−0.8171.835 × 10−62.245 × 10⁴
T1−1.2481.127 × 10−63.558 × 10⁴
T1.5−1.2282.744 × 10−61.433 × 10⁴
Table 2. Equivalent circuit parameters.
Rs/(Ω·cm2)Y1/
−1·sn·cm−2)
n1R1/(Ω·cm2)Y2/
−1·sn·cm−2)
n2R2/(Ω·cm2)Equivalent Model
606138.558.145 × 10−60.8773.204 × 103------------R(QR)
T035.435.108 × 10−80.9192.782 × 1035.927 × 10−70.6591.220 × 104R{Q[R(QR)]}
T0.526.986.229 × 10−80.8957.303 × 1032.683 × 10−60.5065.889 × 104R{Q[R(QR)]}
T128.304.720 × 10−80.7779.538 × 1031.664 × 10−60.7567.859 × 104R{Q[R(QR)]}
T1.533.294.621 × 10−80.9191.407 × 1032.375 × 10−60.5222.826 × 104R{Q[R(QR)]}
Table 3. Chemical composition of 6061 aluminum alloy (wt%).
SiMgFeCuMnCrZnTiAl
0.4~0.80.8~1.20.70.15~0.40.150.250.250.15Bal
Disclaimer/Publisher’s Note: The statements, opinions and data contained in all publications are solely those of the individual author(s) and contributor(s) and not of MDPI and/or the editor(s). MDPI and/or the editor(s) disclaim responsibility for any injury to people or property resulting from any ideas, methods, instructions or products referred to in the content.