Article

Comparative Phytochemical Profiling and Biological Activities of Two Asplenium ceterach L. Extracts


1
Institute for Biological Research “Siniša Stanković”-National Institute of the Republic of Serbia, University of Belgrade, Bulevar despota Stefana 142, 11108 Belgrade, Serbia
2
Faculty of Physical Chemistry, University of Belgrade, Studentski trg 12-16, 11158 Belgrade, Serbia
3
Department of Experimental Oncology, Institute for Oncology and Radiology of Serbia, Pasterova 14, 11000 Belgrade, Serbia
4
Innovative Centre of the Faculty of Chemistry Ltd., University of Belgrade, Studentski trg 12-16, 11158 Belgrade, Serbia
5
Faculty of Chemistry, University of Belgrade, Studentski trg 12-16, 11158 Belgrade, Serbia
*
Authors to whom correspondence should be addressed.
Molecules 2026, 31(17), 2978; https://doi.org/10.3390/molecules31172978
Submission received: 3 July 2026 / Revised: 20 August 2026 / Accepted: 24 August 2026 / Published: 25 August 2026

Abstract

Methanol (ME) and dichloromethane (DCM) extracts of rustyback fern (Asplenium ceterach L.) sporophytes were analyzed for antioxidant properties by thin-layer chromatography (TLC)-based bioautography, using DPPH as the detection reagent, and were comparatively tested for their antimicrobial, antibiofilm, and cytotoxic activities. The bioautography assay indicated that the rustyback fern ME extract had significant antioxidant potential and moderate α-amylase activity compared to the DCM extract. Both extracts exhibited pronounced scavenging activity towards hydroxyl radicals, as well as antibacterial and antifungal potential against all tested strains, although to varying degrees. The Gram-negative Escherichia coli and Gram-positive Bacillus cereus were the most sensitive bacteria, while the most sensitive fungus was the yeast Candida krusei. Furthermore, the tested extracts showed notable capability to prevent Candida albicans biofilm establishment, with no significant difference between the two extracts examined and an inhibition range of 72–74%. Cytotoxic screening indicated the safety of the extracts even at high concentrations, up to 100 μg mL−1. The results of the present study highlight A. ceterach extracts as a significant source of bioactive compounds, supporting their potential use as potent antioxidants and for combating diseases caused by multidrug-resistant microorganisms.

1. Introduction

Desiccation-tolerant (DT) plants, also known as resurrection plants, can survive extreme water loss (up to 95% of their relative water content) by temporarily ceasing most biological functions. After rehydration, they rapidly return to normal physiological activities in existing tissues without apparent long-term damage. Desiccation tolerance is found primarily in bryophytes and pteridophytes [1,2]. About 1% of ferns are considered DT as sporophytes [3,4,5,6]. Due to their ability to survive for months at extreme environmental margins, DT ferns are expected to contain many useful phytochemicals with specialized biological functions.
The resurrection fern, Asplenium ceterach L. (rustyback fern), is common in Europe, North Africa, and the Middle East, with scattered populations extending eastward to western China, typically found on base-rich rocks and mortar walls. The ethnomedicinal uses of A. ceterach, its chemical constituents, and pharmacological properties associated with its therapeutic potential have been extensively researched (reviewed in [7]). Numerous reports have documented the biological activity of A. ceterach, including antimicrobial, antioxidant, cytotoxic, anticancer, and diuretic activities; its anti-inflammatory properties; DNA damage protection potential; and hepatoprotective and hematoprotective properties [7]. Previous studies have demonstrated the presence of a wide range of specialized metabolites in extracts of A. ceterach sporophytes, including phenolic hydroxybenzoic and hydroxycinnamic acids, acetophenones, flavonoids, lignans, and xanthones, making them an important source of antioxidants [8].
Phenolic compounds are not distributed equally in plants and exhibit variable stability, making their extraction more challenging [9]. Due to the unstable nature of phenolic compounds, the extraction method is a crucial step in their isolation and subsequent compound identification [10]. Solvents play an important role in the extraction process, considerably affecting the amount and nature of the specialized metabolites of the plants. According to the literature, no solvent is universally accepted as the best for the extraction of polyphenols; nevertheless, it is generally believed that solvents with higher polarity are often most effective, owing to the high solubility of polyphenols in such solvents. For example, polar solvents are typically used to extract phenolic components and their glycosidic derivatives and saponins, etc., while fatty acids and steroids, etc., are extracted using non-polar solvents [11]. Numerous studies have reported the effect of solvents on the diversity of specialized metabolites and/or their biological properties. Therefore, to enhance the biological properties of phytocompounds, proper selection of the appropriate solvent is essential for the development of a universal method for the extraction of all phenolic compounds. Comparative biological studies of the same plant extract obtained using different solvents are beneficial in achieving this goal. However, there is no detailed report in the literature on the phytoconstituents of A. ceterach extracted using solvents with different polarities that includes comparisons of their biological activities. For this purpose, in the current study, the aerial parts of the plant were extracted using two different solvents: methanol (ME) and dichloromethane (DCM). Each extract of A. ceterach was analyzed separately to determine its chemical constituents and assess its biological properties. In this context, the objective of our study was to identify the main differences in the phytochemical profiles of A. ceterach extracts produced using different extraction solvents and to determine their biological activities. Expanding upon our preliminary findings [12], this study introduces, for the first time, an extensive high-performance thin-layer chromatography (HPTLC)-α-amylase assay while also providing a detailed evaluation of the antioxidant, antibiofilm, and cytotoxic potential of A. ceterach extracts.

2. Results

2.1. UHPLC-LTQ OrbiTrap MS Analysis of A. ceterach Extracts

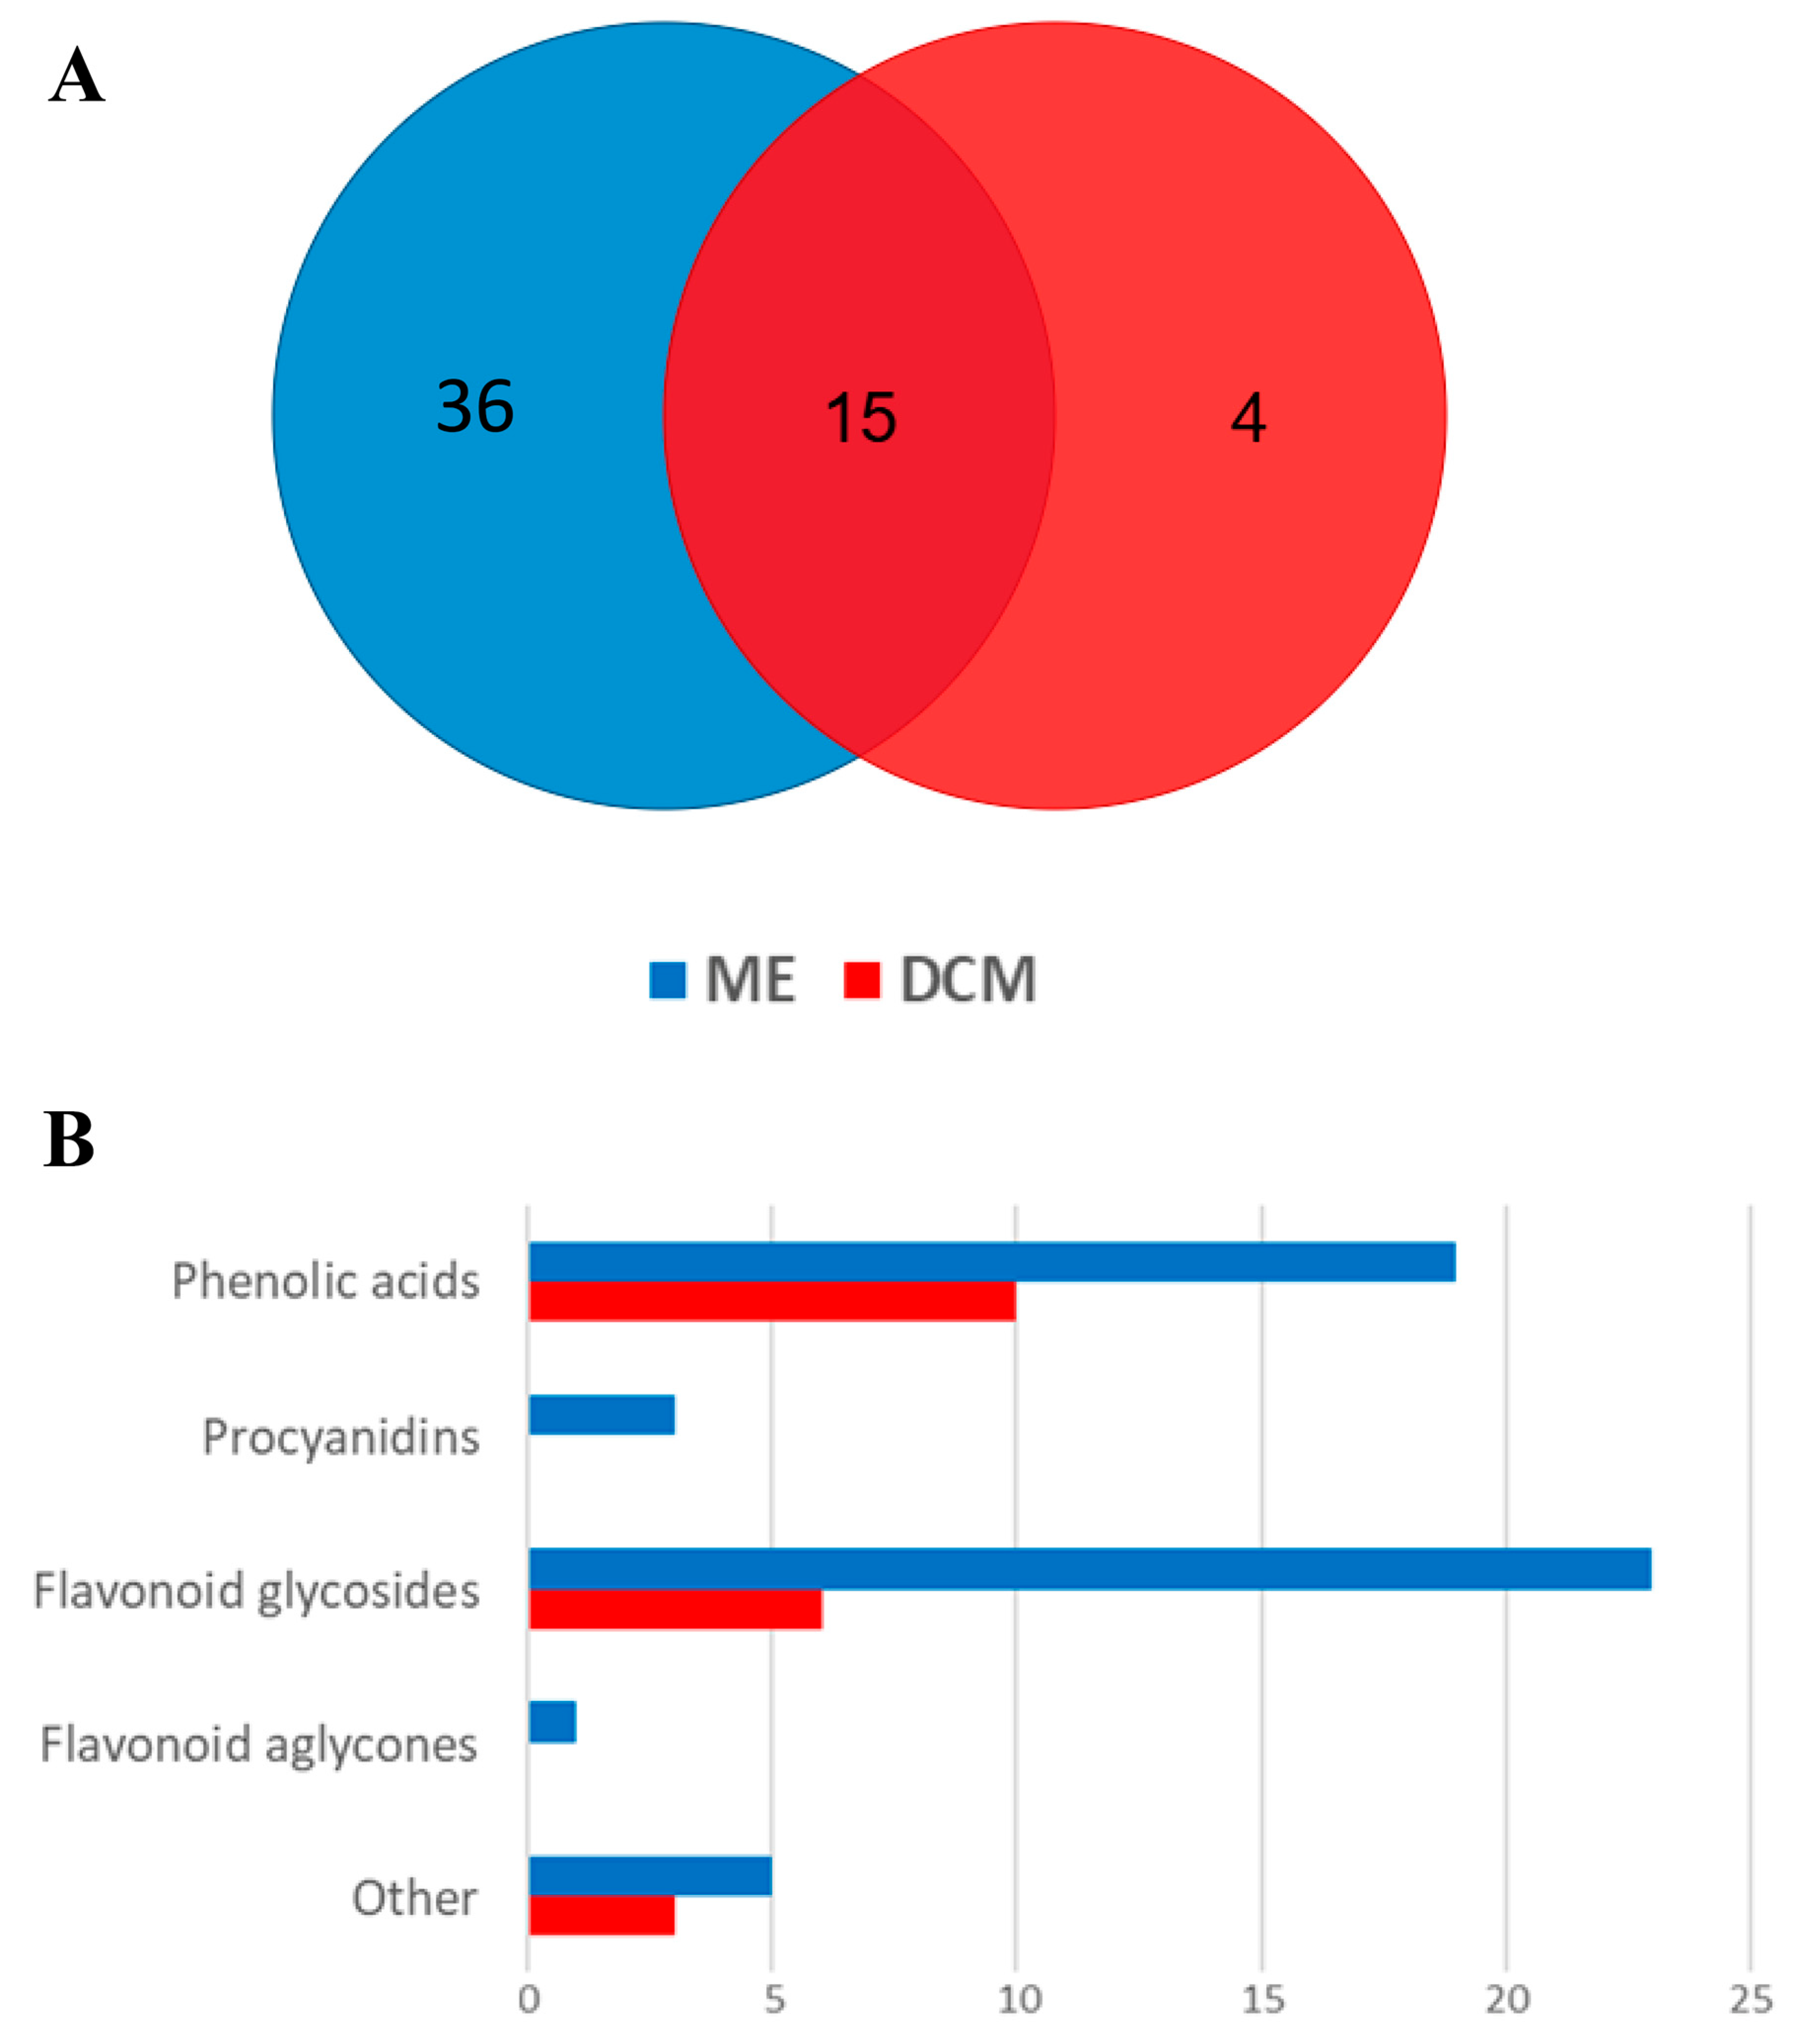
Using the untargeted UHPLC–MS4 Orbitrap approach, a total of 55 metabolites were identified in two different extracts of A. ceterach (Table 1, Figure 1). Based on MS2, MS3, and MS4 fragmentation of molecules and the mass of the deprotonated molecule [M−H], various metabolites were detected in ME and DCM extracts. Metabolites are divided into several groups according to their structural characteristics (Table 1). Thus, the given table lists 21 phenolic acids and derivatives, 3 proanthocyanidins, 24 flavonoid glycosides, 1 flavonoid aglycone, and 6 other compounds. In general, a higher number of metabolites were identified in the ME extract than in the DCM extract (Figure 1). Therefore, 19 phenolic acids and their derivatives were detected in the ME extract, while 10 were identified in the DCM extract.
Various caffeoylquinic acid derivatives were identified as the main phenolic acids in ME. Among all the identified phenolic compounds, the presence of free acids (compounds 2, 7, and 18) was confirmed only in ME, while the rest were hexosides, quinic acid derivatives, and one shikimic acid derivative (compound 12).
Three proanthocyanidins (compounds 2224) were identified in ME, while the presence of proanthocyanidins in DCM was not confirmed by UHPLC–MS4 Orbitrap metabolic fingerprinting. These three proanthocyanidins had previously been detected in some ferns [13,14,15], but not in Asplenium species. Additionally, quercetrin (49) was the only flavonoid aglycone identified in the ME extract and was absent in the DCM extract (Table 1, Figure 1).
Of the 24 identified derivatives of flavonoid glycosides, only one was not detected in the A. ceterach ME extract (compound 28), which is specific to the Polypodium vulgare L. rhizome water extract [16]. In general, the highest numbers of quercetin and kaempferol derivatives were detected, which gave intense MS2 or MS3 peaks at 301 and 285 m/z, respectively. The most common glycosidic group for these derivatives was hexosyl, which gives a neutral loss of 162 Da; hexuronyl (176 Da), rhamnosyl (146 Da), and pentosyl (132 Da) derivatives were also present. Several of these derivatives contained, in addition to the sugar unit, an acyl residue (caffeoyl or methyl-caffeoyl (feruloyl)). The presence of most derivatives of flavonoid glycosides was confirmed by the available literature (Table 1), while the tentative structures of some metabolites were proposed based on their HRMS and MS4 data. Among the other metabolites, some non-specific compounds for ferns were found, such as phloretin 3′,5′-di-C-hexoside (compound 53), whose fragmentation pattern is consistent with the available literature [17]. This group of compounds also includes two lignan derivatives (compounds 54 and 55), which in the first stage of fragmentation (MS2) lose the hexose unit (180 Da), indicating that the hexose is attached at the 4′ position of the corresponding lignan. Further fragmentation of these compounds results in peaks corresponding to the loss of a methyl group (15 Da).
The variations in the phytochemical profiles of the two A. ceterach extracts confirm the notable chemical diversity of specialized metabolites and can be attributed to differences in the polarity of the extraction solvents. In particular, the ME extract was qualitatively much richer than the DCM extract and was characterized by the presence of polar groups of bioactive compounds, such as phenolic acids, flavonoids, and proanthocyanidins (Table 1, Figure 1). Thus, the results of the current analysis highlight that solvent polarity significantly affects the abundance of compounds found in plant extracts, which is consistent with previous research on other fern species [18].
Table 1. HRMS and MS4 data for metabolites identified in dichloromethane (DCM) and methanol (ME) extracts of Asplenium ceterach.
NoCompound NametR, minMolecular Formula, [M–H]Calculated Mass,
[M–H]
Exact Mass, [M–H]Δ ppmMS2 Fragments, (% Base Peak)MS3 Fragments, (% Base Peak)MS4 Fragments, (% Base Peak)Level of IdentificationDCMMERef.
Phenolic acids and derivatives
1Dihydroxybenzoyl hexoside0.91C13H15O9315.07216315.07231−0.48109(7), 153(100)109(100)81(100)Level 2a[19]
23,4-Dihydroxybenzoic acid0.92C7H5O4153.01933153.01970−2.42108(13), 109(100), 110(20), 111(26), 123(12), 125(56)67(100), 81(69)NALevel 1[8]
3Hydroxybenzoyl hexoside1.33C13H15O8299.07724299.077180.21137(100), 138(7), 153(8), 171(3), 253(5), 261(3)NANALevel 2bNA
4Caffeoyl hexoside 11.64C15H17O9341.08781341.087431.10135(5), 179(100)135(100)77(6), 79(4), 83(3), 91(16), 107(100), 117(7), 123(4)Level 2a[20]
5Chlorogenic acid hexoside2.27C22H27O14515.14063515.14078−0.30179(5), 191(32), 323(100), 324(14), 341(12), 353(14)133(6), 161(100)117(17), 133(100)Level 2bNA
65-O-Caffeoylquinic acid2.89C16H17O9353.08781353.086902.56191(100), 192(5)85(100), 93(53), 111(34), 127(80), 171(25), 173(53)55(19), 57(100)Level 1[8]
7Caffeic acid3.14C9H7O4179.03498179.03521−1.2589(4), 119(4), 133(4), 134(6), 135(100)63(72), 77(52), 91(100), 107(59)NALevel 1[8]
8Coumaroyl hexoside3.23C15H17O8325.09289325.092590.92119(9), 163(100), 164(9)119(100)NALevel 2a[21]
9Feruloyl hexoside3.68C16H19O9355.10346355.102462.80191(18), 193(100)134(83), 149(100), 178(60)134(100)Level 2bNA
105-O-Caffeoylquinic acid isomer3.77C16H17O9353.08781353.087411.13191(100), 192(3)85(100), 93(59), 111(37), 127(79), 171(24), 173(57)NALevel 2a[8]
11Coumaroylquinic acid 13.77C16H17O8337.09289337.092680.63163(4), 173(4), 191(100)85(100), 93(59), 111(35), 127(77), 171(23), 173(44)NALevel 2a[22]
124-O-Caffeoylshikimic acid3.96C16H15O8335.07724335.077030.63135(18), 179(100), 180(5)135(100)91(31), 106(16), 107(100)Level 2a[23]
135-O-Feruloylquinic acid4.13C17H19O9367.10346367.103370.22173(4), 191(100), 193(3)85(100), 93(53), 111(35), 127(94), 171(26), 173(64)57(100)Level 2a[24]
14Coumaroylquinic acid 24.31C16H17O8337.09289337.09303−0.42163(3), 179(7), 191(100)85(100), 109(21), 111(35), 127(84), 171(25), 173(45)57(100)Level 2a[22]
15Me 5-O-caffeoylquinate4.53C17H19O9367.10346367.10355−0.26135(45), 136(4), 161(9), 179(100), 180(7), 191(28)135(100)68(6), 91(17), 95(12), 107(100), 117(26)Level 2a[25]
163,5-O-Dicaffeoylquinic acid5.12C25H23O12515.11950515.12044−1.83173(3), 179(3), 191(3), 335(4), 353(100), 354(17)135(9), 173(13), 179(50), 191(100)93(64), 109(28), 111(34), 127(100), 171(28), 173(65)Level 2a[26]
174,5-O-Dicaffeoylquinic acid5.39C25H23O12515.11950515.11997−0.91173(7), 203(14), 255(6), 299(10), 353(100), 354(11)135(8), 173(100), 179(58), 191(32)71(16), 93(100), 109(7), 111(49), 137(6), 155(9)Level 2a[26]
18Ferulic acid5.52C10H9O4193.05063193.05093−1.55134(64), 161(100), 178(28)133(100)78(11), 84(13), 105(100)Level 1[8]
19Coumaroyl-caffeoylquinic acid 15.55C25H23O11499.12459499.12516−1.16335(12), 337(100), 338(14), 353(76), 451(19), 463(46)119(5), 163(100), 173(77), 191(36)119(100)Level 2a[26]
20Coumaroyl-caffeoylquinic acid 25.88C25H23O11499.12459499.12520−1.23173(3), 335(4), 337(28), 353(4), 451(100), 452(17)143(6), 159(10), 161(56), 289(100)97(4), 101(28), 113(15), 143(11), 159(8), 161(100)Level 2a[26]
21Dicoumaroylquinic acid6.36C25H23O10483.12967483.13020−1.09173(10), 319(21), 337(100), 338(9), 435(68), 436(15)163(19), 173(100), 191(3)71(15), 93(100), 109(9), 111(58), 127(4), 155(6)Level 2bNA
Proanthocyanidins
22B type proanthocyanidin dimer2.11C30H25O12577.13515577.134231.59287(10), 289(27), 407(50), 425(100), 426(17), 451(23)273(9), 339(3), 381(6), 407(100)255(32), 281(88), 283(37), 285(100), 297(39), 389(28)Level 2a[14]
23Aesculitannin B3.93C45H35O18863.18289863.18318−0.34411(32), 451(20), 559(12), 573(22), 693(12), 711(100)407(23), 425(10), 541(26), 559(84), 585(8), 693(100)407(39), 525(9), 567(100), 570(13), 657(34), 675(9)Level 2a[13]
24Cinnamtannin B14.11C45H35O17847.18797847.18892−1.12411(100), 435(24), 557(21), 649(75), 682(45), 711(26)149(41), 215(12), 243(14), 257(11), 285(100), 301(14)125(25), 163(69), 217(43), 241(86), 243(28), 257(100)Level 2a[15]
Flavonoid glycosides
25(epi)-Catechin 5-O-hexoside3.18C21H23O11451.12459451.12501−0.95289(100), 290(18), 353(20), 354(4), 405(4)125(5), 179(15), 203(10), 205(35), 245(100), 247(6)161(18), 187(18), 188(19), 203(100), 227(22), 230(6)Level 2a[27]
26Isorhamnetin 3-O-(2″-rhamnosyl)-hexoside3.21C28H31O16623.16176623.16196−0.33503(100), 517(12), 521(13), 535(22), 575(21), 605(23)297(6), 315(26), 359(5), 399(4), 459(100), 485(48)271(30), 314(9), 315(100), 399(29), 415(19), 441(30)Level 2bNA
27Kaempferide 3-O-hexoside-7-O-rhamnoside3.72C28H31O15607.16684607.16979−4.86341(12), 503(100), 545(24), 547(29), 563(27), 589(28)189(3), 313(72), 323(14), 341(100), 475(35), 485(5)165(6), 193(3), 271(3), 313(100), 323(12)Level 2a[28]
28(epi)-Catechin 7-O-pentoside3.68C20H21O10421.11402421.113990.07137(39), 138(4), 269(6), 289(100), 290(14), 375(10)125(18), 137(15), 179(9), 203(8), 205(39), 245(100)161(28), 187(18), 188(13), 203(100), 217(7), 227(11)Level 2a[16]
29Myricetin 3,7-di-O-hexoside3.86C27H29O18641.13594641.13642−0.75271(22), 316(100), 317(80), 318(10), 477(13), 623(11)151(6), 179(14), 270(33), 271(100), 287(42), 288(10)199(8), 215(9), 227(38), 229(5), 243(100), 271(11)Level 2a[29]
30Quercetin 3-O-(6″-hexosyl)-hexoside4.22C27H29O17625.14102625.14145−0.68271(11), 300(77), 301(100), 302(14), 343(14), 463(3)151(75), 179(100), 256(11), 257(11), 272(14), 273(18)151(100)Level 2a[30]
31Quercetin 3-O-(6″-hexosyl)-hexoside-7-O-(6″-feruloyl)-hexoside4.31C43H47O25963.24119963.24174−0.57625(100), 626(9)255(5), 271(8), 300(44), 301(100), 343(10)151(74), 179(100), 193(5), 229(5), 257(9), 273(18)Level 2bNA
32Kaempferol 3-O-(6″-hexosyl)-hexoside4.62C27H29O16609.14611609.145750.59257(3), 284(3), 285(100)151(23), 197(19), 229(49), 241(35), 257(100), 267(43)163(45), 189(10), 211(9), 213(23), 229(100), 239(33)Level 2a[30]
33Quercetin 3-O-glucoside4.74C21H19O12463.08820463.08875−1.19300(20), 301(100), 302(10)151(79), 179(100), 257(11), 271(10), 272(10), 273(15)151(100)Level 1[31]
34Quercetin 3-O-(6″-pentosyl)-hexoside4.76C26H27O16595.13046595.13098−0.87271(10), 300(56), 301(100), 302(12), 343(9), 463(5)151(84), 179(100), 256(14), 257(12), 272(23), 273(18)151(100)Level 2a[14]
35Quercetin 3-O-hexuronide4.68C21H17O13477.06746477.06756−0.20301(100), 302(11)1051(81), 179(100), 273(9)151(100)Level 2a[30]
36Kaempferol 3-O-glucoside4.98C21H19O11447.09329447.09380−1.15255(14), 284(100), 285(63)227(12), 255(100), 256(17)167(7), 211(74), 227(100)Level 1[32]
37Quercetin 3-O-(caffeoyl-hexosyl)-hexoside5.02C36H35O20787.17272787.17291−0.25301(3), 383(4), 485(3), 625(100), 626(24)255(3), 271(5), 300(22), 301(100), 343(7)151(74), 179(100), 193(6), 229(5), 257(10), 273(17)Level 2bNA
38Kaempferol 3-O-hexuronide5.10C21H17O12461.07255461.07285−0.65285(100), 286(9)197(22), 229(55), 239(21), 241(37), 257(100), 267(44)163(62), 185(11), 187(11), 213(23), 229(100), 239(30)Level 2bNA
39Kaempferol 3-O-(6″-pentosyl)-hexoside5.13C26H27O15579.13554579.13662−1.86257(3), 285(100), 286(8)151(21), 229(51), 241(36), 256(20), 257(100), 267(43)163(55), 185(12), 187(12), 213(22), 229(100), 239(35)Level 2a[33]
40Quercetin 3-O-(6″-caffeoyl)-hexoside-7-O-hexoside5.22C36H35O20787.17272787.17300−0.36625(100), 626(16)255(3), 271(7), 300(26), 301(100), 343(10)151(79), 179(100), 193(9), 257(15), 273(13), 283(4)Level 2bNA
41Kaempferol 3-O-(caffeoyl-hexosyl)-hexoside5.36C36H35O19771.17780771.177680.16383(7), 485(26), 486(6), 609(100)255(7), 257(6), 284(27), 285(100), 327(13), 447(3)151(30), 229(56), 239(21), 241(39), 257(100), 267(42)Level 2bNA
42Kaempferol 3-O-(2″-caffeoyl)-hexoside-7-O-rhamnoside 15.73C36H35O18755.18289755.18331−0.56285(14), 469(3), 591(9), 609(100), 610(23)255(8), 257(6), 284(27), 285(100), 327(13), 447(4)151(26), 229(54), 239(24), 241(38), 257(100), 267(33)Level 2a[34]
43Quercetin 3-O-(6″-caffeoyl)-hexoside5.75C30H25O15625.11937625.12253−5.06301(100), 302(10), 463(19), 464(4)151(87), 179(100), 257(14), 273(18)151(100)Level 2a[35]
443-Me-Kaempferol 7-O-hexoside5.75C22H21O11461.10894461.108570.78283(68), 284(18), 298(66), 446(100)255(3), 283(100)255(100)Level 2a[36]
45Kaempferol 3-O-(2″-caffeoyl)-hexoside-7-O-rhamnoside 25.93C36H35O18755.18289755.18331−0.55285(8), 591(7), 609(100), 610(16)257(3), 285(100)151(20), 213(31), 229(53), 241(38), 257(100), 267(46)Level 2a[34]
46Kaempferol 3-O-(6″-caffeoyl)-hexoside6.11C30H25O14609.12498609.12526−0.46285(100), 286(8), 323(4)151(100), 229(20), 241(34), 257(62)83(10), 107(100)Level 2bNA
47Luteolin 7-O-(2″-caffeoyl)-hexuronide6.23C30H23O15623.10424623.10485−0.97245(5), 285(3), 337(100), 338(10), 443(4)161(100), 179(4), 203(6), 219(8), 245(13), 277(4)133(100)Level 2bNA
48Apigenin 7-O-(2″-caffeoyl)-hexuronide6.67C30H23O14607.10933607.10998−1.07285(40), 286(9), 321(46), 381(11), 442(29), 443(100)283(4), 284(19), 285(100), 325(3), 371(5), 425(3)199(23), 213(22), 229(45), 241(38), 257(100), 267(34)Level 2bNA
Flavonoid aglycones
49Quercetin4.68C15H9O7301.03538301.033366.68151(84), 179(100), 257(11), 273(15)107(2), 151(100)NALevel 1[37]
Other metabolites
50Citric acid0.78C6H7O7191.01973191.019700.12111(100), 129(3), 173(13)67(100)NALevel 2a[38]
512-(3,4-Dihydroxyphenyl)ethyl hexoside1.30C14H19O8315.10854315.10862−0.26151(11), 153(100), 154(7), 225(5)123(100)77(9), 81(25), 93(10), 95(100)Level 2a[39]
52Gibberellic acid4.69C19H21O6345.13436345.134360.01143(24), 239(100), 283(27), 301(30), 327(20), 329(45)71(16), 83(11), 143(100), 195(11), 197(47), 221(25)NALevel 2a[40]
53Phloretin 3′,5′-di-C-hexoside4.87C27H33O15597.18249597.18276−0.44301(41), 357(85), 387(57), 417(20), 477(100), 553(17)357(100), 369(3), 387(34), 459(7)167(11), 189(4), 209(100), 229(5), 251(4), 251(15)Level 2bNA
54Hydroxypinoresinol 4′-O-hexoside5.41C26H31O12535.18210535.18293−1.55355(100), 356(25), 489(4)323(4), 340(100)253(4), 267(100), 296(4), 312(4)Level 2bNA
55Medioresinol 4′-O-hexoside6.08C27H33O12549.19775549.20035−4.74354(15), 369(100), 370(17), 487(19), 505(12), 531(12)337(7), 353(9), 354(100)339(100)Level 2bNA
Identification confidence levels are assigned according to the Schymanski scale: Level 1—confirmed structure via reference standard; Level 2—probable structure (a: library match, b: diagnostic evidence); tR—retention time (min); Δ ppm—mean mass accuracy; DCM—dichloromethane extract; ME—methanol extract; ✚ stands for detected and – stands for not detected compound; NA—not available.

2.2. High-Performance Thin-Layer Chromatography (HPTLC) Phytochemical and Bioactivity Profiles of A. ceterach Extracts

2.2.1. Phenolic/Terpenoid Fingerprints of A. ceterach Extracts

Polyphenols are effective ROS scavengers, and their accumulation was established in several resurrection plants [41,42,43]. Accordingly, a high number of these compounds were identified in different extracts of A. ceterach sporophytes grown under normal conditions, suggesting their importance for desiccation and oxidative stress tolerance [44].
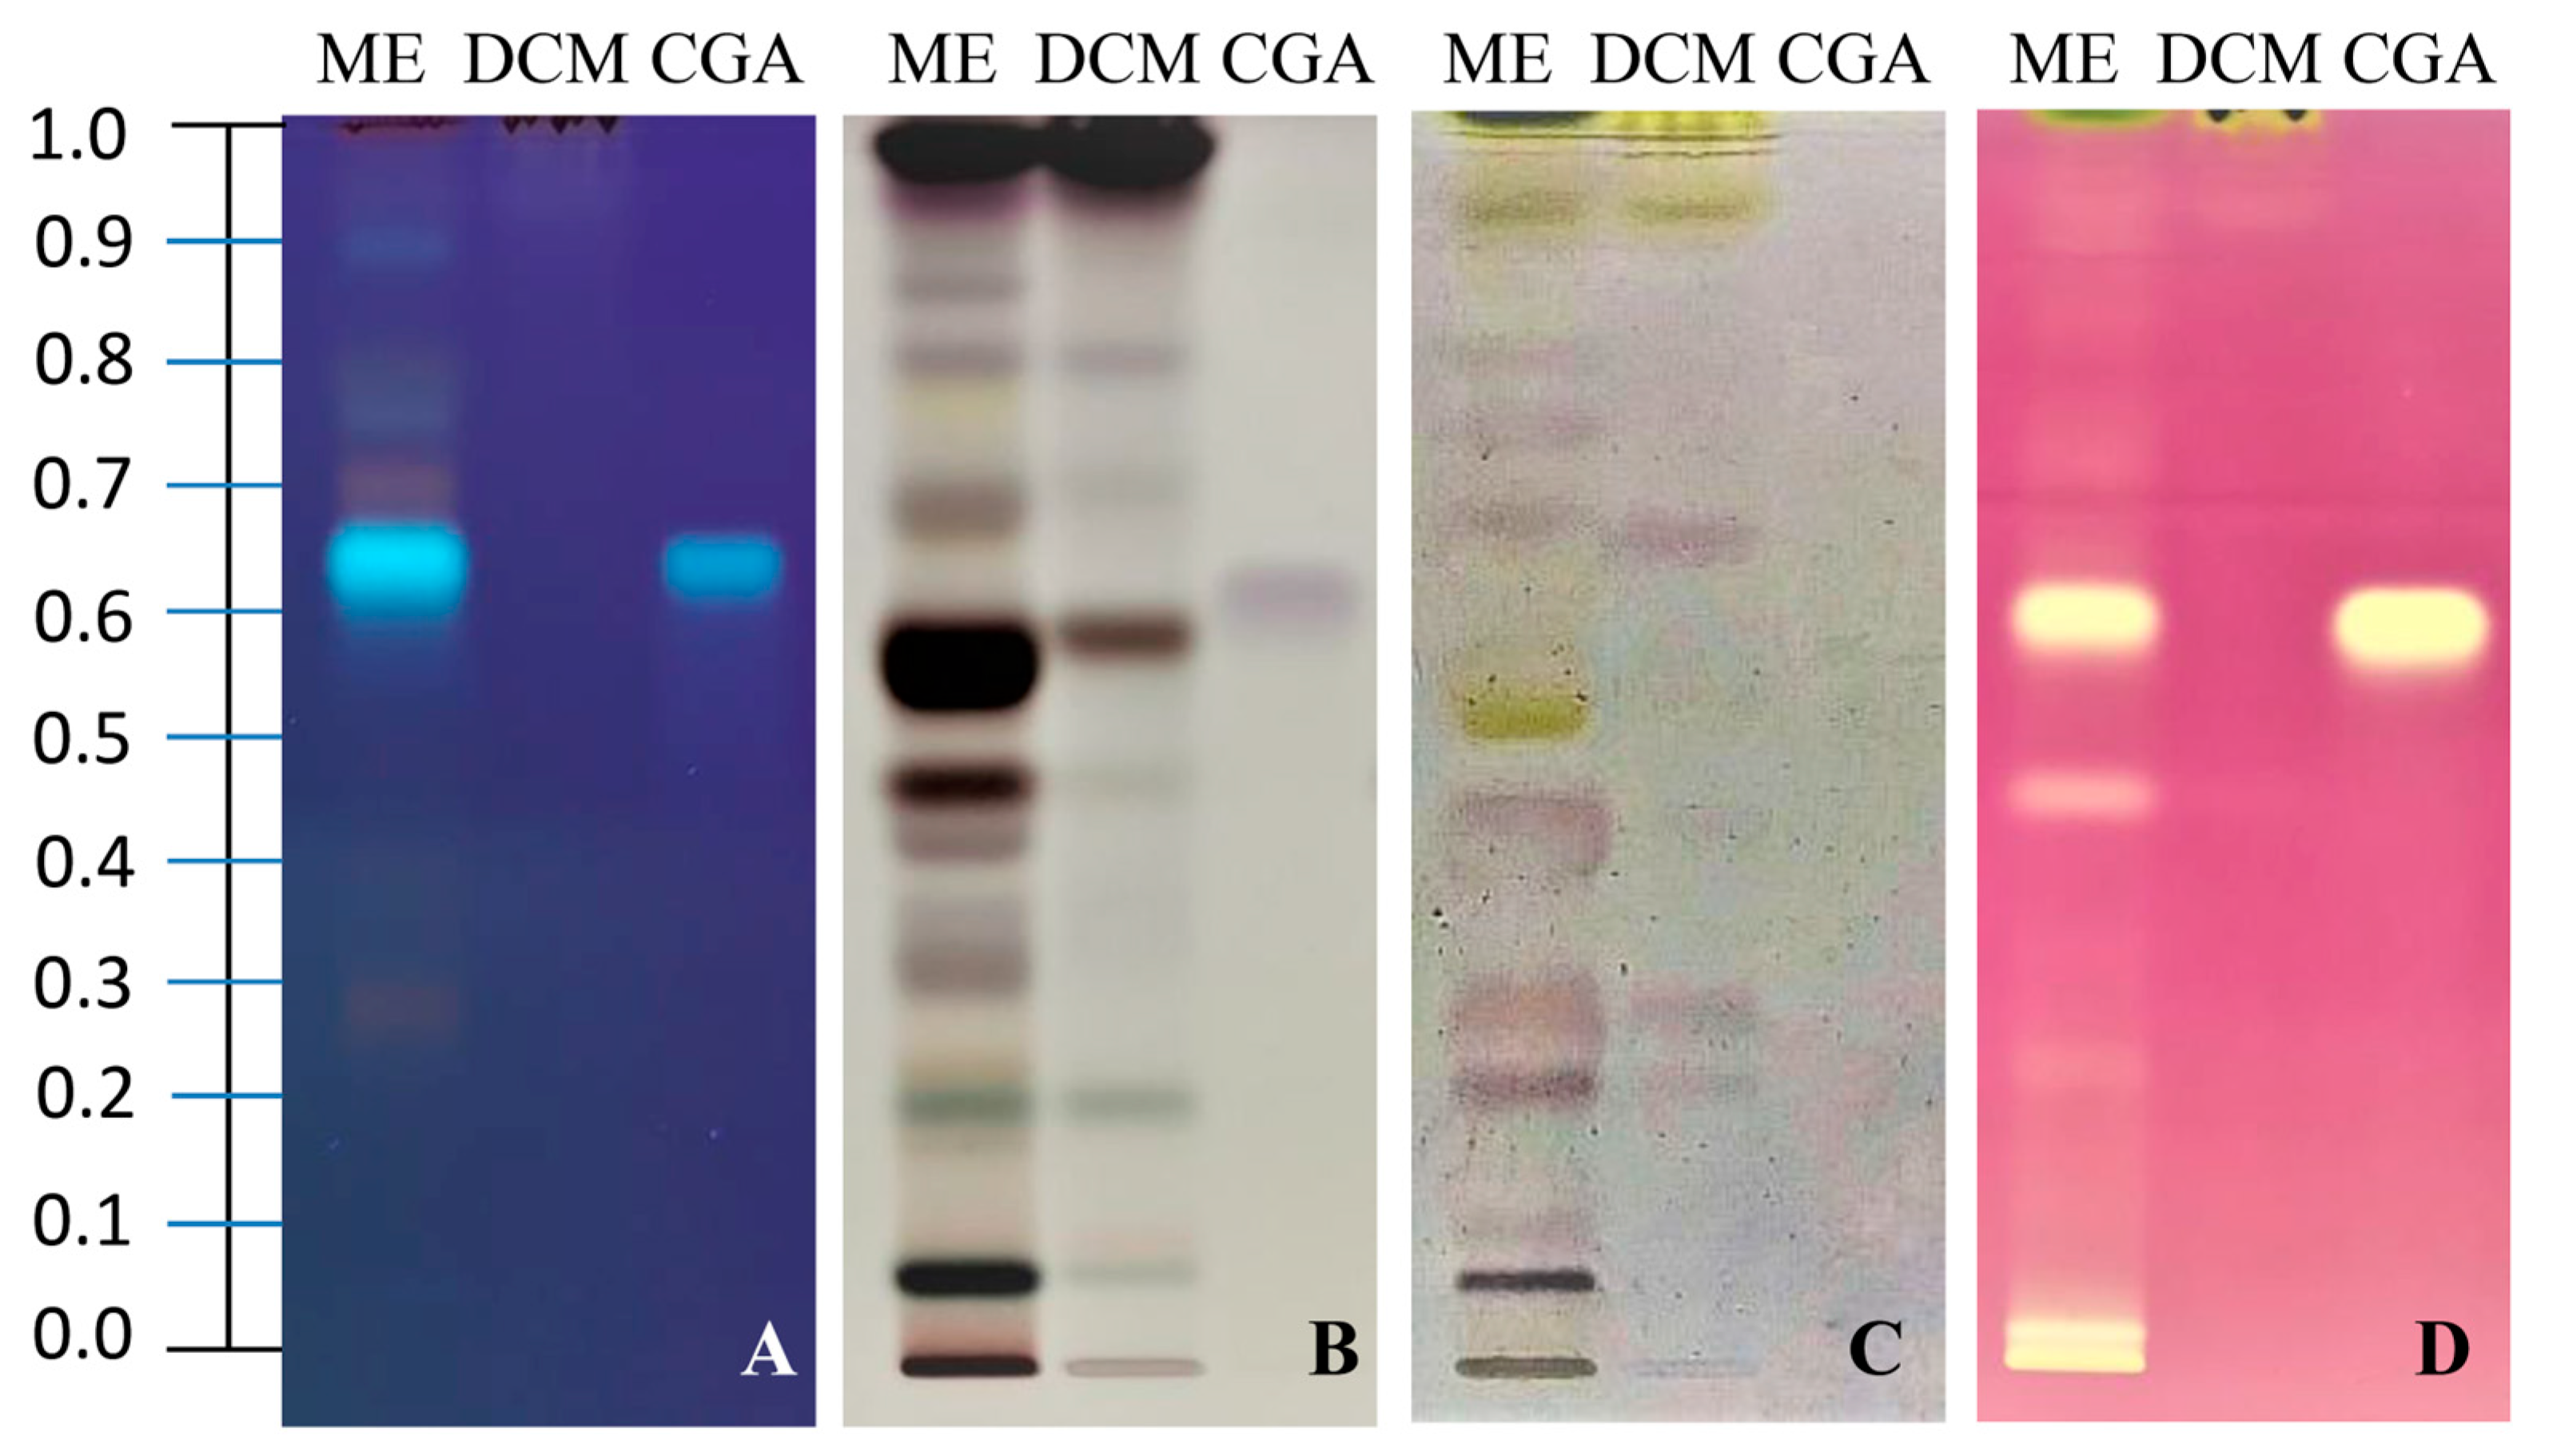
HPTLC and HPTLC-bioassays were used to obtain the phytochemical and bioactivity profiles of the ME and DCM extracts of A. ceterach sporophytes. Screening at 366 nm leveraged the native fluorescence of phenolic cores, yielding distinct blue, yellow, orange, and green zones [45] (Figure 2A). Under UV 366 nm, the ME extract exhibited a remarkably richer phenolic profile than the highly depleted DCM extract. A prominent blue zone at RF 0.64 in ME was identified as chlorogenic acid (5-O-caffeoylquinic acid, CGA), indicating its high abundance in ME, as confirmed in the literature [46,47,48,49]. Additionally, lower-intensity phenolic zones at RF 0.27, 0.70, 0.76, 0.79, and 0.90 were detected in ME. This HPTLC phenolic fingerprint strongly correlates with the UHPLC data, which revealed numerous caffeoylquinic acids in ME that were completely absent in DCM; the intense blue zone likely arises from single or co-eluting caffeoylquinic derivatives, including CGA. Conversely, the terpenoid profile (Figure 2B) was far more complex for both samples, with diterpenes emerging as the most abundant terpenoid class in this plant [50].
Within this fraction, a series of intense brown zones was identified as diterpenic compounds, led by a prominent band at RF 0.58 unique to ME. ME also displayed distinct diterpene bands at RF 0.08 and 0.47. Notably, the most prominent diterpenoid zone was detected near the solvent front at RF 0.98 in both samples, appearing slightly more intense in the DCM extract. Additionally, both samples contained a distinct constituent at RF 0.22, visualized as a green zone, strongly suggesting the presence of a triterpenoid derivative or sterol glycoside [51]. The DCM extract exhibited a structurally related brown zone at RF 0.60. The remaining gray-purple zones across the chromatogram of both extracts (0.32, 0.42, 0.69, 0.82, 0.85) most likely correspond to mono- and/or triterpenoids, further highlighting superior terpenoid complexity.

2.2.2. HPTLC-α-Amylase Assay

The results demonstrated that the ME extract possesses relatively higher α-amylase inhibitory activity compared to the DCM extract. Comparative evaluation of the HPTLC phytochemical and bioactivity profiles (Figure 2A–C) indicated that the observed inhibition may arise from chemically diverse constituents. Both extracts exhibited common bioactive zones at RF values of 0.22 and 0.29; however, these zones were noticeably more intense in the ME extract. The ME extract displayed additional prominent active zones at RF 0.47, 0.69 and 0.76. Conversely, a distinct active zone at RF 0.66 was uniquely observed in the DCM extract. Some of these inhibitory zones, particularly one at RF 0.47, overlapped with the p-anisaldehyde-positive zone, suggesting a possible contribution of terpenoid-like constituents. Conversely, the zone at RF 0.69, visualized in both p-anisaldehyde and NEU/PEG, and the active zone at RF 0.76, corresponding to a region of the phenolic fingerprint, indicate that phenolic constituents may also contribute to the observed inhibition. Indeed, terpenoids, including di- and triterpenes, as well as saponins, have been reported as potential inhibitors of carbohydrate-hydrolyzing enzymes such as α-amylase and α-glucosidase, contributing to their antidiabetic potential, supporting our findings [52]. Polyphenols may also contribute to the observed activity, as fern-derived flavonoids have previously demonstrated α-amylase inhibitory effects, potentially mediated by interactions with the enzyme, including hydrogen bonding [53]. Overall, the observed activity likely results from the combined contribution of chemically diverse constituents.
Notably, despite being the most prominent region in the ME phytochemical fingerprint, the CGA/caffeoylquinic acid region (RF 0.64) did not exhibit pronounced α-amylase inhibitory activity in our HTPLC-α-amylase analysis. This observation is consistent with studies describing CGA as a relatively weak α-amylase inhibitor [54], although higher inhibitory activity has been reported under different experimental conditions [55]. Nevertheless, other CGA derivatives identified in ME may contribute to the observed inhibition, as several caffeoylquinic acid derivatives have been reported as α-amylase inhibitors [54,55].

2.2.3. HPTLC-DPPH Assay

Considering the HPTLC-DPPH bioautogram, the ME extract demonstrated a significantly higher antioxidant potential than DCM (Figure 2D). The prominent DPPH-active zone corresponding to CGA indicated caffeoylquinic acids as major contributors to the antioxidant activity of the ME extract, whereas other phenolic zones (RF > 0.70) showed comparatively weak activity [56]. Nevertheless, non-phenolic constituents also contributed to the antioxidant profile, as indicated by the moderate activity of the p-anisaldehyde-positive zone near the solvent front (RF 0.98) in both extracts and the prominent active zone at RF 0.47 in ME.
The HPTLC-DPPH bioautogram identified caffeoylquinic acids as the main contributors to the antioxidant activity, whereas phenolic zones at RF > 0.70 showed negligible activity. A common terpenoid zone at RF 0.98 exhibited moderate activity in both extracts. In ME, the second most potent antioxidant contributor was the terpenoid zone at RF 0.47, supplemented by highly polar, non-phenolic/non-terpenoid constituents remaining at the application baseline (RF 0.00 and 0.02). Additional antioxidant activity was observed for highly polar constituents remaining near the application zone (RF 0.00–0.02), which may include highly polar phenolic compounds that were strongly retained on the normal-phase silica. Thus, comparative evaluation of the ME’s HPTLC fingerprints indicates that the antioxidant activity of the extracts results from contributions of chemically diverse constituents, with CGA/caffeoylquinic acids representing the most prominent contributors in the ME extract.
The antioxidant potential of various A. ceterach extracts has been extensively studied, including their DPPH radical scavenging capacity (for details see [7]). Generally, the capacity to scavenge radicals was concentration-dependent and increased with higher concentrations of the extract. Moreover, the antioxidant activity of A. ceterach was strongly correlated with the type of extract, with greater radical absorbance capacity observed for polar solvents compared to nonpolar ones [57]. Previous studies showed that the methanol extract of A. ruta-muraria exhibited significantly high DPPH antioxidant potential, presumably due to flavonoids, which were the dominant phenolic compounds [8]. Jarial et al. [58] reported that the maximum yield of extracted flavonoids from Asplenium nidus had remarkable DPPH radical-scavenging activity. In addition, the free radical-scavenging activity test showed that the ethyl acetate extract of Asplenium trichomanes exhibited higher antioxidant activity than extracts in less polar solvents. Furthermore, a significant correlation was found between levels of phenolics in ethyl acetate extracts of A. trichomanes and its antioxidant potential [59].

2.3. EPR Measurement of Scavenging Activity Towards DPPH and Hydroxyl Radicals

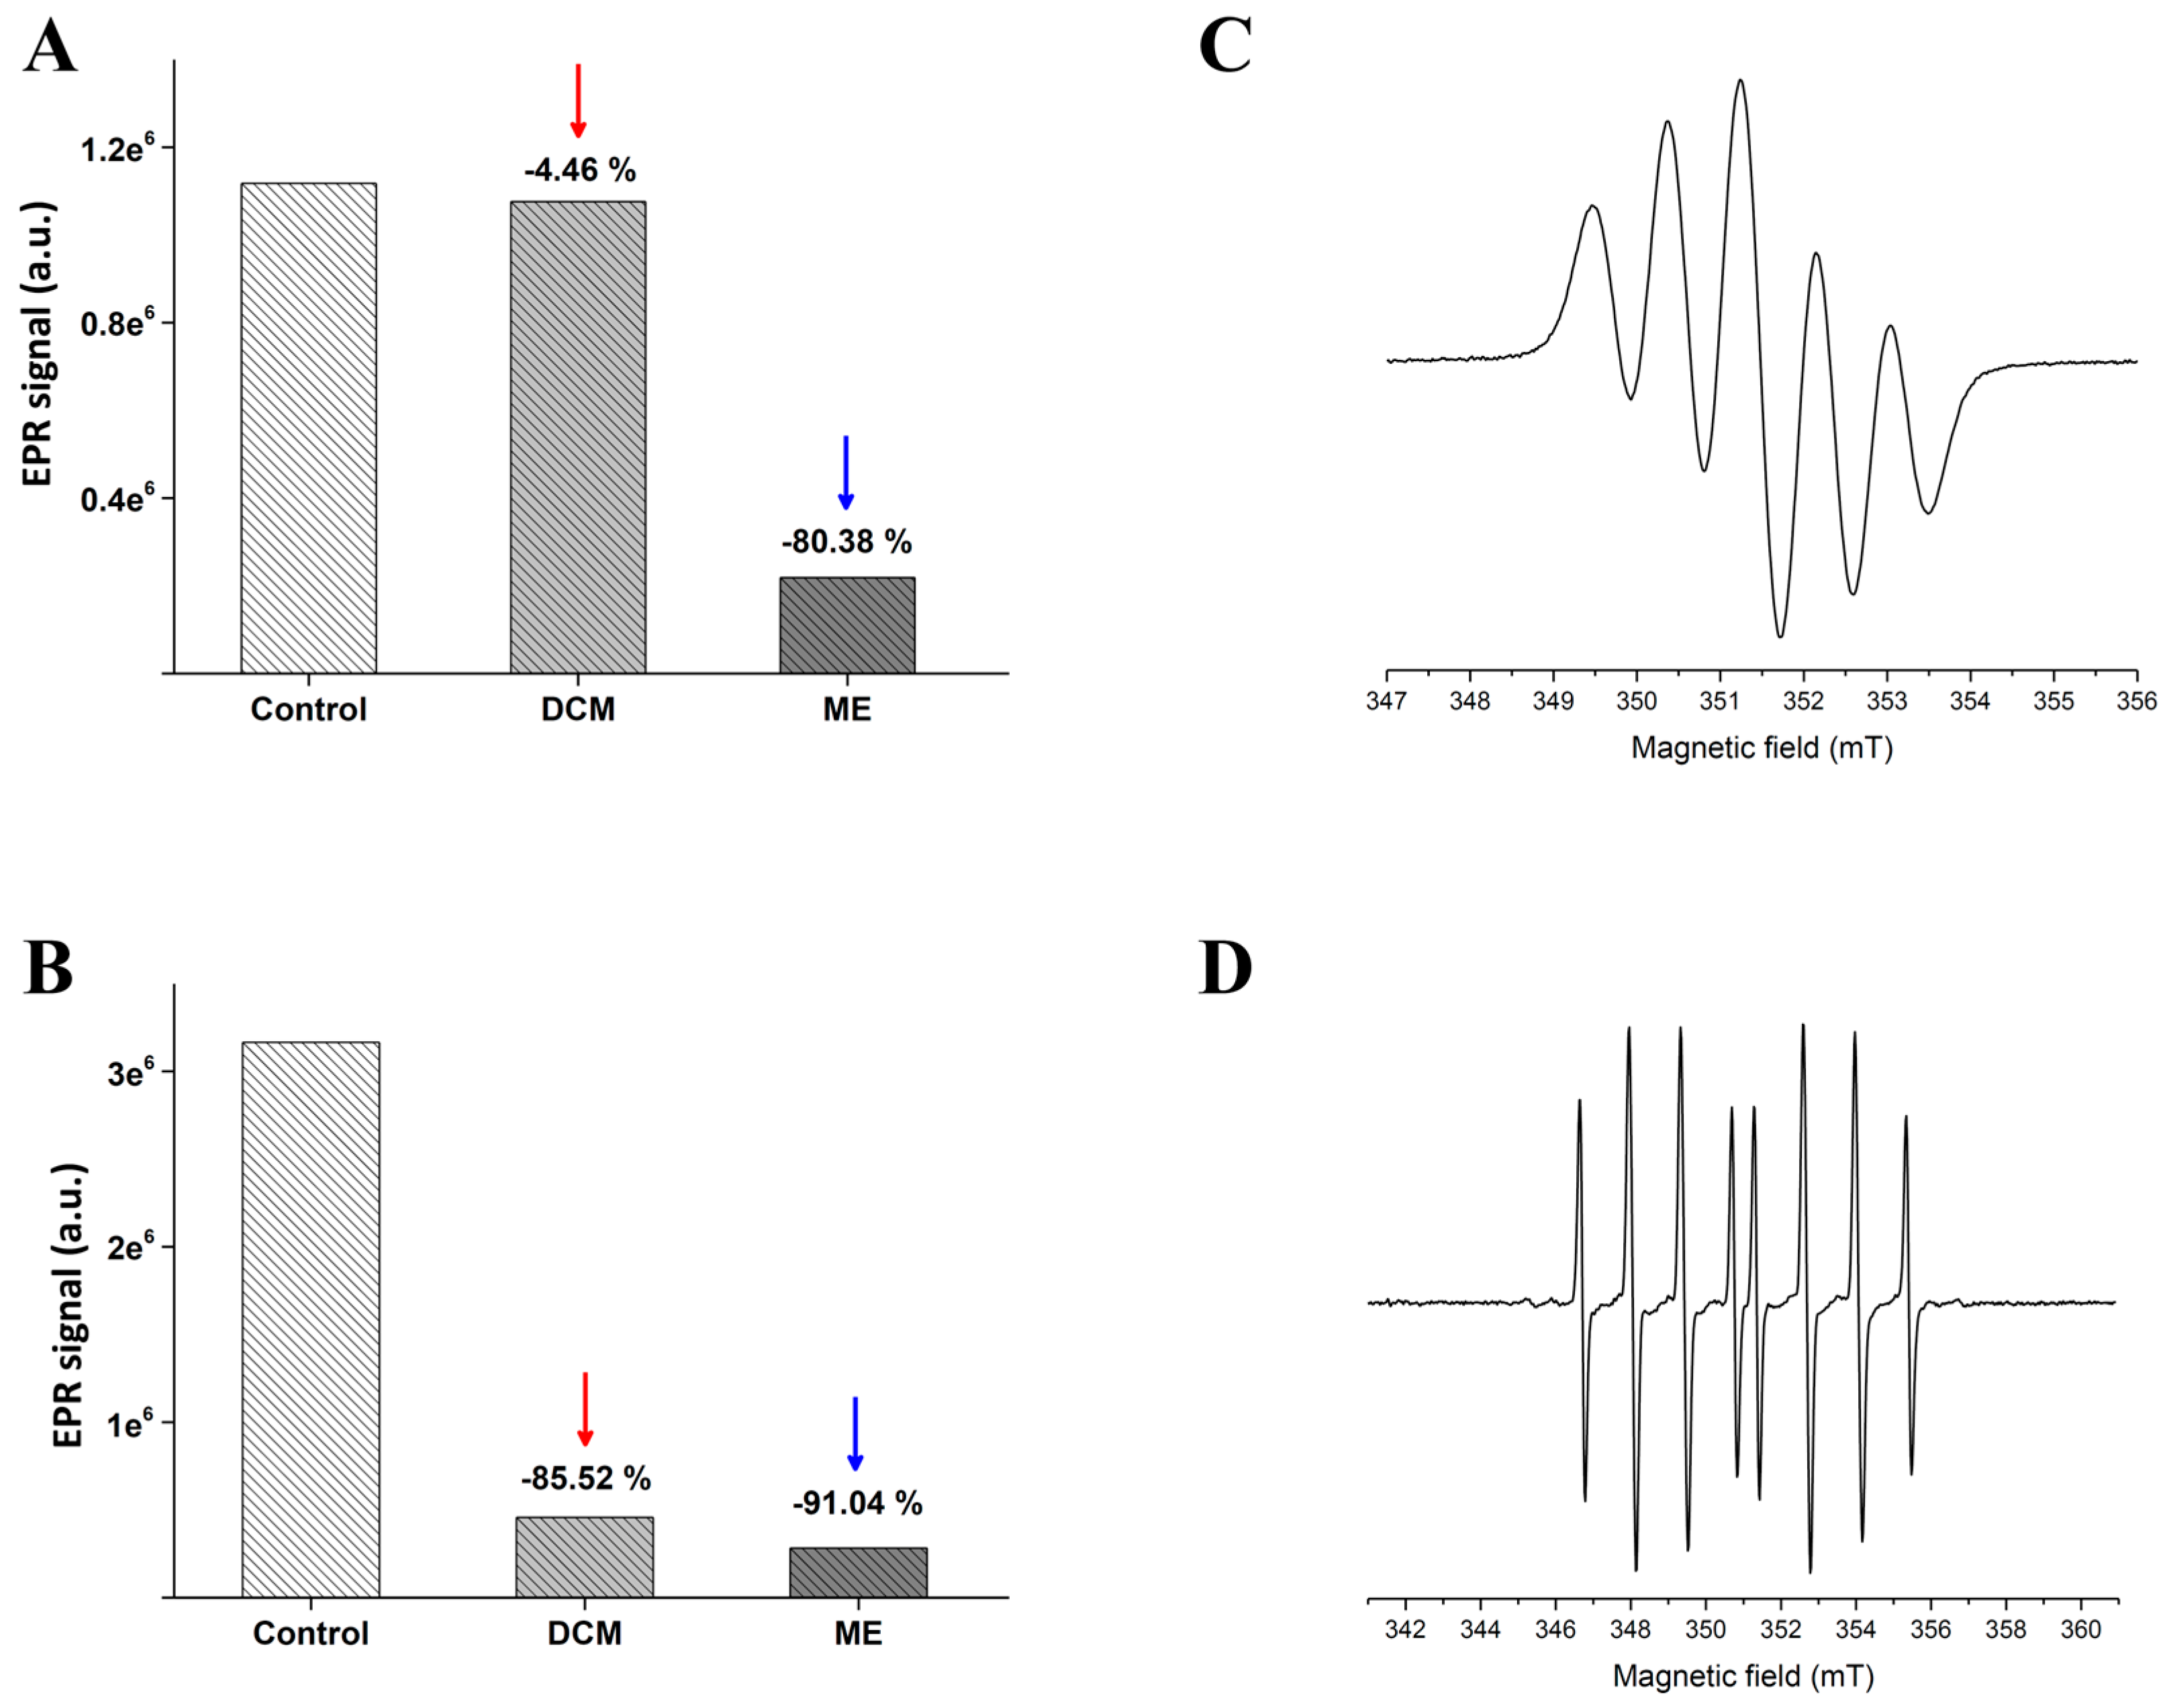
The in vitro DPPH radical scavenging activity of the extracts was also assessed using EPR spectroscopy, and results are presented in Figure 3A,C, where a higher percentage reduction in signal intensity indicates greater radical scavenging activity against DPPH.
Interestingly, higher anti-DPPH activity was recorded for the ME extract (80.38%) compared to the DCM extract (4.46%), which aligns with literature data showing that phenolics are often extracted in higher amounts with more polar solvents [60,61,62,63]. This finding is also consistent with phytochemical fingerprint reports, which showed that the ME extract is qualitatively richer in polyphenolics than the DCM samples; that is, significantly more redox-active components were found in the ME extract (Table 1, Figure 1). Considering the profile of redox-active components obtained by OrbiTrap analysis and the presented EPR results, there is strong evidence that phenolic acids and flavonoid glycosides, together with procyanidins, are responsible for the antioxidative capacity of A. ceterach extracts. To determine how the selected extracts are capable of removing biologically relevant short-lived radical species, such as OH, the Fenton reaction containing the spin trap DEPMPO was used. EPR spectroscopy enables direct and specific detection of short-lived radical species, offering a reliable approach for assessing OH radical scavenging activity in biological samples [64]. As shown in Figure 3B,D, fern extracts caused a decrease in the EPR signal intensity of DEPMPO/OH spin-adducts. Both ME and DCM extracts of A. ceterach demonstrated a remarkable scavenging effect against OH radicals (91.04% and 85.52%, respectively). According to Kukavica and co-workers [64], the ethanol extract of A. ceterach fronds also exhibited significant free radical scavenging and reducing abilities, as confirmed by various methods.

2.4. Antimicrobial and Antibiofilm Activity of A. ceterach Extracts

The antibacterial and antifungal activity of two extracts of A. ceterach sporophyte was comparatively tested against six bacterial and six fungal pathogens using the microdilution method. The results are presented as MIC and MBC/MFC in Table 2. Besides the standard tested bacterial strains, some clinical and food isolates were used as well.
Most food-borne illnesses are caused by S. aureus, B. cereus, L. monocytogenes, S. Typhimurium and E. coli, while S. aureus, P. aeruginosa, and E. coli give rise to some hospital-acquired infections. According to the results of the antibacterial test, both plant extracts showed noticeable activity against tested strains, although in variable degree. Minimal inhibitory concentration (MIC) for both extracts ranged from 0.25 to 1.50 mg mL−1, and minimal bactericidal concentration (MBC) was 0.75–2.00 mg mL−1. Although both extracts possessed lower antimicrobial activity compared to the standard antimicrobial agent streptomycin, the obtained results indicate that ME extract showed stronger antimicrobial activity than DCM. The Gram (−) bacterium E.coli and the Gram (+) bacterium B. cereus were the most sensitive bacterial species, since they were inhibited by all tested extracts (MIC values ranged from 0.25 to 0.75 mg mL−1). Several studies have shown that fern extracts have an antibacterial effect on both Gram (+) and Gram (−) bacteria; hence, the effect was more pronounced on Gram (+) bacteria. According to Petkov et al. [37], the methanol extract of A. ceterach showed activity against P. aeruginosa, while extracts of A. trichomanes and A. scolopendrium had no effect. On the other hand, extracts of all three Asplenium species exhibited an antibacterial effect on the Gram (+) bacterium B. cereus. Similarly, methanol extract of Asplenium nidus [65], A. adiantum–nigrum, and A. ruta muraria [8] exhibited significant activity against different Gram (−) bacteria. In addition, ME extract of A. incisum decreased the proliferation of the Gram (−) bacterium Porphyromonas gingivalis with sustained antibacterial activity for up to three days [66].
As shown in Table 2, ME and DCM extracts of A. ceterach possessed similar antifungal and anti-candidal activities, with MIC values ranging between 0.25 mg mL−1 and 1.50 mg mL−1, whereas fungicidal activities were within the 0.50–2.00 mg mL−1 range. The examined extracts displayed slightly weaker antifungal activity compared to ketoconazole (MIC 0.05–0.25 mg mL−1 and MFC 0.10–0.50 mg mL−1), which was used as a positive control. The most sensitive of all tested fungal species was the yeast C. krusei, with MIC ranging from 0.25 to 1.00 mg mL−1. The antifungal screening of A. adiantum-nigrum L. and A. ruta-muraria L. revealed that the frond ME extracts of both species were more effective against P. funiculosum than the commercial fungicides ketoconazole and bifonazole [8]. According to Chan and coworkers [67], the ME extracts of A. nidus showed fungicidal activity against the yeast species Issatchenkia orientalis with MFC values of 0.63 mg mL−1. In addition, it was recently shown that the ME extract of A. dalhousiae fronds displayed a pronounced inhibitory effect against Alternaria sp., while its antifungal activity against fungal strains such as Carvularia, Fusarium, Rhizopus, and Aspergillus was significantly lower [68]. Results regarding the antimicrobial activity of A. ceterach extracts used at concentrations equivalent to those applied with commercial antibiotics (<100 mg mL−1) clearly indicated a great bactericidal/fungicidal potential of fern extracts at a level comparable to antibiotics [69] and further support their use in traditional medicine against diseases caused by different microorganisms.
The tested extracts of A. ceterach fronds have shown significant capability to prevent C. albicans biofilm establishment (Table 3).
The highest levels of biofilm inhibition were observed for the extracts applied in concentrations equal to MIC and 0.5 MIC, with no significant difference between the two extracts examined (inhibition range 72–74%). The lowest concentration tested (0.25 MIC) resulted in the least inhibition of biofilm formation, with nearly 2.5 times higher inhibitory activity of DCM (48% inhibition) compared to ME extract (20% inhibition). Similar results were obtained for the ME extracts of A. ruta-muraria and A. adianthum-nigrum when tested for their potential to inhibit C. albicans biofilm formation and prevent initial cell attachment. Specifically, the ME frond of these two species exhibited significant antibiofilm activity even when applied at the sublethal concentrations of 0.5 MIC (inhibition ranging from 32% to 50%) and 0.25 MIC (8–37% inhibition) [8].
The excessive use of antibiotics significantly contributes to the development of bacterial resistance. In addition, biofilm formation is a bacterial resistance mechanism that acts as a physical barrier, metabolically limiting the effectiveness of antibiotic treatment [70]. Various plant-derived bioactive compounds have demonstrated potential antimicrobial and antibiofilm activity through mechanisms such as cell membrane disruption, inhibition of bacterial motility, proliferation, and adhesion, and interruption of quorum sensing (QS), which facilitates bacterial cell–cell communication [71]. The literature confirms that fern extracts are effective antibiofilm agents, showing biofilm-inhibitory activity in various model bacteria, including E. coli, S. aureus, P. aeruginosa, K. pneumoniae, Acinetobacter baumannii, S. flexneri [72,73], and S. epidermidis [74]. The percentage reduction in biofilm formation varied depending on the fern species and the polarity of the solvents used and was effective even at concentrations below 10 mg mL−1 in S. aureus and E. coli [73]. These findings indicate that fern extracts may play an important role in developing novel antibacterial agents to address the growing challenge of antibiotic resistance. There is also an urgent need to standardize methods and cut-off points for describing antimicrobial activities, as some authors report activities of extracts at concentrations above 10 mg mL−1 while others, including the current group of authors, consider only MIC values below 100 µg mL−1 (0.1 mg mL−1 for extracts) and 10 µg mL−1 (0.01 mg mL−1 for compounds) to be worthy of the label “active”.

2.5. Cytotoxic Activity of A. ceterach Extracts

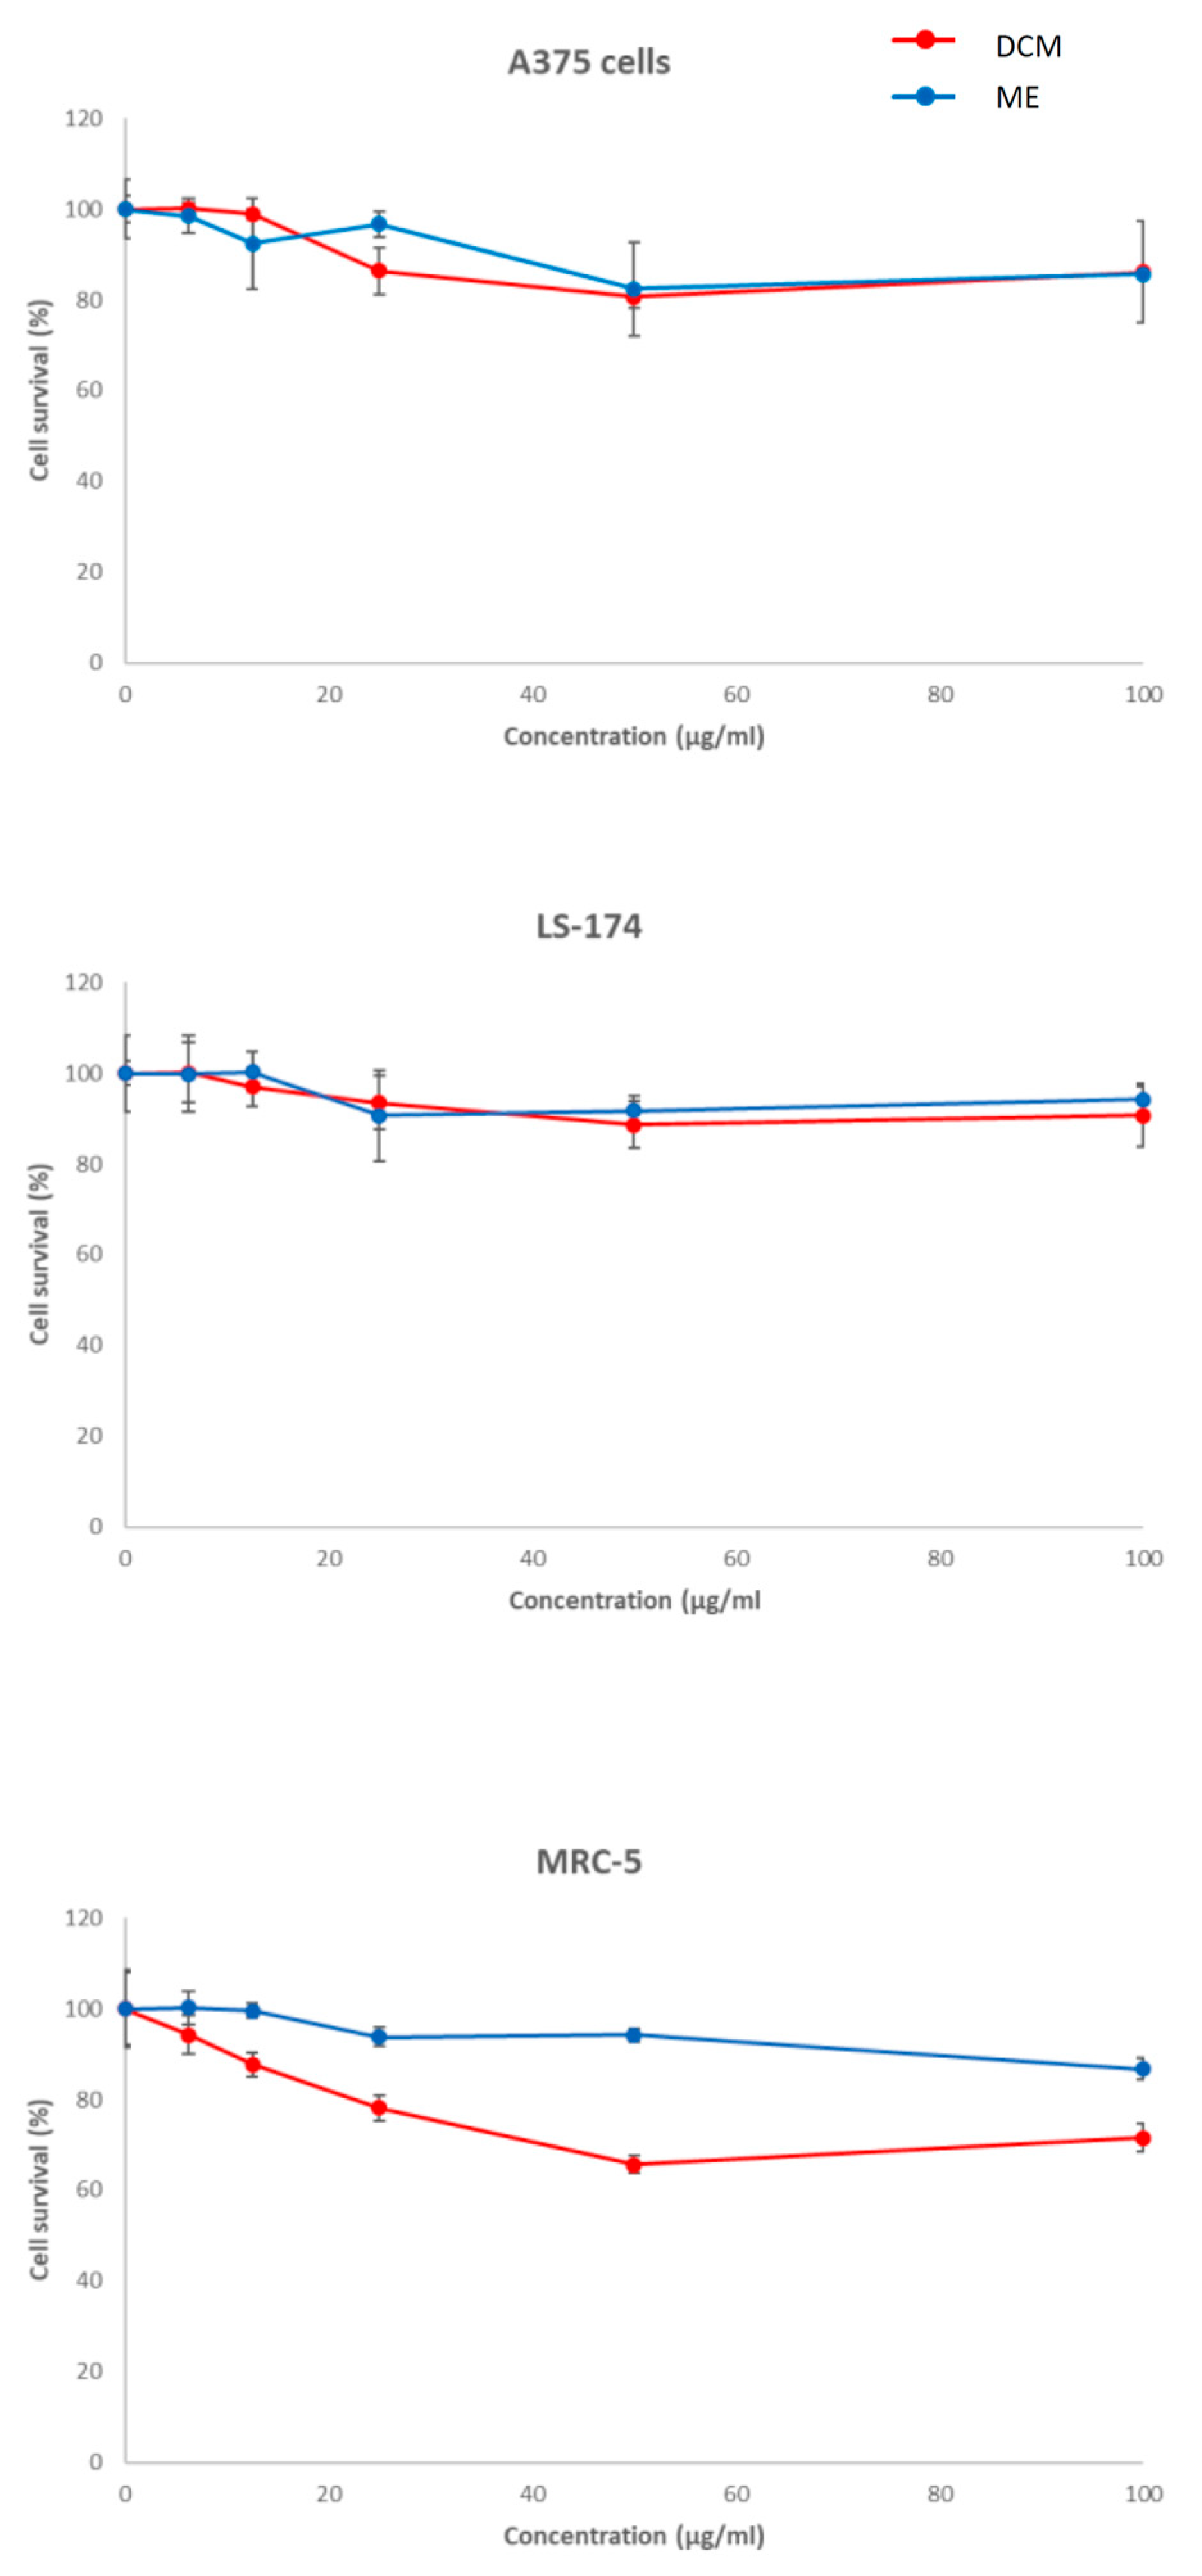
The cytotoxic activity of ME and DCM extracts from A. ceterach sporophytes on human melanoma cells (A375), human colon cancer cell lines (LS-174), and human fibroblast cells (MRC-5) was assessed using the MTT assay. The results are shown in Figure 4. Both extracts, after 72 h of continuous incubation, exhibited no cytotoxic activity on any of the tested cell lines at concentrations up to 100 μg mL−1. Furthermore, the extracts did not reduce cell survival below 60% at the highest concentration applied, clearly indicating the absence of cytotoxic potential in the tested cell lines. Cisplatin was used as a standard cytotoxic agent and exhibited IC50 values of 3.91 µg mL−1 in A375 cells, 20.22 µg mL−1 in LS-174 cells, and 6.45 µg mL−1 in MRC-5 cells.
The morphological characteristics of A375, LS-174, and MRC-5 cells following treatment with the extracts were analyzed using inverted microscopy. After 72 h of continuous treatment, the cell number was not reduced, and the cells retained their normal morphology, indicating an absence of cytotoxic activity within the investigated concentration range of fern extracts. These findings are consistent with the results obtained from the MTT assay (Supplementary Figure S1). Similarly, Farrás and coworkers [75] reported that ME extract of both A. ceterach and A. trichomanes fronds did not show cytotoxic effects on several human cancer cell lines (HeLa, HepG2, MCF-7, and A549) when applied at concentrations ranging from 0.01 to 1 mg mL−1. The methanolic extract of A. adiantum-nigrum L. fronds also did not exhibit cytotoxicity in non-tumor (3T3 and HaCaT) or tumor (HeLa, HepG2, and A549) cell lines [76]. In contrast, Petkov et al. [37] showed that the 70% aqueous methanol extract of A. ceterach exhibited the strongest cytotoxic activity towards HeLa cells compared to extracts of A. trichomanes and A. scolopendrium. Based on data on the chemical composition, Petkov et al. [37] suggested that the presence of phenolic compounds, primarily kaempferol and its derivatives, as well as tannins and ω-3 polyunsaturated fatty acids (PUFAs), contributed to the observed cytotoxic activity of the A. ceterach extract, although other compounds could also contribute. Similarly, Fatima et al. [77] showed that aqueous extract of A. ceterach has anticancer activity against two prostate cancer cell lines (PC3 and LNCaP). This extract was rich in phenols (~465 mg per 100 g) and flavonoids (~66 mg/100 g).
Additionally, ethanolic extracts of A. aethiopicum exhibited dose- and time-dependent cytotoxic activity against human A549 lung adenocarcinoma and African Green Monkey Kidney (VERO) cells, with IC50 values of 381.68 mg mL−1 and 714.28 mg mL−1, respectively [78]. The authors highlighted the presence of various bioactive compounds in the ethanolic extract of A. aethiopicum, which could contribute to its notable anticancer properties compared to other extracts prepared with solvents of different polarity (ether, acetone, chloroform, and water) used in this study. It is noteworthy that the biological activity of the plant extracts is influenced not only by major but also by minor components, as well as their possible synergistic and antagonistic effects [79,80,81]. This is probably the reason for the observed differences in the cytotoxic activity of various A. ceterach extracts.

3. Materials and Methods

3.1. Plant Material and Extracts Preparation

Mature sporophytes of Asplenium ceterach L. were collected in East Serbia near the Monastery Gornjak (44°15′52.66″ N 21°32′040.21″ E) and grown in a greenhouse of the Institute for Biological Research “Siniša Stanković”—National Institute of the Republic of Serbia, University of Belgrade (IBISS), at 25 ± 2 °C and a relative humidity of 60–90%. The species was authenticated by the authors, and the corresponding voucher specimens have been deposited at the Department of Plant Physiology, IBISS. Aerial plant parts (fronds) were ground and extracted with methanol (ME) or dichloromethane (DCM) (v:w = 10:1) (Fisher Scientific, Waltham, MA, USA), using an ultrasonic bath (RK100, Bandelin, Berlin, Germany) at room temperature. After centrifugation for 20 min at 13,400 rpm, the supernatants were collected and filtered through 15 mm RC filters with a 0.22 µm pore size (Econofilter, Agilent Technologies, Santa Clara, CA, USA) and kept in tinted vials at 4 °C until use. All extractions were performed in biological triplicate. For antimicrobial analysis, the extracts were further evaporated to dryness at room temperature, using a vacuum evaporator (Concentrator 5301, Eppendorf, Germany). Each dry extract was dissolved in 30% ethanol to a concentration of 20 mg mL−1 and stored in the dark at 4 °C until use.

3.2. UHPLC-LTQ Orbitrap MS Untargeted Metabolomics Analysis

Samples (fronds from mature sporophytes) were extracted with ME and DCM as described in Section 2.1.
LC/MS analysis was performed using an Accela UHPLC system (Thermo Fisher Scientific, Bremen, Germany) coupled to an LTQ OrbiTrap mass spectrometer equipped with a heated electrospray ionization (HESI) probe (Thermo Fisher Scientific, Bremen, Germany). An LC-MS method for metabolite profiling of two different A. ceterach extracts was performed as reported elsewhere [82].
A Syncronis C18 column (100 × 2.1 mm, 1.7 μm particle size) at 40 °C was used for compound separation. The flow rate was set at 0.250 mL/min, and the mobile phase consisted of (A) water + 0.1 % formic acid (MS grade) and (B) acetonitrile + 0.1 % formic acid. The injection volumes were 5 μL, and the linear gradient programs were as follows: 0.0–1.0 min at 5 % (B), 1.0–14.0 min from 5 % to 95 % (B), 14.0–14.1 min from 95 % to 5 % (B), and 5 % (B) for 6 min.
The MS spectra were acquired by full-range acquisition covering 100–1000 m/z. Resolution was set to 30,000 for full scan analysis. The data-dependent MS/MS events were always performed on the most intense ions detected in the full-scan MS. The ions of interest were isolated in the ion trap with an isolation width of 5 ppm and activated with 35 % collision energy.
R Studio software (version 2023.09.1, build 494, Posit Software, PBC, Boston, MA, USA) was used for raw untargeted LC-MS data extraction. The “internal” script, based on various R packages, such as the enviPick and xcms R packages [83], included extraction of retention times, exact masses, MS2–4 fragments with relative abundances, and prediction of molecular formulas. Furthermore, the filtering of the thus-obtained large data set with the aim of finally retaining only the peaks of interest was performed manually, with emphasis based on the polarity of the compounds and double bond equivalents (DBE). Annotation of the peaks was done through the SciFinder database [84] by searching the mentioned database using keywords, chemical and molecular formulas, and also the study of MS2–4 fragmentation.
Classification of the identified compounds (Table 1) was done according to confidence levels following the Schymanski framework [85].

3.3. High Performance Thin Layer Chromatography (HPTLC)

Chromatographic separation was performed on HPTLC silica gel 60 F254 plates (Merck, Darmstadt, Germany). The extracts, together with a methanolic standard solution of chlorogenic acid (1 mg mL−1; Sigma-Aldrich, Steinheim, Germany), were applied to the plates as 8 mm bands using a semi-automatic sampler (Linomat 5, CAMAG, Muttenz, Switzerland). Chromatographic conditions were performed using an optimized procedure as described by Milutinović et al. [82]. The application volume for all samples was precisely 2 µL. Chromatograms were developed at room temperature in a twin-trough chamber, previously saturated with a mobile phase system of ethyl acetate–formic acid–acetic acid–water (100:11:11:27, v/v/v/v) tailored for the efficient resolution of the species’ characteristic phenolic compounds [86]. After development, the HPTLC chromatograms were dried in a stream of warm air for 3 min and subsequently derivatized or detected using different reagents to reveal the presence of bioactive constituents. After detection, the HPTLC chromatograms were documented using a mobile phone camera (Huawei P20 lite) and saved in TIFF format for further analysis and archiving.

3.3.1. HPTLC Phenolic Profiles

For the detection of phenolic compounds, the developed HPTLC plates were visualized under UV light at λ = 366 nm, exploiting the inherent natural fluorescence of the separated phenolic constituents.

3.3.2. HPTLC Terpenoid Profiles

To visualize the terpenoid profiles, the developed HPTLC plates were derivatized with p-anisaldehyde reagent following well-established literature procedures [87]. Upon derivatization, the presence of diterpenes was confirmed by the appearance of brown zones, whereas gray and purple zones indicated mono- and triterpenes, respectively.

3.3.3. HPTLC-α-Amylase Assay

Amylase inhibition assays were carried out according to [88], using a starch-iodine complexation test for visualization. According to the literature, differences in zone coloration are directly related to the degree of starch hydrolysis. Intact amylose chains, which require a critical length to form stable helices, produce a characteristic, dark-blue complex with iodine, whereas partially hydrolyzed starch fractions, such as shorter-chain dextrins, form complexes that shift the absorption spectrum, resulting in purple or reddish-brown zones. The inactive zones appeared as white or pale backgrounds, indicating no colored complex formation with the iodine solution.

3.3.4. HPTLC-DPPH Assay

The HPTLC-DPPH assay was performed according to the procedure described by Milutinović et al. [82]. Following chromatographic development, the chromatogram was immersed in a 0.1% (w/v) solution of DPPH radical in methanol. After incubation in the dark, antioxidant-active compounds appeared as yellow zones against a purple background, corresponding to the reduction of the DPPH radical in the presence of bioactive constituents.

3.4. EPR Measurements of Antioxidant Activity

The antioxidant activity was measured by an electron paramagnetic resonance (EPR) spectrometer (Bruker ELEXSYS-II spectrometer, Rheinstetten, Germany) operating in X-band. EPR spectra were analyzed using Xepr software, version 2.6b.84 (Bruker BioSpin GmbH, Rheinstetten, Germany), following the method described by Nakarada et al. [85] and Milutinović et al. [82]. To evaluate the capacity of extracts to remove OH radicals, a Fenton reaction containing the spin trap DEPMPO was deployed as previously described [82,89]. The reaction system (final volume: 29 μL) was prepared by combining 1 μL of extract solution (previously diluted 1000-fold with water), 25 μL of deionized water, 2 μL of H2O2 (final concentration 0.35 mM), and 1 μL of DEPMPO spin trap (final concentration 3.5 mM). The reaction was initiated by adding 1 μL of FeSO4, yielding a final concentration of 0.15 mM. Immediately after preparation, the mixture was transferred into a gas-permeable Teflon capillary tube, and EPR measurements were performed after 2 min incubation at room temperature (293 K). Spectral acquisition was carried out under the following conditions: center field 350.0 mT, microwave power 10 mW, microwave frequency 9.85 GHz, modulation frequency 100 kHz, and modulation amplitude 0.1 mT. For control measurements, the extract was omitted and replaced with the corresponding volume of solvent. Hydroxyl radical scavenging activity (AA) was determined according to the equation:
A A = I c I a I C 100   %
where Ic represents the double integral value obtained for the control sample, while Ia corresponds to the sample containing the extract. These values were calculated from the recorded EPR spectra using Xepr software.
The potential of extracts to scavenge DPPH radicals was investigated using previously developed methodology [90]. A 1 µL aliquot of the extract (previously diluted 1000-fold with water) was mixed with 29 µL of a freshly prepared 210 µM DPPH solution in ethanol. The reaction mixture was left to incubate for 2 min at room temperature, and then the EPR signal was immediately recorded under the following parameters: center field 350.0 mT, microwave power 10 mW, microwave frequency 9.85 GHz, modulation frequency 100 kHz, and modulation amplitude 0.2 mT. For control measurements, the same volume of pure ethanol was used in place of the extracts.

3.5. In Vitro Antimicrobial and Antibiofilm Activity

A. ceterach extracts were tested against Gram (+) bacteria: Bacillus cereus (food isolate Bc-AC-11), Staphylococcus aureus (ATCC 11632) and Listeria monocytogenes (NCTC 7973), Gram (−) bacteria Escherichia coli (ATCC 25922), Pseudomonas aeruginosa (ATCC 27853), and Salmonella Typhimurium (ATCC 13311) and fungi: Aspergillus fumigatus (ATCC 204305), Aspergillus niger (ATCC 6275), Penicillium funiculosum (ATCC 36839), Penicillium verrucosum var. cyclopium (food isolate Pvc–DS–11), Candida albicans (ATCC 10231) and Candida krusei (clinical isolates K1/16). The bacterial strains were cultured on solid Tryptic Soy agar (TSA), while micromycetes were cultured on solid malt agar (MA) and yeast were sustained on Sabouraud dextrose agar medium (SDA). The cultures were subcultured once a month and stored at 4 °C for further utilization. All the tested microorganisms are deposited at the Mycological Laboratory, Department of Plant Physiology, Institute for Biological Research “Siniša Stanković”—National Institute of the Republic of Serbia, University of Belgrade. The minimum inhibitory and bactericidal/fungicidal concentrations (MICs, MBCs/MFCs) and antibiofilm activity of plant extracts were determined as reported earlier [8].

3.6. Cytotoxic Activity

3.6.1. Reagents

3-(4,5-dymethylthiazol-yl)-2,5-diphenyltetrazolium bromide (MTT), dimethyl sulfoxide (DMSO), and sodium dodecyl sulfate (SDS) were obtained from Sigma-Aldrich (Sigma Chemicals Co., St. Louis, MO, USA), as well as all culture media and serum.

3.6.2. Cell Culture

The human melanoma A375 (ATCC, CRL-1619), human colon carcinoma LS-174 (ATCC, CL-188), and human fetal lung fibroblast MRC-5 (ATCC, CCL-171) cell lines were maintained as monolayer cultures in the Roswell Park Memorial Institute (RPMI) 1640 nutrient medium (Sigma Chemicals Co., St. Louis, MO, USA). RPMI 1640 nutrient medium (Gibco, Grand Island, NY, USA) was prepared in sterile ionized water, supplemented with penicillin (100 IU mL−1), streptomycin (200 µg mL−1), 4-(2-hydroxyethyl)piperazine-1-ethanesulfonic acid (HEPES) (25 mM), L-glutamine (3 mM), and 10% heat-inactivated fetal calf serum (FCS) (pH 7.2). The cells were grown at 37 °C in a humidified atmosphere containing 5% CO2.

3.6.3. MTT Assay

The cytotoxicity of the investigated extracts and cisplatin (as a reference compound) was determined using the 3-(4,5-dimethylthiazol-yl)-2,5-diphenyltetrazolium bromide assay as previously described [91]. Briefly, 24 h after seeding the cells into 96-well cell culture plates (Thermo Scientific Nunc™, Rochester, NY, USA), the cells were exposed to the investigated extracts, which were dissolved in DMSO at a concentration of 10 mg mL−1 and afterward diluted in culture medium to the desired concentrations. The final DMSO concentration never exceeded 1% (v:v). After an incubation period of 72 h, 20 μL of MTT solution (5 mg mL−1 in phosphate buffer, pH 7.2) was added to each well. Samples were incubated for 4 h at 37 °C in a humidified atmosphere of 5% CO2, and then 100 μL of 10% sodium dodecyl sulfate (SDS) was added. Absorbance was recorded after 24 h, on an enzyme-linked immunosorbent assay (ELISA) reader (Thermo Labsystems Multiskan EX, Waltham, MA, USA; 200–240 V) at a wavelength of 570 nm. The IC50 value, defined as the concentration of the extracts causing 50% cell growth inhibition, was determined from the cell survival diagrams.

3.6.4. Morphological Analysis

The A375, LS-174, and MRC-5 cells were seeded into 96-well plates (Thermo Scientific Nunc™, Rochester, NY, USA) in nutrient medium. After 24 h of growth, the cells were treated with extracts in the desired range of concentrations. Following 72 h of treatment, the cells were observed under the inverted microscope for cell culture Olympus CKX53 (Tokyo, Japan) equipped with an Olympus EP50 camera (Tokyo, Japan), using a 10 × 0.25 objective.

4. Conclusions

Extracts of A. ceterach fronds exhibited significant antioxidant activity, moderate alpha-amylase inhibition, and notable antimicrobial and anti-biofilm effects without cytotoxic activity. The indicated biological activities may be attributed to the numerous polyphenolic compounds identified by untargeted metabolomic analysis, including phenolic acids and derivatives, flavonoid glycosides, and proanthocyanidins. These findings not only reinforce the traditional use of A. ceterach but also provide substantial evidence for the diverse therapeutic potential of this fern species, suggesting its promise as a source of natural compounds for managing oxidative stress and inflammation induced by microbial infections. Furthermore, the observed lack of cytotoxicity highlights the potential of A. ceterach extract as a safe matrix for developing novel phytotherapeutic preparations. Consequently, further research is required to elucidate the mechanisms of action of the A. ceterach extract and to develop novel therapeutic agents with antimicrobial and anti-biofilm activities. These findings represent a crucial screening step, while subsequent research focusing on optimizing extraction protocols using eco-friendly, safer solvents, alongside comprehensive stability and toxicological safety evaluations, is needed in order to facilitate future pharmaceutical applications.

Supplementary Materials

The following supporting information can be downloaded at https://www.mdpi.com/article/10.3390/molecules31172978/s1. Figure S1: Morphological changes in A375, LS-174 and MRC-5 cells after treatment with 100 µg mL−1 of ME and DCM extracts of A. ceterach for 72 h.

Author Contributions

Conceptualization, M.S., M.M. (Milica Milutinović), and S.Ž.; methodology, M.M. (Milica Milutinović), M.S., U.G., Đ.N., M.I., A.Ć., Đ.I., P.R., L.L. and N.G.; software, U.G.; validation, U.G., M.M. (Miloš Mojović), P.R., N.G., A.Ć., M.S. and S.Ž., formal analysis, M.I., Đ.I., U.G., P.R., Đ.N., N.G. and S.Ž.; investigation, M.M. (Milica Milutinović), M.S., U.G., Đ.N., M.I., A.Ć., Đ.I., P.R., L.L. and N.G.; resources, M.S., S.Ž., M.M. (Miloš Mojović), P.R. and N.G.; writing—original draft preparation, S.Ž., M.S., U.G. and M.M. (Milica Milutinović); writing—review and editing, A.Ć., P.R., M.M. (Miloš Mojović), Đ.N. and N.G.; visualization, M.S., U.G., Đ.N. and S.Ž.; supervision, M.S. and S.Ž. All authors have read and agreed to the published version of the manuscript.

Funding

This work was funded by The Science Fund of the Republic of Serbia, Serbian Science and Diaspora Collaboration Program, No. 6389927; Ministry of Science, Technological Development, and Innovation of the Republic of Serbia, grant numbers: 451-03-33/2026-03/200168, 451-03-33/2026-03/200288, 451-03-33/2026-03/200043, 451-03-33/2026-03/200007, 451-03-136/2025-03/200007, 451-03-66/2024-03/200007, 451-03-68/2023-14/200288, 451-03-68/2023-14/200146, and 451-03-47/2023-01/200007.

Institutional Review Board Statement

Not applicable.

Informed Consent Statement

Not applicable.

Data Availability Statement

The original contributions presented in this study are included in the article/Supplementary Material. Further inquiries can be directed to the corresponding authors.

Acknowledgments

The results presented in this manuscript are in line with Sustainable Development Goal 3 (Good Health and Wellbeing) of the United Nations 2030 Agenda.

Conflicts of Interest

Đurđa Ivković is an employee of Innovative Centre of the Faculty of Chemistry Ltd. The other authors declare no conflicts of interest. Innovative Centre of the Faculty of Chemistry Ltd. had no role in the design of the study; in the collection, analyses, or interpretation of data; in the writing of the manuscript; or in the decision to publish the results.

Abbreviations

The following abbreviations are used in this manuscript:
MEMethanol extract of Asplenium ceterach
DCMDichloromethane extract of Asplenium ceterach
DTDesiccation-tolerant
HPTLCHigh-performance thin-layer chromatography
CGA5-O-caffeoylquinic acid
EPRElectron Paramagnetic Resonance
DPPH2,2-diphenyl-1-picrylhydrazyl
HRMSHigh-Resolution Mass Spectrometry
MICminimum inhibitory concentrations
MBCminimum bactericidal concentration
MFCminimum fungicidal concentration
MTT3-(4,5-dymethylthiazol-yl)-2,5-diphenyltetrazolium bromide
DMSOdimethyl sulfoxide

References

  1. Oliver, M.J.; Tuba, Z.; Mishler, B.D. The evolution of vegetative desiccation tolerance in land plants. Plant Ecol. 2000, 151, 85–100. [Google Scholar] [CrossRef] [Scilit]
  2. Alpert, P.; Oliver, M.J. Drying without drying. In Desiccation and Survival in Plants: Drying Without Dying; Black, M., Pritchard, H.W., Eds.; CABI Publishing: Wallingford, UK, 2002; pp. 3–43. [Google Scholar]
  3. Proctor, M.C.F.; Pence, V.C. Vegetative tissues: Bryophytes, vascular resurrection plants and vegetative propagules. In Desiccation and Survival in Plants: Drying Without Dying; Black, M., Pritchard, H.W., Eds.; CAB International: Wallingford, UK, 2002; pp. 207–237. [Google Scholar]
  4. Watkins, J.E.; Mack, M.C.; Mulkey, S.S. Gametophyte ecology and demography of epiphytic and terrestrial tropical ferns. Am. J. Bot. 2007, 94, 701–708. [Google Scholar] [CrossRef] [Scilit]
  5. Watkins, J.E.; Mack, M.C.; Sinclair, T.R.; Mulkey, S.S. Ecological and evolutionary consequences of desiccation tolerance in tropical fern gametophytes. New Phytol. 2007, 176, 708–717. [Google Scholar] [CrossRef] [Scilit]
  6. Pittermann, J.; Brodersen, C.; Watkins, J.E., Jr. The physiological resilience of fern sporophytes and gametophytes: Advances in water relations offer new insights into an old lineage. Front. Plant Sci. 2013, 4, 285. [Google Scholar] [CrossRef] [Scilit]
  7. Živković, S.; Milutinović, M.; Skorić, M. Phytochemicals and Biological Activities of Asplenium ceterach. In Bioactive Compounds in Bryophytes and Pteridophytes; Murthy, H.N., Ed.; Springer International Publishing: Cham, Switzerland, 2022; pp. 1–29. [Google Scholar] [CrossRef] [Scilit]
  8. Živković, S.; Milutinović, M.; Maksimović, V.; Ćirić, A.; Ivanov, M.; Božunović, J.; Banjanac, T.; Mišić, D. Antioxidant and antimicrobial activity of two Asplenium species. S. Afr. J. Bot. 2020, 132, 180–187. [Google Scholar] [CrossRef] [Scilit]
  9. Alara, O.R.; Abdurahman, N.H.; Ukaegbu, C.I. Extraction of phenolic compounds: A review. Curr. Res. Food Sci. 2021, 4, 200–214. [Google Scholar] [CrossRef] [Scilit]
  10. Dai, J.; Mumper, R.J. Plant Phenolics: Extraction, Analysis and Their Antioxidant and Anticancer Properties. Molecules 2010, 15, 7313–7352. [Google Scholar] [CrossRef] [Scilit] [PubMed]
  11. Ahmed, S.; Alsharif, K.F.; Aschner, M.; Alzahrani, K.J.; Akkol, E.K.; Türkcanoğlu, E.G.; Khan, H. A deep dive into herbal extraction: Techniques, trends, and technological advancements. S. Afr. J. Bot. 2026, 188, 9–37. [Google Scholar] [CrossRef] [Scilit]
  12. Živković, S.; Milutinović, M.; Gašić, U.; Ivanov, M.; Ćirić, A.; Banjanac, T.; Skorić, M. Bioactivity of different Asplenium ceterach L. extracts. In Book of Abstracts: 4th International Conference on Plant Biology and 23rd SPPS Meeting, Belgrade, Serbia, 6–8 October 2022; Milutinović, M., Ed.; Serbian Plant Physiology Society: Belgrade, Serbia, 2022; p. 128. [Google Scholar]
  13. Virtbauer, J.; Krenn, L.; Kählig, H.; Hüfner, A.; Donath, O.; Marian, B. Chemical and pharmacological investigations of Metaxya rostrata. Z. Naturforsch. C 2008, 63, 469–475. [Google Scholar] [CrossRef] [Scilit]
  14. Franca, M.G.A.; Cavalheiro, A.J.; Silva, M.G.V. A Comprehensive LC-DAD-QTOF-MS Method for Dereplication of Bioactive Compounds in Senna Extracts. Rev. Bras. Farmacogn. 2021, 31, 32–39. [Google Scholar] [CrossRef] [Scilit]
  15. Huang, X.; Wang, W.; Gong, T.; Wickell, D.; Kuo, L.Y.; Zhang, X.; Wen, J.; Kim, H.; Lu, F.; Zhao, H.; et al. The flying spider-monkey tree fern genome provides insights into fern evolution and arborescence. Nat. Plants 2022, 8, 500–512. [Google Scholar] [CrossRef] [Scilit] [PubMed]
  16. Gleńsk, M.; Dudek, M.K.; Ciach, M.; Włodarczyk, M. Isolation and structural determination of flavan-3-ol derivatives from the Polypodium vulgare L. rhizomes water extract. Nat. Prod. Res. 2021, 35, 1474–1483. [Google Scholar] [CrossRef] [Scilit]
  17. Campos, M.F.; Mendonça, S.C.; Peñaloza, E.M.C.; de Oliveira, B.A.C.; Rosa, A.S.; Leitão, G.G.; Tucci, A.R.; Ferreira, V.N.S.; Oliveira, T.K.F.; Miranda, M.D.; et al. Anti-SARS-CoV-2 Activity of Ampelozizyphus amazonicus (Saracura-Mirá): Focus on the Modulation of the Spike-ACE2 Interaction by Chemically Characterized Bark Extracts by LC-DAD-APCI-MS/MS. Molecules 2023, 28, 3159. [Google Scholar] [CrossRef] [Scilit]
  18. Nuwamanya, H.; Lukubye, B.; Kagoro-Rugunda, G.; Ajayi, C.O.; Wangalwa, R.; Olet, E.A. Phytochemical profile and antimicrobial activity of individual frond extracts of Menisorus pauciflorus, Pteris catoptera, Coniogramme africana and Antrophyum mannianum. BMC Complement. Med. Ther. 2025, 25, 262. [Google Scholar] [CrossRef] [Scilit]
  19. Ye, W.; Fan, C.; Zhang, L.; Yin, Z.; Zhao, S. A new phenolic glycoside from the roots of Lygodium japonicum. Fitoterapia 2007, 78, 600–601. [Google Scholar] [CrossRef] [Scilit]
  20. Fan, P.; Zhao, L.; Hostettmann, K.; Lou, H. Chemical constituents of Asplenium ruta-muraria L. Nat. Prod. Res. 2012, 26, 1413–1418. [Google Scholar] [CrossRef] [Scilit]
  21. Yao, H.; Duan, J.; Zhang, C.; Li, Y.; Liu, C. Coumaric Acid Glucosides from the Chinese Fern Polypodium hastatum. Chem. Nat. Compd. 2016, 52, 669–671. [Google Scholar] [CrossRef] [Scilit]
  22. Garcia, F.; Pivel, J.P.; Guerrero, A.; Brieva, A.; Martinez-Alcazar, M.P.; Caamano-Somoza, M.; Gonzalez, S. Phenolic components and antioxidant activity of Fernblock, an aqueous extract of the aerial parts of the fern Polypodium leucotomos. Methods Find. Exp. Clin. Pharmacol. 2006, 28, 157–160. [Google Scholar] [CrossRef] [Scilit]
  23. Saito, T.; Yamane, H.; Murofushi, N.; Takahashi, N.; Phinney, B.O. 4-O-Caffeoylshikimic and 4-O-(p-Coumaroyl)shikimic Acids from the Dwarf Tree Fern, Dicksonia antarctica. Biosci. Biotechnol. Biochem. 1997, 61, 1397–1398. [Google Scholar] [CrossRef] [Scilit]
  24. Wan, X.; Zeng, W.; Zhang, D.; Wang, L.; Lei, M.; Chen, T. Changes in the concentration, distribution, and speciation of arsenic in the hyperaccumulator Pteris vittata at different growth stages. Sci. Total Environ. 2022, 841, 156708. [Google Scholar] [CrossRef] [Scilit]
  25. Wu, P.L.; Hsu, Y.L.; Zao, C.W.; Damu, A.G.; Wu, T.S. Constituents of Vittaria anguste-elongata and their biological activities. J. Nat. Prod. 2005, 68, 1180–1184. [Google Scholar] [CrossRef] [Scilit]
  26. Gouveia, S.; Gonçalves, J.; Castilho, P.C. Characterization of phenolic compounds and antioxidant activity of ethanolic extracts from flowers of Andryala glandulosa ssp varia (Lowe ex DC.) R. Fern., an endemic species of Macaronesia region. Ind. Crops Prod. 2013, 42, 573–582. [Google Scholar] [CrossRef] [Scilit]
  27. Cui, C.B.; Tezuka, Y.; Kikuchi, T.; Nakano, H.; Tamaoki, T.; Park, J.H. Constituents of a fern, Davallia mariesii Moore. IV. Isolation and structures of a novel norcarotane sesquiterpene glycoside, a chromone glucuronide, and two epicatechin glycosides. Chem. Pharm. Bull. 1992, 40, 2035–2040. [Google Scholar] [CrossRef] [Scilit]
  28. Imperato, F. A new kaempferide 3,7-diglycoside from the fern Asplenium bulbiferum. Chem. Ind. 1984, 18, 667–668. [Google Scholar]
  29. Imperato, F. A new flavonol 3,7-diglycoside from the fern Cheilanthes fragrans. Chem. Ind. 1984, 24, 878–879. [Google Scholar]
  30. Tomou, E.M.; Skaltsa, H. Phytochemical Investigation of the Fern Asplenium ceterach (Aspleniaceae). Nat. Prod. Commun. 2018, 13, 849–850. [Google Scholar] [CrossRef] [Scilit]
  31. Johnson, M.A.A.; Gowtham, J.; Janakiraman, N.; Renisheya Joy Jeba Malar, T.; Rocha, J.E.; Coutinho, H.D.M. Phytochemical Profile of Asplenium aethiopicum (Burm. f.) Becherer Using HPTLC. Separations 2020, 7, 8. [Google Scholar] [CrossRef] [Scilit]
  32. Iwashina, T.; López-Sáez, J.A.; Herrero, A.; Kitajima, J.; Matsumoto, S. Flavonol glycosides from Asplenium foreziense and its five related taxa and A. incisum. Biochem. Syst. Ecol. 2000, 28, 665–671. [Google Scholar] [CrossRef] [Scilit]
  33. Imperato, F. A new flavonol glycoside from the fern Asplenium nidus. Chem. Ind. 1987, 14, 487. [Google Scholar]
  34. Mizuno, M.; Kyotani, Y.; Iinuma, M.; Tanaka, T.; Kojima, H.; Iwatsuki, K. Kaempferol Glycosides in Asplenium scolopendvium Newm. Z. Naturforsch. C 1990, 45, 143–146. [Google Scholar] [CrossRef] [Scilit]
  35. Swinny, E.E. A novel acetylated 3-deoxyanthocyanidin laminaribioside from the fern Blechnum novae-zelandiae. Z. Naturforsch. C 2001, 56, 177–180. [Google Scholar] [CrossRef] [Scilit]
  36. Umikalsom, Y.; Harborne, J.B. Flavonol O-glycosides from the Pinnae of Asplenium Marinum L. Pertanika J. Trop. Agric. Sci. 1991, 14, 139–141. [Google Scholar]
  37. Petkov, V.; Batsalova, T.; Stoyanov, P.; Mladenova, T.; Kolchakova, D.; Argirova, M.; Raycheva, T.; Dzhambazov, B. Selective Anticancer Properties, Proapoptotic and Antibacterial Potential of Three Asplenium Species. Plants 2021, 10, 1053. [Google Scholar] [CrossRef] [Scilit]
  38. Zeng, W.-W.; Lai, L.-S. Characterization of the mucilage isolated from the edible fronds of bird’s nest fern (Asplenium australasicum). Food Hydrocoll. 2014, 40, 163–172. [Google Scholar] [CrossRef] [Scilit]
  39. Yang, J.H.; Kondratyuk, T.P.; Jermihov, K.C.; Marler, L.E.; Qiu, X.; Choi, Y.; Cao, H.; Yu, R.; Sturdy, M.; Huang, R.; et al. Bioactive compounds from the fern Lepisorus contortus. J. Nat. Prod. 2011, 74, 129–136. [Google Scholar] [CrossRef] [Scilit]
  40. Menéndez, V.; Abul, Y.; Bohanec, B.; Lafont, F.; Fernández, H. The effect of exogenous and endogenous phytohormones on the in vitro development of gametophyte and sporophyte in Asplenium nidus L. Acta Physiol. Plant. 2011, 33, 2493–2500. [Google Scholar] [CrossRef] [Scilit]
  41. Veljovic-Jovanovic, S.; Kukavica, B.; Navari-Izzo, F. Characterization of polyphenol oxidase changes induced by desiccation of Ramonda serbica leaves. Physiol. Plant. 2008, 132, 407–416. [Google Scholar] [CrossRef] [Scilit]
  42. Bentley, J.; Olsen, E.K.; Moore, J.P.; Farrant, J.M. The phenolic profile extracted from the desiccation-tolerant medicinal shrub Myrothamnus flabellifolia using Natural Deep Eutectic Solvents varies according to the solvation conditions. Phytochemistry 2020, 173, 112323. [Google Scholar] [CrossRef] [Scilit]
  43. Georgieva, K.; Mihailova, G.; Gigova, L.; Dagnon, S.; Simova-Stoilova, L.; Velitchkova, M. The role of antioxidant defense in freezing tolerance of resurrection plant Haberlea rhodopensis. Physiol. Mol. Biol. Plants 2021, 27, 1119–1133. [Google Scholar] [CrossRef] [Scilit]
  44. Moyankova, D.; Mladenov, P.; Berkov, S.; Peshev, D.; Georgieva, D.; Djilianov, D. Metabolic profiling of the resurrection plant Haberlea rhodopensis during desiccation and recovery. Physiol. Plant. 2014, 152, 675–687. [Google Scholar] [CrossRef] [Scilit]
  45. Quinty, V.; Colas, C.; Nasreddine, R.; Nehmé, R.; Piot, C.; Draye, M.; Destandau, E.; Da Silva, D.; Chatel, G. Screening and Evaluation of Dermo-Cosmetic Activities of the Invasive Plant Species Polygonum cuspidatum. Plants 2023, 12, 83. [Google Scholar] [CrossRef] [Scilit]
  46. Živković, S.; Popović, M.; Dragišić-Maksimović, J.; Momčilović, I.D.; Grubišić, D. Dehydration-related changes of peroxidase and polyphenol oxidase activity in fronds of the resurrection fern Asplenium ceterach L. Arch. Biol. Sci. 2010, 62, 1071–1081. [Google Scholar] [CrossRef] [Scilit]
  47. Živković, S.; Skorić, M.; Šiler, B.; Dmitrović, S.; Filipović, B.; Nikolić, T.; Mišić, D. Phytochemical characterization and antioxidant potential of rustyback fern (Asplenium ceterach L.). Lek. Sirovine 2017, 37, 15–20. [Google Scholar] [CrossRef] [Scilit]
  48. De Bellis, R.; Piacentini, M.P.; Meli, M.A.; Mattioli, M.; Menotta, M.; Mari, M.; Valentini, L.; Palomba, L.; Desideri, D.; Chiarantini, L. In vitro effects on calcium oxalate crystallization kinetics and crystal morphology of an aqueous extract from Ceterach officinarum: Analysis of a potential antilithiatic mechanism. PLoS ONE 2019, 14, e0218734. [Google Scholar] [CrossRef] [Scilit]
  49. Sidhoum, R.; Bey, M.B.; Halli, L.; Yalaoui, O.; Belkadi, A. Phenolic profile, anti-inflammatory and diuretic properties of Asplenium ceterach tested on albino mice and Wistar albino rats. Asian J. Res. Chem. 2020, 13, 449–454. [Google Scholar] [CrossRef] [Scilit]
  50. Agatonovic-Kustrin, S.; Kustrin, E.; Gegechkori, V.; Morton, D.W. High-Performance Thin-Layer Chromatography Hyphenated with Microchemical and Biochemical Derivatizations in Bioactivity Profiling of Marine Species. Mar. Drugs 2019, 17, 148. [Google Scholar] [CrossRef] [Scilit]
  51. Wagner, H.; Bladt, S. Plant Drug Analysis: A Thin Layer Chromatography Atlas, 2nd ed.; Springer: Berlin/Heidelberg, Germany, 1996. [Google Scholar]
  52. Papoutsis, K.; Zhang, J.; Bowyer, M.C.; Brunton, N.; Gibney, E.R.; Lyng, J. Fruit, vegetables, and mushrooms for the preparation of extracts with α-amylase and α-glucosidase inhibition properties: A review. Food Chem. 2021, 338, 128119. [Google Scholar] [CrossRef] [Scilit]
  53. Hendra, R.; Army, M.K.; Frimayanti, N.; Teruna, H.Y.; Abdulah, R.; Nugraha, A.S. α-glucosidase and α-amylase inhibitory activity of flavonols from Stenochlaena palustris (Burm.f.) Bedd. Saudi Pharm. J. 2024, 32, 101940. [Google Scholar] [CrossRef] [Scilit]
  54. Song, Y.; Li, W.; Yang, H.; Peng, X.; Yang, X.; Liu, X.; Sun, L. Caffeoyl substitution decreased the binding and inhibitory activity of quinic acid against α-amylase: The reason why chlorogenic acid is a relatively weak enzyme inhibitor. Food Chem. 2022, 371, 131278. [Google Scholar] [CrossRef] [Scilit]
  55. Narita, Y.; Inouye, K. Kinetic analysis and mechanism on the inhibition of chlorogenic acid and its components against porcine pancreas α-amylase isozymes I and II. J. Agric. Food Chem. 2009, 57, 9218–9225. [Google Scholar] [CrossRef] [Scilit]
  56. Tošović, J.; Marković, S.; Marković, J.M.D.; Mojović, M.; Milenković, D. Antioxidative mechanisms in chlorogenic acid. Food Chem. 2017, 237, 390–398. [Google Scholar] [CrossRef] [Scilit]
  57. Farràs, A.; Cásedas, G.; Les, F.; Terrado, E.M.; Mitjans, M.; López, V. Evaluation of antityrosinase and antioxidant properties of four fern species for potential cosmetic applications. Forests 2019, 10, 179. [Google Scholar] [CrossRef] [Scilit]
  58. Jarial, R.; Thakur, S.; Sakinah, M.; Zularisam, A.W.; Sharad, A.; Kanwar, S.S.; Singh, L. Potent anticancer, antioxidant and antibacterial activities of isolated flavonoids from Asplenium nidus. J. King Saud Univ. Sci. 2018, 30, 185–192. [Google Scholar] [CrossRef] [Scilit]
  59. Ondo, J.P.; Obame, L.C.; Andzi Barhé, T.; Nsi Akoue, G.; Nsi Emvo, E.; Lebibi, J. Phytochemical screening, total phenolic content and antiradical activity of Asplenium africanum (Aspleniaceae) and fruit of Megaphrinium macrostachyum (Marantaceae). J. Appl. Pharm. Sci. 2013, 3, 92–96. [Google Scholar] [CrossRef]
  60. Sultana, B.; Anwar, F.; Ashraf, M. Effect of extraction solvent/technique on the antioxidant activity of selected medicinal plant extracts. Molecules 2009, 14, 2167–2180. [Google Scholar] [CrossRef] [Scilit]
  61. Shon, M.Y.; Choi, S.D.; Kahng, G.G.; Nam, S.H.; Sung, N.J. Antimutagenic, antioxidant and free radical scavenging activity of ethyl acetate extracts from white, yellow and red onions. Food Chem. Toxicol. 2004, 42, 659–666. [Google Scholar] [CrossRef] [Scilit]
  62. Božunović, J.; Ivanov, M.; Petrović, J.; Gašić, U.; Nakarada, Đ.; Milutinović, M.; Aničić, N.; Giba, Z.; Mišić, D.; Stojković, D. Solvent System-Guided Extraction of Centaurium spicatum (L.) Fritch Provides Optimized Conditions for the Biological and Chemical Characteristics of the Herbal Extracts. Pharmaceuticals 2023, 16, 245. [Google Scholar] [CrossRef] [Scilit]
  63. Thouri, A.; Chahdoura, H.; El Arem, A.; Hichri, A.O.; Ben Hassin, R.; Achour, L. Effect of solvents extraction on phytochemical components and biological activities of Tunisian date seeds (var. Korkobbi and Arechti). BMC Complement. Altern. Med. 2017, 17, 248. [Google Scholar] [CrossRef] [Scilit]
  64. Kukavica, B.; Škondrić, S.; Ignjatović, T.; Trifković, T.; Mihajlović, D.; Nakarada, Đ.; Mojović, M.; Živković, S. Antioxidant activity and content of selected micronutrients in the fronds of Asplenium ceterach. Acta Sci. Balc. 2026, 7, 47–61. [Google Scholar] [CrossRef] [Scilit]
  65. Setyati, D.; Adawiyah, R.; Ratnasari, T.; Su’udi, M.; Bahrul Ulum, F. Phenolic Profile and Antimicrobe of the Asplenium nidus L. from Mount Gumitir, Jember, East Java, Indonesia. Bioedukasi J. Biol. Pembelajaran 2023, 21, 85–94. [Google Scholar] [CrossRef]
  66. Moon, S.H.; Son, J.L.; Shin, S.J.; Oh, S.H.; Kim, S.H.; Bae, J.M. Inhibitory Effect of Asplenium incisum on Bacterial Growth, Inflammation, and Osteoclastogenesis. Medicina 2021, 57, 641. [Google Scholar] [CrossRef] [Scilit]
  67. Chan, Y.S.; Cheah, Y.H.; Chong, P.Z.; Khor, H.L.; Teh, W.S.; Khoo, K.S.; Ong, H.C.; Sit, N.W. Antifungal and cytotoxic activities of selected medicinal plants from Malaysia. Pak. J. Pharm. Sci. 2018, 31, 119–127. [Google Scholar] [CrossRef] [Scilit]
  68. Zaib, S.; Klačanová, S.; Khan, R.; Bibi, N.; Hussain, M. Evaluation and identification of antibacterial, antifungal, antioxidant, and phytotoxic activities of Asplenium dalhousiae Hook., a potential medicinal Pteridophyte. Pak. J. Bot. 2024, 56, 1993–2000. [Google Scholar] [CrossRef] [Scilit]
  69. Kuete, V. Potential of Cameroonian plants and derived products against microbial infections: A review. Planta Medica 2010, 76, 1479–1491. [Google Scholar] [CrossRef] [Scilit]
  70. Bie, S.; Yuan, H.; Shi, C.; Li, C.; Lu, M.; Yao, Z.; Liu, R.; Lu, D.; Ma, T.; Yu, H. Antibiofilm activity of Plumbagin against Staphylococcus aureus. Sci. Rep. 2025, 15, 7948. [Google Scholar] [CrossRef] [Scilit]
  71. Alam, K.; Al Farraj, D.A.; Mah-e-Fatima, S.; Yameen, M.A.; Elshikh, M.S.; Alkufeidy, R.M.; Mustafa, A.E.-Z.M.; Bhasme, P.; Alshammari, M.K.; Alkubaisi, N.A.; et al. Anti-biofilm activity of plant derived extracts against infectious pathogen-Pseudomonas aeruginosa PAO1. J. Infect. Public Health 2020, 13, 1734–1741. [Google Scholar] [CrossRef] [Scilit]
  72. Adnan, M.; Patel, M.; Deshpande, S.; Alreshidi, M.; Siddiqui, A.J.; Reddy, M.N.; Emira, N.; De Feo, V. Effect of Adiantum philippense Extract on Biofilm Formation, Adhesion with Its Antibacterial Activities Against Foodborne Pathogens, and Characterization of Bioactive Metabolites: An in vitro–in silico Approach. Front. Microbiol. 2020, 11, 823. [Google Scholar] [CrossRef] [Scilit]
  73. Prabhakar, S.; Suresh, S.; Premanath, R. Assessment of Anti-biofilm Activity of Ferns Against Nosocomial Pathogenic Bacteria. Biomed. Pharmacol. J. 2023, 16, 1717–1724. [Google Scholar] [CrossRef] [Scilit]
  74. Balada, C.; Díaz, V.; Castro, M.; Echeverría-Bugueño, M.; Marchant, M.J.; Guzmán, L. Protective Effects of Microsorum scolopendria (Burm.f.) Copel. Leaf and Rhizome Extracts on Oxidative Stress and Inflammation Induced by Staphylococcus aureus and Staphylococcus epidermidis. Antioxidants 2025, 14, 1194. [Google Scholar] [CrossRef] [Scilit]
  75. Farràs, A.; Mitjans, M.; Maggi, F.; Caprioli, G.; Vinardell, M.P.; López, V. Exploring wild Aspleniaceae ferns as safety sources of polyphenols: The case of Asplenium trichomanes L. and Ceterach officinarum Willd. Front. Nutr. 2022, 9, 994215. [Google Scholar] [CrossRef] [Scilit]
  76. Farràs, A.; López, V.; Maggi, F.; Caprioli, G.; Vinardell, M.P.; Mitjans, M. Chemical Composition and Cytoprotective Activities of Methanolic Extract of Asplenium adiantum-nigrum L. (Aspleniaceae). Horticulturae 2022, 8, 815. [Google Scholar] [CrossRef] [Scilit]
  77. Fatima, A.; Laila, O.; Murtaza, I. Nutraceutical Composition and Anti-Cancerous Potential of an Unexplored Herb Asplenium ceterach from Kashmir Region. Indian J. Pure App. Biosci. 2020, 8, 289–297. [Google Scholar] [CrossRef] [Scilit]
  78. Antonysamy, J.M.A.; Janarthanan, G.; Rocha, J.E.; de Almeida, R.S.; de Vasconcelos, J.E.L.; dos Santos, F.A.V.; de Farias, P.A.M.; Coutinho, H.D.M. Chemical characterization and in vitro anticancer effect of Asplenium aethiopicum (Burm. f.) Becherer. S. Afr. J. Bot. 2023, 154, 372–379. [Google Scholar] [CrossRef] [Scilit]
  79. Caesar, L.K.; Cech, N.B. Synergy and antagonism in natural product extracts: When 1 + 1 does not equal 2. Nat. Prod. Rep. 2019, 36, 869–888. [Google Scholar] [CrossRef] [Scilit]
  80. Vaou, N.; Stavropoulou, E.; Voidarou, C.; Tsakris, Z.; Rozos, G.; Tsigalou, C.; Bezirtzoglou, E. Interactions between Medical Plant-Derived Bioactive Compounds: Focus on Antimicrobial Combination Effects. Antibiotics 2022, 11, 1014. [Google Scholar] [CrossRef] [Scilit]
  81. Armonavičius, D.; Maruška, A.; Jakštys, B.; Stankevičius, M.; Drevinskas, T.; Bimbiraitė-Survilienė, K.; Čaplikaitė, M.; Ihara, H.; Takafuji, M.; Skrzydlewska, E.; et al. Evaluation of the Anticancer Activity of Medicinal Plants Predominantly Accumulating Ellagic Acid Compounds. Antioxidants 2025, 14, 1339. [Google Scholar] [CrossRef] [Scilit]
  82. Milutinović, M.; Nakarada, Đ.; Božunović, J.; Todorović, M.; Gašić, U.; Živković, S.; Skorić, M.; Ivković, Đ.; Savić, J.; Devrnja, N.; et al. Solanum dulcamara L. Berries: A Convenient Model System to Study Redox Processes in Relation to Fruit Ripening. Antioxidants 2023, 12, 346. [Google Scholar] [CrossRef] [Scilit]
  83. Zengin, G.; Cvetanović, A.; Gašić, U.; Dragićević, M.; Stupar, A.; Uysal, A.; Şenkardes, I.; Sinan, K.I.; Picot-Allain, M.C.N.; Ak, G.; et al. UHPLC-LTQ OrbiTrap MS analysis and biological properties of Origanum vulgare subsp. viridulum obtained by different extraction methods. Ind. Crops Prod. 2020, 154, 112747. [Google Scholar] [CrossRef] [Scilit]
  84. The CAS SciFinder Chemical Compound Database. Available online: https://scifinder-n.cas.org/ (accessed on 15 May 2026).
  85. Schymanski, E.L.; Jeon, J.; Gulde, R.; Fenner, K.; Ruff, M.; Singer, H.P.; Hollender, J. Identifying Small Molecules via High Resolution Mass Spectrometry: Communicating Confidence. Environ. Sci. Technol. 2014, 48, 2097–2098. [Google Scholar] [CrossRef] [Scilit] [PubMed]
  86. Kowalska, T.; Sajewicz, M. Thin-Layer Chromatography (TLC) in the Screening of Botanicals—Its Versatile Potential and Selected Applications. Molecules 2022, 27, 6607. [Google Scholar] [CrossRef] [Scilit]
  87. Ivković, Đ.; Andrić, F.; Senćanski, M.; Stević, T.; Ristivojević, M.K.; Ristivojević, P. Innovative analytical methodology for skin anti-aging compounds discovery from plant extracts: Integration of High-Performance Thin-Layer Chromatography-in vitro spectrophotometry bioassays with multivariate modeling and molecular docking. J. Chromatogr. A 2025, 1742, 465640. [Google Scholar] [CrossRef] [Scilit] [PubMed]
  88. Agatonovic-Kustrin, S.; Morton, D.W. High-performance thin-layer chromatography-direct bioautography as a method of choice for alpha-amylase and antioxidant activity evaluation in marine algae. J. Chromatogr. A 2017, 1530, 197–203. [Google Scholar] [CrossRef] [Scilit]
  89. Nakarada, Đ.; Pejin, B.; Tommonaro, G.; Mojović, M. Liposomal integration method for assessing antioxidative activity of water insoluble compounds towards biologically relevant free radicals: Example of avarol. J. Liposome Res. 2020, 30, 218–226. [Google Scholar] [CrossRef] [Scilit]
  90. Marinković, A.; Nakarada, Đ.; Marinković, M.; Waisi, H.; Živanić, V.; Vazquez, A.; Mojović, M. From Analytical Profiling to Liposomal Delivery: Cannabinol as a Model for Antioxidant Encapsulation and Diffusion Enhancement. Molecules 2025, 30, 3433. [Google Scholar] [CrossRef] [Scilit]
  91. Supino, R. MTT Assays. In In Vitro Toxicity Testing Protocols; O’Hare, S., Atterwill, C.K., Eds.; Methods in Molecular Biology; Humana Press: Totowa, NJ, USA, 1995; Volume 43, pp. 137–149. [Google Scholar] [CrossRef] [Scilit]
Figure 1. Comparative distribution of the identified compounds in methanol (ME) and dichloromethane (DCM) extracts of A. ceterach analyzed by UHPLC-LTQ OrbiTrap MS. (A) Venn diagram illustrating the number of unique and shared compounds between ME and DCM extracts (B) Total number of compounds identified in each major group of phenolics in the ME and DCM extracts. Red indicates dichloromethane (DCM) extract; blue indicates methanol (ME) extract.
Molecules 31 02978 g001
Figure 2. HPTLC profiles of ME (methanol) and DCM (dichloromethane) extracts of A. ceterach visualized under: (A) UV 366 nm; (B) visible light after p-anisaldehyde derivatization; (C) visible light after α-amylase derivatization; (D) visible light after DPPH derivatization. Abbreviations: CGA—chlorogenic acid.
Molecules 31 02978 g002
Figure 3. Radical scavenging activity of A. ceterach extracts against (A) DPPH and (B) hydroxyl radicals (•OH). Activity is expressed as the reduction in peak intensity (%) obtained 2 min after the addition of DPPH and/or •OH generation in the Fenton reaction system containing the spin trap DEPMPO. Representative EPR spectra of DPPH (C) and DEPMPO/OH spin adduct (D). Abbreviations: DCM—diclormethane extract of A. ceterach; ME—methanol extract of A. ceterach.
Molecules 31 02978 g003
Figure 4. Cytotoxic activity of A. ceterach extracts. Percentage of A375, LS-174, and MRC-5 cell growth inhibition (cell viability) was determined by MTT assay after 72 h of continuous treatment with ME (blue line) and DCM (red line) extracts. The values represent results of two independent measurements ± SE. Abbreviations: DCM—dichloromethane extract of A. ceterach; ME—methanol extract of A. ceterach.
Molecules 31 02978 g004
Table 2. Antibacterial and antifungal activity of Asplenium ceterach extracts. Minimum inhibitory concentration (MIC), bactericidal concentration (MBC), and fungicidal concentration (MFC) for fern extracts and standard compounds are given in mg mL−1. DCM—diclormethane extract of A. ceterach; ME—methanol extract of A. ceterach.
SpeciesDCMMEStandard
MIC/MBC (mg mL−1)
Gram (+) bacteria Streptomycin
Bacillus cereus0.50/1.000.25/0.750.006/0.012
Staphylococcus aureus ATCC 116321.50/2.000.50/1.000.05/0.10
Listeria monocytogenes NCTC 79731.50/2.001.00/2.000.05/0.10
Gram (−) bacteria
Escherichia coli ATCC 259220.75/1.000.75/1.000.05/0.10
Pseudomonas aeruginosa ATCC 278531.50/2.001.50/2.000.05/0.10
Salmonella Typhimurium ATCC 133110.50/1.001.00/2.000.05/0.10
MIC/MFC (mg mL−1)
Fungi Ketoconazole
Aspergillus fumigatus ATCC 2043050.375/0.500.50/1.000.25/0.50
Aspergillus niger ATCC 62751.00/2.001.00/2.000.20/0.50
Penicillium funiculosum ATCC 368390.50/1.001.00/2.000.20/0.50
Penicillium verrucosum var. cyclopium1.00/2.001.50/2.000.20/0.50
Candida albicans ATCC 102310.50/1.001.00/2.000.15/0.20
Candida krusei0.25/1.001.00/2.000.05/0.10
Table 3. Antibiofilm activity of Asplenium ceterach extracts. Values represent the percentage inhibition of Candida albicans biofilm formation induced by fern extracts, given as mean ± SD of three replicates. DCM—dichloromethane extract of A. ceterach; ME—methanol extract of A. ceterach.
MIC0.5 MIC0.25 MIC
DCM74 ± 372 ± 748 ± 1
ME73 ± 273 ± 220 ± 5
Ketoconazole81 ± 1473 ± 1171 ± 12
Disclaimer/Publisher’s Note: The statements, opinions and data contained in all publications are solely those of the individual author(s) and contributor(s) and not of MDPI and/or the editor(s). MDPI and/or the editor(s) disclaim responsibility for any injury to people or property resulting from any ideas, methods, instructions or products referred to in the content.