
1H-NMR Guided Isolation of Bioactive Compounds from Species of the Genus Piper

 , ,
, ,
Abstract

1. Introduction
2. Results
2.1. Target Identification for Isolation, Characterization and Biological Verification
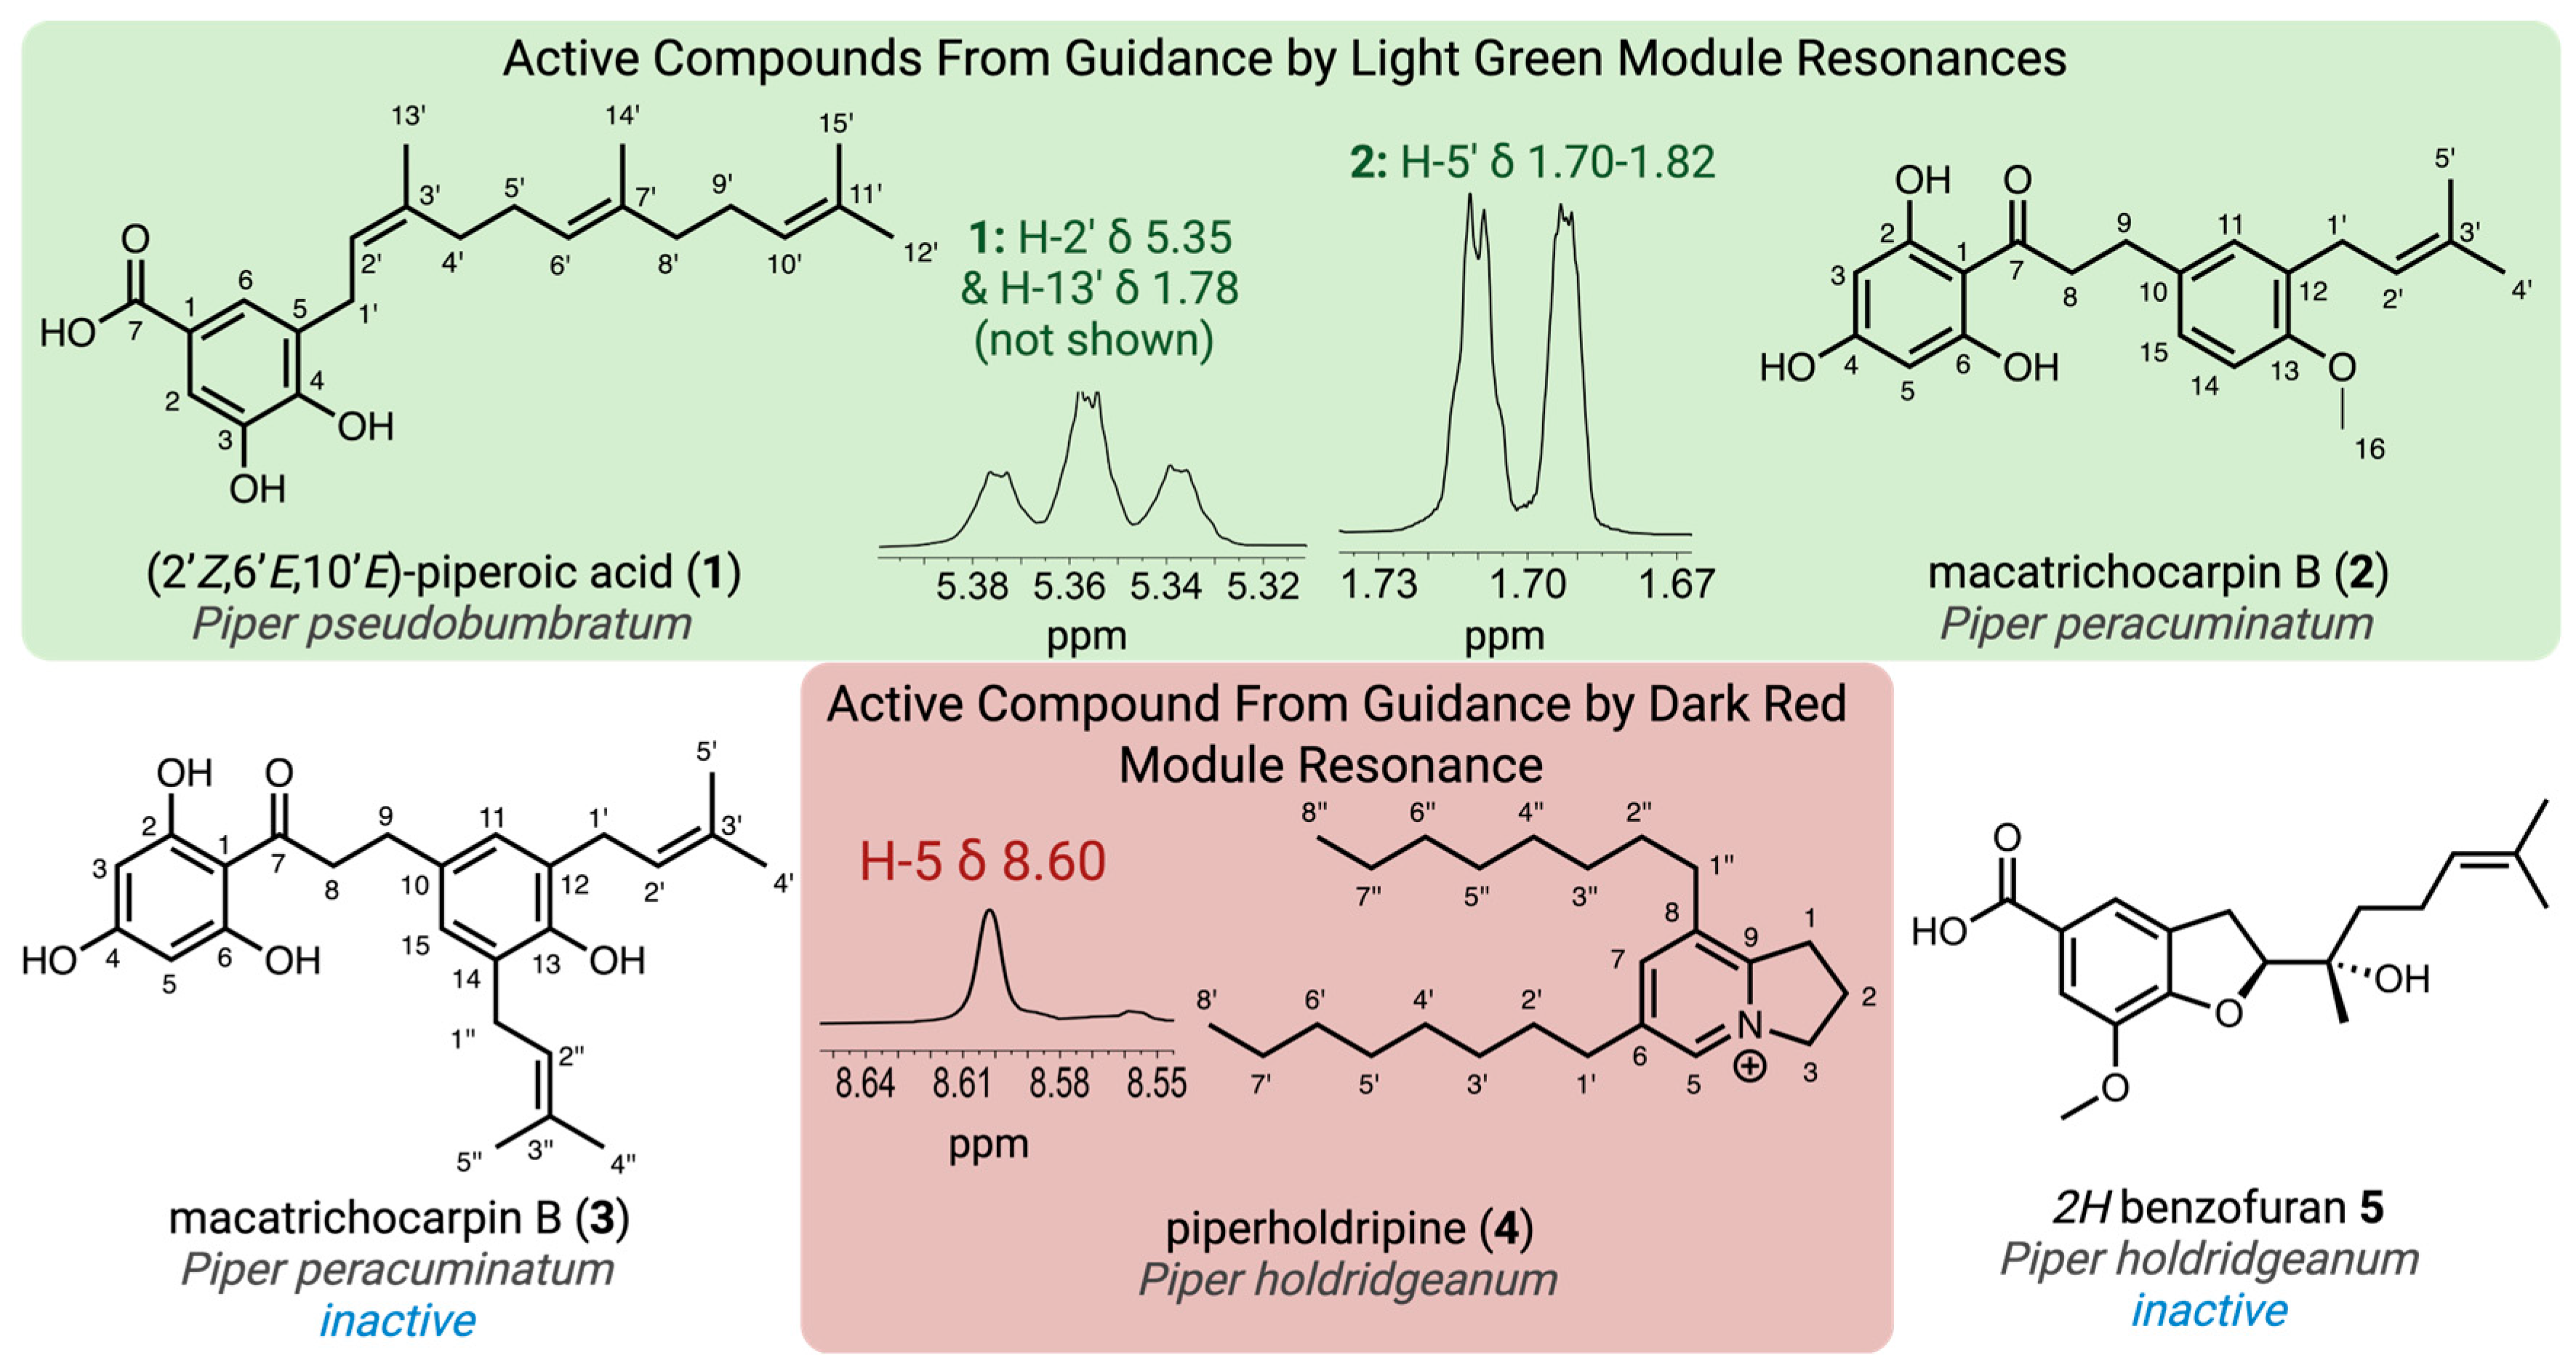
2.2. Compound Isolation Guided by Targeted 1H NMR Resonances
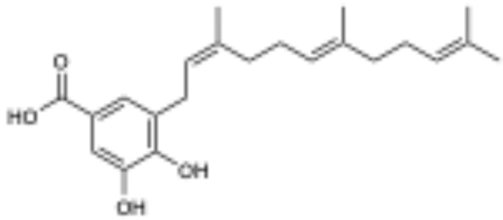
2.3. Structure Determination of Target Compounds
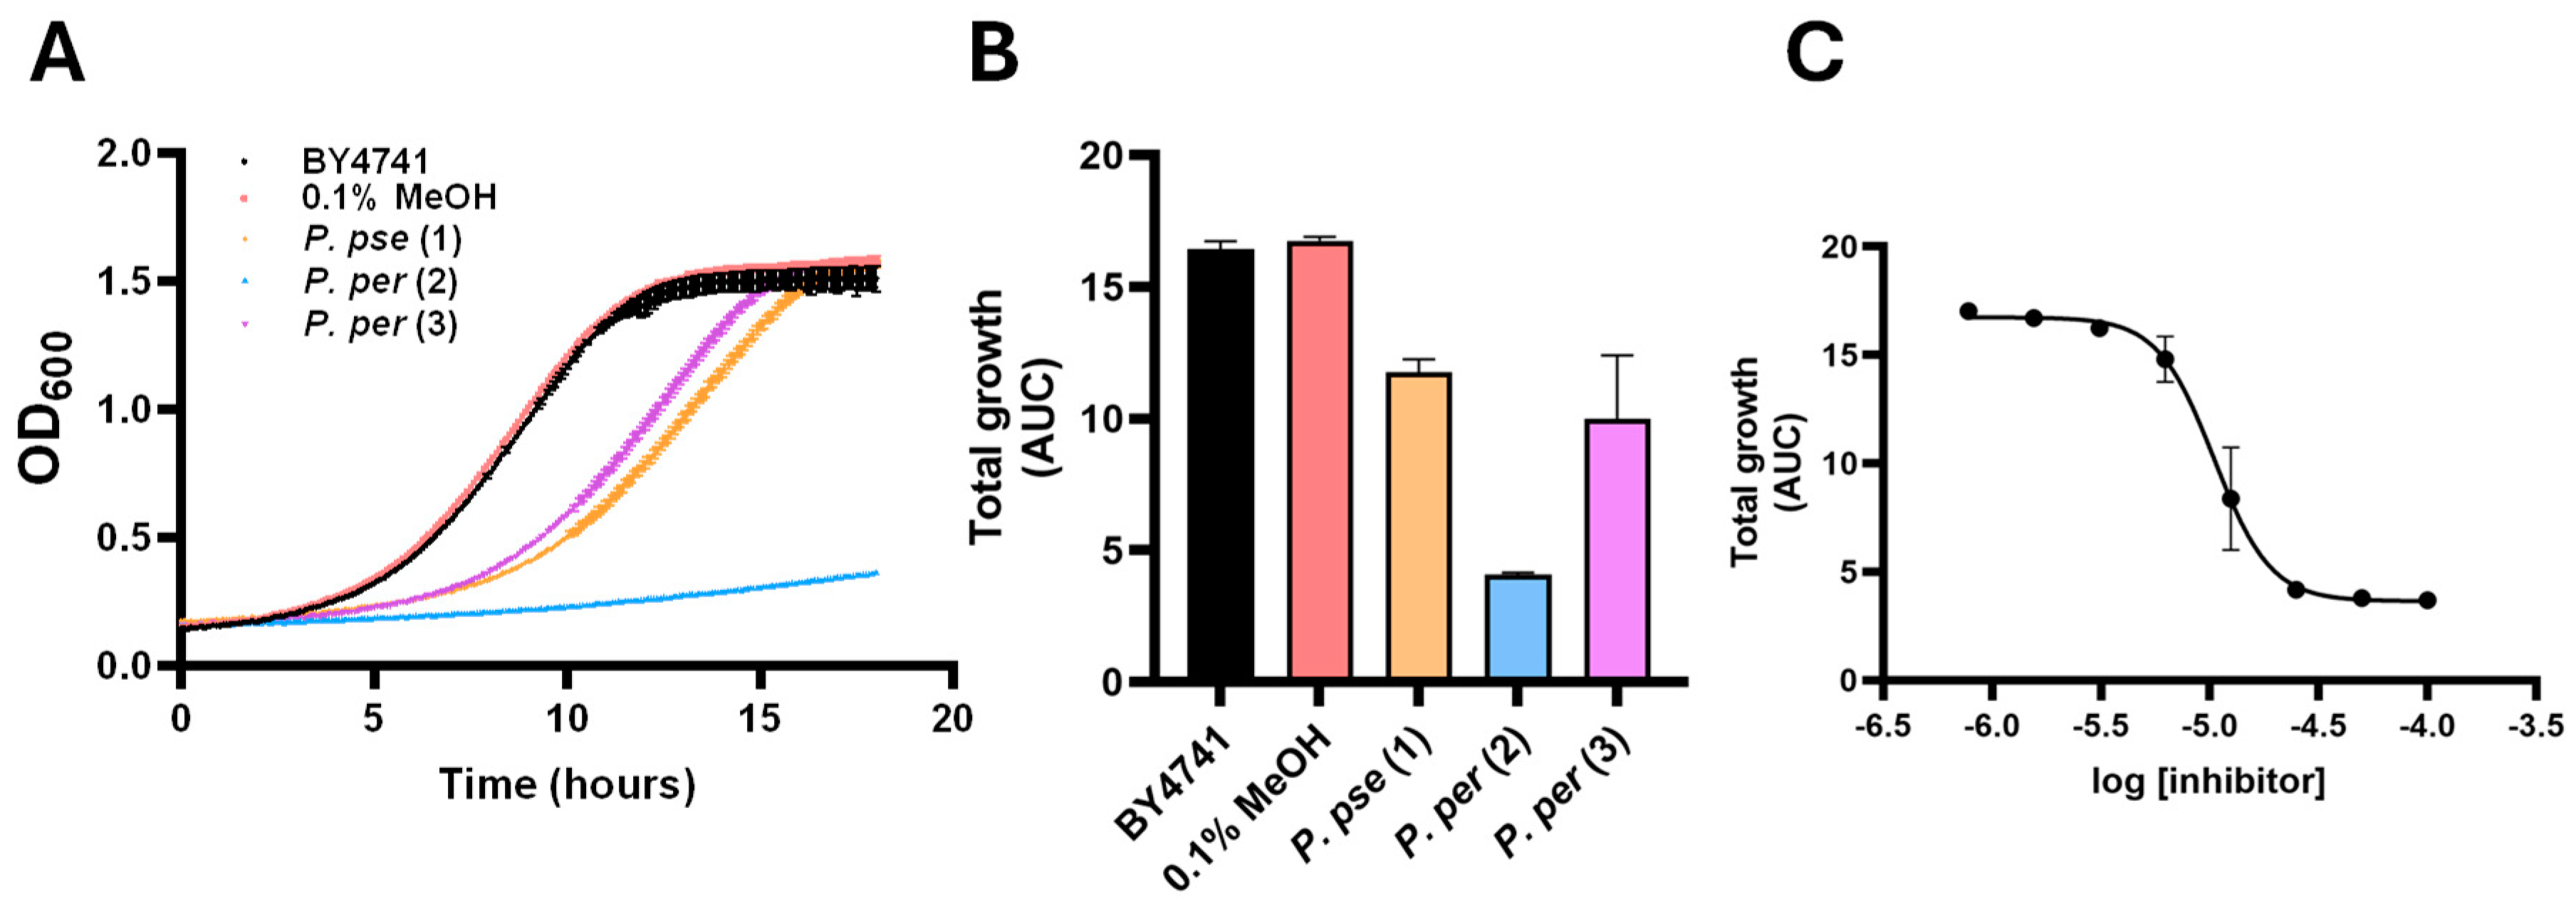
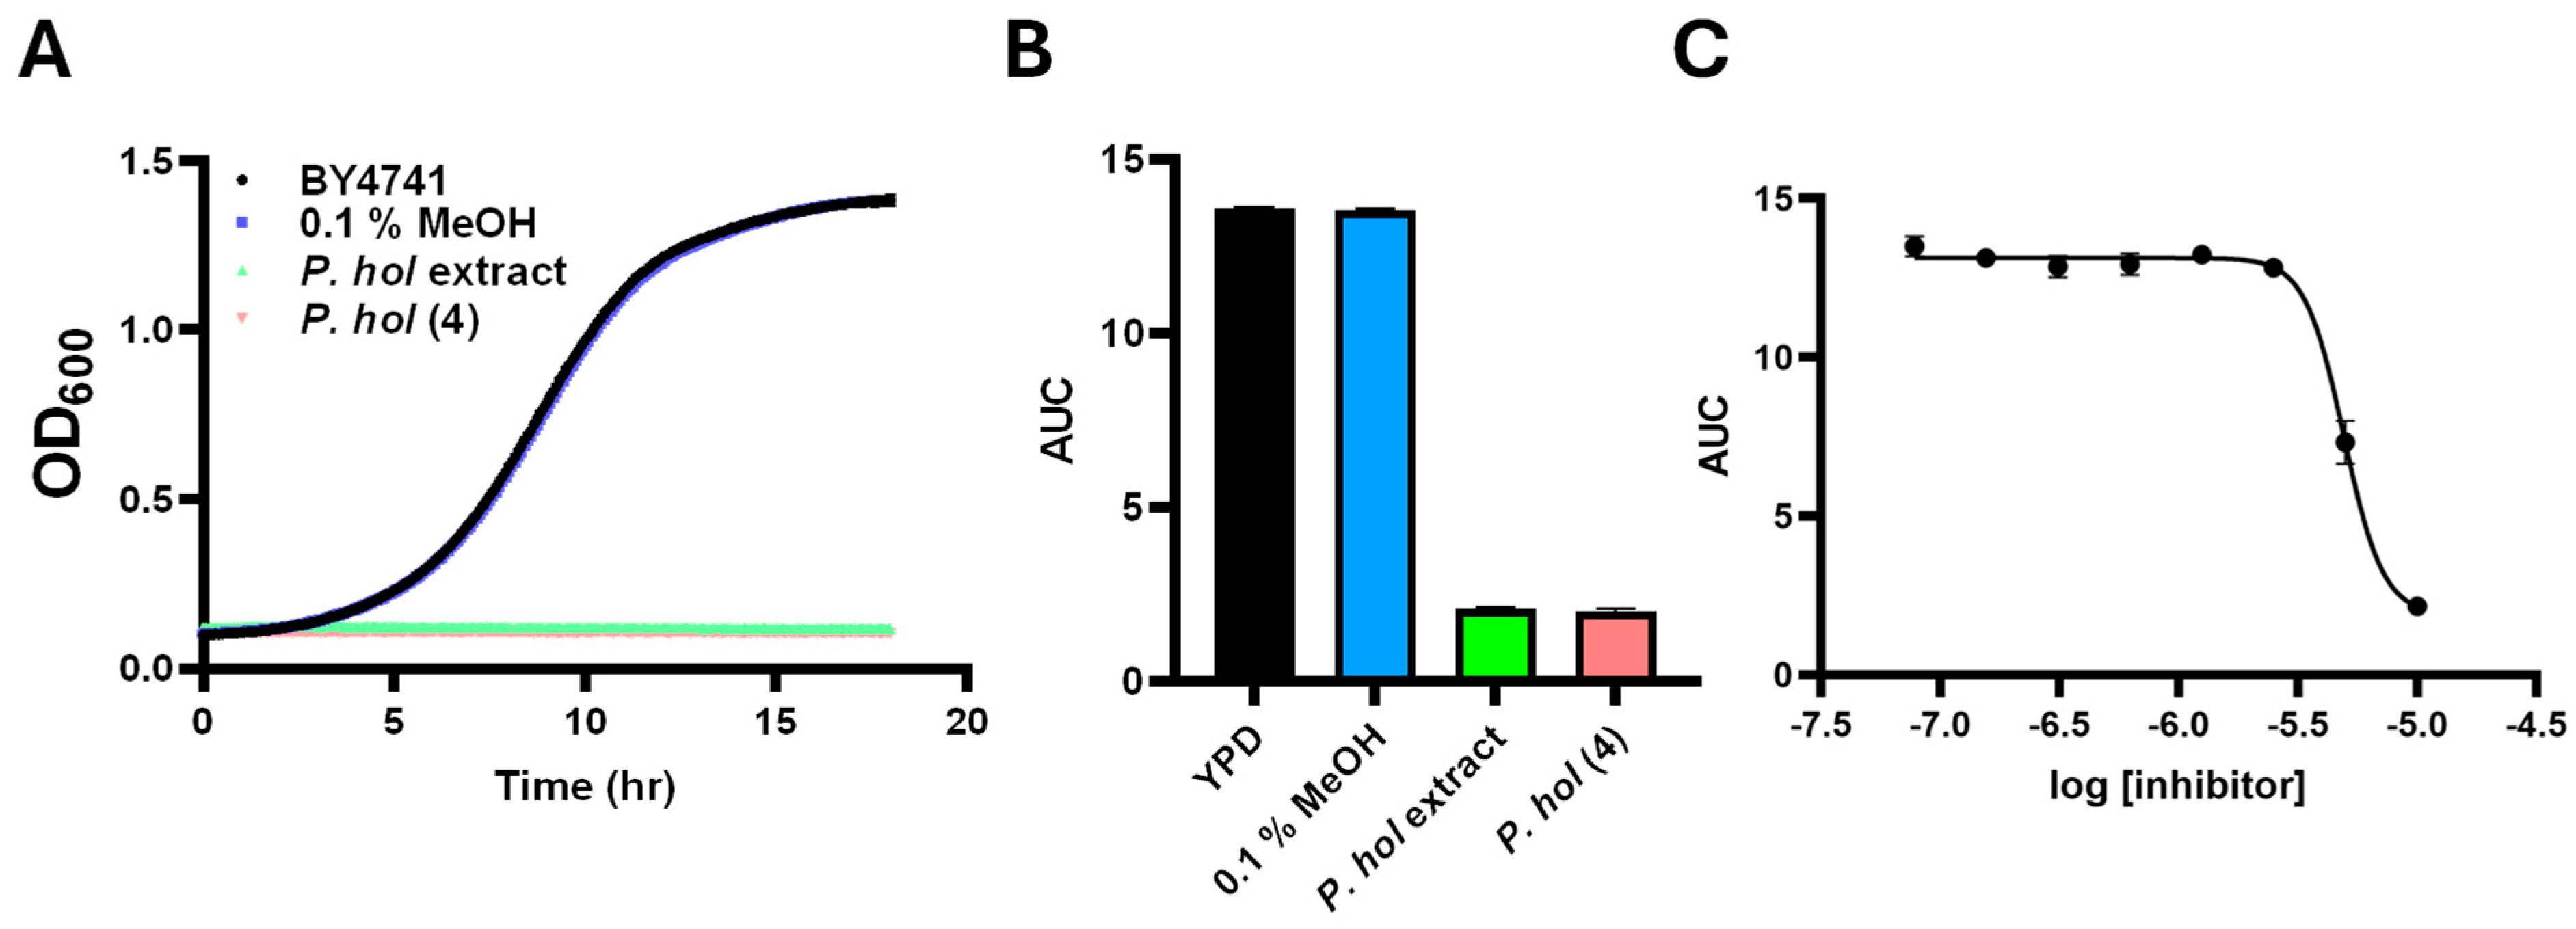
2.4. Bioactivity of the Isolated Compounds
3. Discussion
4. Materials and Methods
4.1. Compound Isolation
4.2. Spectroscopic Analysis
4.3. Network Analysis
4.4. Synthesis of Piperholdripine
4.5. Bioassays
5. Conclusions
Supplementary Materials
Author Contributions
Funding
Institutional Review Board Statement
Informed Consent Statement
Data Availability Statement
Acknowledgments
Conflicts of Interest
References
- Atanasov, A.G.; Zotchev, S.B.; Dirsch, V.M.; Orhan, I.E.; Banach, M.; Rollinger, J.M.; Barreca, D.; Weckwerth, W.; Bauer, R.; Bayer, E.A.; et al. Natural Products in Drug Discovery: Advances and Opportunities. Nat. Rev. Drug Discov. 2021, 20, 200–216. [Google Scholar] [CrossRef] [PubMed]
- Gaudêncio, S.P.; Pereira, F. Dereplication: Racing to Speed up the Natural Products Discovery Process. Nat. Prod. Rep. 2015, 32, 779–810. [Google Scholar] [CrossRef]
- Hight, S.K.; Clark, T.N.; Kurita, K.L.; McMillan, E.A.; Bray, W.; Shaikh, A.F.; Khadilkar, A.; Haeckl, F.P.J.; Carnevale-Neto, F.; La, S.; et al. High-Throughput Functional Annotation of Natural Products by Integrated Activity Profiling. Proc. Natl. Acad. Sci. USA 2022, 119, e2208458119. [Google Scholar] [CrossRef] [PubMed]
- Najmi, A.; Javed, S.A.; Al Bratty, M.; Alhazmi, H.A. Modern Approaches in the Discovery and Development of Plant-Based Natural Products and Their Analogues as Potential Therapeutic Agents. Molecules 2022, 27, 349. [Google Scholar] [CrossRef] [PubMed]
- Jahangir, M.; Nuringtyas, T.R.; Ali, K.; Wilson, E.G.; Choi, Y.H.; Verpoorte, R. NMR-Based Metabolomics: Understanding Plant Chemistry and Identification of Biologically Active Compounds. In NMR-Based Metabolomics; Keun, H.C., Ed.; The Royal Society of Chemistry: London, UK, 2018; ISBN 978-1-84973-643-5. [Google Scholar]
- Edison, A.S.; Colonna, M.; Gouveia, G.J.; Holderman, N.R.; Judge, M.T.; Shen, X.; Zhang, S. NMR: Unique Strengths That Enhance Modern Metabolomics Research. Anal. Chem. 2021, 93, 478–499. [Google Scholar] [CrossRef]
- Richards, L.A.; Oliveira, C.; Dyer, L.A.; Rumbaugh, A.; Urbano-Muñoz, F.; Wallace, I.S.; Dodson, C.D.; Jeffrey, C.S. Shedding Light on Chemically Mediated Tri-Trophic Interactions: A 1H-NMR Network Approach to Identify Compound Structural Features and Associated Biological Activity. Front. Plant Sci. 2018, 9, 1155. [Google Scholar] [CrossRef]
- Carsono, N.; Tumilaar, S.G.; Kurnia, D.; Latipudin, D.; Satari, M.H. A Review of Bioactive Compounds and Antioxidant Activity Properties of Piper Species. Molecules 2022, 27, 6774. [Google Scholar] [CrossRef]
- Kumar, B.; Tiwari, S.; Bajpai, V.; Singh, B. Phytochemistry of Plants of Genus Piper; CRC Press: Boca Raton, FL, USA, 2020; ISBN 978-1-003-01487-4. [Google Scholar]
- Martha Perez Gutierrez, R.; Maria Neira Gonzalez, A.; Hoyo-Vadillo, C. Alkaloids from Piper: A Review of Its Phytochemistry and Pharmacology. Mini-Rev. Med. Chem. 2013, 13, 163–193. [Google Scholar] [CrossRef]
- Xu, W.-H.; Li, X.-C. Antifungal Compounds from Piper Species. Curr. Bioact. Compd. 2011, 7, 262–267. [Google Scholar] [CrossRef]
- Parmar, V.S.; Jain, S.C.; Bisht, K.S.; Jain, R.; Taneja, P.; Jha, A.; Tyagi, O.D.; Prasad, A.K.; Wengel, J.; Olsen, C.E.; et al. Phytochemistry of the Genus Piper. Phytochemistry 1997, 46, 597–673. [Google Scholar] [CrossRef]
- Philbin, C.S.; Dyer, L.A.; Jeffrey, C.S.; Glassmire, A.E.; Richards, L.A. Structural and Compositional Dimensions of Phytochemical Diversity in the Genus Piper Reflect Distinct Ecological Modes of Action. J. Ecol. 2022, 110, 57–67. [Google Scholar] [CrossRef]
- de Oliveira, C.R., Jr.; Ledvina, Z.D.; Leonard, M.D.; Odoh, S.O.; Dodson, C.D.; Jeffrey, C.S. Isolation of New Neolignans and an Unusual Meroterpenoid from Piper Cabagranum. Front. Nat. Prod. 2024, 2, 1332436. [Google Scholar] [CrossRef]
- Uckele, K.A.; Jahner, J.P.; Tepe, E.J.; Richards, L.A.; Dyer, L.A.; Ochsenrider, K.M.; Philbin, C.S.; Kato, M.J.; Yamaguchi, L.F.; Forister, M.L.; et al. Phytochemistry Reflects Different Evolutionary History in Traditional Classes versus Specialized Structural Motifs. Sci. Rep. 2021, 11, 17247. [Google Scholar] [CrossRef] [PubMed]
- Richards, L.A.; Dyer, L.A.; Forister, M.L.; Smilanich, A.M.; Dodson, C.D.; Leonard, M.D.; Jeffrey, C.S. Phytochemical Diversity Drives Plant-Insect Community Diversity. Proc. Natl. Acad. Sci. USA 2015, 112, 10973–10978. [Google Scholar] [CrossRef] [PubMed]
- Gaia, A.M.; Yamaguchi, L.F.; Jeffrey, C.S.; Kato, M.J. Age-Dependent Changes from Allylphenol to Prenylated Benzoic Acid Production in Piper Gaudichaudianum Kunth. Phytochemistry 2014, 106, 86–93. [Google Scholar] [CrossRef] [PubMed]
- Jeffrey, C.S.; Leonard, M.D.; Glassmire, A.E.; Dodson, C.D.; Richards, L.A.; Kato, M.J.; Dyer, L.A. Antiherbivore Prenylated Benzoic Acid Derivatives from Piper Kelleyi. J. Nat. Prod. 2014, 77, 148–153. [Google Scholar] [CrossRef]
- de Oliveira, C.R. A 1H NMR Network Approach for the Study of Specialized Metabolites: Development and Applications. Ph.D. Thesis, University of Nevada, Reno, Reno, NV, USA, 2021. [Google Scholar]
- Ampofo, S.A.; Roussis, V.; Wiemer, D.F. New Prenylated Phenolics from Piper Auritum. Phytochemistry 1987, 26, 2367–2370. [Google Scholar] [CrossRef]
- Syah, Y.M.; Hakim, E.H.; Achmad, S.A.; Hanafi, M.; Ghisalberti, E.L. Isoprenylated Flavanones and Dihydrochalcones from Macaranga Trichocarpa. Nat. Prod. Commun. 2009, 4, 1934578X0900400115. [Google Scholar] [CrossRef]
- Monteillier, A.; Cretton, S.; Ciclet, O.; Marcourt, L.; Ebrahimi, S.N.; Christen, P.; Cuendet, M. Cancer Chemopreventive Activity of Compounds Isolated from Waltheria Indica. J. Ethnopharmacol. 2017, 203, 214–225. [Google Scholar] [CrossRef]
- Zhang, J.; Morris-Natschke, S.L.; Ma, D.; Shang, X.; Yang, C.; Liu, Y.; Lee, K. Biologically Active Indolizidine Alkaloids. Med. Res. Rev. 2021, 41, 928–960. [Google Scholar] [CrossRef]
- Michael, J.P. Indolizidine and Quinolizidine Alkaloids. Nat. Prod. Rep. 2007, 24, 191. [Google Scholar] [CrossRef]
- Klausmeyer, P.; Chmurny, G.N.; McCloud, T.G.; Tucker, K.D.; Shoemaker, R.H. A Novel Antimicrobial Indolizinium Alkaloid from Aniba panurensis. J. Nat. Prod. 2004, 67, 1732–1735. [Google Scholar] [CrossRef] [PubMed]
- Damu, A.G.; Kuo, P.-C.; Shi, L.-S.; Li, C.-Y.; Kuoh, C.-S.; Wu, P.-L.; Wu, T.-S. Phenanthroindolizidine Alkaloids from the Stems of Ficus Septica. J. Nat. Prod. 2005, 68, 1071–1075. [Google Scholar] [CrossRef] [PubMed]
- Snider, B.B.; Neubert, B.J. Syntheses of Ficuseptine, Juliprosine, and Juliprosopine by Biomimetic Intramolecular Chichibabin Pyridine Syntheses. Org. Lett. 2005, 7, 2715–2718. [Google Scholar] [CrossRef] [PubMed]
- Roberson, M.G.; Smith, D.K.; White, S.M.; Wallace, I.S.; Tucker, M.J. Interspecies Bombolitins Exhibit Structural Diversity upon Membrane Binding, Leading to Cell Specificity. Biophys. J. 2019, 116, 1064–1074. [Google Scholar] [CrossRef]
- Lago, J.H.G.; Ramos, C.S.; Casanova, D.C.C.; Morandim, A.D.A.; Bergamo, D.C.B.; Cavalheiro, A.J.; Bolzani, V.D.S.; Furlan, M.; Guimarães, E.F.; Young, M.C.M.; et al. Benzoic Acid Derivatives from Piper Species and Their Fungitoxic Activity against Cladosporium cladosporioides and C. sphaerospermum. J. Nat. Prod. 2004, 67, 1783–1788. [Google Scholar] [CrossRef]
- Danelutte, A.P.; Lago, J.H.G.; Young, M.C.M.; Kato, M.J. Antifungal Flavanones and Prenylated Hydroquinones from Piper Crassinervium Kunth. Phytochemistry 2003, 64, 555–559. [Google Scholar] [CrossRef]
- Lago, J.H.G.; Young, M.C.M.; Reigada, J.B.; Soares, M.G.; Roesler, B.P.; Kato, M.J. Antifungal Derivatives from Piper Mollicomum and P. Lhotzkyanum (Piperaceae). Quím. Nova 2007, 30, 1222–1224. [Google Scholar] [CrossRef]
- Orjala, J.; Wright, A.D.; Behrends, H.; Folkers, G.; Sticher, O.; Rüegger, H.; Rali, T. Cytotoxic and Antibacterial Dihydrochalcones from Piper Aduncum. J. Nat. Prod. 1994, 57, 18–26. [Google Scholar] [CrossRef]
- Dal Picolo, C.R.; Bezerra, M.P.; Gomes, K.S.; Passero, L.F.D.; Laurenti, M.D.; Martins, E.G.A.; Sartorelli, P.; Lago, J.H.G. Antileishmanial Activity Evaluation of Adunchalcone, a New Prenylated Dihydrochalcone from Piper aduncum L. Fitoterapia 2014, 97, 28–33. [Google Scholar] [CrossRef]
- Giaever, G.; Nislow, C. The Yeast Deletion Collection: A Decade of Functional Genomics. Genetics 2014, 197, 451–465. [Google Scholar] [CrossRef] [PubMed]


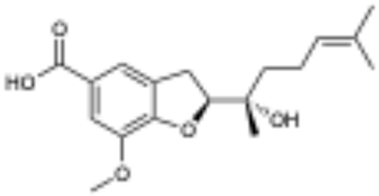
| Position | δC, Type a | δH, mult. (J in Hz) b | HMBC | NOESY |
|---|---|---|---|---|
| 1 | 122.2, C | |||
| 2 | 115.1, CH | 7.32, d (2.0) | 3, 4, 6, 7 | |
| 3 | 145.4, C | |||
| 4 | 149.4, C | |||
| 5 | 137.3, C | |||
| 6 | 124.1, CH | 7.35, dt (2.0, 0.5) | 2, 4, 7 | 1’, 2’ |
| 7 | 170.7, C | |||
| 1’ | 28.8, CH2 | 3.33, br d (7.1) | 4, 5, 2’, 3’ | 6, 4’ |
| 2’ | 124.0, CH | 5.36, br t (7.4) | 1’, 3’, 4’, 13’ | 6, 13’ |
| 3’ | 129.2, C | |||
| 4’ | 32.9, CH2 | 2.21–2.15, m | 5, 2’, 5’, 6’, 13’ | 1’, 6’, 13’ |
| 5’ | 27.8, CH2 | 2.16–2.09, m | 4’, 6’, 7’ | 14’ |
| 6’ | 125.3, CH | 5.16, br t (7.4) | 5’, 8’, 14’ | 4’, 8’ |
| 7’ | 136.2, C | |||
| 8’ | 40.8, CH2 | 1.98–1.92, m | 5’, 6’, 7’, 9’, 10’, 14’ | 6’, 14’ |
| 9’ | 27.8, CH2 | 2.08–2.01, m | 6’, 8’, 10’, 11’ | 14’ |
| 10’ | 125.5, CH | 5.07, m | 12’, 15’ (weak) | 8’, 12’ |
| 11’ | 132.0, C | |||
| 12’ | 25.9, CH3 | 1.65, br s | 10’, 11’, 12’ | 10’ |
| 13’ | 23.8, CH3 | 1.75, br q (1.2) | 5, 2’, 3’, 4’ | 2’, 4’ |
| 14’ | 16.1, CH3 | 1.60, br s | 6’, 7’, 8’ | 5’ |
| 15’ | 17.7, CH3 | 1.58, br s | 10’, 11’, 15’ |
| Position | δC, Type a | δH, mult. (J in Hz) b | HMBC |
|---|---|---|---|
| 1 | 105.3, C | ||
| 2/6 | 165.2, C | ||
| 3/5 | 95.9, CH | 5.86, s | 1, 2/6, 4, 7 |
| 4 | 164.9, C | ||
| 7 | 205.9, C | ||
| 8 | 46.7, CH2 | 3.27–3.24, m | 7, 9, 10 |
| 9 | 30.5, CH2 | 2.85, dd (8.2, 6.7) | 7, 8, 10, 11, 15 |
| 10 | 134.7, C | ||
| 11 | 130.5, CH | 6.99, d (2.0) | 9, 13, 15, 1’ |
| 12 | 130.6, C | ||
| 13 | 156.6, C | ||
| 14 | 111.6, CH | 6.79, d (8.3) | 10, 11, 12, 13, 15 |
| 15 | 127.7, CH | 7.00, dd (8.2, 2.3) | 11, 13, 14 |
| 16 | 56.1, CH3 | 3.78, s | |
| 1’ | 29.3, CH2 | 3.25, br d (7.4) | 11, 12, 13, 2’, 3’ |
| 2’ | 123.7, CH | 5.25, m | 5’ (weak) |
| 3’ | 133.0, C | ||
| 4’ | 25.9, CH3 | 1.71, br s | 2’, 3’, 5’ |
| 5’ | 17.8, CH3 | 1.69, br s | 2’, 3’, 4’ |
| Position | δC, Type a | δH, mult. (J in Hz) b | HMBC |
|---|---|---|---|
| 1 | 105.3, C | ||
| 2/6 | 165.1, C | ||
| 3/5 | 95.8, CH | 5.86, s | 1, 2/6, 4, 7 |
| 4 | 164.7, C | ||
| 7 | 206.0, C | ||
| 8 | 46.8, CH2 | 3.21–3.27, m | 7, 9, 10 |
| 9 | 30.6, CH2 | 2.79, t (7.6) | 7, 8, 10, 11/15 |
| 10 | 134.4, C | ||
| 11/15 | 128.2, CH | 6.79, s | 9, 13, 1’/1’’ |
| 12/14 | 128.8, C | ||
| 13 | 151.1, C | ||
| 1’/1’’ | 29.7, CH2 | 3.25, br d (7.3) | 11/15, 13, 12/14, 2’/2’’, 3’/3’’, 5’/5’’ |
| 2’/2’’ | 123.4, CH | 5.26, m | 1’/1’’, 4’/4’’, 5’/5’’ |
| 3’/3’’ | 133.7, C | ||
| 4’/4’’ | 25.8, CH3 | 1.72, br s | 2’/2’’, 3’/3’’, 5’/5’’ |
| 5’/5’’ | 17.8, CH3 | 1.71, br s | 2’/2’’, 3’/3’’, 4’/4’’ |
| Position | δC, Type a | δH, mult. (J in Hz) b | HMBC |
|---|---|---|---|
| 1 | 31.6, CH2 | 3.47, br t (7.8) | 8, 9 |
| 2 | 22.1, CH2 | 2.50, br pent. (7.8) | 1,3,9 |
| 3 | 60.5, CH2 | 4.83, brt (7.8) | 1,2,5,9 |
| 4 | N | ||
| 5 | 138.8, CH | 8.60, br s | 6,7,9 |
| 6 | 142.9, C | ||
| 7 | 145.9, C | 8.17, br s | 5,9 |
| 8 | 140.7, C | ||
| 9 | 156.6, C | ||
| 1’/1’’ | 33.0, CH2 | 2.80, br t (7.3) | 2’/2’’, 5, 6, 7, 8, 9 |
| 2’/2’’ | 31.7, CH2 | 1.66–1.72, m | 8, 6, 1’/1’’, 3’/3’’-7’/7’’ |
| 3’/3’’-4’/4’’ | 30.2, 30.1, CH2 | 1.34–1.44, m | |
| 5’/5’’-7’,7’’ | 32.7, 33.2, 23.7, CH2 | 1.26–1.36, m | |
| 8’/8’’ | 14.4 CH3 | 0.90, m |
| Species and Isolated Compound(s) | % Inhibition | IC50 (μM) |
|---|---|---|
| P. pseudobumbratum | 63.2 | |
 (2’Z,6’E,10’E)-piperoic acid (1) active | 28.5 | Not Determined |
| P. peracuminatum | 98.7 | |
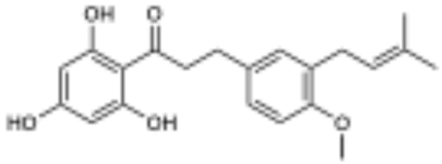 macatrichocarpin B (2) active | 75.3 | 10.5 µM |
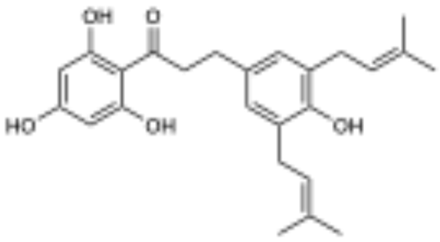 5-prenyl macatrichocarpin B (3) not active | 0.0 | >100 µM |
| P. holdrigeanum | 93.8 | |
 5 | 0.0 | >100 μM |
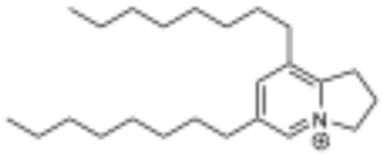 piperholdripine (4) | 85.3 | 4.9 µM |
Disclaimer/Publisher’s Note: The statements, opinions and data contained in all publications are solely those of the individual author(s) and contributor(s) and not of MDPI and/or the editor(s). MDPI and/or the editor(s) disclaim responsibility for any injury to people or property resulting from any ideas, methods, instructions or products referred to in the content. |
© 2025 by the authors. Licensee MDPI, Basel, Switzerland. This article is an open access article distributed under the terms and conditions of the Creative Commons Attribution (CC BY) license (https://creativecommons.org/licenses/by/4.0/).
Share and Cite
Oliveira, C.R.; Burroughs, M.J.; Richards, L.A.; Dyer, L.A.; Urbano-Muñoz, F.; Lee, C.; Warner, M.; Dodson, C.D.; Wallace, I.S.; Jeffrey, C.S. 1H-NMR Guided Isolation of Bioactive Compounds from Species of the Genus Piper. Molecules 2025, 30, 2020. https://doi.org/10.3390/molecules30092020
Oliveira CR, Burroughs MJ, Richards LA, Dyer LA, Urbano-Muñoz F, Lee C, Warner M, Dodson CD, Wallace IS, Jeffrey CS. 1H-NMR Guided Isolation of Bioactive Compounds from Species of the Genus Piper. Molecules. 2025; 30(9):2020. https://doi.org/10.3390/molecules30092020
Chicago/Turabian StyleOliveira, Celso R., Megan J. Burroughs, Lora A. Richards, Lee A. Dyer, Federico Urbano-Muñoz, Camryn Lee, Megan Warner, Craig D. Dodson, Ian S. Wallace, and Christopher S. Jeffrey. 2025. "1H-NMR Guided Isolation of Bioactive Compounds from Species of the Genus Piper" Molecules 30, no. 9: 2020. https://doi.org/10.3390/molecules30092020
APA StyleOliveira, C. R., Burroughs, M. J., Richards, L. A., Dyer, L. A., Urbano-Muñoz, F., Lee, C., Warner, M., Dodson, C. D., Wallace, I. S., & Jeffrey, C. S. (2025). 1H-NMR Guided Isolation of Bioactive Compounds from Species of the Genus Piper. Molecules, 30(9), 2020. https://doi.org/10.3390/molecules30092020