

Retrieval of Polyphenols Using Aqueous Two-Phase Systems Based on Ethyl Lactate and Organic Salts


Abstract
1. Introduction
2. Materials and Methods
2.1. Chemicals
2.2. Equipment
2.3. Experimental Procedure
2.3.1. Influence of pH on the UV-Vis Absorbance Spectra
2.3.2. Liquid–Liquid Equilibria Data
2.3.3. Biomolecule Extraction
3. Results and Discussion
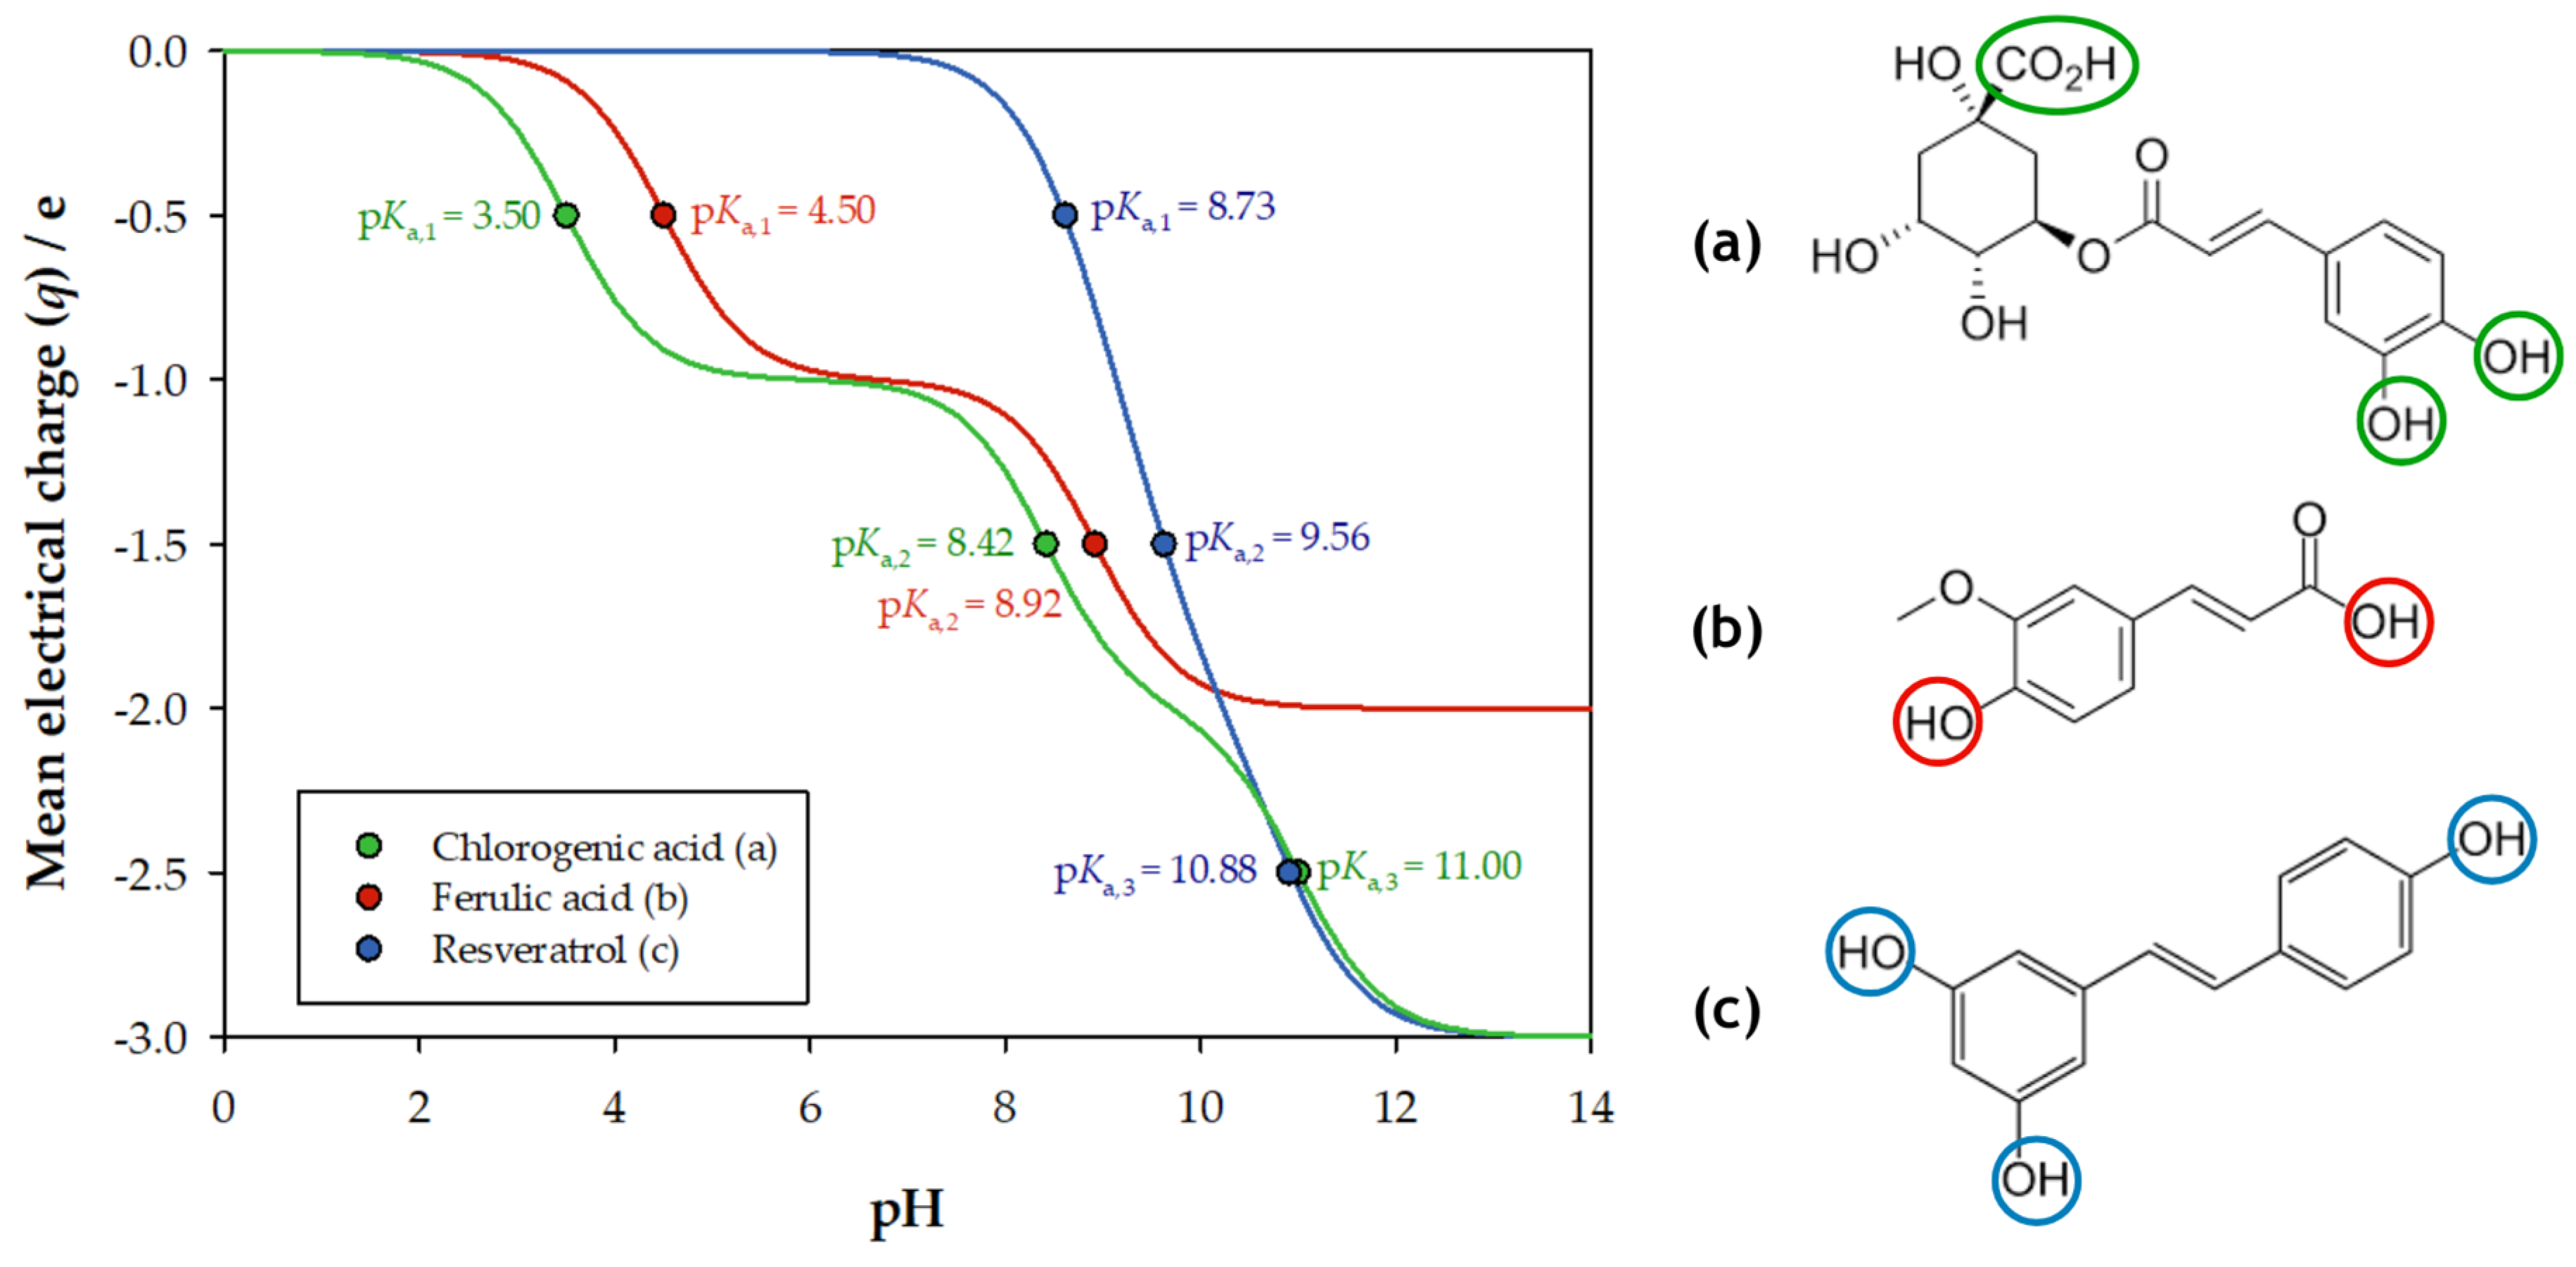
3.1. Influence of pH on the UV-Vis Absorbance Spectra
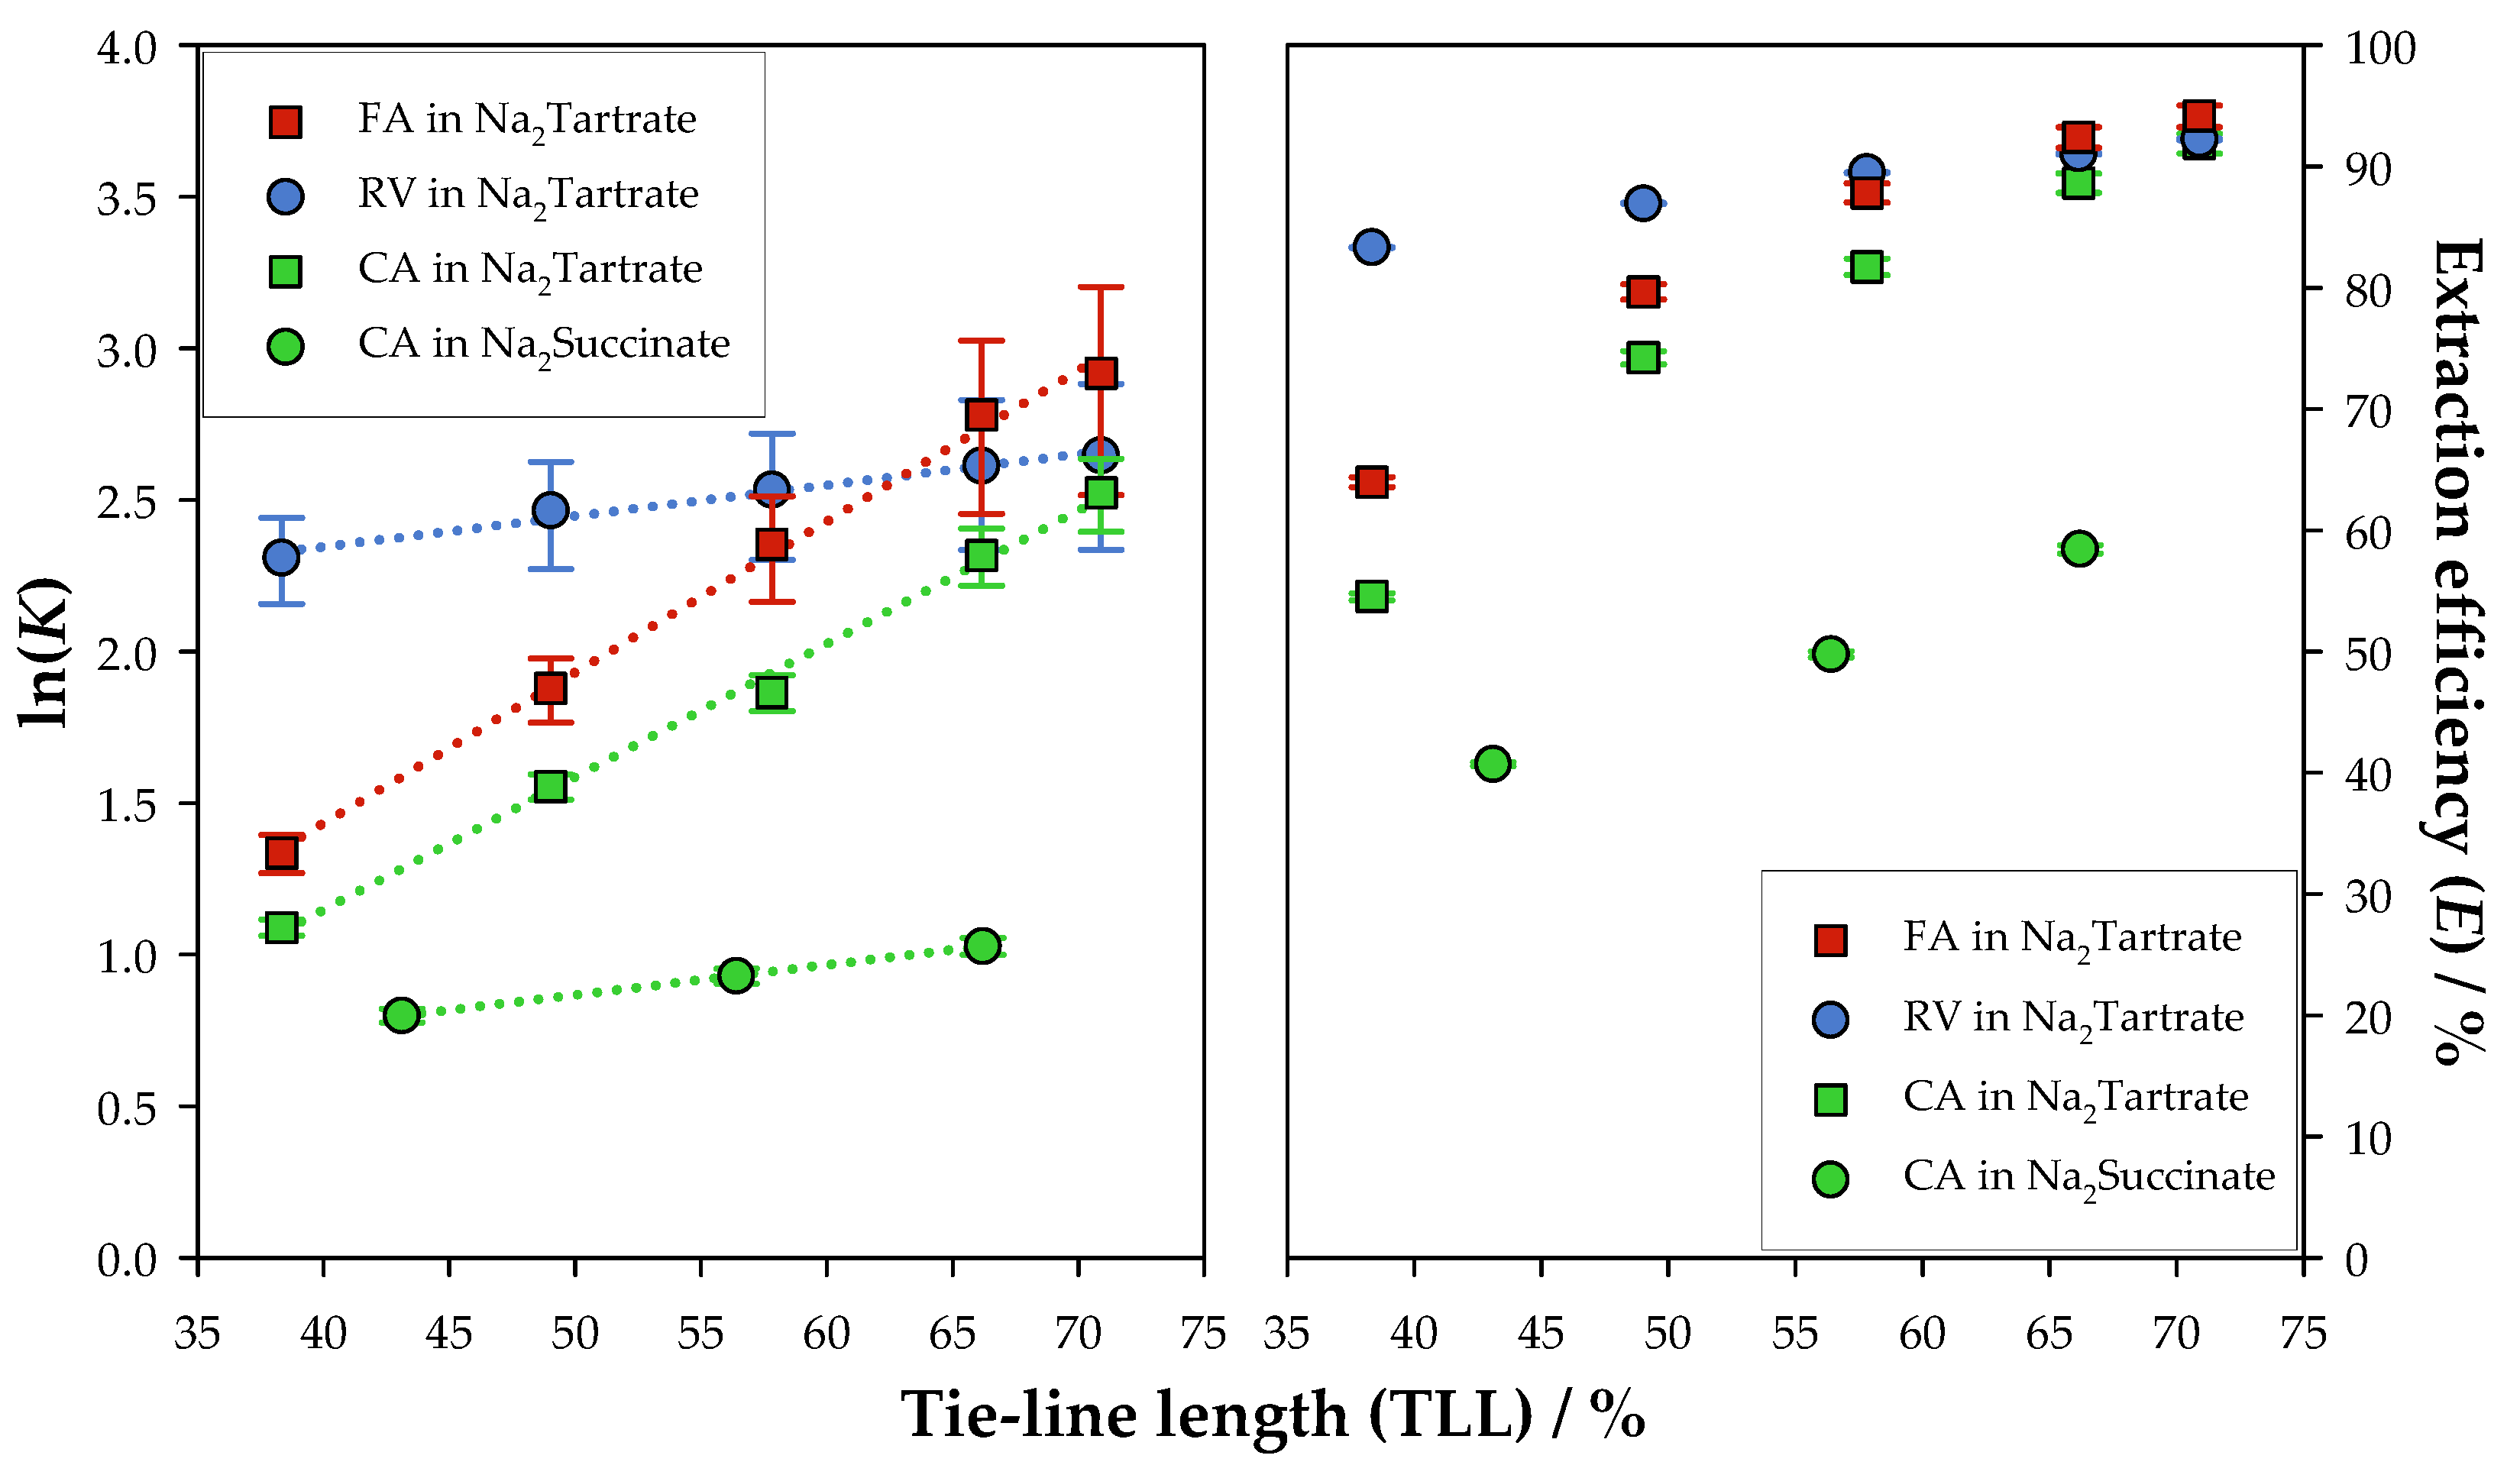
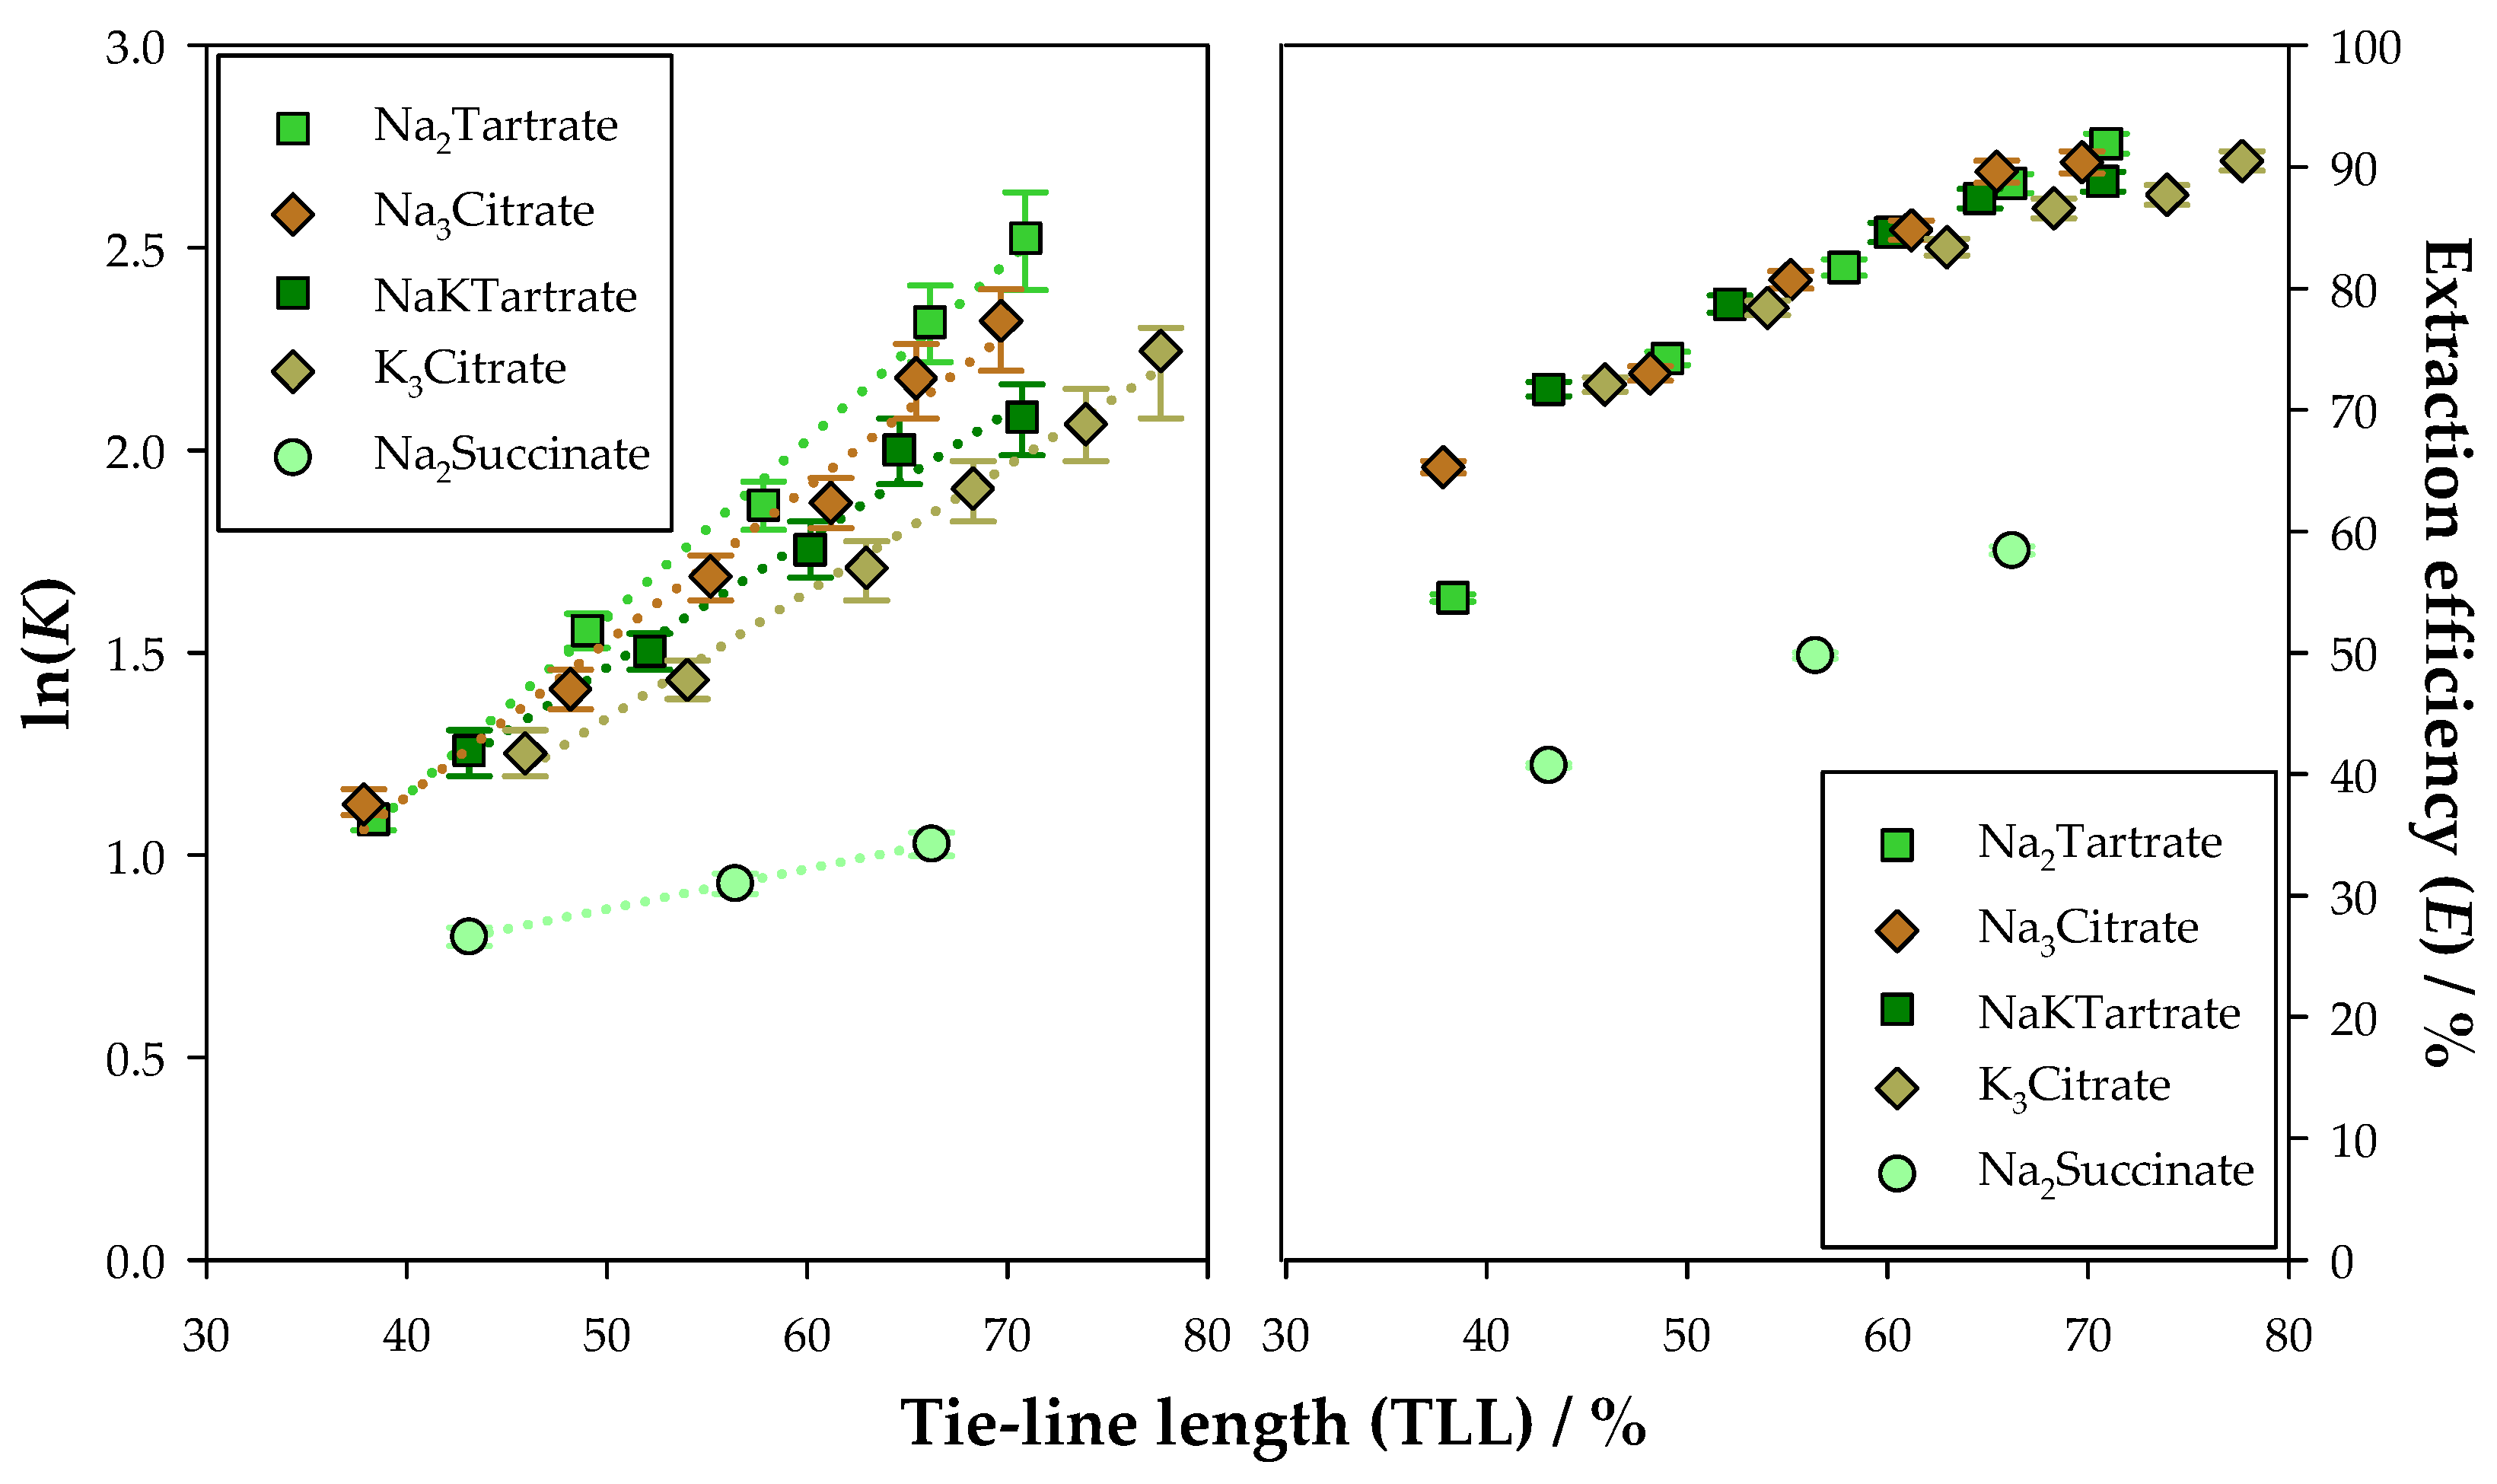
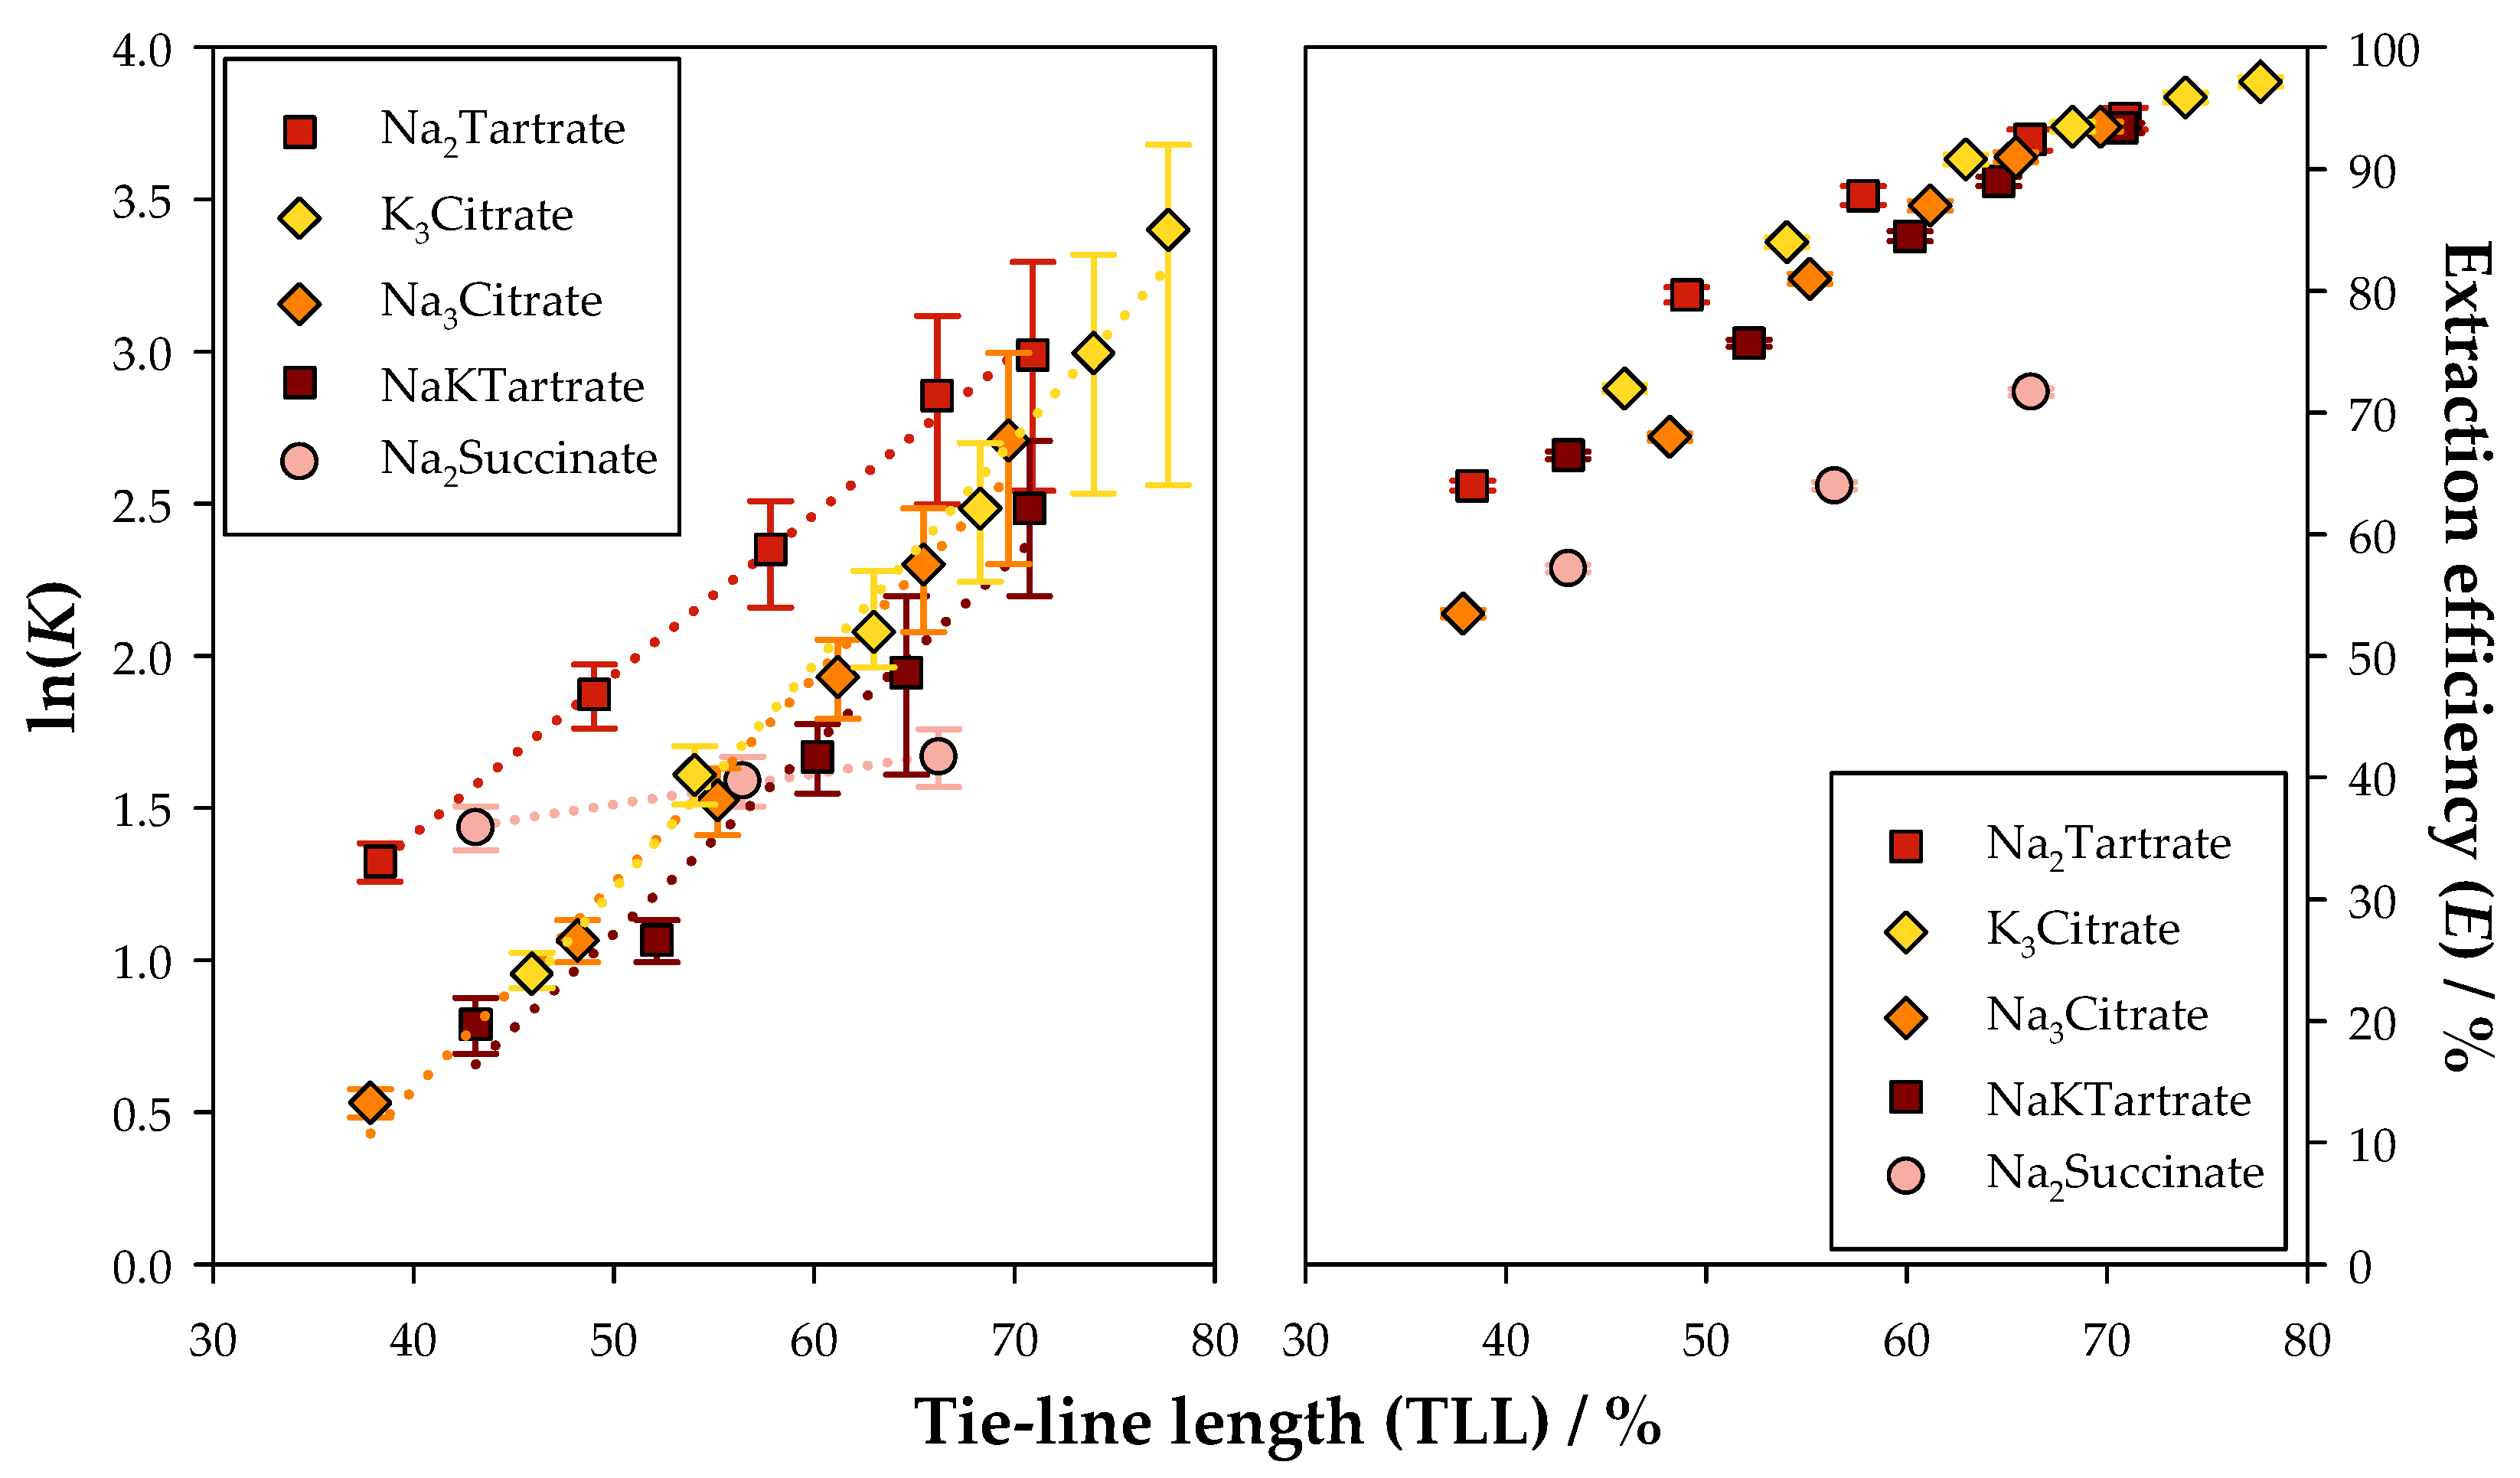
3.2. Biomolecule Extraction
4. Conclusions
Supplementary Materials
Author Contributions
Funding
Institutional Review Board Statement
Informed Consent Statement
Data Availability Statement
Conflicts of Interest
Abbreviations
| ATPSs | Aqueous two-phase systems |
| CA | Chlorogenic acid |
| EL | Ethyl lactate |
| FA | Ferulic acid |
| K3Citrate | Tripotassium citrate |
| LLE | Liquid–liquid equilibria |
| Na3Citrate | Trisodium citrate |
| Na2Succinate | Disodium succinate |
| Na2Tartrate | Disodium tartrate |
| NaKTartrate | Sodium potassium tartrate |
| RV | Resveratrol |
| TLL | Tie-line length |
References
- Ishangulyyev, R.; Kim, S.; Lee, S.H. Understanding food loss and waste—Why are we losing and wasting food? Foods 2019, 8, 297. [Google Scholar] [CrossRef] [PubMed]
- Rajendran, D.S.; Venkatraman, S.; Rahul, R.; Afrrin, M.; Karthik, P.; Vaidyanathan, V.K. Manifesting Sustainability Toward Food Waste into Bioenergy: Biorefinery in a Circular Economic Approach. In Circular Bioeconomy Perspectives in Sustainable Bioenergy Production; Springer: Singapore, 2024; pp. 431–460. [Google Scholar] [CrossRef]
- Memon, M.F.; Kutty, S.R.M.; Memon, Z.A. From Scraps to Soil Enrichment: Rethinking Food Waste and Sludge for a Greener Agriculture. In Proceedings of the ICSDI 2024 Volume 3, Proceedings of the 2nd International Conference on Sustainability: Developments and Innovations, Riyadh, Saudi Arabia, 18–22 February 2024; Springer: Singapore, 2024; Volume 3, pp. 207–214. [Google Scholar] [CrossRef]
- Mahro, B.; Timm, M. Potential of biowaste from the food industry as a biomass resource. Eng. Life Sci. 2007, 7, 457–468. [Google Scholar] [CrossRef]
- Narisetty, V.; Adlakha, N.; Singh, N.K.; Dalei, S.K.; Prabhu, A.A.; Nagarajan, S.; Kumar, A.N.; Nagoth, J.A.; Kumar, G.; Singh, V. Integrated biorefineries for repurposing of food wastes into value-added products. Bioresour. Technol. 2022, 363, 127856. [Google Scholar] [CrossRef]
- Nazzaro, F.; Fratianni, F.; Ombra, M.N.; d’Acierno, A.; Coppola, R. Recovery of biomolecules of high benefit from food waste. Curr. Opin. Food Sci. 2018, 22, 43–54. [Google Scholar] [CrossRef]
- Rao, P.; Rathod, V. Valorization of food and agricultural waste: A step towards greener future. Chem. Rec. 2019, 19, 1858–1871. [Google Scholar] [CrossRef]
- Kalhor, P.; Ghandi, K. Deep eutectic solvents for pretreatment, extraction, and catalysis of biomass and food waste. Molecules 2019, 24, 4012. [Google Scholar] [CrossRef]
- Lizárraga-Velázquez, C.E.; Leyva-López, N.; Hernández, C.; Gutiérrez-Grijalva, E.P.; Salazar-Leyva, J.A.; Osuna-Ruíz, I.; Martínez-Montaño, E.; Arrizon, J.; Guerrero, A.; Benitez-Hernández, A. Antioxidant molecules from plant waste: Extraction techniques and biological properties. Processes 2020, 8, 1566. [Google Scholar] [CrossRef]
- Echave, J.; Fraga-Corral, M.; Pereira, A.; Soria-Lopez, A.; Barral, M.; Chamorro, F.; Cao, H.; Xiao, J.; Simal-Gandara, J.; Prieto, M. Valorization of food waste biomass and biomaterials from a circular economy approach. In Sustainable Development and Pathways for Food Ecosystems; Academic Press: Cambridge, MA, USA, 2023; pp. 183–226. [Google Scholar] [CrossRef]
- Ancín-Azpilicueta, C.; Esparza, I.; Jiménez-Moreno, N. Biomolecules from Plant Residues. Biomolecules 2020, 10, 1496. [Google Scholar] [CrossRef]
- Pereira, J.F.; Lima, Á.S.; Freire, M.G.; Coutinho, J.A. Ionic liquids as adjuvants for the tailored extraction of biomolecules in aqueous biphasic systems. Green Chem. 2010, 12, 1661–1669. [Google Scholar] [CrossRef]
- Yang, H.; Zhang, L.; Chen, L.; Zhou, C.; Yu, X.; Yagoub, A.E.-G.A.; Ma, H. Effect of ionic liquid based imidazolium as an additive on the formation of polymer/salt aqueous biphasic systems. J. Mol. Liq. 2018, 256, 1–8. [Google Scholar] [CrossRef]
- Yau, Y.K.; Ooi, C.W.; Ng, E.-P.; Lan, J.C.-W.; Ling, T.C.; Show, P.L. Current applications of different type of aqueous two-phase systems. Bioresour. Bioprocess. 2015, 2, 49. [Google Scholar] [CrossRef]
- Madeira, P.P.; Reis, C.A.; Rodrigues, A.E.; Mikheeva, L.M.; Chait, A.; Zaslavsky, B.Y. Solvent properties governing protein partitioning in polymer/polymer aqueous two-phase systems. J. Chromatogr. A 2011, 1218, 1379–1384. [Google Scholar] [CrossRef] [PubMed]
- Shiran, H.S.; Baghbanbashi, M.; Ahsaie, F.G.; Pazuki, G. Study of curcumin partitioning in polymer-salt aqueous two phase systems. J. Mol. Liq. 2020, 303, 112629. [Google Scholar] [CrossRef]
- Li, C.-X.; Han, J.; Wang, Y.; Yan, Y.-S.; Xu, X.-H.; Pan, J.-M. Extraction and mechanism investigation of trace roxithromycin in real water samples by use of ionic liquid–salt aqueous two-phase system. Anal. Chim. Acta 2009, 653, 178–183. [Google Scholar] [CrossRef]
- Zakrzewska, M.E.; Nunes, A.V.; Barot, A.R.; Fernández-Castané, A.; Visak, Z.P.; Kiatkittipong, W.; Najdanovic-Visak, V. Extraction of antibiotics using aqueous two-phase systems based on ethyl lactate and thiosulphate salts. Fluid Phase Equilib. 2021, 539, 113022. [Google Scholar] [CrossRef]
- Requejo, P.F.; Velho, P.; Gómez, E.; Macedo, E.A. Study of liquid–liquid equilibrium of aqueous two-phase systems based on ethyl lactate and partitioning of rutin and quercetin. Ind. Eng. Chem. Res. 2020, 59, 21196–21204. [Google Scholar] [CrossRef]
- Kamalanathan, I.; Petrovski, Z.; Branco, L.C.; Najdanovic-Visak, V. Novel aqueous biphasic system based on ethyl lactate for sustainable separations: Phase splitting mechanism. J. Mol. Liq. 2018, 262, 37–45. [Google Scholar] [CrossRef]
- Kamalanathan, I.; Canal, L.; Hegarty, J.; Najdanovic-Visak, V. Partitioning of amino acids in the novel biphasic systems based on environmentally friendly ethyl lactate. Fluid Phase Equilib. 2018, 462, 6–13. [Google Scholar] [CrossRef]
- Velho, P.; Requejo, P.F.; Gomez, E.; Macedo, E.A. Thermodynamic study of ATPS involving ethyl lactate and different inorganic salts. Sep. Purif. Technol. 2021, 275, 119155. [Google Scholar] [CrossRef]
- Previndrarasan, K.; Chow, Y.H.; Choo, C.O.; Chua, B.L.; Ling, T.C.; Lan, J.C.-W. Ethyl Lactate as a Green Solvent for Aqueous Two-Phase Extraction of Bioactive Compounds from Orthosiphon stamineus. Chem. Eng. Trans. 2024, 112, 223–228. [Google Scholar] [CrossRef]
- Raja, S.; Murty, V.R. Development and Evaluation of Environmentally Benign Aqueous Two Phase Systems for the Recovery of Proteins from Tannery Waste Water. Int. Sch. Res. Not. 2012, 2012, 290471. [Google Scholar] [CrossRef]
- Porto, T.S.; Medeiros e Silva, G.M.; Porto, C.S.; Cavalcanti, M.T.H.; Neto, B.B.; Lima-Filho, J.L.; Converti, A.; Porto, A.L.F.; Pessoa, A. Liquid–liquid extraction of proteases from fermented broth by PEG/citrate aqueous two-phase system. Chem. Eng. Process. Process Intensif. 2008, 47, 716–721. [Google Scholar] [CrossRef]
- Wysoczanska, K.; Do, H.T.; Held, C.; Sadowski, G.; Macedo, E.A. Effect of different organic salts on amino acids partition behaviour in PEG-salt ATPS. Fluid Phase Equilib. 2018, 456, 84–91. [Google Scholar] [CrossRef]
- Reschke, T.; Brandenbusch, C.; Sadowski, G. Modeling aqueous two-phase systems: III. Polymers and organic salts as ATPS former. Fluid Phase Equilib. 2015, 387, 178–189. [Google Scholar] [CrossRef]
- Ben Braïek, O.; Smaoui, S. Chemistry, safety, and challenges of the use of organic acids and their derivative salts in meat preservation. J. Food Qual. 2021, 2021, 6653190. [Google Scholar] [CrossRef]
- Costa, F.M.; Saraiva, M.L.M.; Passos, M.L. Ionic liquids and organic salts with antimicrobial activity as a strategy against resistant microorganisms. J. Mol. Liq. 2022, 368, 120750. [Google Scholar] [CrossRef]
- Bates, M.; Lunt, R.R. Organic salt photovoltaics. Sustain. Energy Fuels 2017, 1, 955–968. [Google Scholar] [CrossRef]
- Dou, J.; Ma, Y.; Niu, X.; Zhou, W.; Wei, X.; Dou, J.; Cui, Z.; Song, Q.; Song, T.; Zhou, H. Vacancy healing for stable perovskite solar cells via bifunctional potassium tartrate. J. Energy Chem. 2024, 88, 64–70. [Google Scholar] [CrossRef]
- Duarte, M.P.; Naccache, R. Exploiting the potential of calcined sodium citrate as a novel and efficient heterogeneous catalyst for biodiesel synthesis. Catal. Sci. Technol. 2024, 14, 3864–3877. [Google Scholar] [CrossRef]
- Tang, H.; Luo, C.; Lu, H.; Wu, K.; Liu, Y.; Zhu, Y.; Wang, B.; Liang, B. Readily available, biocompatible sodium citrate catalyst for efficient glycerol carbonate production through transesterification of glycerol and ethylene carbonate. Chem. Eng. J. 2024, 481, 148552. [Google Scholar] [CrossRef]
- Fraga, C.G.; Croft, K.D.; Kennedy, D.O.; Tomás-Barberán, F.A. The effects of polyphenols and other bioactives on human health. Food Funct. 2019, 10, 514–528. [Google Scholar] [CrossRef] [PubMed]
- Tresserra-Rimbau, A. Dietary Polyphenols and Human Health. Nutrients 2020, 12, 2893. [Google Scholar] [CrossRef]
- Olthof, M.R.; Katan, M.B.; Hollman, P.C. Chlorogenic acid and caffeic acid are absorbed in humans. J. Nutr. 2001, 131, 66–71. [Google Scholar] [CrossRef]
- Clifford, M.N.; Jaganath, I.B.; Ludwig, I.A.; Crozier, A. Chlorogenic acids and the acyl-quinic acids: Discovery, biosynthesis, bioavailability and bioactivity. Nat. Prod. Rep. 2017, 34, 1391–1421. [Google Scholar] [CrossRef] [PubMed]
- Bhandarkar, N.S.; Brown, L.; Panchal, S.K. Chlorogenic acid attenuates high-carbohydrate, high-fat diet–induced cardiovascular, liver, and metabolic changes in rats. Nutr. Res. 2019, 62, 78–88. [Google Scholar] [CrossRef] [PubMed]
- Heitman, E.; Ingram, D.K. Cognitive and neuroprotective effects of chlorogenic acid. Nutr. Neurosci. 2017, 20, 32–39. [Google Scholar] [CrossRef]
- Nabavi, S.F.; Tejada, S.; Setzer, W.N.; Gortzi, O.; Sureda, A.; Braidy, N.; Daglia, M.; Manayi, A.; Nabavi, S.M. Chlorogenic acid and mental diseases: From chemistry to medicine. Curr. Neuropharmacol. 2017, 15, 471. [Google Scholar] [CrossRef]
- Kumar, N.; Pruthi, V. Potential applications of ferulic acid from natural sources. Biotechnol. Rep. 2014, 4, 86–93. [Google Scholar] [CrossRef]
- Ou, S.; Kwok, K.C. Ferulic acid: Pharmaceutical functions, preparation and applications in foods. J. Sci. Food Agric. 2004, 84, 1261–1269. [Google Scholar] [CrossRef]
- Huang, Q.; Jiang, F.; Shuai, L.; Zhao, C. Synthetic lignin derived from ferulic acid for UV-blocking sunscreen. Int. J. Biol. Macromol. 2024, 283, 137694. [Google Scholar] [CrossRef]
- Karademir, Y.; Mackie, A.; Tuohy, K.; Dye, L. Effects of Ferulic Acid on Cognitive Function: A Systematic Review. Mol. Nutr. Food Res. 2024, 68, 2300526. [Google Scholar] [CrossRef]
- Burns, J.; Yokota, T.; Ashihara, H.; Lean, M.E.J.; Crozier, A. Plant Foods and Herbal Sources of Resveratrol. J. Agric. Food Chem. 2002, 50, 3337–3340. [Google Scholar] [CrossRef]
- Salehi, B.; Mishra, A.P.; Nigam, M.; Sener, B.; Kilic, M.; Sharifi-Rad, M.; Fokou, P.V.T.; Martins, N.; Sharifi-Rad, J. Resveratrol: A Double-Edged Sword in Health Benefits. Biomedicines 2018, 6, 91. [Google Scholar] [CrossRef] [PubMed]
- Bonnefont-Rousselot, D. Resveratrol and Cardiovascular Diseases. Nutrients 2016, 8, 250. [Google Scholar] [CrossRef]
- Malyshev, D.; Öberg, R.; Landström, L.; Andersson, P.O.; Dahlberg, T.; Andersson, M. pH-induced changes in Raman, UV–vis absorbance, and fluorescence spectra of dipicolinic acid (DPA). Spectrochim. Acta Part A 2022, 271, 120869. [Google Scholar] [CrossRef]
- Hostnik, G.; Tošović, J.; Štumpf, S.; Petek, A.; Bren, U. The influence of pH on UV/Vis spectra of gallic and ellagic acid: A combined experimental and computational study. Spectrochim. Acta Part A 2022, 267, 120472. [Google Scholar] [CrossRef]
- Velho, P.; Oliveira, I.; Gómez, E.; Macedo, E.A. pH Study and Partition of Riboflavin in an Ethyl Lactate-Based Aqueous Two-Phase System with Sodium Citrate. J. Chem. Eng. Data 2022, 67, 1985–1993. [Google Scholar] [CrossRef]
- Velho, P.; Perestrelo, G.; Macedo, E.A. Partition of Chlorogenic and Nicotinic Acids Using Eco-Friendly ATPSs Containing Ethyl Lactate at 298.15 K and 0.1 MPa. J. Chem. Eng. Data 2024, 69, 3075–3084. [Google Scholar] [CrossRef]
- Velho, P.; Rebelo, C.S.; Macedo, E.A. Extraction of Gallic Acid and Ferulic Acid for Application in Hair Supplements. Molecules 2023, 28, 2369. [Google Scholar] [CrossRef]
- Rebelo, C.S.; Velho, P.; Macedo, E.A. Partition Studies of Resveratrol in Low-Impact ATPS for Food Supplementation. Ind. Eng. Chem. Res. 2024, 63, 2885–2894. [Google Scholar] [CrossRef]
- Gómez, E.; Requejo, P.F.; Tojo, E.; Macedo, E.A. Recovery of flavonoids using novel biodegradable choline amino acids ionic liquids based ATPS. Fluid Phase Equilib. 2019, 493, 1–9. [Google Scholar] [CrossRef]
- Perestrelo, G.; Velho, P.; Macedo, E.A. Recovery of biomolecules in sustainable ATPSs (298.15 K) and solubility determination in pure water and ethyl lactate (283.15, 298.15 and 313.15 K). Sep. Purif. Technol. 2025, 360, 130987. [Google Scholar] [CrossRef]
- Maegawa, Y.; Sugino, K.; Sakurai, H. Identification of free radical species derived from caffeic acid and related polyphenols. Free Radic. Res. 2007, 41, 110–119. [Google Scholar] [CrossRef] [PubMed]
- Borges, F.; Lima, J.L.F.C.; Pinto, I.; Reis, S.; Siquet, C. Application of a Potentiometric System with Data-Analysis Computer Programs to the Quantification of Metal-Chelating Activity of Two Natural Antioxidants: Caffeic Acid and Ferulic Acid. Helv. Chim. Acta 2003, 86, 3081–3087. [Google Scholar] [CrossRef]
- Brittes, J.; Lúcio, M.; Nunes, C.; Lima, J.L.F.C.; Reis, S. Effects of resveratrol on membrane biophysical properties: Relevance for its pharmacological effects. Chem. Phys. Lipids 2010, 163, 747–754. [Google Scholar] [CrossRef] [PubMed]
- Pereira, J.F.B.; Coutinho, J.A.P. Aqueous two-phase systems. In Liquid-Phase Extraction; Elsevier: Amsterdam, The Netherlands, 2020; pp. 157–182. [Google Scholar] [CrossRef]
- Anggraeni, V.S.; Lee, H.C.; Sutrisna, P.D.; Chan, E.W.C.; Wong, C.W. Efficient recovery of allylpyrocatechol from Piper betle using alcohol/salt aqueous two-phase system (ATPS). Process Biochem. 2024, 144, 79–88. [Google Scholar] [CrossRef]
- Xu, S.; Zhu, Q.; Xu, S.; Yuan, M.; Lin, X.; Lin, W.; Qin, Y.; Li, Y. The phase behavior of n-ethylpyridinium tetrafluoroborate and sodium-based salts ATPS and its application in 2-chlorophenol extraction. Chin. J. Chem. Eng. 2021, 33, 76–82. [Google Scholar] [CrossRef]
- Rebelo, C.S.; Velho, P.; Macedo, E.A. eNRTL modelling and partition of phenolics in the ATPSs {ethyl lactate (1) + potassium sodium tartrate or disodium succinate (2) + water (3)} at 298.2 K and 0.1 MPa. Fluid Phase Equilib. 2024, 582, 114087. [Google Scholar] [CrossRef]

| Chemical | Supplier | Purity/% a | CAS | Abbreviation |
|---|---|---|---|---|
| Acetic acid () | Merck | >99.8 | 64-19-7 | - |
| Chlorogenic acid () | Apollo Scientific | >98.0 | 327-97-9 | CA |
| Disodium L(+)-tartrate dihydrate () | VWR Chemicals | >99.9 | 6106-24-7 | Na2Tartrate |
| Disodium succinate hexahydrate (·) | Tokyo Chemical Industry | >95.0 | 6106-21-4 | Na2Succinate |
| Ethanol () | Sigma-Aldrich | >99.0 | 64-17-5 | - |
| (-)-ethyl L-lactate () | Sigma-Aldrich | >98.0 | 97-64-3 | EL |
| Ferulic acid () | Sigma-Aldrich | >99.0 | 537-98-4 | FA |
| Purified water () | VWR chemicals | b | 7732-18-5 | - |
| Resveratrol () | Tokyo Chemical Industry | >99.0 | 501-36-0 | RV |
| Sodium hydroxide () | Merck | >99.0 | 1310-73-2 | - |
| No. TL | Feed | Top Phase | Bottom Phase | TLL/% | |||||
|---|---|---|---|---|---|---|---|---|---|
| pH | pH | ||||||||
| {EL (1) + Na2Succinate (2) + Water (3)} [20] | |||||||||
| TL1 | 0.280 | 0.126 | 0.602 | 0.030 | 7.25 | 0.189 | 0.153 | 7.25 | 43.10 |
| TL2 | 0.300 | 0.130 | 0.687 | 0.019 | 7.45 | 0.145 | 0.174 | 7.37 | 56.40 |
| TL3 | 0.320 | 0.135 | 0.742 | 0.014 | 7.37 | 0.106 | 0.196 | 7.34 | 66.20 |
| {EL (1) + Na2Tartrate (2) + Water (3)} [19] | |||||||||
| TL1 | 0.280 | 0.125 | 0.514 | 0.037 | 6.18 | 0.155 | 0.170 | 6.10 | 38.33 |
| TL2 | 0.300 | 0.130 | 0.575 | 0.027 | 6.13 | 0.116 | 0.198 | 6.17 | 49.02 |
| TL3 | 0.325 | 0.133 | 0.631 | 0.020 | 6.13 | 0.090 | 0.223 | 6.18 | 57.82 |
| TL4 | 0.355 | 0.138 | 0.689 | 0.015 | 6.15 | 0.070 | 0.248 | 6.18 | 66.14 |
| TL5 | 0.380 | 0.140 | 0.724 | 0.013 | 6.11 | 0.060 | 0.262 | 6.17 | 70.90 |
| Tie-Line | Phase | /g | /% | /kg·m−3 | pH |
|---|---|---|---|---|---|
| CA in {EL (1) + Na2Succinate (2) + Water (3)} | |||||
| 1 | Top | 2.3287 | −0.47 | 1051.09 | 6.89 |
| Bottom | 7.6379 | 1119.96 | 7.05 | ||
| 2 | Top | 2.8385 | −0.34 | 1047.78 | 7.26 |
| Bottom | 7.1535 | 1133.28 | 7.09 | ||
| 3 | Top | 3.4070 | −0.52 | 1047.92 | 7.21 |
| Bottom | 6.5926 | 1144.22 | 7.09 | ||
| CA in {EL (1) + Na2Tartrate (2) + Water (3)} | |||||
| 1 | Top | 2.9069 | −0.40 | 1058.71 | 5.87 |
| Bottom | 7.0442 | 1128.28 | 5.81 | ||
| 2 | Top | 3.8477 | −0.36 | 1051.34 | 5.78 |
| Bottom | 6.1117 | 1149.91 | 5.86 | ||
| 3 | Top | 4.3057 | −0.56 | 1049.28 | 5.75 |
| Bottom | 5.6142 | 1166.07 | 5.92 | ||
| 4 | Top | 4.7111 | −0.51 | 1045.32 | 5.93 |
| Bottom | 5.1963 | 1189.52 | 5.87 | ||
| 5 | Top | 5.1467 | −0.42 | 1045.99 | 5.86 |
| Bottom | 4.8005 | 1197.33 | 5.90 | ||
| FA in {EL (1) + Na2Tartrate (2) + Water (3)} | |||||
| 1 | Top | 3.1550 | −0.49 | 1059.54 | 5.72 |
| Bottom | 6.7898 | 1129.98 | 5.91 | ||
| 2 | Top | 3.7805 | −0.46 | 1053.15 | 5.84 |
| Bottom | 6.1624 | 1150.08 | 5.84 | ||
| 3 | Top | 4.2549 | −0.51 | 1048.09 | 5.80 |
| Bottom | 5.6572 | 1167.13 | 5.82 | ||
| 4 | Top | 4.6796 | −0.39 | 1045.49 | 5.74 |
| Bottom | 5.2509 | 1189.72 | 5.84 | ||
| 5 | Top | 4.9603 | −0.37 | 1044.86 | 5.93 |
| Bottom | 4.9714 | 1200.81 | 5.93 | ||
| RV in {EL (1) + Na2Tartrate (2) + Water (3)} | |||||
| 1 | Top | 3.4302 | −0.57 | 1059.76 | 5.99 |
| Bottom | 6.4994 | 1130.21 | 5.97 | ||
| 2 | Top | 3.8123 | −0.52 | 1053.09 | 5.87 |
| Bottom | 6.1189 | 1147.94 | 5.99 | ||
| 3 | Top | 4.2850 | −0.53 | 1048.92 | 5.74 |
| Bottom | 5.6554 | 1165.93 | 5.96 | ||
| 4 | Top | 4.6785 | −0.57 | 1045.44 | 5.91 |
| Bottom | 5.2499 | 1188.93 | 6.11 | ||
| 5 | Top | 5.0137 | −0.43 | 1044.30 | 5.96 |
| Bottom | 4.9371 | 1205.12 | 6.09 | ||
| Tie-Line | TLL/% | Phase | /% | /% | ||
|---|---|---|---|---|---|---|
| CA in {EL (1) + Na2Succinate (2) + Water (3)} | ||||||
| 1 | 43.10 | Top | 7.54 × 10⁻⁵ | −2.86 | 2.22 ± 0.05 | 40.7 ± 0.2 |
| Bottom | 3.40 × 10⁻⁵ | |||||
| 2 | 56.40 | Top | 7.59 × 10⁻⁵ | −4.42 | 2.53 ± 0.07 | 49.8 ± 0.3 |
| Bottom | 3.00 × 10⁻⁵ | |||||
| 3 | 66.20 | Top | 7.28 × 10⁻⁵ | −4.50 | 2.79 ± 0.08 | 58.4 ± 0.4 |
| Bottom | 2.60 × 10⁻⁵ | |||||
| CA in {EL (1) + Na2Tartrate (2) + Water (3)} | ||||||
| 1 | 38.33 | Top | 8.12 × 10⁻⁵ | −3.72 | 2.97 ± 0.08 | 54.5 ± 0.3 |
| Bottom | 2.73 × 10⁻⁵ | |||||
| 2 | 49.02 | Top | 8.22 × 10⁻⁵ | −3.00 | 4.7 ± 0.2 | 74.2 ± 0.6 |
| Bottom | 1.74 × 10⁻⁵ | |||||
| 3 | 57.82 | Top | 7.99 × 10⁻⁵ | −3.42 | 6.5 ± 0.4 | 81.7 ± 0.7 |
| Bottom | 1.24 × 10⁻⁵ | |||||
| 4 | 66.14 | Top | 7.91 × 10⁻⁵ | −2.90 | 10 ± 1 | 88.6 ± 0.8 |
| Bottom | 7.80 × 10⁻⁶ | |||||
| 5 | 70.90 | Top | 7.62 × 10⁻⁵ | −2.10 | 12 ± 2 | 91.9 ± 0.9 |
| Bottom | 6.10 × 10⁻⁶ | |||||
| FA in {EL (1) + Na2Tartrate (2) + Water (3)} | ||||||
| 1 | 38.33 | Top | 5.53 × 10⁻⁵ | −2.02 | 3.8 ± 0.3 | 64.0 ± 0.5 |
| Bottom | 1.46 × 10⁻⁵ | |||||
| 2 | 49.02 | Top | 5.65 × 10⁻⁵ | −2.14 | 6.5 ± 0.7 | 79.7 ± 0.7 |
| Bottom | 8.64 × 10⁻⁶ | |||||
| 3 | 57.82 | Top | 5.53 × 10⁻⁵ | −2.19 | 11 ± 2 | 87.8 ± 0.8 |
| Bottom | 5.26 × 10⁻⁶ | |||||
| 4 | 66.14 | Top | 5.28 × 10⁻⁵ | −1.93 | 16 ± 5 | 92.4 ± 0.9 |
| Bottom | 3.27 × 10⁻⁶ | |||||
| 5 | 70.90 | Top | 5.11 × 10⁻⁵ | −1.40 | 19 ± 6 | 94.2 ± 0.9 |
| Bottom | 2.76 × 10⁻⁶ | |||||
| RV in {EL (1) + Na2Tartrate (2) + Water (3)} | ||||||
| 1 | 38.33 | Top | 2.37 × 10⁻⁵ | −1.96 | 10 ± 2 | 83.34 ± 0.04 |
| Bottom | 2.35 × 10⁻⁶ | |||||
| 2 | 49.02 | Top | 2.21 × 10⁻⁵ | −2.16 | 12 ± 3 | 86.96 ± 0.04 |
| Bottom | 1.88 × 10⁻⁶ | |||||
| 3 | 57.82 | Top | 2.03 × 10⁻⁵ | −2.05 | 13 ± 3 | 89.51 ± 0.05 |
| Bottom | 1.61 × 10⁻⁶ | |||||
| 4 | 66.14 | Top | 1.86 × 10⁻⁵ | −2.35 | 14 ± 4 | 91.07 ± 0.05 |
| Bottom | 1.36 × 10⁻⁶ | |||||
| 5 | 70.90 | Top | 1.75 × 10⁻⁵ | −2.16 | 14 ± 4 | 92.26 ± 0.05 |
| Bottom | 1.24 × 10⁻⁶ | |||||
Disclaimer/Publisher’s Note: The statements, opinions and data contained in all publications are solely those of the individual author(s) and contributor(s) and not of MDPI and/or the editor(s). MDPI and/or the editor(s) disclaim responsibility for any injury to people or property resulting from any ideas, methods, instructions or products referred to in the content. |
© 2025 by the authors. Licensee MDPI, Basel, Switzerland. This article is an open access article distributed under the terms and conditions of the Creative Commons Attribution (CC BY) license (https://creativecommons.org/licenses/by/4.0/).
Share and Cite
Perestrelo, G.; Velho, P.; Macedo, E.A. Retrieval of Polyphenols Using Aqueous Two-Phase Systems Based on Ethyl Lactate and Organic Salts. Molecules 2025, 30, 1532. https://doi.org/10.3390/molecules30071532
Perestrelo G, Velho P, Macedo EA. Retrieval of Polyphenols Using Aqueous Two-Phase Systems Based on Ethyl Lactate and Organic Salts. Molecules. 2025; 30(7):1532. https://doi.org/10.3390/molecules30071532
Chicago/Turabian StylePerestrelo, Gonçalo, Pedro Velho, and Eugénia A. Macedo. 2025. "Retrieval of Polyphenols Using Aqueous Two-Phase Systems Based on Ethyl Lactate and Organic Salts" Molecules 30, no. 7: 1532. https://doi.org/10.3390/molecules30071532
APA StylePerestrelo, G., Velho, P., & Macedo, E. A. (2025). Retrieval of Polyphenols Using Aqueous Two-Phase Systems Based on Ethyl Lactate and Organic Salts. Molecules, 30(7), 1532. https://doi.org/10.3390/molecules30071532